Embed Size (px)
Citation preview

Computers and Electronics in Agriculture 50 (2006) 121–134
Plant species identification using Elliptic Fourierleaf shape analysis
Joao Camargo Netoa, George E. Meyerb,∗, David D. Jonesb, Ashok K. Samalc
a Embrapa Information Tecnology, Av. Andre Tosello 209, Cidade Universitaria “Zeferino Vaz”,P.O. Box 6041, Barao Geraldo, 13083-886 Campinas, SP, Brazil
b Biological Systems Engineering, 250 L.W. Chase Hall, University of Nebraska, Lincoln, NE 68583-0726, USAc Computer Science, University of Nebraska, Lincoln, NE 68583-0115, USA
Received 29 April 2005; received in revised form 7 September 2005; accepted 21 September 2005
Abstract
Elliptic Fourier (EF) and discriminant analyses were used to identify young soybean (Glycine max (L.) merrill), sunflower(Helianthus pumilus), redroot pigweed (Amaranthus retroflexus) and velvetleaf (Abutilon theophrasti Medicus) plants, based onleaf shape. Chain encoded, Elliptic Fourier harmonic functions were generated based on leaf boundary. A complexity index of theleaf shape was computed using the variation between consecutive EF functions. Principle component analysis was used to select theFourier coefficients with the best discriminatory power. Canonical discriminant analysis was used to develop species identificationmodels based on leaf shapes extracted from plant color images during the second and third weeks after germination. The classificationresults showed that plant species during the third week were successfully identified with an average of correct classification rate of89.4%. The discriminant model correctly classified on average: 77.9% of redroot pigweed, 93.8% of sunflower, 89.4% of velvetleafand 96.5% of soybean. Using all of the leaves extracted from the second and the third weeks, the overall classification accuracy was89.2%. The discriminant model correctly classified 76.4% of redroot pigweed, 93.6% of sunflower, 81.6% of velvetleaf, 91.5% ofsoybean leaf extracted from trifoliolate and 90.9% of soybean unifoliolate leaves. The Elliptic Fourier shape feature analysis couldbe an important and accurate tool for weed species identification and mapping.© 2005 Elsevier B.V. All rights reserved.
Keywords: Elliptic Fourier; Discriminant analysis; Leaves; Machine vision; Shape features
1. Introduction
Site-specific weed control and herbicide application using machine vision or remote sensing has been the focusof many recent studies. Spot control of weeds has the potential to reduce the amount of chemicals applied by asmuch as 80% for improved farm profitability and water quality (Timmermann et al., 2003). Weed scientists havetraditionally used manual scouting for botanically identifying weed species and mapping populations (Manley et al.,2001). They have also considered automated methods for species identification (Medlin et al., 2000). Automated speciesidentification would assist scientists and growers to track the growth and development of young weeds, which couldhelp to determine when to apply herbicides. The best time to apply post-emergent herbicide is defined as the criticaltime when weeds must be controlled to prevent crop yield losses (Knezevic et al., 2002). The critical time depends
∗ Corresponding author. Tel.: +1 402 4723377; fax: +1 402 4726338.E-mail address: [email protected] (G.E. Meyer).
0168-1699/$ – see front matter © 2005 Elsevier B.V. All rights reserved.doi:10.1016/j.compag.2005.09.004
122 J.C. Neto et al. / Computers and Electronics in Agriculture 50 (2006) 121–134
on crop cultivar, weed species, environmental conditions, plant density and timing of weed competition (Zimdahl,1988).
Canopy structure and leaf shape have been key features for plant species identification by weed specialists. Machinevision and shape feature analysis is usually the final step of a process that includes identifying green plant regions ofinterest and then isolating individual plant canopy crowns (Meyer et al., 2004a). For accurate species identification, oneneeds to extract and analyze individual leaves or leaflets (Camargo Neto, 2004). Kincaid and Schneider (1983)first usednormalized Fourier coefficients, a complexity index (based on frequencies of Fourier coefficients), and a dissectionindex (roundness) to approximate leaflet shape.Guyer et al. (1986)studied four classical shape features for leaves fromeight species of plants grown in containers. Species identification errors were reported as low as 9%. In a follow-upstudy,Guyer et al. (1993)investigated 17 quantitative shape features to classify 8 different plant species (soybean,milkweed, dandelion, jimsonweed, velvetleaf, giant morning glory, ragweed and foxtail). A mean correct identificationrate of 69% was reported using a leaflet database of only 40 images.Petry and Kuhbauch (1989)found that leaf shapeparameters with five canonical indices were statistically different for several weed species.Franz et al. (1991a)identifiedwhole and occluded leaves of velvetleaf, ivy leaf, morning glory, giant foxtail and soybean using a leaf shape curvatureand Fourier–Mellin correlation method at two stages of growth. When testing 124 samples, 73.4% of the leaves werecorrectly identified, 11.3% were matched incorrectly and 15.3% were rejected because of insufficient data. Canopyshape features as opposed to individual leaf features were used to distinguish monocotyledonous from dicotyledonousweeds byWoebbecke et al. (1995). The first invariant moment and aspect features distinguished monocotyledon fromdicotyledonous canopies with correct classification rates from 60 to 90%.
Franz et al. (1991b)also studied a set of leaf spectral features (mean, variance, skewness, kurtosis, computed fromspectral wavebands of red, green, blue and near infrared) to discriminate leaf types of soybean unifoliolates, ivy leaf,morning glory cotyledons, velvetleaf cotyledons, foxtail, first true leaves of ivy, morning glory and first true leavesof velvetleaf. The species identification error rate was 24.2%, when leaf orientation was not considered. When leaforientation was considered, the species error rate decreased to 18%. The method tended to fail for leaves rotated morethan 30◦ perpendicular to the petiole axis. The method only worked reasonably well, if 80% of the leaf boundary wasexposed. These results suggest looking for whole or fully exposed leaves in plant canopies.Manh et al. (2001)proposeda template method to locate edges of leaves based on a deformable skeleton and leaf color. They reported a correctidentification rate of 84% for green foxtail using 600 individual leaves from 40 images.Chi et al. (2002)presenteda leaf species identification model using Bezier curves to discriminate four types of vegetable seedlings (cabbage,Chinese mustard, lettuce and edible amaranthus). The Bezier curves were approximations of the leaflet boundary, withendpoints defined by the leaf base and apex. They reported a correct classification rate of 95.1%, when applying theBezier coefficients to a back propagation neural network. It was found that this accuracy depended upon the leaf baseand apex, which defined the Bezier endpoints.
Oide and Ninomiya (2000)used the Elliptic Fourier (EF) method to classify soybean varieties, using a normalizedleaf shape. The EF method using a chain-coded, closed-contour, invariant to scale, translation and rotation was firstintroduced byKuhl and Giardina (1982). EF has been used in recent studies to describe the shape of objects.Innes andBates (1999)used an Elliptical Fourier descriptor to demonstrate an association between genotype and morphology ofshells.Chen et al. (2000)used Elliptic Fourier descriptors to describing shape changes in the human mandible for maleand female at different ages.McLellan and Endler (1998)compared several morphometric methods for describingcomplex shapes. They found that 20 harmonics of the Elliptic Fourier method accurately depicted shapes ofAcersaccharinum, Acer saccharum andAcer palmatum leaves. Most methods previously investigated ignore leaf serration.Leaf serration or edgeness is an important morphologic feature used for identifying plant species. For example, thecurvature functions developed byFranz et al. (1991b)were found generally inadequate where leaflet serration wasquite pronounced.
The EF method apparently provides an excellent and accurate graphical rendition of the edges and shapes ofindividual segmented or isolated leaves. The main problem in using EF has been how to use its large coefficient matrixfor object identification. Obviously, machine vision operations that precede leaf shape feature analysis may affectthe usefulness of these methods for precision agriculture. We will assume that those machine vision operations areavailable, (Camargo Neto, 2004). In this study, we therefore focus on the EF shape feature method for weed and cropspecies identification. The objectives of this study were to (a) develop a size and rotation invariant shape feature methodfor identifying young plants such as soybean (Glycine max (L.) merrill) and common weeds and (b) to determine thebest time after emergence to identify these plant species.

J.C. Neto et al. / Computers and Electronics in Agriculture 50 (2006) 121–134 123
Table 1Total number of hand extracted leaves by species
Plant species Week Total
Second Third
Sunflower 44 81 125Redroot pig weed 41 99 140Soybean 45 58 103Velvetleaf 49 93 142
Total 179 331 510
2. Materials and methods
2.1. Image acquisition
Color digital images were taken using a DC120 digital camera (Kodak Digital Science Rochester, NY) of individualplants of soybean (G. max (L.) merrill), sunflower (Helianthus pumilus), redroot pigweed (Amaranthus retroflexus) andvelvetleaf (Abutilon theophrasti Medicus) under natural lighting conditions around noon, during the first 3 weeks aftergermination. The camera was set to automatic exposure and focus, mounted overhead or nadir at 1 m above the plantcontainers, and with light behind the camera, such that no shadows were imposed on the leaves. An image resolution of1280× 960 pixels was used, which translated into 2 pixels per mm. Images were downloaded using the Kodak DC120TWAIN interface® and stored asjpegs. These images are part of the Hindman plant set of 681 images (Hindman, 2001;Meyer et al., 2004a,b).
Individual leaves and trifoliolate leaflets were accurately segmented from the canopy images, visually and by mousewith Adobe®Photoshop®5.0 LE. This resulted in one individual whole leaflet per sub image. In general, plant specieswith real leaves were quite recognizable by visual inspection of the photographs. A few whole leaves were slightlyrotated away from the camera lens, but most appeared parallel to the lens. A total of 510 individual leaves or leafletswere hand extracted from the Hindman image set, for the second and third weeks after germination (Table 1).
Soybean leaf sub images were divided into two categories representing cotyledon (VC soybean) and first trifoliolate(V1 soybean) growth stages. During the second week, the soybean presented fully expanded unifoliolate leaves, asshown inFig. 1a. By the third week, the first trifoliolate leaflet was fully expanded, as shown inFig. 1b. No leaveswere used from the first week after germination, since all newly emerged plants showed cotyledons with very similarshapes. Cotyledons or leaves of the first week after germination are not considered as the critical period for weedcontrol decisions (Knezevic et al., 2002; Zimdahl, 1988).
2.2. Leaf shape features analysis
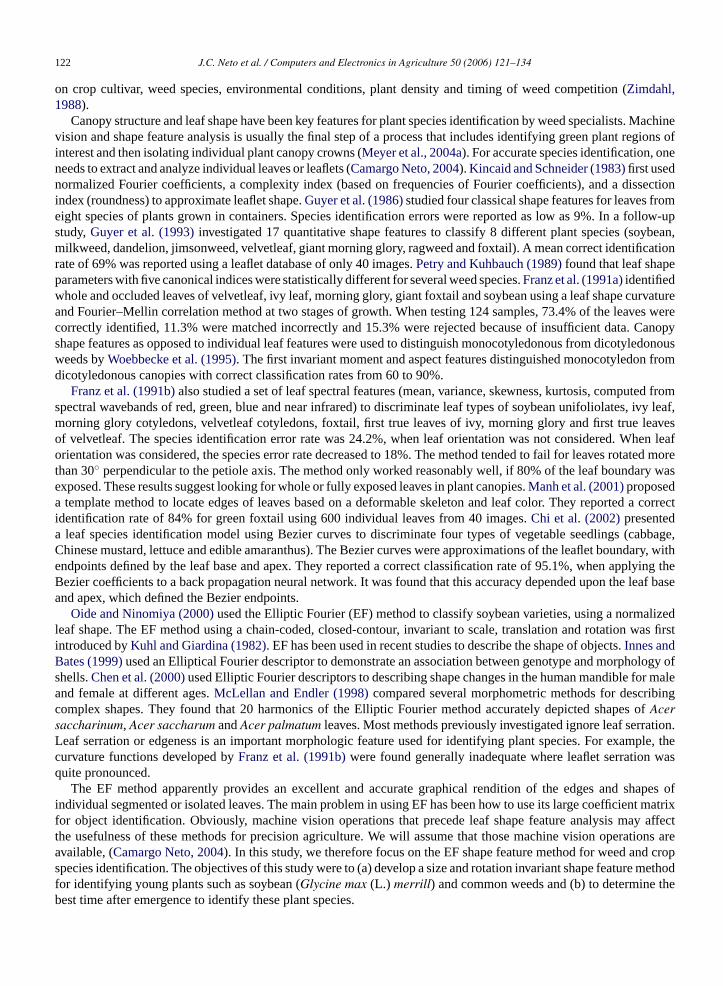
The edges of each leaflet in the sub images were binarized according to standard procedures reported byCamargoNeto (2004). Leaf shape was then modeled using normalized Elliptic Fourier descriptors of a closed-contour of theleaflet edge (Kuhl and Giardina, 1982). The closed-contour was defined with differential chain code, represented as asequence of vectors of unit length and directional coding as shown by an example inFig. 2. Individual leaf boundary
Fig. 1. (a) Unifoliolate soybean (Glycine max (L.) merrill) leaflet (VC, cotyledon stage) and (b) soybean trifoliolate leaflet (V1, first trifoliolate).
124 J.C. Neto et al. / Computers and Electronics in Agriculture 50 (2006) 121–134
Fig. 2. (a) Binary pixel and shape pattern. (b) Differential chain code sequence starting in upper left hand corner (eight connected grids).
pixels were used to describe the chain code, starting with the upper left pixel of the contour and tracing the boundaryclockwise. The chain code enumeration was completed when the original starting point was reached.
Using the chain code, a truncated Fourier series expansion of the closed-contour which is a projection on thex andy axes was obtained, given as:
xN (t) = A0 +N∑n=1
an cos
(2nπt
T
)+ bn sin
(2nπt
T
)(1)
yN (t) = C0 +N∑n=1
cn cos
(2nπt
T
)+ dn sin
(2nπt
T
)(2)
wheret is the step required to traverse 1 pixel along the closed-contour, such thattp−1 < t < tp for code values ofp,within the range of 1≤ p ≤ k andk is the total number of codes describing the boundary contour.n is the numberof Fourier harmonics required to generate the approximation of the boundary (each harmonic has four coefficients).T is the basic period of the chain code, or steps needed to traverse the entire contour,T = tk. A0 andC0 are the biascoefficients, corresponding to a frequency of 0. These coefficients are related to image translation andN is the totalnumber of EF harmonics needed to generate an accurate approximation of the boundary.
For each harmonic, thenth set of four harmonic coefficientsan, bn, cn anddn was defined as:
an = T
2n2π2
K∑p=1
�xp
�tp
[cos
(2nπtpT
)− cos
(2nπtp−1
T
)], (3)
bn = T
2n2π2
K∑p=1
�xp
�tp
[sin
(2nπtpT
)− sin
(2nπtp−1
T
)], (4)
cn = T
2n2π2
K∑p=1
�yp
�tp
[cos
(2nπtpT
)− cos
(2nπtp−1
T
)], (5)
dn = T
2n2π2
K∑p=1
�yp
�tp
[sin
(2nπtpT
)− sin
(2nπtp−1
T
)], (6)
wheretp is the number of steps required to traverse the firstp components or links of the chain code.�xp and�yp arethe spatial changes in thex andy projections of the chain code, respectively, at linkp. These values may be 1, 0 or−1depending on the orientation of linkp.�tp is the step change required to traverse linkp of the chain code.
Fig. 3shows a non-normalized EF approximation to the shape of a velvetleaf using the set of coefficientsan, bn, cn
anddn, generated with the 1st, 4th, 8th, 16th and 30th harmonics. The non-normalized and normalized EF coefficientvalues for the 16 sets of harmonics for the velvetleaf closed-contour are shown inTables 2 and 3, respectively.

J.C. Neto et al. / Computers and Electronics in Agriculture 50 (2006) 121–134 125
Fig. 3. Elliptic Fourier shape approximations for velvetleaf (Abutilon theophrasti Medicus) (a) original leaf image, (b) 1st EF harmonic, (c)1st + 2nd + 3rd + 4th EF, (d) 1st +· · · + 8th EF harmonics, (e) 1st +· · · + 16th EF harmonics and (f) 1st +· · · + 30th EF harmonics.
Table 2Sample non-normalized Elliptic Fourier coefficients for velvetleafa
Harmonic number Fourier coefficient value
a b c d
1 10.5216 185.9722 184.3727 −20.46502 −10.5959 4.1591 −10.6389 0.42253 −4.3226 7.8789 −2.5729 6.77954 8.4663 0.3244 −5.5601 4.45895 2.2916 −3.3906 1.8603 1.57736 −2.8998 −4.5531 2.9643 4.50557 −0.6946 0.3600 2.1388 −1.27718 −2.3432 2.1866 1.8762 −1.84039 0.5892 −0.2586 0.0889 −0.1551
10 1.1117 0.9109 −1.0565 −1.518711 −0.3360 0.1537 0.2449 0.374612 0.9690 −1.1446 −1.7818 0.712213 −0.2377 −0.0413 0.1890 0.171014 −1.2316 −0.4128 0.5999 0.730215 0.2016 0.0895 0.1991 −0.450216 0.4839 0.4086 0.3383 −0.4756
a First 16 harmonics out of a possible 30.

126 J.C. Neto et al. / Computers and Electronics in Agriculture 50 (2006) 121–134
Table 3Sample normalized Elliptic Fourier coefficients for velvetleafa
Harmonic number Fourier coefficient value
a b c d
1 1.0000b 0.0000 0.0000 −0.94722 −0.0134 −0.0062 0.0030 −0.08033 −0.0043 0.0086 −0.0010 0.05974 −0.0531 −0.0115 0.0008 −0.02035 0.0187 −0.0012 0.0086 0.01406 −0.0395 −0.0062 0.0015 −0.00017 0.0107 −0.0053 −0.0060 0.00328 −0.0212 −0.0045 −0.0012 −0.00059 0.0002 −0.0020 −0.0007 −0.0028
10 −0.0106 −0.0056 0.0010 0.002411 −0.0015 −0.0018 −0.0013 0.001612 −0.0080 −0.0092 −0.0009 0.003513 0.0017 −0.0006 −0.0003 −0.000414 −0.0063 −0.0050 −0.0022 0.001115 0.0016 −0.0010 −0.0020 −0.000616 −0.0033 −0.0006 −0.0008 0.0030
a First 16 harmonics out of a possible 30.b Corrected for leaf orientation and size using the first set of harmonic coefficients (seeFig. 4).
Shape descriptions need to be invariant with rotation, size, translation and starting point on the contour, if they aregoing to be useful for any size leaf. These are also important if the leaf shape is used as a template for texture analysis.Leaf venation and texture will be also subject to leaf orientation, size and scan direction (Camargo Neto, 2004). Thenormalization of sample velvet leaf EF coefficients shown inTable 2was achieved by applying a spatial rotation factorθ1, which is defined as the angle between the starting point and the first semi-major axis or the same counterclockwiserotation about the contour.θ1 was therefore defined as:
θ1 = 1
2arctan
[2(a1b1 + c1d1)
a21 + c2
1 − b21 − d2
1
]0 ≤ θ1 ≤ 2π (7)
wherea1, b1, c1 andd1 are the first set of harmonic coefficients.A rotational transformation matrix usingθ1 (radians) was then applied to all of the harmonic coefficients to provide
a new set for the standard leaf orientation, which is given as:[a∗n c∗nb∗n d∗
n
]=
[cosθ1 sinθ1
− sinθ1 cosθ1
] [an cn
bn dn
](8)
After a starting point correction, a rotation invariant normalization operation was next performed. The semi-majoraxis of the first harmonic was rotated by angleψ1 until it was parallel to the positivex-axis of the first quadrant. Therotation angleψ1 was defined using the elliptic locus coordinates of the first point, given as:
x∗1(t∗) = a∗
1 cos
(2πt∗
T
)+ b∗
1 sin
(2πt∗
T
), (9)
y∗1(t∗) = c∗1 cos
(2πt∗
T
)+ d∗
1 sin
(2πt∗
T
)(10)
Considering that the first harmonic phasor can be aligned with the semi-major axis at the first point,t* = 0, therotational angleψ1 can be obtained as:
ψ1 = arctan
[y∗
1(0)
x∗1(0)
]= arctan
(c∗1a∗
1
), where 0≤ ψ1 < 2π (11)
J.C. Neto et al. / Computers and Electronics in Agriculture 50 (2006) 121–134 127
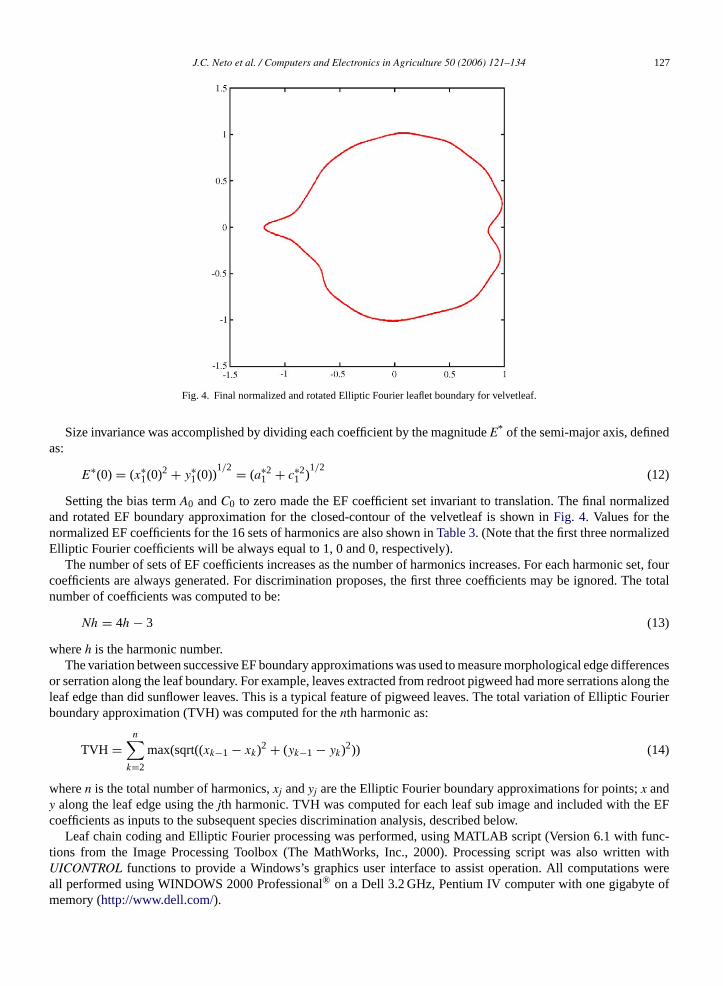
Fig. 4. Final normalized and rotated Elliptic Fourier leaflet boundary for velvetleaf.
Size invariance was accomplished by dividing each coefficient by the magnitudeE* of the semi-major axis, definedas:
E∗(0) = (x∗1(0)2 + y∗
1(0))1/2 = (a∗2
1 + c∗21 )
1/2(12)
Setting the bias termA0 andC0 to zero made the EF coefficient set invariant to translation. The final normalizedand rotated EF boundary approximation for the closed-contour of the velvetleaf is shown inFig. 4. Values for thenormalized EF coefficients for the 16 sets of harmonics are also shown inTable 3. (Note that the first three normalizedElliptic Fourier coefficients will be always equal to 1, 0 and 0, respectively).
The number of sets of EF coefficients increases as the number of harmonics increases. For each harmonic set, fourcoefficients are always generated. For discrimination proposes, the first three coefficients may be ignored. The totalnumber of coefficients was computed to be:
Nh = 4h− 3 (13)
whereh is the harmonic number.The variation between successive EF boundary approximations was used to measure morphological edge differences
or serration along the leaf boundary. For example, leaves extracted from redroot pigweed had more serrations along theleaf edge than did sunflower leaves. This is a typical feature of pigweed leaves. The total variation of Elliptic Fourierboundary approximation (TVH) was computed for thenth harmonic as:
TVH =n∑k=2
max(sqrt((xk−1 − xk)2 + (yk−1 − yk)
2)) (14)
wheren is the total number of harmonics,xj andyj are the Elliptic Fourier boundary approximations for points;x andy along the leaf edge using thejth harmonic. TVH was computed for each leaf sub image and included with the EFcoefficients as inputs to the subsequent species discrimination analysis, described below.
Leaf chain coding and Elliptic Fourier processing was performed, using MATLAB script (Version 6.1 with func-tions from the Image Processing Toolbox (The MathWorks, Inc., 2000). Processing script was also written withUICONTROL functions to provide a Windows’s graphics user interface to assist operation. All computations wereall performed using WINDOWS 2000 Professional® on a Dell 3.2 GHz, Pentium IV computer with one gigabyte ofmemory (http://www.dell.com/).

128 J.C. Neto et al. / Computers and Electronics in Agriculture 50 (2006) 121–134
2.3. Statistical analyses
Normalized Elliptic Fourier coefficients were generated for the first 30 harmonics for all leaf samples and species.Next, stepwise discriminant analysis, PROC STEPDISC (Principle Component Analysis) from SAS® (SAS Institute,Cary, NC) was performed using all EF coefficients to produce reduced set with the best discriminatory power. Canonicalanalysis, PROC CANDISC, from SAS® was next performed using the reduced sets of coefficients to conduct a visualinterpretation of leaf-species group differences as cluster plots. Canonical analysis created linear species discriminationfunctions that combined all input features used and presented them as new canonical variables. Statistical analyseswere performed for the leaf data set described above to determine the best week to identify plant species, based onleaf shape. The second and third weeks were also analyzed together, because it is possible to have weeds with mixedstages of growth.
SAS species classification models were derived using training leaf images, which was then applied to a test images.To scientifically evaluate classification accuracy, the leaf image set was divided into groups for a five-fold cross-validation. For each experiment run, two files were held out as testing data and the remaining three were used astraining data. The cross-validation results were averaged to give a final plant species classification mean.
3. Results and discussion
In this study, at least one fully exposed leaflet was found in the Hindman plant images used. The leaflets extractedfrom the images appeared to be visually parallel to the camera lens plane. It was therefore assumed that orientationangle was relatively invariant. The leaf subimages were carefully extracted using Photoshop and then analyzed forshape using EF analysis. Misclassifications may have occurred as a result in slight variations in leaf plane orientation,which would have distorted the leaf shape. Otherwise, normalization with size invariance criteria and the first harmoniccoefficient should have taken care of the second but larger orientation angle.
3.1. Second week analyses
Initial training and testing results using all Elliptic Fourier coefficients obtained from the 30 harmonics, along withtotal variation of the EF boundary approximation (TVH) are shown in numerical form inTables 4 and 5. Error ratesfor this first SAS species discrimination model using all coefficients were fairly high ranging from 10.9 to 55.5%. This
Table 4Training data results using all Elliptic Fourier coefficients and cross-validation—second week after emergence
Species Mean percentage of leaves classified as
Pigweed Sunflower Soybean (VC) Velvetleaf Total
Pigweed 44.5 23.8 11.6 20.2 100.0Sunflower 14.9 81.7 3.5 0.0 100.0Soybean (VC) 9.5 5.6 80.5 4.5 100.0Velvetleaf 20.9 6.1 12.3 60.7 100.0
Error rates (%) 55.5 18.3 19.5 39.4 32.9
Table 5Test data classification results using all Elliptic Fourier coefficients and cross-validation—second week after emergence
Species Mean percentage of leaves classified as
Pigweed Sunflower Soybean (VC) Velvetleaf Total
Pigweed 46.7 16.7 12.2 24.4 100.0Sunflower 6.7 89.1 4.2 0.0 100.0Soybean (VC) 4.7 8.9 75.2 11.2 100.0Velvetleaf 16.0 8.2 16.0 59.8 100.0
Error rates (%) 53.3 10.9 24.9 40.2 32.1

J.C. Neto et al. / Computers and Electronics in Agriculture 50 (2006) 121–134 129
Fig. 5. Canonical analysis for the third week leaf image sets (V1 soybeans with trifoliolates).
Table 6Training data classification results using all Elliptic Fourier coefficients and cross-validation—second week after emergence
Species Mean percentage of leaves classified as
Pigweed Sunflower Soybean (VC) Velvetleaf Total
Pigweed 87.8 5.5 3.1 3.7 100.0Sunflower 1.1 98.9 0.0 0.0 100.0Soybean (VC) 1.1 0.6 97.7 0.6 100.0Velvetleaf 4.6 0.0 0.5 94.9 100.0
Error rates (%) 12.2 1.1 2.2 5.1 5
model had a relatively low overall correct classification performance of 32%. The model when applied to the test data,correctly identified 89% of sunflower leaves, 46% of redroot pigweed leaves, 75% of soybean leaves and 59% of thevelvetleaf. The low classification performance may be due to variations in leaflet orientation relative to the plane ofthe camera lens and subsequent shape distortion. Also, the EF method should have theoretically found a distinguishingleaflet edge characteristic (first harmonic) that would be located at the same position on similar leaves. Moreover, SAScanonical plotting inFig. 5does not always show all of the data points where misclassifications occurred.
Using the SAS STEPDISC procedure, screening of the coefficients was performed using principle componentanalysis. Overall classification accuracy was then improved, as shown inTables 6 and 7. Classification error rates of
Table 7Testing data classification results using selected Elliptic Fourier coefficients and cross-validation—second week after emergence
Species Mean percentage of leaves classified as
Pigweed Sunflower Soybean (VC) Velvetleaf Total
Pigweed 68.3 7.5 7.2 16.9 100.0Sunflower 4.7 95.3 0.0 0.0 100.0Soybean (VC) 6.9 2.2 86.1 4.7 100.0Velvetleaf 16.4 0.0 10.0 73.6 100.0
Error rates (%) 31.7 4.7 13.8 26.4 19.2

130 J.C. Neto et al. / Computers and Electronics in Agriculture 50 (2006) 121–134
Table 8Training data classification results using all Elliptic Fourier coefficients and cross-validation—third week after emergence
Species Mean percentage of leaves classified as
Pigweed Sunflower Soybean (V1) Velvetleaf Total
Pigweed 70.5 9.6 14.9 5.1 100.0Sunflower 7.7 89.2 2.8 0.3 100.0Soybean (V1) 3.4 0.9 95.7 0.0 100.0Velvetleaf 9.0 1.9 2.7 86.0 100.0
Error rates (%) 29.6 10.8 4.3 14.0 16.2
Table 9Testing data classification results using all Elliptic Fourier coefficients and cross-validation—third week after emergence
Species Mean percentage of leaves classified as
Pigweed Sunflower Soybean (V1) Velvetleaf Total
Pigweed 76.8 6.1 13.1 4.1 100.0Sunflower 6.3 90.0 3.6 0.0 100.0Soybean (V1) 3.5 0.0 96.5 0.0 100.0Velvetleaf 8.6 2.2 4.3 85.0 100.0
Error rates (%) 23.2 10.0 3.5 15.0 14.2
5% with cross-validation for the training data set and 19.2% for the testing data set were obtained, respectively. Thespecies discrimination model correctly identified 95.3% of sunflower, 68.3% of redroot, 86.1% of soybean and 73.6%of velvetleaf species. The number of false classifications was also reduced.Fig. 5 shows the canonical classificationresults for selected Elliptic Fourier coefficients.
3.2. Third week analyses
Tables 8 and 9present the training and testing classification rates with all leaflet images and a full set of EFharmonic coefficients for the second and third weeks. The new classification model had error rates for the training andtest data at 16.2 and 14.2%, respectively. The model correctly identified 76.8% of redroot pigweed, 90% of sunflower,96.5% of soybean and 85% of velvetleaf. When selected EF coefficients were used, overall classification accuracyfor species identification was again improved, as shown inTables 10 and 11. The overall classification error rates forthe training and test data sets were 6 and 11.7%, respectively. This discriminant model correctly identified 77.9% ofredroot pigweed, 93.8% of sunflower, 96.5% of soybean and 89.4% of velvetleaf species.
Fig. 5shows the canonical discrimination results for species classification during the third week. Trifoliate soybeanleaflets are sometimes confused with pigweed leaves, and those are circled on the plots. Those misclassifications areprobably due to the similar rounded shape of the trifoliate soybean leaflet that was present in the third week aftergermination. Also noted inFig. 5is a small region where pigweed and sunflower clusters overlap. The performance of
Table 10Training data results using selected Elliptic Fourier coefficients and cross-validation—third week
Species Mean percentage of leaves classified as
Pigweed Sunflower Soybean (V1) Velvetleaf Total
Pigweed 87.9 2.8 7.6 1.8 100.0Sunflower 3.4 95.7 0.9 0.0 100.0Soybean (V1) 2.6 0. 0 97.4 0.0 100.0Velvetleaf 2.7 0.0 0.3 97.0 100.0
Error rates (%) 12.1 4.3 2.6 3.0 6

J.C. Neto et al. / Computers and Electronics in Agriculture 50 (2006) 121–134 131
Table 11Testing data classification results using selected Elliptic Fourier coefficients and cross validation—third week after emergence
Species Mean percentage of leaves classified as
Pigweed Sunflower Soybean (V1) Velvetleaf Total
Pigweed 77.9 6.1 11.0 5.1 100.0Sunflower 5.0 93.8 1.3 0.0 100.0Soybean (V1) 3.5 0.0 96.5 0.0 100.0Velvetleaf 7.5 1.1 2.1 89.4 100.0
Error rates (%) 22.1 6.3 3.4 10.6 11.7
Table 12Training data results using all Elliptic Fourier coefficients and one-out, cross-validation—second and third weeks after emergence
Species Mean percentage of leaves classified as
Soybean (V1) Pigweed Sunflower Soybean (VC) Velvetleaf Total
Soybean (V1) 96.0 3.1 0.6 0.3 0.0 100.0Pigweed 12.1 74.8 6.3 1.7 5.2 100.0Sunflower 0.9 4.3 94.0 0.9 0.0 100.0Soybean (VC) 5.9 1.0 0.3 92.2 0.7 100.0Velvetleaf 2.1 13.0 0.1 3.8 80.3 100.0
Error rates (%) 5.6 28.3 8.4 7.3 17.9 15.9
classification for the third week with an average correct species identification of 88.3% was significantly better thanthe second week with an average correct species identification of 80.8%. This brings up an important question, as towhy the EF was not applied to the entire soybean trifoliate. In reality that discrimination would be potentially muchbetter. Unfortunately, some leaflets on soybean trifoliolate leaves were occluded in the images. The EF method shouldtheoretically work with almost any shape of a simple or compound, fully exposed, and presented leaf image (McLellanand Endler, 1998).
3.3. Second and third weeks combined
Assuming that leaves extracted from the soybean canopy could have both unifoliolate and trifoliolate shapes, theleaf data sets for the second and the third weeks were combined to simulate this situation.Tables 12 and 13present thetraining and testing classification rates with all coefficients for both weeks. The overall error rate for the discriminantmodel was 15.9% for training data and 14.8% for the testing data. This discriminant model correctly identified 76.4%of redroot pigweed, 93.6% of sunflower, 80.3% of velvetleaf, 91.5% of soybean leaf extract from trifoliolate and90.9% of soybean unifoliolate leaves. When selected Fourier coefficients were used, the training classification errorrate was reduced to 9.2% and the testing error rate to 11.6%, as shown inTables 14 and 15. The reduced set model
Table 13Testing data classification results using all Elliptic Fourier coefficients and cross-validation—second and third weeks after emergence
Species Mean percentage of leaves classified as
Soybean (V1) Pigweed Sunflower Soybean (VC) Velvetleaf Total
Soybean (V1) 91.5 6.7 0.00 1.8 0.0 100.0Pigweed 12.1 76.4 6.5 1.4 3.6 100.0Sunflower 1.6 4.1 93.6 0.8 0.0 100.0Soybean (VC) 5.5 3.6 0.0 90.9 0.0 100.0Velvetleaf 2.1 13.7 0.1 3.8 80.3 100.0
Error rates (%) 8.4 23.6 6.4 9.1 18.4 14.8

132 J.C. Neto et al. / Computers and Electronics in Agriculture 50 (2006) 121–134
Table 14Training data results using selected Elliptic Fourier coefficients and cross-validation—second and third weeks after emergence
Species Mean percentage of leaves classified as
Soybean (V1) Pigweed Sunflower Soybean (VC) Velvetleaf Total
Soybean (V1) 97.0 2.2 0.0 0.9 0.0 100.0Pigweed 6.6 82.0 6.6 1.4 3.4 100.0Sunflower 0.4 4.4 94.2 1.0 0.0 100.0Soybean (VC) 1.4 1.8 0.5 94.5 1.8 100.0Velvetleaf 0.5 5.5 0.0 1.4 92.6 100.0
Error rates (%) 3.0 18.0 5.8 5.5 7.4 9.2
Table 15Testing data results using selected Elliptic Fourier coefficients and cross-validation—second and third weeks after emergence
Species Mean percentage of leaves classified as
Soybean (V1) Pigweed Sunflower Soybean (VC) Velvetleaf Total
Soybean (V1) 94.9 3.3 0.0 1.8 0.0 100.0Pigweed 7.1 80.8 7.2 1.4 3.6 100.0Sunflower 0.0 4.9 94.3 0.8 0.0 100.0Soybean (VC) 5.8 3.6 0.0 88.6 2.0 100.0Velvetleaf 0.7 7.8 0.7 2.8 88.0 100.0
Error rates (%) 5.2 19.2 5.7 11.5 12.0 11.6
correctly identified 80.8% of redroot pigweed, 94.3% of sunflower, 88% of velvetleaf, 94.9% of soybean leaf extractfrom trifoliolate and 88.6% of soybean unifoliolate leaves. The average of correct species identification using the datasets for both weeks was 88.4%, similar to the third week alone. The combined sets from weeks two and three obviouslyprovided a larger and better database for species classification. The canonical discrimination variables, CAN1 andCAN2 are plotted inFig. 6. One may observe species cluster overlapping regions for pigweed and trifoliolate soybeanleaves (V1 soybean) than unifoliolate soybean leaves (VC soybean).
Fig. 6. Canonical analysis for combined second and third week leaf image sets.

J.C. Neto et al. / Computers and Electronics in Agriculture 50 (2006) 121–134 133
4. Summary and conclusions
Plant species can be accurately identified using Elliptic Fourier shape features of whole, extracted leaflets from plantcanopies. The EF method combined with principle component analysis and linear discriminant models performed verywell. Older plants of the third week had more mature leaves and provided the best leaf images for identifying plantspecies, demonstrated with an 88.3% classification rate. As leaves develop, their shapes become an important speciestrademark. The redroot pigweed plant had the lowest correctly identified rate during both weeks. Redroot pigweed ismisclassified with soybean during the third week, because of a similar rounded leaf shape to the trifoliolate soybeanleaflet at this growth stage. Some lesser misclassification with sunflower also occurred. By combining the leaflet imagesfor the second and third weeks, an overall species identification accuracy of approximately 88.4% was obtained. FutureEF studies should consider improved timing, background lighting, improved camera work and application to identifyingcompound leaves.
Leaf orientation is important in the EF analysis. To our knowledge, this has not been treated in previous plantspecies imaging studies. Two angles are needed to describe a leaf plane in three-dimensional space. One of the leafangles is hard to control or adapt to, but sunlit leaves of many species can present themselves heliotropically towarda light source, such that one could select the best camera angles for full leaf exposure at the top of the canopy. Theleaf angle in the plane of the canopy is apparently taken care of by the first EF harmonic, and that is a critical anglefor rotationally invariant leaf texture or venation analysis. Additional studies regarding leaf orientation relative to thecamera lens might help to resolve classification errors. Future studies are also needed to determine minimal digitalimage resolutions needed to maintain the highest species discrimination performance.
Acknowledgments
The Agricultural Research Division, University of Nebraska-Lincoln, has approved this article as Journal SeriesNo. 14512. This work was supported in part by EMBRAPA, Campinas, Brasil and Nebraska ARD funds. Mention ofspecific trade names is for reference only and not to imply exclusion of others that may be suitable.
References
Camargo Neto, J., 2004. A Combined Statistical—Soft Computing Approach for Classification and Mapping Weed Species in Minimum TillageSystems. Unpublished Ph.D. Dissertation. University of Nebraska, Lincoln, NE, 117 pp.
Chen, S.Y.Y., Lestrel, P.E., Kerr, W.J.S., McColl, J.H., 2000. Describing shape changes in the human mandible using Elliptic Fourier functions. Eur.J. Orthod. 22, 205–216.
Chi, Y.T., Chien, C.F., Lin, T.T., 2002. Leaf shape modeling and analysis using geometric descriptors derived from Bezier curves. Trans. ASAE 46(1), 175–185.
Franz, E., Gebhardt, M.R., Unklesbay, K.B., 1991a. Shape description of completely visible and partially occluded leaves for identifying plants indigital images. Trans. ASAE 34 (2), 1991.
Franz, E., Gebhardt, M.R., Unklesbay, K.B., 1991b. The use of local spectral properties of leaves as an aid for identify weed seedlings in digitalimages. Trans. ASAE 34 (2), 1991.
Guyer, D.E., Miles, G.E., Schreiber, M.M., Mitchell, O.R., Vanderbilt, V.C., 1986. Machine vision and image processing for plant identification.Trans. ASAE 29 (6), 1500–1507.
Guyer, D.E., Miles, G.E., Gaultney, L.D., Schreiber, M.M., 1993. Application of machine vision to shape analysis in leaf and plant identification.Trans. ASAE 31 (1), 163–171.
Hindman, T.W. 2001. A fuzzy logic approach for plant image segmentation and species identification in color images. Unpublished Ph.D. Dissertation.University of Nebraska, Lincoln.
Innes, D.J., Bates, J.A., 1999. Morphological variation onMytilus edulis andMytilus trossulus in eastern Newfoundland. Mar. Biol. 133, 691–699.Kincaid, D.T., Schneider, R.B., 1983. Quantification of leaf shape with a microcomputer and Fourier transform. Can. J. Bot. 61, 2333–2342.Knezevic, S.Z., Evans, S.P., Blankenship, E.E., Van-Acker, R.C., Lindquist, J.L., 2002. Critical period for weed control: the concept and data
analysis. Weed Sci. 50, 773–786.Kuhl, F.P., Giardina, C.R., 1982. Elliptic Fourier features of a closed contour. Comput. Graphic Image Process. 18, 236–258.Manh, A.G., Rabatel, G., Assemat, L., Aldon, M.J., 2001. Weed leaf image segmentation by deformable templates. J. Agric. Eng. Res. 80 (2),
139–146.Manley, B.S., Wilson, H.P., Hines, T.E., 2001. Weed management and crop rotations influence populations of several broadleaf weeds. Weed Sci.
49, 106–122.McLellan, T., Endler, J.A., 1998. The relative success of some methods for measuring and describing the shape of complex objects. Syst. Biol. 47
(2), 264–281.

134 J.C. Neto et al. / Computers and Electronics in Agriculture 50 (2006) 121–134
Medlin, C.R., Shaw, D.R., Gerard, P.D., LaMastus, F.E., 2000. Using remote sensing to detect weed infestations in Glycine Max. Weed Sci. 48,393–398.
Meyer, G.E., Camargo-Neto, J., Jones, D.D., Hindman, T.W., 2004a. Intensified fuzzy cluster for determining plant, soil, and residue regions ofinterest from color images. Electron. Agric. (Elsevier) 43 (3), 161–180.
Meyer, G.E., Hindman, T.W., Jones, D.D., Mortensen, D.A., 2004b. Digital camera operation and fuzzy logic classification of plant, soil, and residuecolor images. Eng. Agric. 20 (4), 519–529.
Oide, M., Ninomiya, S., 2000. Discrimination of soybean leaflet shape by neural networks with image input. Comput. Electron. Agric. 29, 59–72.Petry, W., Kuhbauch, W., 1989. Automatisierte unterscheidung von unkrauten nach formparametern mit hilfe der quantitativen bild analyse. J.
Agronomy Crop Sci. (Berlin) 163, 345–351.Timmermann, C., Gerhards, R., Kuhbauch, W., 2003. The economic impact of site-specific weed control. Precision Agric. 4, 249–260.Woebbecke, D.M., G.E. Meyer, B.K.V., Mortensen, D.A., 1995. Shape features for identifying young weeds using image analysis. Trans. ASAE 38
(1), 271–281.Zimdahl, R.L., 1988. The concept and application of the critical weed-free period. In: Altieri, M.A., Liebman, M. (Eds.), Weed Management in
Agroecosystems, Ecological Approaches. CRC Press, Boca Raton, FL, pp. 145–155.

![A Course on Convex Geometry - University of Ljubljanalavric/hug&weil.pdf · [Ba] I.J. Bakelman, Convex Analysis and Nonlinear Geometric Elliptic Equations ... A. Koldobsky,Fourier](https://img.dokumen.tips/doc/110x75/5afa26707f8b9a44658ead50/a-course-on-convex-geometry-university-of-lavrichugweilpdfba-ij-bakelman.jpg)