Embed Size (px)
Citation preview
PARTICIPATORY WATERSHEP PLANNING - KABALE
RWAMATE WATERSHED – KAGARAMA PARISH
BUBARE SUB-COUNTY
31 January 2012
Dear Dr Bamwerinde Wilson,
Re: Invitation to participate in a six day training course in Land Degradation Assessment and SLM
approaches (LADA) scheduled on 20th
to 25th
February 2012 in Bukoba - Tanzania.
I am pleased to inform you that the Kagera Transboundary Agro-ecosystem Management Project (Kagera
TAMP), funded by the Global Environment Facility (GEF), in partnership with the Governments, partner
programmes and donors, is organizing a field training exercise as indicated above.
The project is supporting adaptive management and the adoption of an integrated ecosystems approach for the
sustainable management of land resources in the Kagera Basin. In consultation with the technical advisory and
project steering committees, a six day training exercise is being conducted in the assessment and monitoring of
land degradation and sustainable land management (SLM) aimed at a multi-disciplinary team of technical
experts working in the beneficiary districts. The training will take place in one of the target catchments and will
focus on how to assess the status and trends of land resources and ecosystems and how to monitor progress in
generating the expected project benefits:
Control of erosion and restoration of degraded lands;
Carbon sequestration and reduced burning for climate change mitigation;
Conservation of agricultural biodiversity;
Improved agricultural production and its contribution to food security and rural livelihoods, and
Contributions to the protection of international waters and to climate change adaptation.
As a selected participant for this exercise you are requested to arrive in Bukoba on Sunday 19 February 2012,
and you will return home on the following Sunday. It is expected that after the training you will utilize the skills
acquired by contributing to regular assessment and monitoring of Kagera TAMP project activities and relevant
SLM activities in your district/region. The project, through the country FAO Representation, will cover all the
training costs as per FAO administrative procedures.
Please confirm your participation as soon as possible so that travel and logistical arrangements can be made.
Should there be any clarification needed do not hesitate to contact the following:
1. National Project Manager in Uganda: [email protected]
phone: +256772541335;
2. National Project Manager in Tanzania: [email protected]
phone: +255754273849;
3. Regional Project Coordinator: [email protected]
phone: +250788 383 040.
We look forward to your active participation in the training and subsequent support in the assessment and
monitoring of Kagera TAMP and related district/regional SLM activities.
Sincerely,
Stefan Schlingloff
Kagera TAMP - Lead Technical Unit
Land and Water Division, FAO – Rome, Italy
INTRODUCTION
This report is in respect of the field work done in Rwamate watershed located in Kagarama parish,
Bubare sub-county, Kabale district. The exercise was conducted with community members following
training in Masaka
OBJECTIVES OF THE FIELD PRACTICUM
1. To enable the participants learn how to apply the various participatory survey and mapping
techniques in a watershed.
2. To determine problems, issues and opportunities towards developing a community based
integrated watershed management plan.
3. To develop the community - based integrated watershed management plan.
Members of the facilitating team
- Edison Hilman – DAO, Kabale
- Twebaze Jeniffer
- Tumuheirwe Honest
- Twinorusha Samuel Kahungu
- Kyokusiima Doreen
METHODOLOGY
- Methods used included the:
- Transect walk with community members
- GPS to mark points, expected to generate digital map
- Observation (Erosion, vegetation land use types and livelihoods)
- Photographs
- Questionnaires, Interviews
- Focus group discussion(FDG)
- Discussions and consensus generation with community members
PROCESS
The Planning process
The facilitating team started off by holding a planning meeting to chart a way forward on how to
approach the communities and complete the task at hand. The plan prepared to undertake the task is
presented below:
Sn Objective Activity Time frame
1 To apply participatory assessment
tools and mapping techniques
learned from Participatory
Watershed Training, including Land
Degradation Assessment tools in the
target TAMP micro-watersheds to:
- Understand the watershed
community, their resources,
opportunities and problems
- Identify and prioritize needs
with the problem
- Construct problem and
objective trees and derive
action plans
Mobilization of communities,
compilation of data collection
tools, communication
Monday
23/04/2012
Identify issues, problems and
opportunities in the watershed;
- Conduct FGD
- Transect walk
Tuesday
24/04/2012
Participatory watershed
analysis/data collection
- Watershed characterization
- Water and vegetation
assessment
- Soil and land use assessment
- Livelihood assessment
Wednesday
25/04/2012
Data analysis and consolidation
- Problem analysis, developing
problem tree and objective tree
Thursday
26/04/2012
Documentation, digitizing
community outputs, preparing
presentations
Friday
27 /04/2012
3.2. Approach
A- Five member team of facilitators set out to complete the activity in the selected watershed.
Mobilization was done though physical visit to the area following phone appointments which enabled
the team to:
- Brief leadership of Farmer Field schools about the activity
- Agree on dates and venue for the activity
- Agree on number of community members to participate in the exercise
Decisions
When the exercise started, we were interrupted by a heavy down pour which altered our plan of work;
we inevitably took decisions to ensure that work progresses. The heavy morning downpour also
implied that farmer attendance was low, though many more arrived when the exercise was already
going on.
- We shifted base to a nearby school, where we were able to get rooms for the different groups
- We made changes in the original plan to cover tools that did not require the open
- Each group member was allocated a tool with a corresponding group of key resource
persons/key informants
Difficulties/Challenges
Bad weather interrupted progress on days one and two
Lack of resources to facilitate travel, stationery, refreshments and other logistics
Tough terrain, especially during the transect walk, moreover on slippery ground
Less manpower; it was necessary to have at least two facilitation members per community
group to enable one to lead the discussion while the other records, this was not possible
Little /Limited time, meant that all the tools /assessments could not be completed
Lack of technical capacity in some areas (water analysis, soil analysis, vegetation identification,
others)
Other commitments by team members
EXPECTED OUTPUTS BASED ON THE FIELD GUIDE
1. Community watershed map/Resource map
2. Data from Focused Group Discussion & interviews.
3. Transect walk map
4. Community problems & needs identified and prioritized
OUTPUTS FROM FIELD
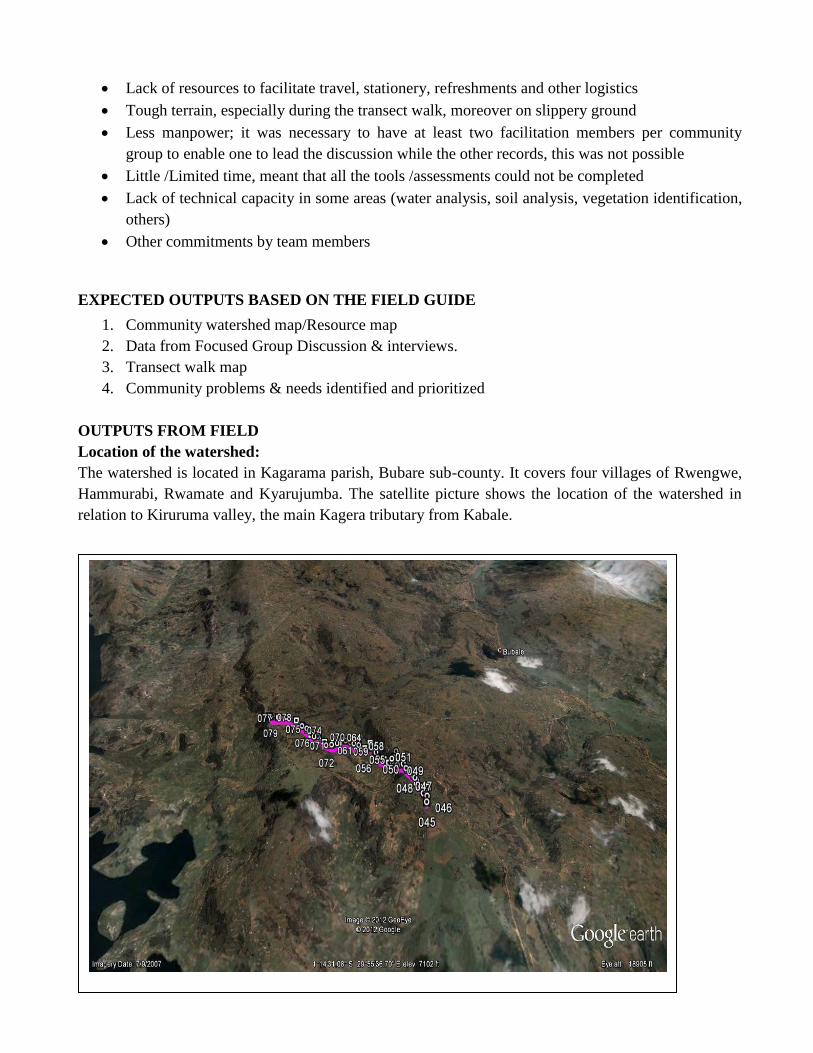
Location of the watershed:
The watershed is located in Kagarama parish, Bubare sub-county. It covers four villages of Rwengwe,
Hammurabi, Rwamate and Kyarujumba. The satellite picture shows the location of the watershed in
relation to Kiruruma valley, the main Kagera tributary from Kabale.
Watershed map.
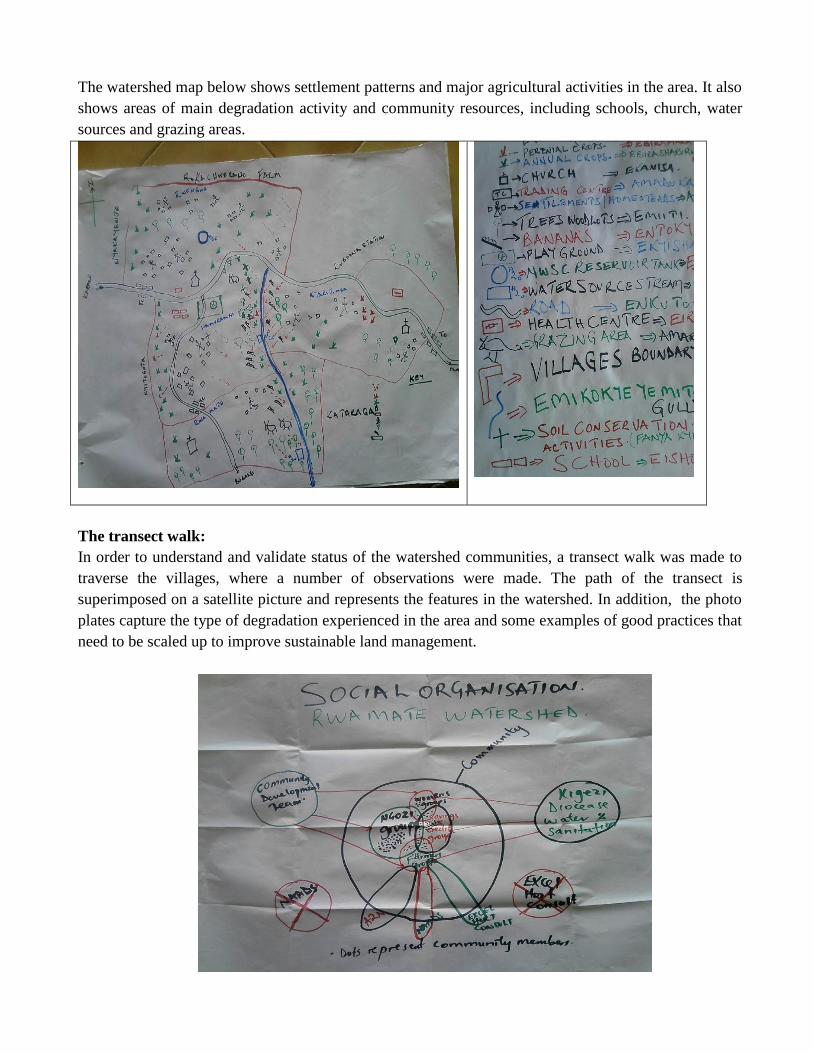
The watershed map below shows settlement patterns and major agricultural activities in the area. It also
shows areas of main degradation activity and community resources, including schools, church, water
sources and grazing areas.
The transect walk:
In order to understand and validate status of the watershed communities, a transect walk was made to
traverse the villages, where a number of observations were made. The path of the transect is
superimposed on a satellite picture and represents the features in the watershed. In addition, the photo
plates capture the type of degradation experienced in the area and some examples of good practices that
need to be scaled up to improve sustainable land management.
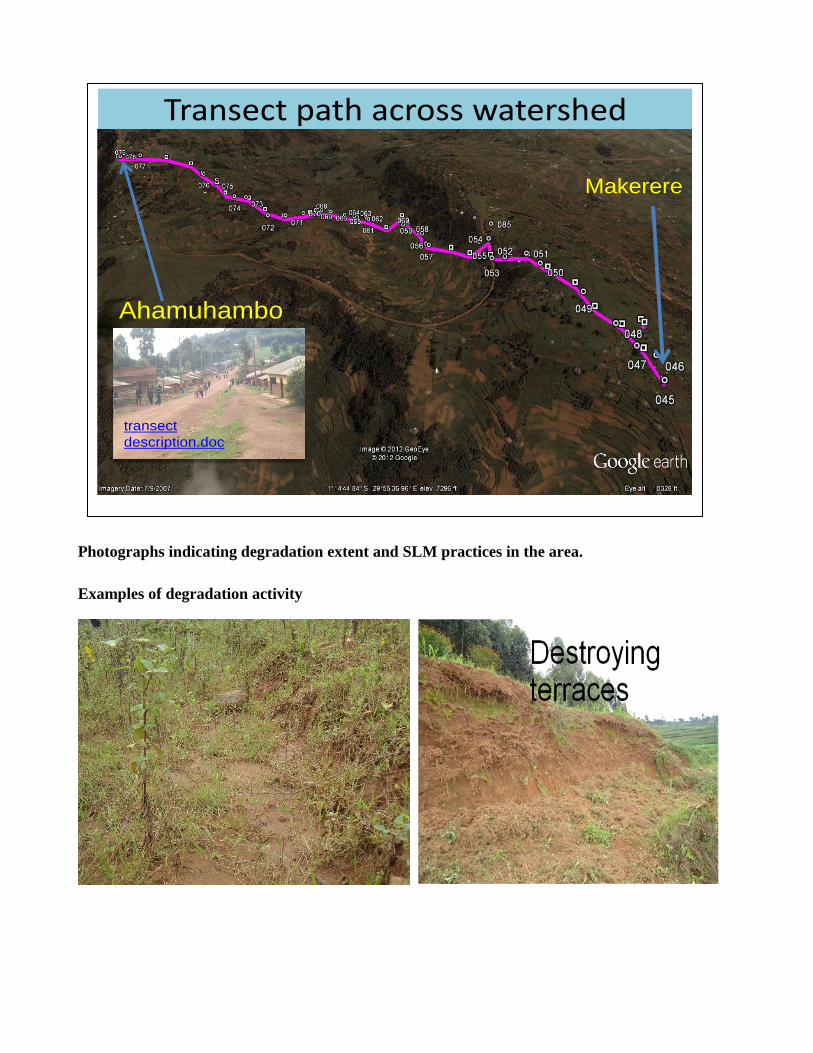
Photographs indicating degradation extent and SLM practices in the area.
Examples of degradation activity
Transect path across watershed
Makerere
Ahamuhambo
transect
description.doc
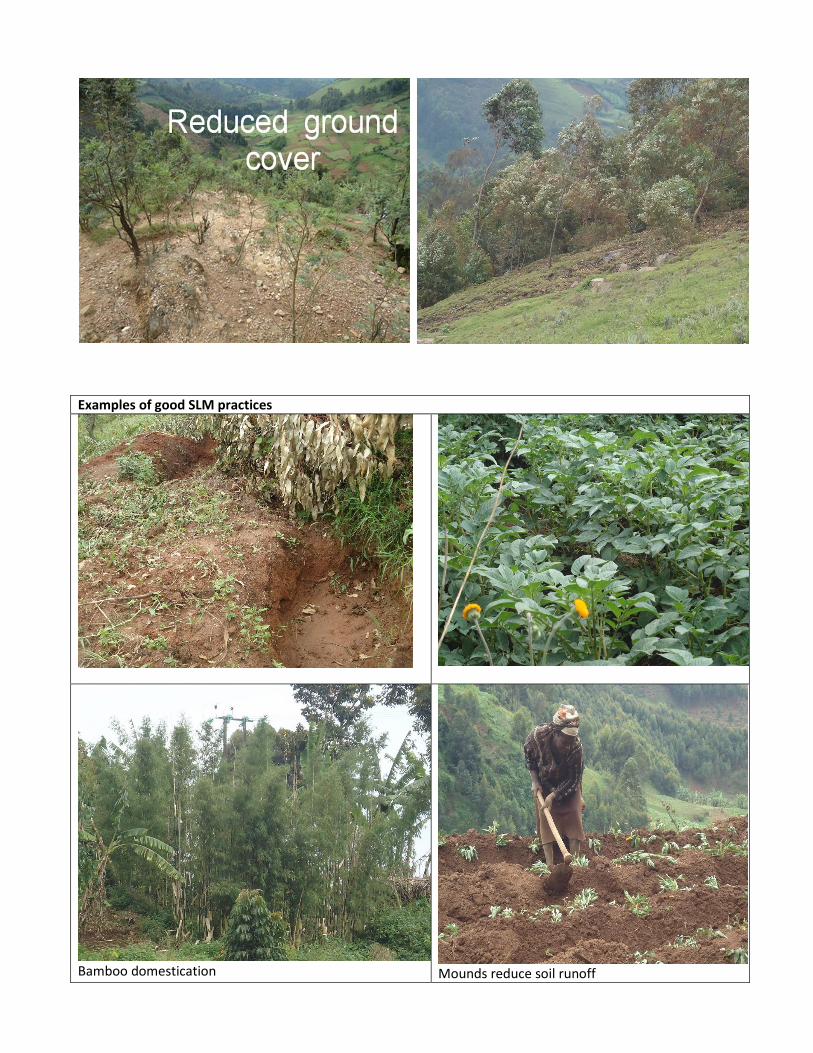
Examples of good SLM practices
Bamboo domestication
Mounds reduce soil runoff
WATER AND VEGETATION RESOURCES ASSESMENT:
RECENT CHANGES IN HYDROGICAL REGIME AND WATER SUPPLY
Surface water runoff has reduced due trainings from Africa 2000 network
Peak flow /floods has reduced seasonally
Base flow/dry season flow has increased due to deforestation
Ground water recharge has reduced
Soil moister recharge has reduced
Erosion and sediments has reduced
Drought/flood risk
Droughts /floods occurs seasonally
In the last 10 year droughts/floods increased due to deforestation
The periods for drought are in the months of December, January, February, and March
The months for floods are in September, October, November, and December
Draught & floods cause famine because they reduce productivity thus increase poverty levels
CHAGES IN WATER QUALITY OF DIFFERENT WATER SOURCES AND THIER CAUSES
Pathogens, nutrients and organic matter, pesticides and other persistent and organic pollutants have
reduced because people no longer share water sources where by some community members used to
defecate near or in the water source because they have built water harvesting tanks water jars at
individual homes and others have tap <NWSC>or buy from reservoir tank of NWSC
CHANGES IN WATER AVALIABILTY
Water availability has increased
The community used to share one water source for consumption with livestock, community
members have water jars or tanks almost per household where the harvest rain water during
the wet season plus reservoir tank for NWSC where they buy water during the dry season
During the wet season, the community obtain water from a dam where members harvest water
for livestock and domestic use.
However there is no equipment for determining water quality
The water is not saline
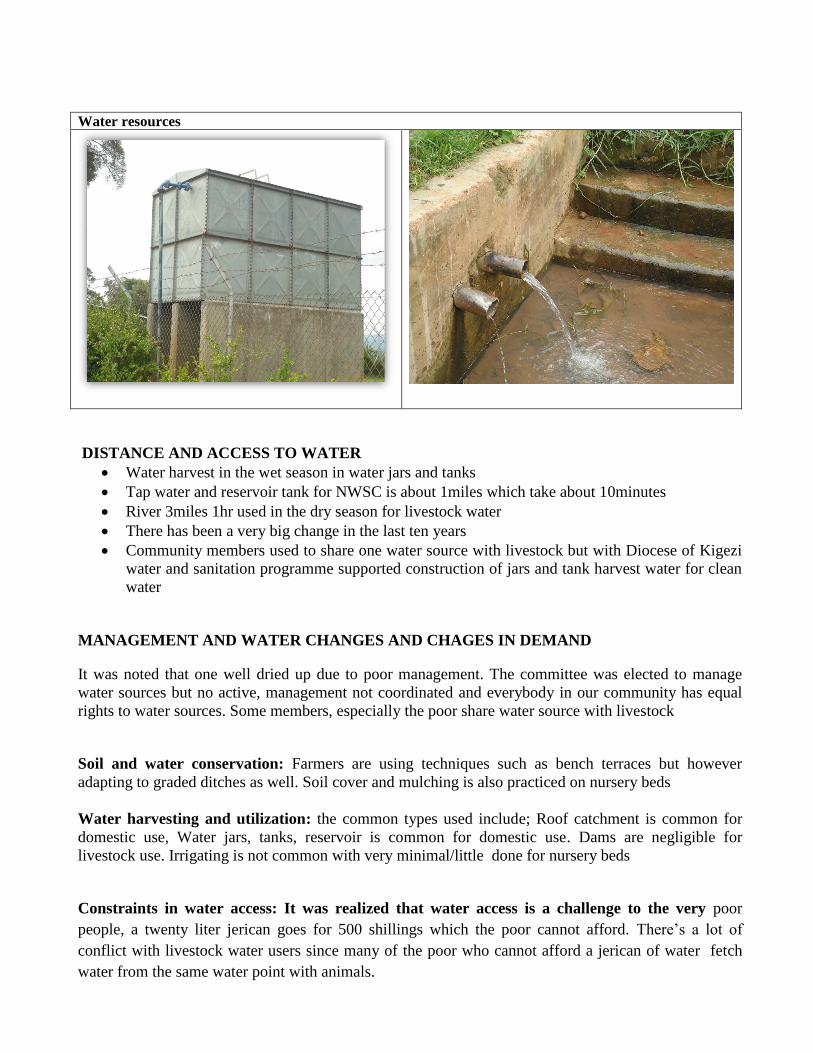
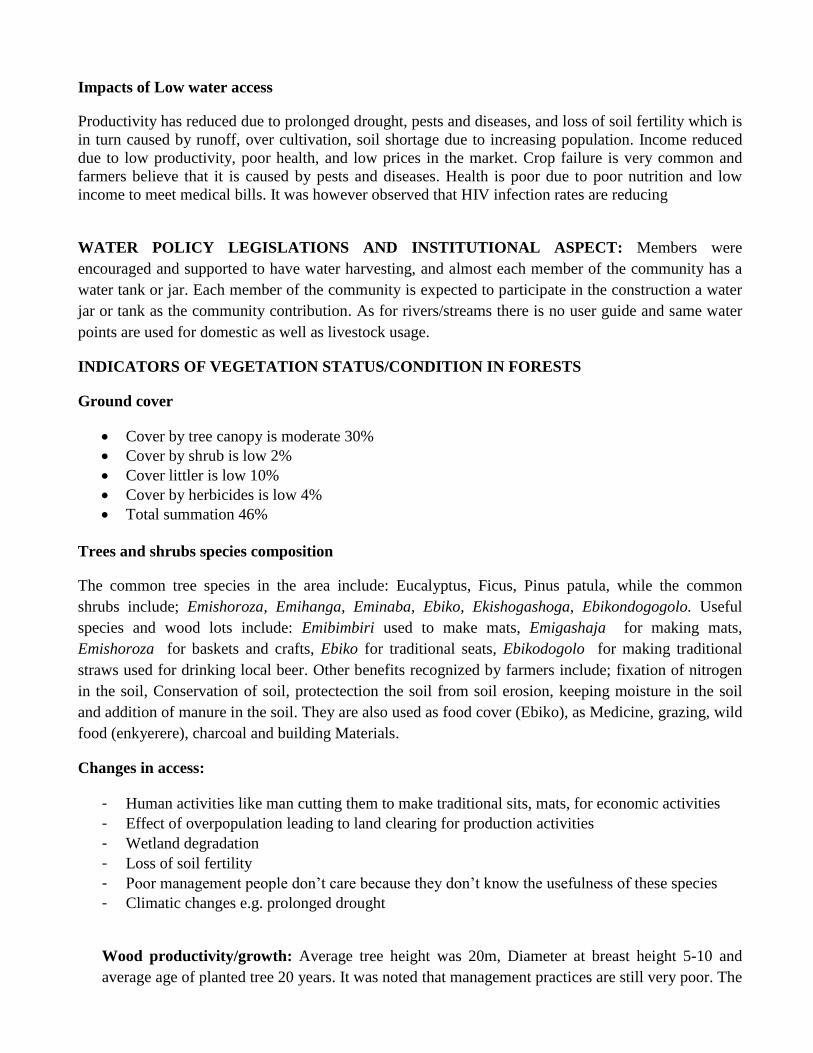
Water resources
DISTANCE AND ACCESS TO WATER
Water harvest in the wet season in water jars and tanks
Tap water and reservoir tank for NWSC is about 1miles which take about 10minutes
River 3miles 1hr used in the dry season for livestock water
There has been a very big change in the last ten years
Community members used to share one water source with livestock but with Diocese of Kigezi
water and sanitation programme supported construction of jars and tank harvest water for clean
water
MANAGEMENT AND WATER CHANGES AND CHAGES IN DEMAND
It was noted that one well dried up due to poor management. The committee was elected to manage
water sources but no active, management not coordinated and everybody in our community has equal
rights to water sources. Some members, especially the poor share water source with livestock
Soil and water conservation: Farmers are using techniques such as bench terraces but however
adapting to graded ditches as well. Soil cover and mulching is also practiced on nursery beds
Water harvesting and utilization: the common types used include; Roof catchment is common for
domestic use, Water jars, tanks, reservoir is common for domestic use. Dams are negligible for
livestock use. Irrigating is not common with very minimal/little done for nursery beds
Constraints in water access: It was realized that water access is a challenge to the very poor
people, a twenty liter jerican goes for 500 shillings which the poor cannot afford. There’s a lot of
conflict with livestock water users since many of the poor who cannot afford a jerican of water fetch
water from the same water point with animals.
Impacts of Low water access
Productivity has reduced due to prolonged drought, pests and diseases, and loss of soil fertility which is
in turn caused by runoff, over cultivation, soil shortage due to increasing population. Income reduced
due to low productivity, poor health, and low prices in the market. Crop failure is very common and
farmers believe that it is caused by pests and diseases. Health is poor due to poor nutrition and low
income to meet medical bills. It was however observed that HIV infection rates are reducing
WATER POLICY LEGISLATIONS AND INSTITUTIONAL ASPECT: Members were
encouraged and supported to have water harvesting, and almost each member of the community has a
water tank or jar. Each member of the community is expected to participate in the construction a water
jar or tank as the community contribution. As for rivers/streams there is no user guide and same water
points are used for domestic as well as livestock usage.
INDICATORS OF VEGETATION STATUS/CONDITION IN FORESTS
Ground cover
Cover by tree canopy is moderate 30%
Cover by shrub is low 2%
Cover littler is low 10%
Cover by herbicides is low 4%
Total summation 46%
Trees and shrubs species composition
The common tree species in the area include: Eucalyptus, Ficus, Pinus patula, while the common
shrubs include; Emishoroza, Emihanga, Eminaba, Ebiko, Ekishogashoga, Ebikondogogolo. Useful
species and wood lots include: Emibimbiri used to make mats, Emigashaja for making mats,
Emishoroza for baskets and crafts, Ebiko for traditional seats, Ebikodogolo for making traditional
straws used for drinking local beer. Other benefits recognized by farmers include; fixation of nitrogen
in the soil, Conservation of soil, protectection the soil from soil erosion, keeping moisture in the soil
and addition of manure in the soil. They are also used as food cover (Ebiko), as Medicine, grazing, wild
food (enkyerere), charcoal and building Materials.
Changes in access:
- Human activities like man cutting them to make traditional sits, mats, for economic activities
- Effect of overpopulation leading to land clearing for production activities
- Wetland degradation
- Loss of soil fertility
- Poor management people don’t care because they don’t know the usefulness of these species
- Climatic changes e.g. prolonged drought
Wood productivity/growth: Average tree height was 20m, Diameter at breast height 5-10 and
average age of planted tree 20 years. It was noted that management practices are still very poor. The
community recognizes that Burning and grazing in trees woodlots without the knowledge of the
owner attracts payment of fine, though it is not well documented.
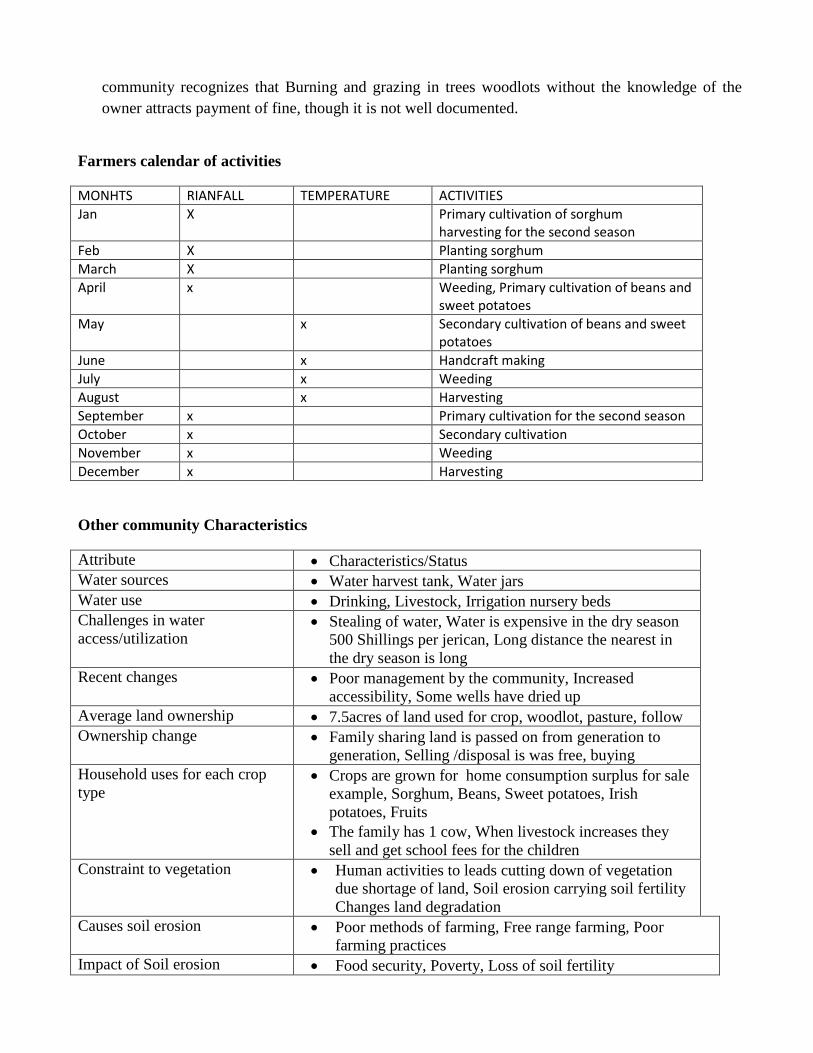
Farmers calendar of activities
MONHTS RIANFALL TEMPERATURE ACTIVITIES
Jan X Primary cultivation of sorghum harvesting for the second season
Feb X Planting sorghum
March X Planting sorghum
April x Weeding, Primary cultivation of beans and sweet potatoes
May x Secondary cultivation of beans and sweet potatoes
June x Handcraft making
July x Weeding
August x Harvesting
September x Primary cultivation for the second season
October x Secondary cultivation
November x Weeding
December x Harvesting
Other community Characteristics
Attribute Characteristics/Status
Water sources Water harvest tank, Water jars
Water use Drinking, Livestock, Irrigation nursery beds
Challenges in water
access/utilization Stealing of water, Water is expensive in the dry season
500 Shillings per jerican, Long distance the nearest in
the dry season is long
Recent changes Poor management by the community, Increased
accessibility, Some wells have dried up
Average land ownership 7.5acres of land used for crop, woodlot, pasture, follow
Ownership change
Family sharing land is passed on from generation to
generation, Selling /disposal is was free, buying
Household uses for each crop
type
Crops are grown for home consumption surplus for sale
example, Sorghum, Beans, Sweet potatoes, Irish
potatoes, Fruits
The family has 1 cow, When livestock increases they
sell and get school fees for the children
Constraint to vegetation
Human activities to leads cutting down of vegetation
due shortage of land, Soil erosion carrying soil fertility
Changes land degradation
Causes soil erosion Poor methods of farming, Free range farming, Poor
farming practices
Impact of Soil erosion Food security, Poverty, Loss of soil fertility
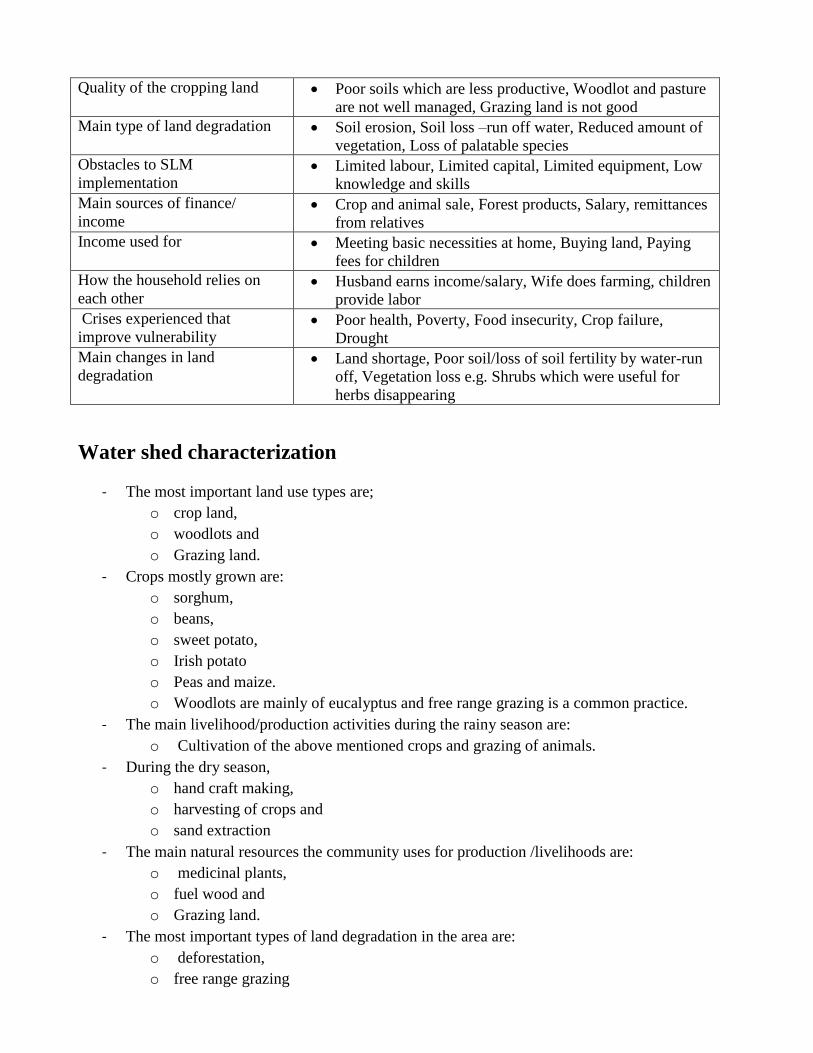
Quality of the cropping land Poor soils which are less productive, Woodlot and pasture
are not well managed, Grazing land is not good
Main type of land degradation Soil erosion, Soil loss –run off water, Reduced amount of
vegetation, Loss of palatable species
Obstacles to SLM
implementation Limited labour, Limited capital, Limited equipment, Low
knowledge and skills
Main sources of finance/
income Crop and animal sale, Forest products, Salary, remittances
from relatives
Income used for Meeting basic necessities at home, Buying land, Paying
fees for children
How the household relies on
each other Husband earns income/salary, Wife does farming, children
provide labor
Crises experienced that
improve vulnerability Poor health, Poverty, Food insecurity, Crop failure,
Drought
Main changes in land
degradation
Land shortage, Poor soil/loss of soil fertility by water-run
off, Vegetation loss e.g. Shrubs which were useful for
herbs disappearing
Water shed characterization
- The most important land use types are;
o crop land,
o woodlots and
o Grazing land.
- Crops mostly grown are:
o sorghum,
o beans,
o sweet potato,
o Irish potato
o Peas and maize.
o Woodlots are mainly of eucalyptus and free range grazing is a common practice.
- The main livelihood/production activities during the rainy season are:
o Cultivation of the above mentioned crops and grazing of animals.
- During the dry season,
o hand craft making,
o harvesting of crops and
o sand extraction
- The main natural resources the community uses for production /livelihoods are:
o medicinal plants,
o fuel wood and
o Grazing land.
- The most important types of land degradation in the area are:
o deforestation,
o free range grazing
o poor methods of cultivation,
o poor farming methods and
o Soil erosion.
- The main causes of land degradation are:
o ignorance,
o limited land and
o Poor implementation of bye laws on natural resource management.
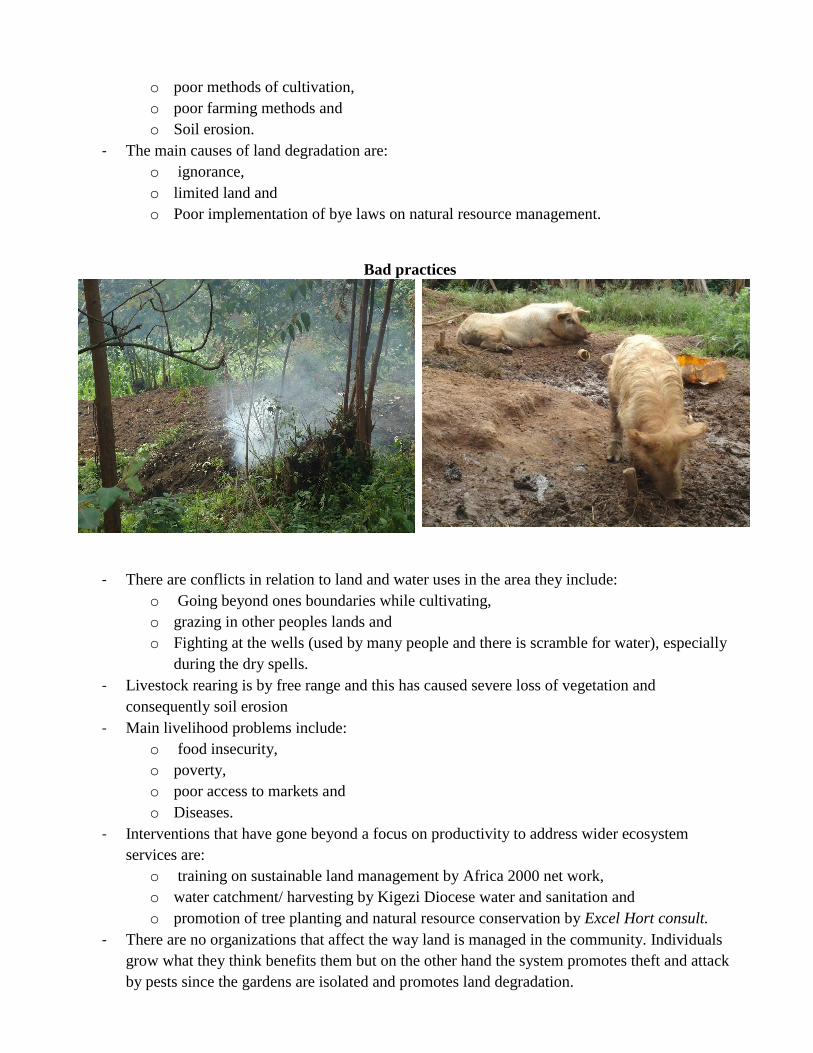
Bad practices
- There are conflicts in relation to land and water uses in the area they include:
o Going beyond ones boundaries while cultivating,
o grazing in other peoples lands and
o Fighting at the wells (used by many people and there is scramble for water), especially
during the dry spells.
- Livestock rearing is by free range and this has caused severe loss of vegetation and
consequently soil erosion
- Main livelihood problems include:
o food insecurity,
o poverty,
o poor access to markets and
o Diseases.
- Interventions that have gone beyond a focus on productivity to address wider ecosystem
services are:
o training on sustainable land management by Africa 2000 net work,
o water catchment/ harvesting by Kigezi Diocese water and sanitation and
o promotion of tree planting and natural resource conservation by Excel Hort consult.
- There are no organizations that affect the way land is managed in the community. Individuals
grow what they think benefits them but on the other hand the system promotes theft and attack
by pests since the gardens are isolated and promotes land degradation.
- Land in the area belongs to the people and have all the rights over it
- Existing laws, rules and regulations are poorly implemented and are not helping at all.
- The major social divisions in terms of poverty/wealth are;
o Poor, medium and rich.
o The poor have very small land holdings i.e. one acre and below while the medium and
rich have from two acres and above.
o Consequently the poor usually go subsistence while the other ones go commercial.
WEALTH RANKING TOOL
- Key indicators for the three main (relative) wealth groups i.e. better off, medium and rich
identified with the community in order of importance are:
o land size,
o type of house,
o number of livestock,
o education level,
o social assets
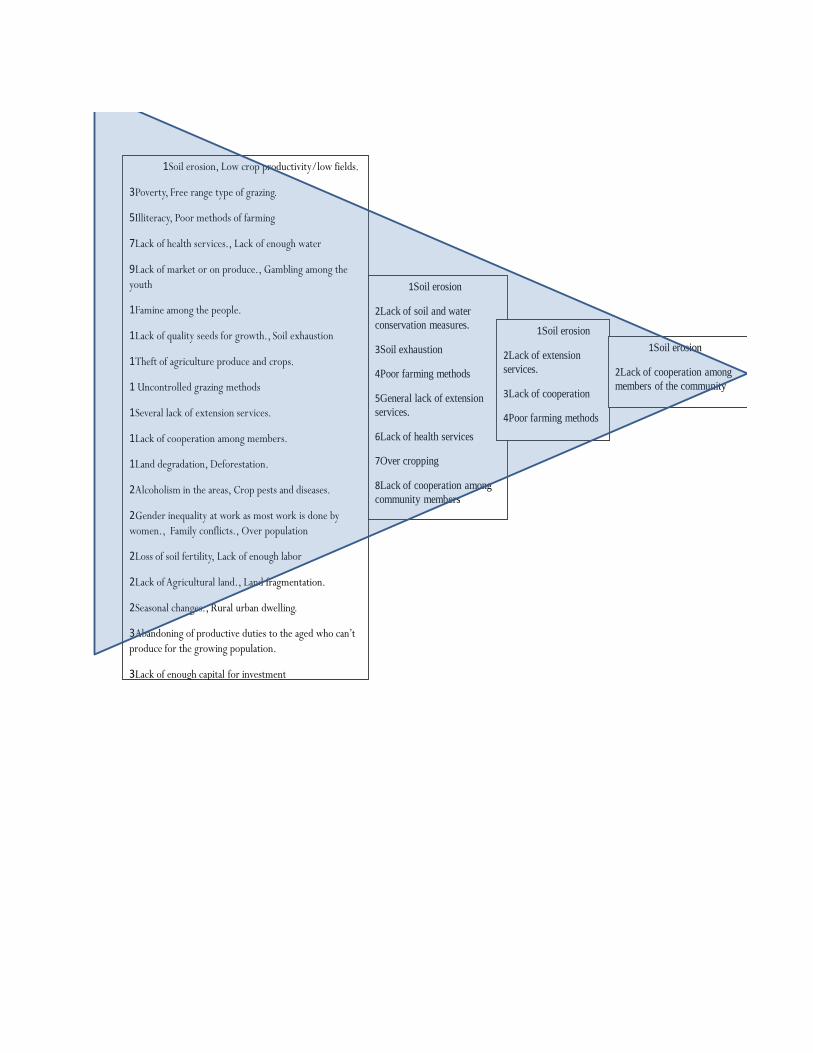
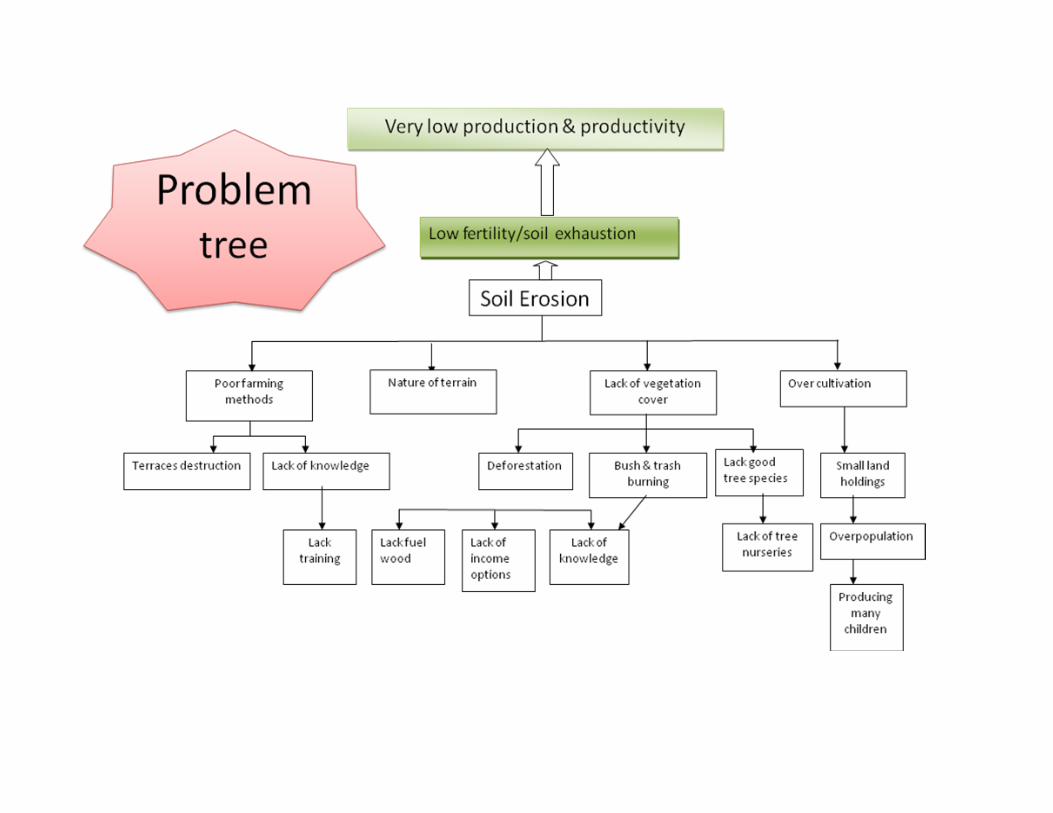
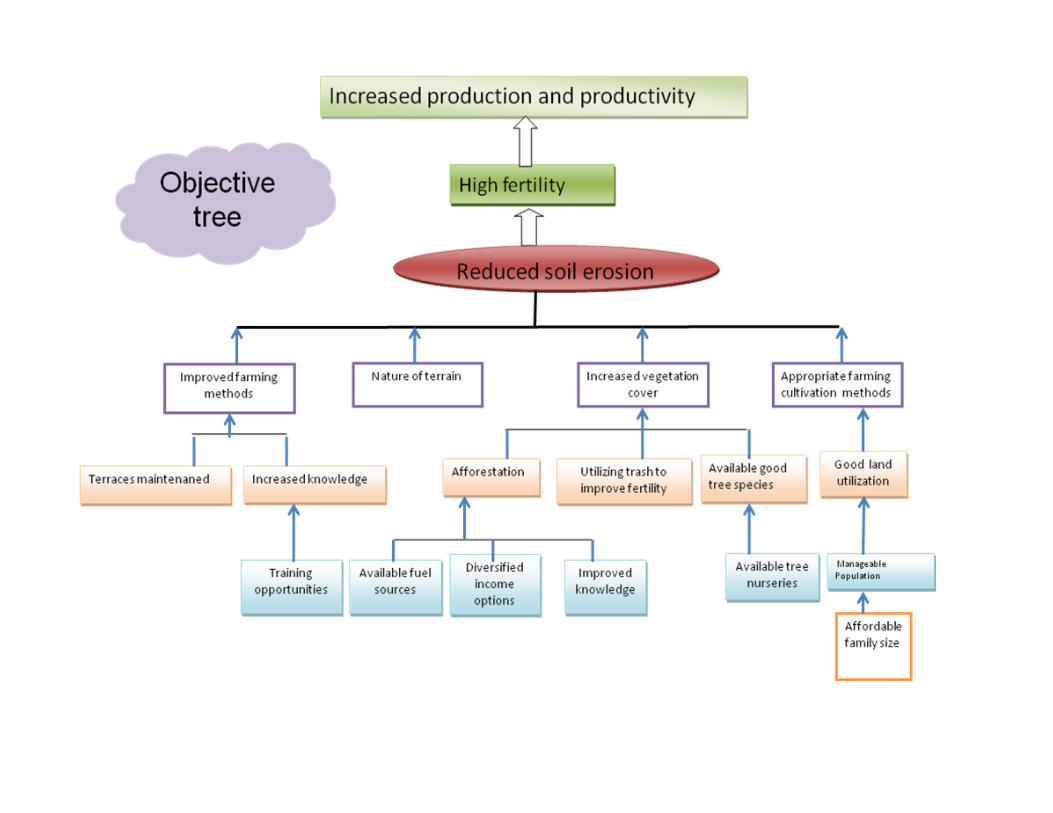
Situational Analysis
The community was guided to identify key problems that are related to reduced productivity and
degradation. The wedge method and problem tree analysis were used to analyze the problems and come
out with the core problem, which was analyzed to understand the root causes. This analysis would
guide in developing the objective tree and them an action plan for the generated objectives and
activities. Outputs of the wedge analysis and problem tree are indicated below.
1Soil erosion, Low crop productivity/low fields.
3Poverty, Free range type of grazing.
5Illiteracy, Poor methods of farming
7Lack of health services., Lack of enough water
9Lack of market or on produce., Gambling among the
youth
1Famine among the people.
1Lack of quality seeds for growth., Soil exhaustion
1Theft of agriculture produce and crops.
1 Uncontrolled grazing methods
1Several lack of extension services.
1Lack of cooperation among members.
1Land degradation, Deforestation.
2Alcoholism in the areas, Crop pests and diseases.
2Gender inequality at work as most work is done by
women., Family conflicts., Over population
2Loss of soil fertility, Lack of enough labor
2Lack of Agricultural land., Land fragmentation.
2Seasonal changes., Rural urban dwelling.
3Abandoning of productive duties to the aged who can’t
produce for the growing population.
3Lack of enough capital for investment
1Soil erosion
2Lack of soil and water
conservation measures.
3Soil exhaustion
4Poor farming methods
5General lack of extension
services.
6Lack of health services
7Over cropping
8Lack of cooperation among
community members
1Soil erosion
2Lack of extension
services.
3Lack of cooperation
4Poor farming methods
1Soil erosion
2Lack of cooperation among
members of the community
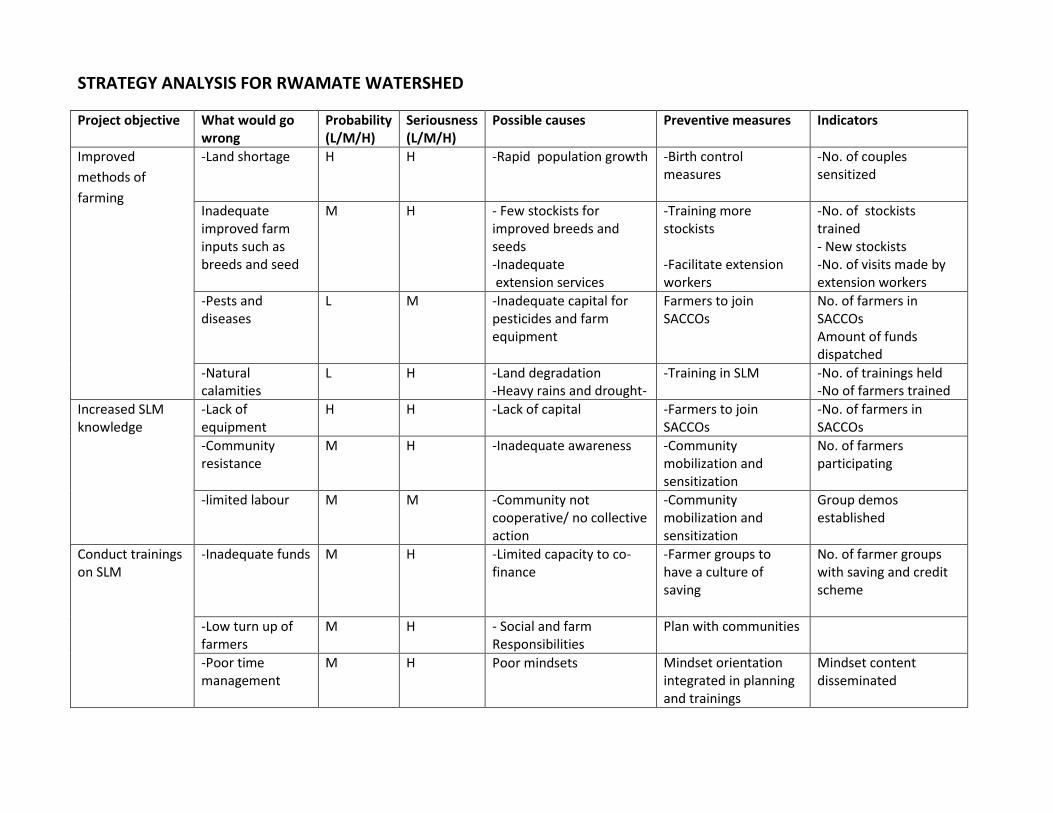
STRATEGY ANALYSIS FOR RWAMATE WATERSHED
Project objective What would go wrong
Probability (L/M/H)
Seriousness (L/M/H)
Possible causes Preventive measures Indicators
Improved
methods of
farming
-Land shortage
H
H
-Rapid population growth
-Birth control measures
-No. of couples sensitized
Inadequate improved farm inputs such as breeds and seed
M
H
- Few stockists for improved breeds and seeds -Inadequate extension services
-Training more stockists -Facilitate extension workers
-No. of stockists trained - New stockists -No. of visits made by extension workers
-Pests and diseases
L
M
-Inadequate capital for pesticides and farm equipment
Farmers to join SACCOs
No. of farmers in SACCOs Amount of funds dispatched
-Natural calamities
L
H -Land degradation -Heavy rains and drought-
-Training in SLM
-No. of trainings held -No of farmers trained
Increased SLM knowledge
-Lack of equipment
H H -Lack of capital -Farmers to join SACCOs
-No. of farmers in SACCOs
-Community resistance
M
H
-Inadequate awareness
-Community mobilization and sensitization
No. of farmers participating
-limited labour M M -Community not cooperative/ no collective action
-Community mobilization and sensitization
Group demos established
Conduct trainings on SLM
-Inadequate funds
M
H
-Limited capacity to co-finance
-Farmer groups to have a culture of saving
No. of farmer groups with saving and credit scheme
-Low turn up of farmers
M H
- Social and farm Responsibilities
Plan with communities
-Poor time management
M H Poor mindsets
Mindset orientation integrated in planning and trainings
Mindset content disseminated
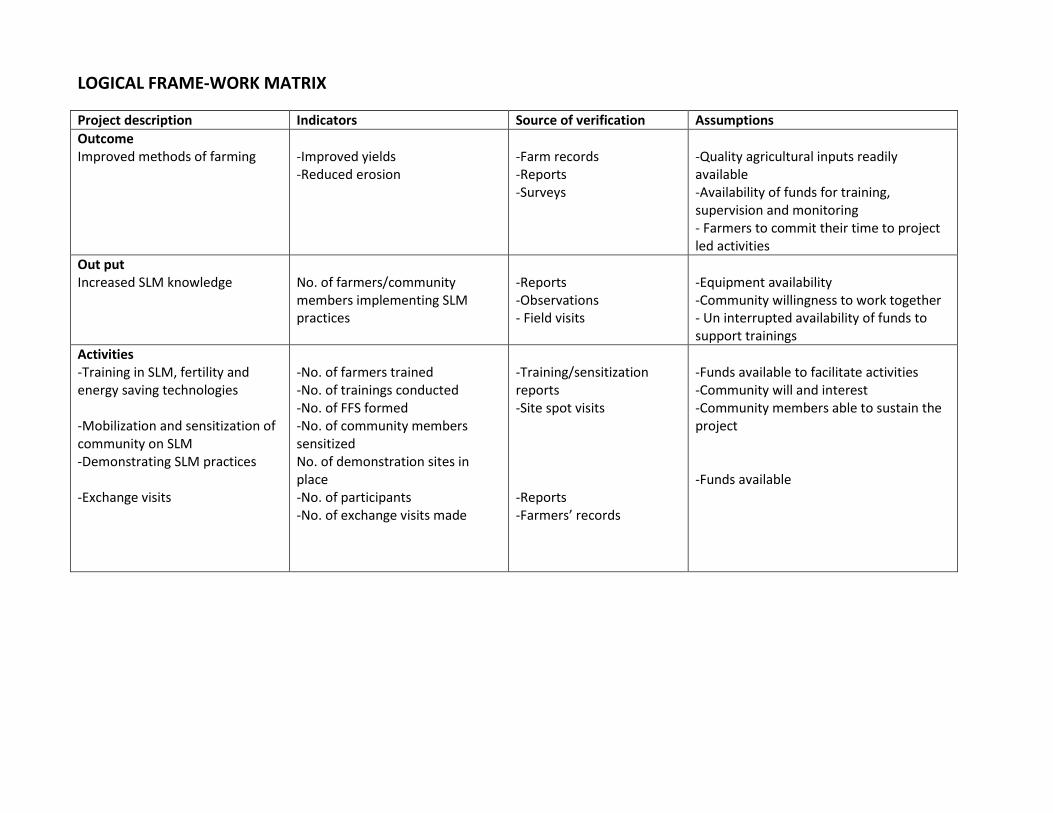
LOGICAL FRAME-WORK MATRIX
Project description Indicators Source of verification Assumptions
Outcome Improved methods of farming
-Improved yields -Reduced erosion
-Farm records -Reports -Surveys
-Quality agricultural inputs readily available -Availability of funds for training, supervision and monitoring - Farmers to commit their time to project led activities
Out put Increased SLM knowledge
No. of farmers/community members implementing SLM practices
-Reports -Observations - Field visits
-Equipment availability -Community willingness to work together - Un interrupted availability of funds to support trainings
Activities -Training in SLM, fertility and energy saving technologies -Mobilization and sensitization of community on SLM -Demonstrating SLM practices -Exchange visits
-No. of farmers trained -No. of trainings conducted -No. of FFS formed -No. of community members sensitized No. of demonstration sites in place -No. of participants -No. of exchange visits made
-Training/sensitization reports -Site spot visits -Reports -Farmers’ records
-Funds available to facilitate activities -Community will and interest -Community members able to sustain the project -Funds available
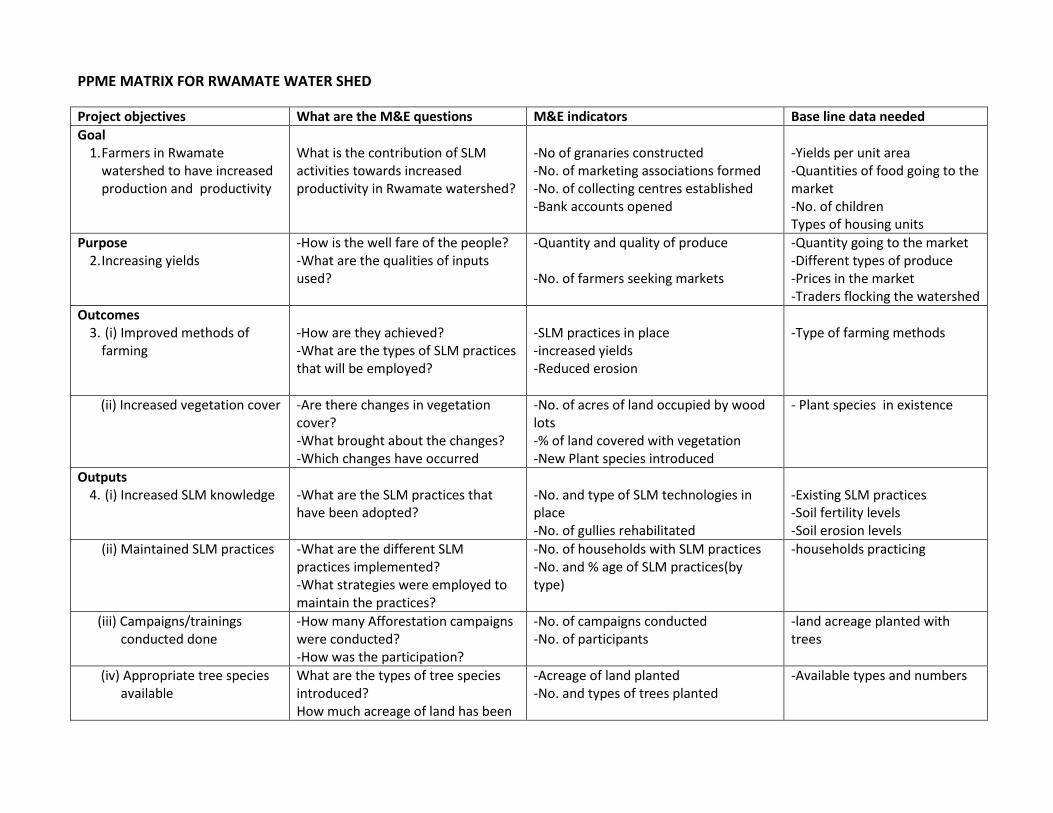
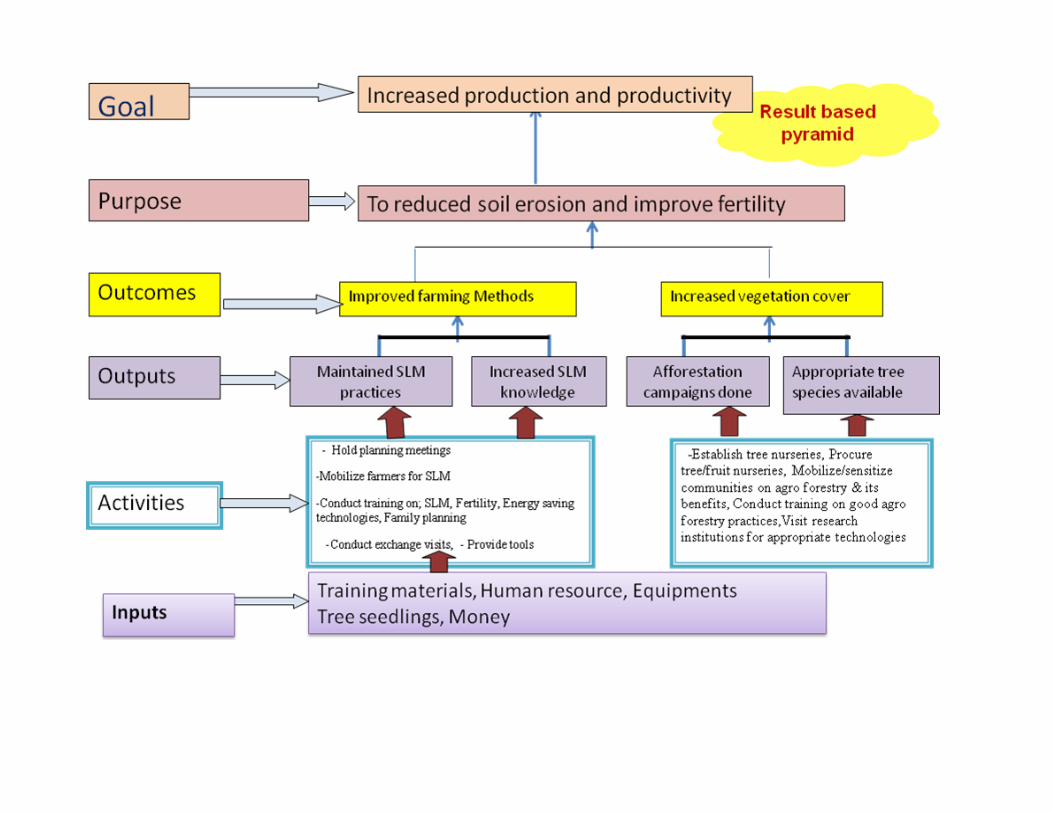
PPME MATRIX FOR RWAMATE WATER SHED
Project objectives What are the M&E questions M&E indicators Base line data needed
Goal 1. Farmers in Rwamate
watershed to have increased production and productivity
What is the contribution of SLM activities towards increased productivity in Rwamate watershed?
-No of granaries constructed -No. of marketing associations formed -No. of collecting centres established -Bank accounts opened
-Yields per unit area -Quantities of food going to the market -No. of children Types of housing units
Purpose 2. Increasing yields
-How is the well fare of the people? -What are the qualities of inputs used?
-Quantity and quality of produce -No. of farmers seeking markets
-Quantity going to the market -Different types of produce -Prices in the market -Traders flocking the watershed
Outcomes 3. (i) Improved methods of
farming
-How are they achieved? -What are the types of SLM practices that will be employed?
-SLM practices in place -increased yields -Reduced erosion
-Type of farming methods
(ii) Increased vegetation cover -Are there changes in vegetation cover? -What brought about the changes? -Which changes have occurred
-No. of acres of land occupied by wood lots -% of land covered with vegetation -New Plant species introduced
- Plant species in existence
Outputs 4. (i) Increased SLM knowledge
-What are the SLM practices that have been adopted?
-No. and type of SLM technologies in place -No. of gullies rehabilitated
-Existing SLM practices -Soil fertility levels -Soil erosion levels
(ii) Maintained SLM practices
-What are the different SLM practices implemented? -What strategies were employed to maintain the practices?
-No. of households with SLM practices -No. and % age of SLM practices(by type)
-households practicing
(iii) Campaigns/trainings conducted done
-How many Afforestation campaigns were conducted? -How was the participation?
-No. of campaigns conducted -No. of participants
-land acreage planted with trees
(iv) Appropriate tree species available
What are the types of tree species introduced? How much acreage of land has been
-Acreage of land planted -No. and types of trees planted
-Available types and numbers
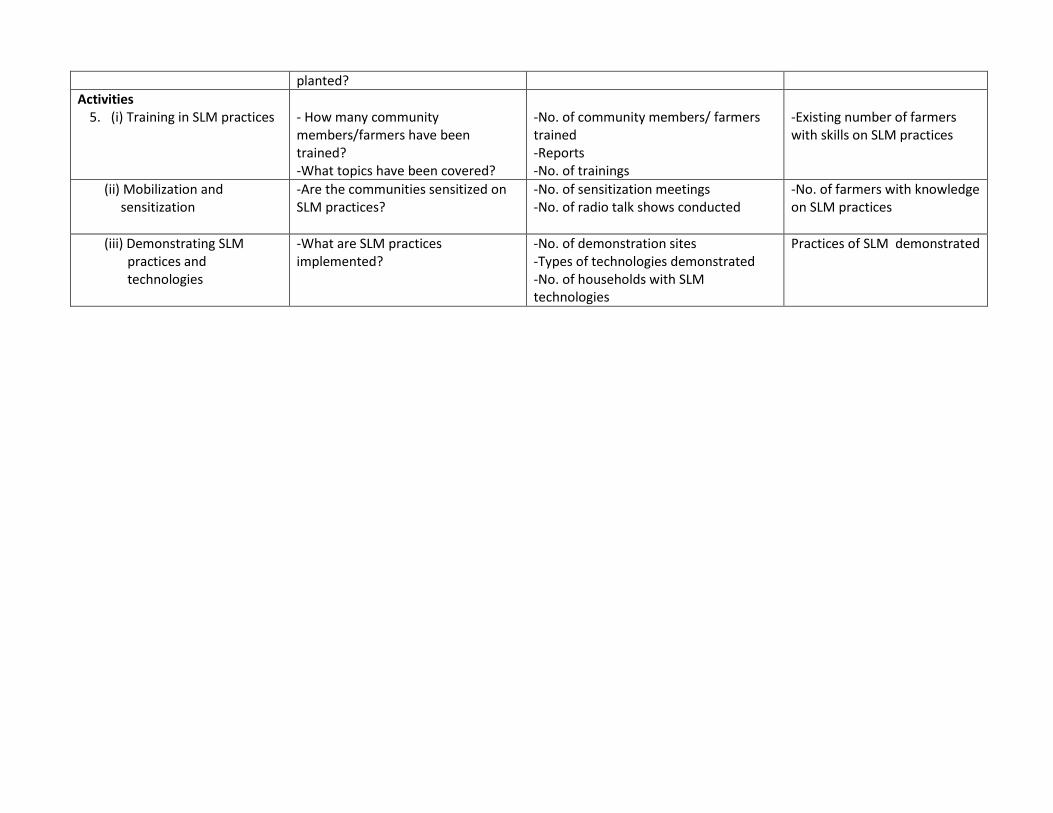
planted?
Activities 5. (i) Training in SLM practices
- How many community members/farmers have been trained? -What topics have been covered?
-No. of community members/ farmers trained -Reports -No. of trainings
-Existing number of farmers with skills on SLM practices
(ii) Mobilization and sensitization
-Are the communities sensitized on SLM practices?
-No. of sensitization meetings -No. of radio talk shows conducted
-No. of farmers with knowledge on SLM practices
(iii) Demonstrating SLM practices and technologies
-What are SLM practices implemented?
-No. of demonstration sites -Types of technologies demonstrated -No. of households with SLM technologies
Practices of SLM demonstrated
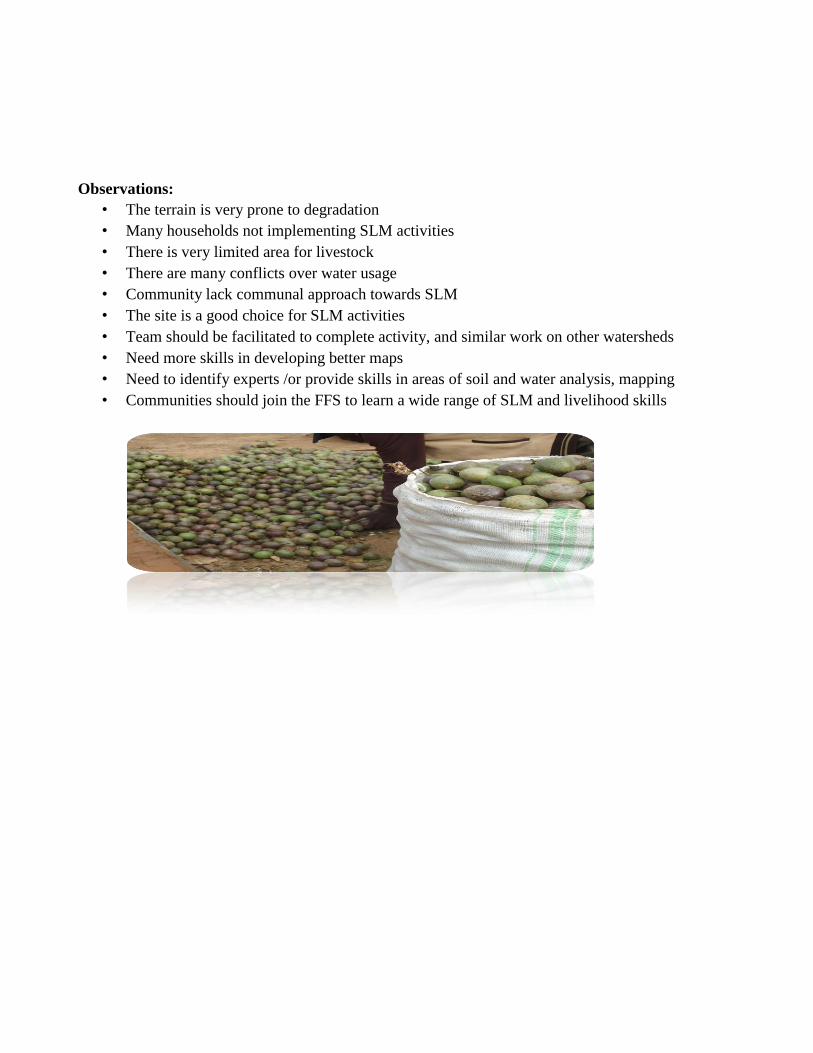
Observations:
• The terrain is very prone to degradation
• Many households not implementing SLM activities
• There is very limited area for livestock
• There are many conflicts over water usage
• Community lack communal approach towards SLM
• The site is a good choice for SLM activities
• Team should be facilitated to complete activity, and similar work on other watersheds
• Need more skills in developing better maps
• Need to identify experts /or provide skills in areas of soil and water analysis, mapping
• Communities should join the FFS to learn a wide range of SLM and livelihood skills