Embed Size (px)
Citation preview
MINNEAPOLIS | BOSTON | CHICAGO | HOUSTON | LONDON | LOS ANGELES | NEW YORK | SAN FRANCISCO | ZÜRICH
Piper JaffraySoftware Activity Update Third Quarter 2017
Marc SteifmanCo-Head of Technology Investment BankingPiper Jaffray & Co.
Michael KimCo-Head of Technology Investment BankingPiper Jaffray & Co.

2PIPER JAFFRAY
Piper Jaffray Software Team Overview
Global Reach
Our firm consists of 1,300+ professionals in 59 offices globally including Minneapolis (HQ), San Francisco, Charlotte, New York,
Chicago, Seattle, Boston, Aberdeen, London, Hong Kong and Zürich
Technology Office Locations: San Francisco, CA Minneapolis, MNBoston, MA
25 investment bankers focused on Software, Financial Technology, Tech-Enabled
Services, BPO and Internet & Digital Media
Recent Transactions
Technology TeamMichael Kim
Co-Head of Technology Investment BankingApplication Software
Marc SteifmanCo-Head of Technology
Investment BankingInfrastructure & Security Software
Peter LombardManaging Director
Head of Technology Mergers & [email protected]
Garin ArevianManaging Director
Vertical Applications & Tech-Enabled [email protected]
Jason Harkness Managing Director
Digital Media and Related [email protected]
Andy LivadariuManaging Director
Application [email protected]
Jason MylerManaging Director
Vertical Applications & Tech-Enabled [email protected]
Steven SchmidtManaging Director
Financial and Application [email protected]
Greg KlancherPrincipal
Infrastructure & Security [email protected]
Domestic Expertise
Undisclosed
Buy-Side Advisor
has acquired a majority stake in
Sell-Side Advisor
Undisclosed
has been acquired by
$132,825,00
Co-Manager
Initial Public Offering
Co-Manager
Initial Public Offering
$254,150,000
Co-Manager
has been acquired by
$120,000,000
Sell-Side Advisor
Undisclosed
has been acquired by
Sell-Side Advisor
$109,167,123
Follow-On Offering
Joint Bookrunner
has acquired
Undisclosed
Buy-Side AdvisorLead Bookrunner
Follow-OnOffering
$107,036,250
Initial Public Offering
$273,608,000
Co-Manager
Sell-Side Advisor
Undisclosed
has been acquired by
Co-Manager
Initial Public Offering
$67,004,00
has been acquired by
Sell-Side Advisor
Undisclosed
has been acquired by
Undisclosed
Sell-Side Advisor
has purchased a majority stake in
Undisclosed
Buy-Side Advisor

3PIPER JAFFRAY
Leading Industry Conferences and Events
30 senior representatives from leading software and internet companies, venture capital and private equity firms focused on the technology and business services sectors
Technology Ski SummitJanuary 9–11, 2018 | Aspen, CO
15 of the highest growth late-stage private technology companies had their own suite at the Rosewood Sand Hill as 15 of the top public and crossover investors visit for one-on-one’s
Silicon Valley Technology Crossover Investor SummitMay 18, 2017 | Menlo Park, CA
Technology SelectSeptember 5–6, 2017 | Laguna Niguel, CA
30+ of the most notable public technology companies will be paired with major institutional investors in one-on-one meetings providing direct insights and feedback
50+ leading privately held software and internet companies and 100+ leading technology growth equity and strategic investors meet for one-on-one meetings attended by CEO's/CFO's and investors
Technology Growth EquityOctober 4, 2017 | New York, NY
4PIPER JAFFRAY
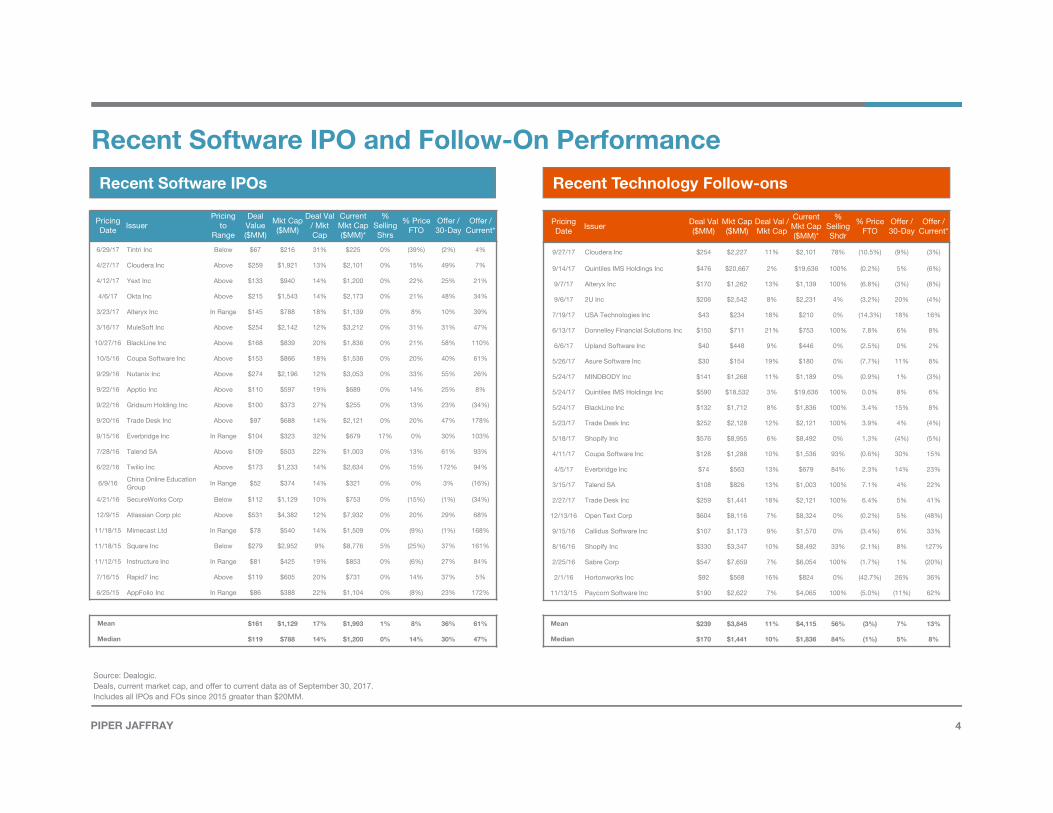
Recent Software IPO and Follow-On Performance
Recent Technology Follow-onsRecent Software IPOs
PricingDate
IssuerDeal Val ($MM)
Mkt Cap ($MM)
Deal Val /Mkt Cap
CurrentMkt Cap ($MM)*
% SellingShdr
% Price FTO
Offer /30-Day
Offer /Current*
9/27/17 Cloudera Inc $254 $2,227 11% $2,101 78% (10.5%) (9%) (3%)
9/14/17 Quintiles IMS Holdings Inc $476 $20,667 2% $19,636 100% (0.2%) 5% (6%)
9/7/17 Alteryx Inc $170 $1,262 13% $1,139 100% (6.8%) (3%) (8%)
9/6/17 2U Inc $206 $2,542 8% $2,231 4% (3.2%) 20% (4%)
7/19/17 USA Technologies Inc $43 $234 18% $210 0% (14.3%) 18% 16%
6/13/17 Donnelley Financial Solutions Inc $150 $711 21% $753 100% 7.8% 6% 8%
6/6/17 Upland Software Inc $40 $448 9% $446 0% (2.5%) 0% 2%
5/26/17 Asure Software Inc $30 $154 19% $180 0% (7.7%) 11% 8%
5/24/17 MINDBODY Inc $141 $1,268 11% $1,189 0% (0.9%) 1% (3%)
5/24/17 Quintiles IMS Holdings Inc $590 $18,532 3% $19,636 100% 0.0% 8% 6%
5/24/17 BlackLine Inc $132 $1,712 8% $1,836 100% 3.4% 15% 8%
5/23/17 Trade Desk Inc $252 $2,128 12% $2,121 100% 3.9% 4% (4%)
5/18/17 Shopify Inc $576 $8,955 6% $8,492 0% 1.3% (4%) (5%)
4/11/17 Coupa Software Inc $128 $1,288 10% $1,536 93% (0.6%) 30% 15%
4/5/17 Everbridge Inc $74 $563 13% $679 84% 2.3% 14% 23%
3/15/17 Talend SA $108 $826 13% $1,003 100% 7.1% 4% 22%
2/27/17 Trade Desk Inc $259 $1,441 18% $2,121 100% 6.4% 5% 41%
12/13/16 Open Text Corp $604 $8,116 7% $8,324 0% (0.2%) 5% (48%)
9/15/16 Callidus Software Inc $107 $1,173 9% $1,570 0% (3.4%) 6% 33%
8/16/16 Shopify Inc $330 $3,347 10% $8,492 33% (2.1%) 8% 127%
2/25/16 Sabre Corp $547 $7,659 7% $6,054 100% (1.7%) 1% (20%)
2/1/16 Hortonworks Inc $92 $568 16% $824 0% (42.7%) 26% 36%
11/13/15 Paycom Software Inc $190 $2,622 7% $4,065 100% (5.0%) (11%) 62%
Mean $239 $3,845 11% $4,115 56% (3%) 7% 13%
Median $170 $1,441 10% $1,836 84% (1%) 5% 8%
PricingDate
IssuerPricing
to Range
Deal Value ($MM)
Mkt Cap ($MM)
Deal Val / Mkt Cap
CurrentMkt Cap ($MM)*
% Selling Shrs
% Price FTO
Offer /30-Day
Offer /Current*
6/29/17 Tintri Inc Below $67 $216 31% $225 0% (39%) (2%) 4%
4/27/17 Cloudera Inc Above $259 $1,921 13% $2,101 0% 15% 49% 7%
4/12/17 Yext Inc Above $133 $940 14% $1,200 0% 22% 25% 21%
4/6/17 Okta Inc Above $215 $1,543 14% $2,173 0% 21% 48% 34%
3/23/17 Alteryx Inc In Range $145 $788 18% $1,139 0% 8% 10% 39%
3/16/17 MuleSoft Inc Above $254 $2,142 12% $3,212 0% 31% 31% 47%
10/27/16 BlackLine Inc Above $168 $839 20% $1,836 0% 21% 58% 110%
10/5/16 Coupa Software Inc Above $153 $866 18% $1,536 0% 20% 40% 61%
9/29/16 Nutanix Inc Above $274 $2,196 12% $3,053 0% 33% 55% 26%
9/22/16 Apptio Inc Above $110 $597 19% $689 0% 14% 25% 8%
9/22/16 Gridsum Holding Inc Above $100 $373 27% $255 0% 13% 23% (34%)
9/20/16 Trade Desk Inc Above $97 $688 14% $2,121 0% 20% 47% 178%
9/15/16 Everbridge Inc In Range $104 $323 32% $679 17% 0% 30% 103%
7/28/16 Talend SA Above $109 $503 22% $1,003 0% 13% 61% 93%
6/22/16 Twilio Inc Above $173 $1,233 14% $2,634 0% 15% 172% 94%
6/9/16China Online Education Group
In Range $52 $374 14% $321 0% 0% 3% (16%)
4/21/16 SecureWorks Corp Below $112 $1,129 10% $753 0% (15%) (1%) (34%)
12/9/15 Atlassian Corp plc Above $531 $4,382 12% $7,932 0% 20% 29% 68%
11/18/15 Mimecast Ltd In Range $78 $540 14% $1,509 0% (9%) (1%) 168%
11/18/15 Square Inc Below $279 $2,952 9% $8,776 5% (25%) 37% 161%
11/12/15 Instructure Inc In Range $81 $425 19% $853 0% (6%) 27% 84%
7/16/15 Rapid7 Inc Above $119 $605 20% $731 0% 14% 37% 5%
6/25/15 AppFolio Inc In Range $86 $388 22% $1,104 0% (8%) 23% 172%
Mean $161 $1,129 17% $1,993 1% 8% 36% 61%
Median $119 $788 14% $1,200 0% 14% 30% 47%
Source: Dealogic.Deals, current market cap, and offer to current data as of September 30, 2017.Includes all IPOs and FOs since 2015 greater than $20MM.

5PIPER JAFFRAY
SUB-SECTOR
SaaS High Growth
CRM / Marketing
Human Capital Management
BI / Data Analytics
Infrastructure / IT Management
Contact Center
Moderate Growth SaaS
Large-Cap Technology
Security Software
HR Outsourcing
Software Stock PerformancePerformance in LTM Period and YTD Period – By Sub-Sector
Source: Capital IQ.Note: LTM Date between 9/30/16 and 9/30/17. YTD data between 1/3/17 and 9/30/17.
SUB-SECTOR
CRM / Marketing
Moderate Growth SaaS
SaaS High Growth
Infrastructure / IT Management
HR Outsourcing
Contact Center
Large-Cap Technology
BI / Data Analytics
Security Software
Human Capital Management
LTM PerformanceYTD Performance
11.7%
16.6%
17.6%
19.6%
20.0%
26.5%
31.0%
33.6%
34.2%
35.5%
11.6%
12.7%
19.7%
9.9%
12.6%
16.5%
16.7%
17.0%
21.1%
21.4%
24.6%
24.7%
29.1%
16.2%
22.3%
22.4%

6PIPER JAFFRAY
IPO Valuation Breakpoint Analysis 2014 – 2017 YTD, At Pricing
Source: Capital IQ.
Forward Year Revenue Growth vs. Revenue Multiple
$ in millions
Summary Statistics - Software IPOs 2014-2017 YTD
Metric Median Median Median Median
Growth Profile: Less than 20% 20.0% - 30.0% 30.0% - 40.0% Greater than 40.0%
Number of Deals 4 17 17 11
Operating Metrics:
LTM Revenue $222.9 $91.6 $117.0 $65.1
MRQ Revenue $56.5 $27.9 $35.7 $25.4
LTM Gross Margin 65.5% 65.3% 72.7% 62.4%
LTM EBITDA $67.2 ($24.2) ($23.6) ($42.6)
LTM EBITDA Margin 18.7% (17.8%) (24.9%) (38.9%)
MRQ EBITDA $14.9 ($6.8) ($6.2) ($9.5)
CAC Ratio 0.78 0.48 0.70 0.51
Pricing Statistics:
Forward Year Rev. Multiple 4.3x 3.7x 5.8x 5.6x
% Change from Offer to:
One Day 15.7% 30.6% 22.4% 49.2%
One Month 12.8% 28.9% 29.4% 43.8%
Current (09/30/2017) (38.9%) 33.1% 76.3% 39.9%
4.3x3.7x
5.8x 5.6x
0.0x
1.0x
2.0x
3.0x
4.0x
5.0x6.0x
7.0x
Less than 20% 20.0% - 30.0% 30.0% - 40.0% Greater than 40.0%
Forw
ard
Year
Rev
enue
M
ultip
le
Forward Year Revenue Growth
7PIPER JAFFRAY
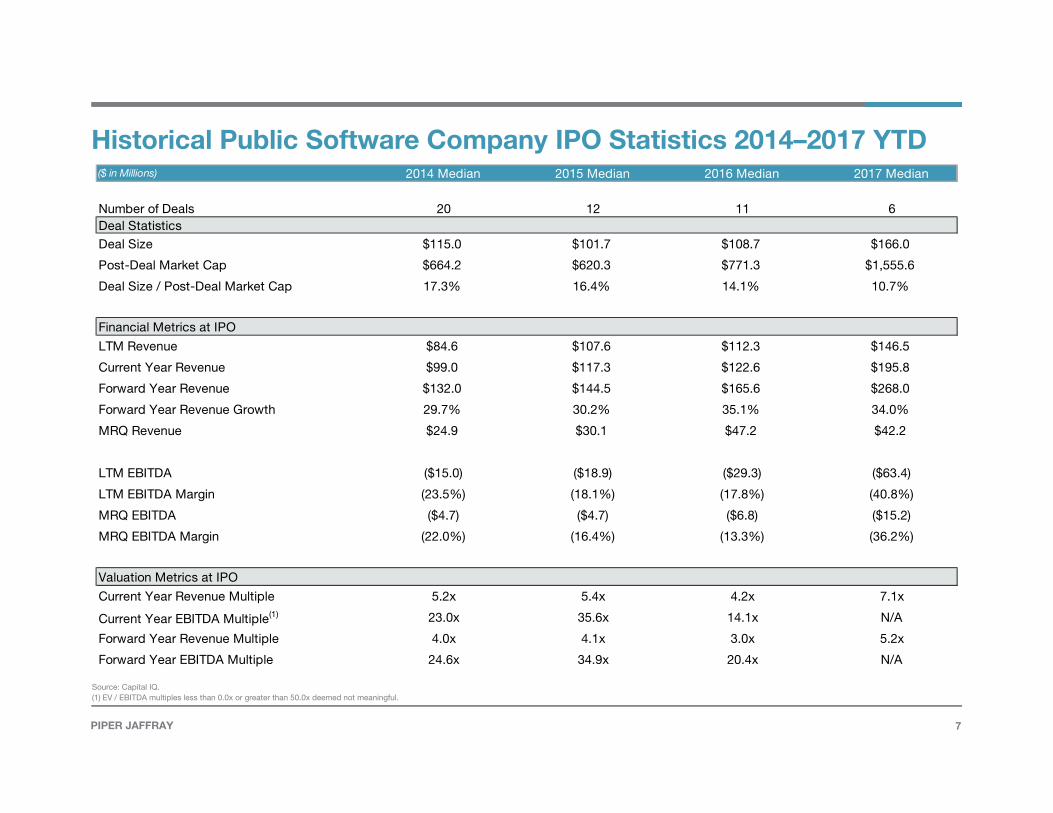
Historical Public Software Company IPO Statistics 2014–2017 YTD
Source: Capital IQ.(1) EV / EBITDA multiples less than 0.0x or greater than 50.0x deemed not meaningful.
($ in Millions) 2014 Median 2015 Median 2016 Median 2017 Median
Number of Deals 20 12 11 6Deal StatisticsDeal Size $115.0 $101.7 $108.7 $166.0
Post-Deal Market Cap $664.2 $620.3 $771.3 $1,555.6
Deal Size / Post-Deal Market Cap 17.3% 16.4% 14.1% 10.7%
Financial Metrics at IPO
LTM Revenue $84.6 $107.6 $112.3 $146.5
Current Year Revenue $99.0 $117.3 $122.6 $195.8
Forward Year Revenue $132.0 $144.5 $165.6 $268.0
Forward Year Revenue Growth 29.7% 30.2% 35.1% 34.0%
MRQ Revenue $24.9 $30.1 $47.2 $42.2
LTM EBITDA ($15.0) ($18.9) ($29.3) ($63.4)
LTM EBITDA Margin (23.5%) (18.1%) (17.8%) (40.8%)
MRQ EBITDA ($4.7) ($4.7) ($6.8) ($15.2)
MRQ EBITDA Margin (22.0%) (16.4%) (13.3%) (36.2%)
Valuation Metrics at IPO
Current Year Revenue Multiple 5.2x 5.4x 4.2x 7.1x
Current Year EBITDA Multiple(1) 23.0x 35.6x 14.1x N/A
Forward Year Revenue Multiple 4.0x 4.1x 3.0x 5.2x
Forward Year EBITDA Multiple 24.6x 34.9x 20.4x N/A

8PIPER JAFFRAY
6.2% 6.7%
9.9% 10.9% 10.9%
12.1% 21.4%
23.8% 24.1%
28.5%
0.0% 10.0% 20.0% 30.0%
HR Outsourcing
Large-Cap Technology
Security
Business Intellgience / Data…
Contact Center
Moderate Growth SaaS
Infrastructure / IT Management
SaaS High Growth
Human Capital Management
CRM / Marketing
Comparable Public Software Comps (Valuation Metrics)
2017E EV/REV 2018E EV/REV
2017E Rev Growth 2018E Rev Growth
5.9% 7.1% 7.6%
9.3% 9.5%
10.9% 18.1% 19.1%
20.2% 22.4%
0.0% 10.0% 20.0% 30.0%
Large-Cap Technology
HR Outsourcing
Contact Center
Security
Moderate Growth SaaS
Business Intellgience / Data…
Infrastructure / IT Management
Human Capital Management
SaaS High Growth
CRM / Marketing
3.5x3.5x3.7x3.8x
4.4x4.9x5.1x
6.1x6.1x6.1x
0.0x 1.0x 2.0x 3.0x 4.0x 5.0x 6.0x 7.0x
HR Outsourcing
Contact Center
Moderate Growth SaaS
Security
Business Intellgience / Data…
Infrastructure / IT Management
Large-Cap Technology
CRM / Marketing
Human Capital Management
SaaS High Growth
3.2x3.2x3.4x
3.6x4.0x
4.4x4.8x4.9x
5.1x5.1x
0.0x 1.0x 2.0x 3.0x 4.0x 5.0x 6.0x
Contact Center
HR Outsourcing
Moderate Growth SaaS
Security
Business Intellgience / Data…
Infrastructure / IT Management
Large-Cap Technology
CRM / Marketing
SaaS High Growth
Human Capital Management
Source: Capital IQ.Note: Figures represent the median of each comparable group.

9PIPER JAFFRAY
SaaS Valuation FrameworkGiven the rapid maturity of the business model, free cash flow conversion combined with revenue growth provides a clearer understanding of valuation for SaaS companies
AVG EV/Rev7.9x
AVG Rev Growth + FCF Margin49.1%
AVG EV/Rev5.6x
AVG Rev Growth + FCF Margin30.2%
AVG EV/Rev2.6x
AVG Rev Growth + FCF Margin14.4%
Source: Capital IQ as of 9/30/2017, Thomson Reuters, Company Filings.*Piper Jaffray estimate using EBITDA as proxy for FCF.
AMBR APTI
BNFT
BV
DATA
ECOM
LPSN
MODN
SREV
CALD
CSOD
GWRE
HUBSTYL
ULTI ZENBLKB
BL
BOX
COUP
MB
NEWRPCTY
QTWO
TWLO
TWOU
ADBE
CRM
NOW
SPLK
WDAY
ELLI
PAYC
SHOP
TEAM
VEEV
HDP
y = 14.584x + 0.8819R² = 0.6597
0.0x
2.0x
4.0x
6.0x
8.0x
10.0x
12.0x
0% 10% 20% 30% 40% 50% 60% 70%
2018
E E
V /
Rev
enue
2018E FCF Margin + Revenue Growth

10PIPER JAFFRAY
Best & Worst Performing Software Stocks Top and Bottom 20 LTM Performers
Bottom 20 Performers Top 20 Performers
45.2%
45.9%
46.9%
48.5%
48.6%
48.9%
49.5%
52.1%
52.4%
55.3%
55.4%
55.9%
56.5%
56.7%
61.1%
76.5%
95.5%
103.0%
110.6%
140.2%
CBIZ, Inc.
HubSpot, Inc.
Check Point…
ServiceNow, Inc.
Mimecast Limited
VMware, Inc.
Paycom Software, Inc.
Parkit Enterprise Inc.
Five9, Inc.
RealPage, Inc.
TriNet Group
Datawatch Corporation
Talend SA
Everbridge Inc
LivePerson Inc.
RingCentral, Inc.
Pegasystems Inc.
HortonWorks
Trade Desk Inc
Upland Software
(8.1%)
(8.7%)
(9.6%)
(9.9%)
(11.1%)
(11.6%)
(12.5%)
(12.6%)
(15.7%)
(16.2%)
(17.3%)
(19.2%)
(20.4%)
(22.7%)
(23.7%)
(29.1%)
(30.6%)
(31.6%)
(39.5%)
(53.6%)
Akamai Technologies, Inc.
IBM
Palo Alto Networks, Inc.
Citrix Systems, Inc.
ChannelAdvisor Corporation
Cornerstone OnDemand, Inc.
8x8 Inc.
eGain Corporation
Benefitfocus, Inc.
Bazaarvoice, Inc.
CyberArk Software, Ltd.
Imperva Inc.
Amber Road, Inc.
SPS Commerce, Inc.
MicroStrategy Inc.
ServiceSource International, Inc.
Marin Software Incorporated
VASCO Data Security International Inc.
Nutanix
Twilio, Inc.
Source: Capital IQ.Note: LTM Date between 9/30/16 and 9/30/17.

11PIPER JAFFRAY
Cloudera, a Palo Alto, Calif.-based analytics software company, has raised $221 million during a follow-on offering at a price of $16.45 per share.
Quintiles IMS Holdings, a Durham, NC-based provider of technology-enabled healthcare services, has raised $476 million, during a follow-on offering at a price of $95.25 per share.
Alteryx, an Irvine, Calif.-based self-service data analytics software provider, has raised $170 million during a follow-on offering at a price of $21.25 per share.
Recent ReviewHighlighted Transaction Activity
Source: Public news releases, Pitchbook and CapitalIQ.
Mergers and Acquisitions
IPOs and Follow-Ons Private Placements
Ingersoll-Rand acquires GPSi Holdings from Falconhead Capital for an undisclosed amountThe transaction strengthens Ingersoll-Rand's telematics portfolio, an important component of its connected technologies strategy that measures critical performance characteristics such as temperature and air quality protecting the value of transported food, pharmaceuticals, and other cargo.
The Sage Group Acquires Intacct for $850 MMAs customer demand moves to the cloud and away from traditional monolithic ERP suites, the acquisition strengthens Sage’s position as providing a comprehensive Financial Management Solution from start-up to global enterprise, whilst integrating seamlessly with their other enterprise applications.
Via Transportation, an online platform that connects users with vehicle-sharing transportation providers in the United States, has raised $250 million in funding from moovel GmbH. The round values the company at $750 million and brings the total amount of funding to $386 million.
BlueteamGlobal, a provider of advanced cyber threat monitoring services, has raised $125 million in financing from institutional and individual investors.
Appboy, a provider of mobile marketing CRM and automation software solutions for marketers, has raised $50 million in Series D funding led by ICONIQ Capital.
JAMF Software receives majority investment from Vista Equity Partners for an undisclosed amountVista Equity Partners has invested in JAMF, which develops IT management software for Apple devices running macOS and iOS. The transaction will allow JAMF to accelerate its growth and innovation through focused investment and strategic acquisitions that drive its mission to help organizations manage Apple devices.
Waud Capital Acquires Anovia PaymentsAnovia Payments has formed a strategic partnership with Waud Capital Partners. The partnership will provide Anovia with additional capital accelerating the growth of the company further to extend its product verticals, expand its relationships with strategic partners, and provide additional technology solutions to customers.

12PIPER JAFFRAY
$11,957 $12,062
$23,829
$9,861$11,740
$13,482
$22,438
$15,304$18,421
$53,011
$33,046
$11,545 $11,374$8,709
$10,991
4.2x
7.0x
5.2x
10.5x
5.6x
4.5x5.0x
7.3x
4.7x 5.9x 6.1x
6.0x
7.8x
3.5x
3.5x
0.0x
2.0x
4.0x
6.0x
8.0x
10.0x
12.0x
$0
$10,000
$20,000
$30,000
$40,000
$50,000
$60,000
Q1 Q2 Q3 Q4 Q1 Q2 Q3 Q4 Q1 Q2 Q3 Q4 Q1 Q2 Q3
2014 2015 2016 2017
Total Deal Value Average EV / REV Multiple
Software M&A ActivityQ1 2014 – Q3 2017
Source: S&P Capital IQ.Note: Software transactions greater than 10 million USD in enterprise value.
# of Deals 48 55 48 45 47 54 50 49 29 42 38 33 31 39 30
( USD in millions)

13PIPER JAFFRAY
Public Target M&A Activity in SoftwareQ1 2014 – Q3 2017
Source: S&P Capital IQ.Note: Software transactions greater than 10 million USD in enterprise value.
( USD in millions)
$3,070
$6,775
$12,690
$2,957
$6,125 $5,807$6,967
$9,085
$11,721
$40,761
$26,207
$4,631
$1,160$2,478 $3,304
2.6x
6.2x6.7x
2.6x
4.4x
3.1x
4.9x
3.3x
5.0x
5.3x
4.9x
2.9x
2.4x
3.1x2.9x
0.0x
2.0x
4.0x
6.0x
8.0x
$0
$5,000
$10,000
$15,000
$20,000
$25,000
$30,000
$35,000
$40,000
$45,000
Q1 Q2 Q3 Q4 Q1 Q2 Q3 Q4 Q1 Q2 Q3 Q4 Q1 Q2 Q3
2014 2015 2016 2017
Total Deal Value Average EV / REV Multiple
# of Deals 7 7 7 8 6 11 10 12 6 18 13 6 8 5 5

14PIPER JAFFRAY
$8,887
$5,287
$11,139
$6,904
$5,615
$7,675
$15,472
$6,220 $6,700
$12,251
$6,839 $6,914
$10,214
$6,232
$7,687
4.6x
7.3x
4.9x
13.4x
6.0x
5.0x 5.0x
9.3x
4.6x
6.5x
7.2x 7.0x 8.3x
3.6x
3.7x
0.0x
2.0x
4.0x
6.0x
8.0x
10.0x
12.0x
14.0x
$0
$2,000
$4,000
$6,000
$8,000
$10,000
$12,000
$14,000
$16,000
$18,000
Q1 Q2 Q3 Q4 Q1 Q2 Q3 Q4 Q1 Q2 Q3 Q4 Q1 Q2 Q3
2014 2015 2016 2017
Total Deal Value Average EV / REV Multiple
Private Target M&A Activity in SoftwareQ1 2014 – Q3 2017
Source: S&P Capital IQ.Note: Software transactions greater than 10 million USD in enterprise value.
( USD in millions)
# of Deals 41 58 41 37 41 43 40 37 23 24 25 27 23 34 25

15PIPER JAFFRAY
# of Deals 33 43 38 35 40 33 31 36 24 29 22 29 20 11 14
Strategic Public Acquirer M&A Activity in SoftwareQ1 2014 – Q3 2017
Source: S&P Capital IQ.Note: Software transactions greater than 10 million USD in enterprise value.
Notable Recent Announced Transactions ($ millions)
Acquirer
Target
Announced Date 7/28/16 11/10/16 11/20/16 1/24/17 3/7/17 4/18/17 7/25/2017
Deal Amount $9,300 540 $2,334 $3,700 $614 $850 $850
EV / LTM REV 10.8x 2.5x 3.5x 17.4x 5.6x 13.3x 9.7x
( USD in millions)
$6,722$9,583
$19,764
$5,289$8,247
$6,348
$11,302$7,040
$17,689
$40,912
$21,282
$9,935 $8,321
$1,582$5,076
4.9x
6.6x
5.2x
10.0x
6.4x5.9x
4.9x
9.1x
4.7x
6.9x
10.8x
6.0x
9.3x
6.0x
4.4x
0.0x
2.0x
4.0x
6.0x
8.0x
10.0x
12.0x
$0
$10,000
$20,000
$30,000
$40,000
$50,000
Q1 Q2 Q3 Q4 Q1 Q2 Q3 Q4 Q1 Q2 Q3 Q4 Q1 Q2 Q3
2014 2015 2016 2017
Total Deal Value Average EV / REV Multiple

16PIPER JAFFRAY
# of Deals 8 7 6 5 5 12 9 8 4 10 8 2 4 15 3
Private Equity M&A Activity in SoftwareQ1 2014 – Q3 2017
Source: S&P Capital IQ.Note: Software transactions greater than 10 million USD in enterprise value.
Notable Recent Announced Transactions ($ millions)
Acquirer
Target
AnnouncedDate 6/1/16 6/7/16 7/13/16 8/31/16 9/7/16 1/3/17 1/19/17 5/30/17
Deal Amount $509 $3,000 $544 $1,400 $2,200 $1,150 $800 $564
EV / LTM REV 3.5x 4.2x 4.4x 3.3x 6.8x 2.6x 4.6x 5.9x
( USD in millions)
$4,795
$2,360$3,600 $3,982 $3,388 $2,870
$9,543
$7,827
$722
$11,434
$8,778
$1,150
$2,586
$5,716
$2,269
1.7x
8.0x
4.6x
3.0x3.8x 3.6x
3.7x 4.3x 4.3x
3.1x
7.9x
3.6x
2.7x 0.9x
0.0x
2.0x
4.0x
6.0x
8.0x
10.0x
$0
$2,000
$4,000
$6,000
$8,000
$10,000
$12,000
$14,000
Q1 Q2 Q3 Q4 Q1 Q2 Q3 Q4 Q1 Q2 Q3 Q4 Q1 Q2 Q3
2014 2015 2016 2017
Total Deal Value Average EV / REV Multiple

17PIPER JAFFRAY
Private Placement ActivitySoftware Private VC / PE Summary: Q1 2014 – Q3 2017
Source: S&P Capital IQ.
( USD in millions)
$2,810
$4,337
$1,407
$2,111
$5,883
$1,589
$3,320
$2,097
$3,306
$4,963
$2,695
$1,816$1,573
$3,953
$2,784
112
133121
145
136
164 161
143151
143133
121
168
196 200
0
50
100
150
200
250
$0
$1,000
$2,000
$3,000
$4,000
$5,000
$6,000
$7,000
Q1 Q2 Q3 Q4 Q1 Q2 Q3 Q4 Q1 Q2 Q3 Q4 Q1 Q2 Q3
2014 2015 2016 2017
Total Deal Value Total # of Deals

Appendix
19PIPER JAFFRAY
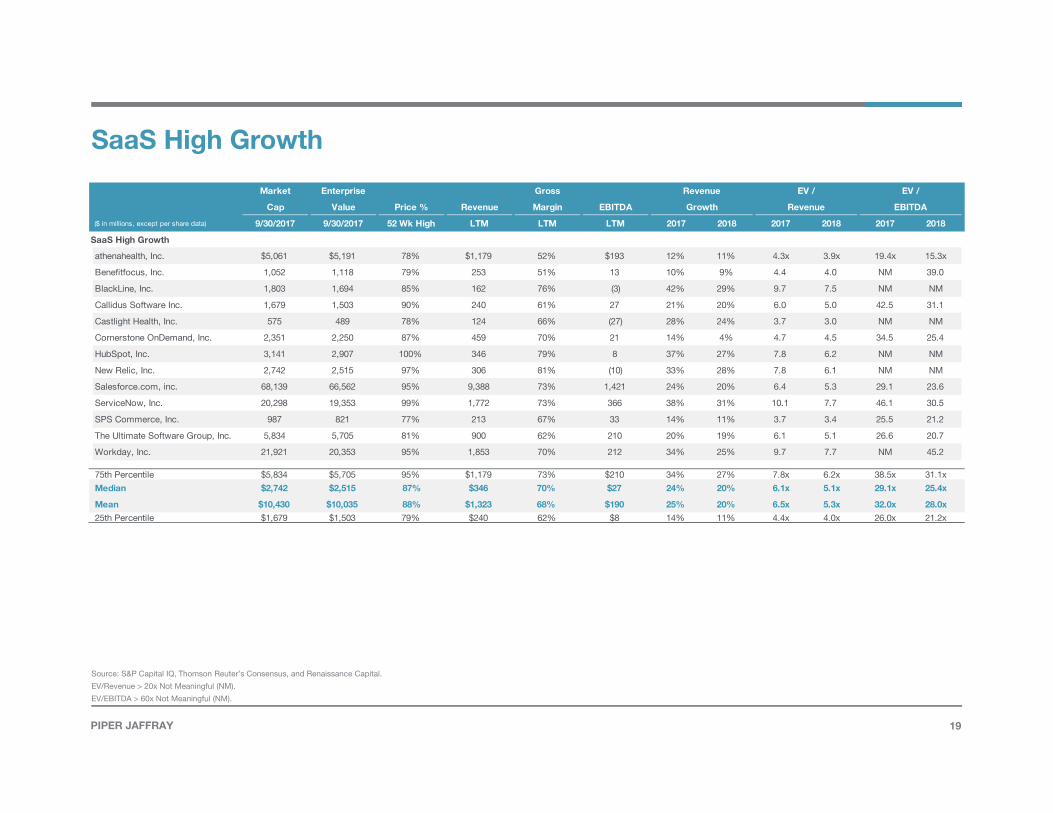
SaaS High Growth
Source: S&P Capital IQ, Thomson Reuter’s Consensus, and Renaissance Capital.
EV/Revenue > 20x Not Meaningful (NM).
EV/EBITDA > 60x Not Meaningful (NM).
Market Enterprise Gross Revenue EV / EV /
Cap Value Price % Revenue Margin EBITDA Growth Revenue EBITDA
($ in millions, except per share data) 9/30/2017 9/30/2017 52 Wk High LTM LTM LTM 2017 2018 2017 2018 2017 2018
SaaS High Growth
athenahealth, Inc. $5,061 $5,191 78% $1,179 52% $193 12% 11% 4.3x 3.9x 19.4x 15.3x
Benefitfocus, Inc. 1,052 1,118 79% 253 51% 13 10% 9% 4.4 4.0 NM 39.0
BlackLine, Inc. 1,803 1,694 85% 162 76% (3) 42% 29% 9.7 7.5 NM NM
Callidus Software Inc. 1,679 1,503 90% 240 61% 27 21% 20% 6.0 5.0 42.5 31.1
Castlight Health, Inc. 575 489 78% 124 66% (27) 28% 24% 3.7 3.0 NM NM
Cornerstone OnDemand, Inc. 2,351 2,250 87% 459 70% 21 14% 4% 4.7 4.5 34.5 25.4
HubSpot, Inc. 3,141 2,907 100% 346 79% 8 37% 27% 7.8 6.2 NM NM
New Relic, Inc. 2,742 2,515 97% 306 81% (10) 33% 28% 7.8 6.1 NM NM
Salesforce.com, inc. 68,139 66,562 95% 9,388 73% 1,421 24% 20% 6.4 5.3 29.1 23.6
ServiceNow, Inc. 20,298 19,353 99% 1,772 73% 366 38% 31% 10.1 7.7 46.1 30.5
SPS Commerce, Inc. 987 821 77% 213 67% 33 14% 11% 3.7 3.4 25.5 21.2
The Ultimate Software Group, Inc. 5,834 5,705 81% 900 62% 210 20% 19% 6.1 5.1 26.6 20.7
Workday, Inc. 21,921 20,353 95% 1,853 70% 212 34% 25% 9.7 7.7 NM 45.2
75th Percentile $5,834 $5,705 95% $1,179 73% $210 34% 27% 7.8x 6.2x 38.5x 31.1x
Median $2,742 $2,515 87% $346 70% $27 24% 20% 6.1x 5.1x 29.1x 25.4x
Mean $10,430 $10,035 88% $1,323 68% $190 25% 20% 6.5x 5.3x 32.0x 28.0x
25th Percentile $1,679 $1,503 79% $240 62% $8 14% 11% 4.4x 4.0x 26.0x 21.2x

20PIPER JAFFRAY
Moderate Growth SaaS
Source: S&P Capital IQ, Thomson Reuter’s Consensus, and Renaissance Capital
EV/Revenue > 20x Not Meaningful (NM).
EV/EBITDA > 60x Not Meaningful (NM).
Market Enterprise Gross Revenue EV / EV /
Cap Value Price % Revenue Margin EBITDA Growth Revenue EBITDA
($ in millions, except per share data) 9/30/2017 9/30/2017 52 Wk High LTM LTM LTM 2017 2018 2017 2018 2017 2018
Moderate Growth SaaS
Amber Road, Inc. $211 $225 62% $78 52% ($4) 8% 10% 2.9x 2.6x NM NM
Bazaarvoice, Inc. 419 362 81% 203 62% 14 1% 6% 1.8 1.7 21.8 13.7
ChannelAdvisor Corporation 306 252 73% 120 78% 6 8% 9% 2.1 1.9 NM 36.8
Guidewire Software, Inc. 5,899 5,201 96% 514 63% 119 15% 28% 10.0 7.8 NM 35.7
j2 Global, Inc. 3,585 4,181 81% 1,053 84% 422 28% 6% 3.7 3.5 9.0 8.1
LivePerson, Inc. 798 742 96% 218 73% 18 (2%) 8% 3.4 3.2 40.6 34.2
LogMeIn, Inc. 5,899 5,623 89% 802 80% 257 204% 14% 5.5 4.8 15.2 12.4
Marin Software Incorporated 69 41 64% 80 59% (10) NA NA NA NA NA NA
RealPage, Inc. 3,302 3,497 91% 632 59% 134 18% 19% 5.2 4.4 21.7 17.1
RingCentral, Inc. 3,229 3,057 97% 465 76% 27 31% 24% 6.1 5.0 NM NM
ServiceSource International, Inc. 312 274 55% 242 32% 9 (7%) 3% 1.2 1.1 17.6 11.4
WageWorks, Inc. 2,444 1,796 75% 462 63% 125 32% 10% 3.7 3.4 12.3 10.8
Zix Corporation 270 237 73% 64 81% 17 9% 8% 3.6 3.4 13.0 10.9
75th Percentile $3,302 $3,497 91% $514 78% $125 29% 15% 5.3x 4.5x 21.7x 30.0x
Median $798 $742 81% $242 63% $18 12% 10% 3.7x 3.4x 16.4x 13.1x
Mean $2,057 $1,961 80% $380 66% $87 29% 12% 4.1x 3.6x 18.9x 19.1x
25th Percentile $306 $252 73% $120 59% $9 6% 7% 2.7x 2.4x 21.7x 11.0x

21PIPER JAFFRAY
Business Intelligence / Data Analytics
Source: S&P Capital IQ, Thomson Reuter’s Consensus, and Renaissance Capital.
EV/Revenue > 20x Not Meaningful (NM).
EV/EBITDA > 60x Not Meaningful (NM).
Market Enterprise Gross Revenue EV / EV /
Cap Value Price % Revenue Margin EBITDA Growth Revenue EBITDA
($ in millions, except per share data) 9/30/2017 9/30/2017 52 Wk High LTM LTM LTM 2017 2018 2017 2018 2017 2018
Business Intelligence / Data Analytics
Alteryx, Inc. $1,205 $1,022 85% $118 83% ($11) 50% 36% 7.9x 5.8x NM NM
Cegedim SA 526 784 95% $532 46% 39 7% 6% 1.4x 1.4x 9.4x 7.9x
Datawatch Corporation 141 111 96% $36 88% (1) 14% 18% 3.1x 2.6x NM NA
Inovalon Holdings, Inc. 2,488 2,206 96% $431 65% 89 6% 10% 4.9x 4.4x 20.0x 17.8x
MicroStrategy Incorporated 1,469 822 62% 507 81% 111 (3%) 1% 1.6 1.6 8.0 12.0
Splunk Inc. 9,300 8,292 95% 1,074 79% 96 28% 26% 6.8 5.4 NM 40.4
Tableau Software, Inc. 5,972 4,983 98% 878 87% 91 5% 9% 5.7 5.3 NM NM
The Descartes Systems Group Inc 2,058 2,011 96% 216 73% 77 15% 12% 8.6 7.7 25.0 21.5
Verint Systems Inc. 2,667 3,038 94% 1,091 63% 166 7% 6% 2.7 2.5 11.7 10.2
Workiva Inc. 874 816 99% 200 71% (17) 16% 14% 4.0 3.5 NM NM
75th Percentile $2,622 $2,830 96% $792 83% $95 15% 17% 6.6x 5.4x 20.0x 20.6x
Median $1,763 $1,516 96% $469 76% $83 11% 11% 4.4x 4.0x 11.7x 14.9x
Mean $2,669.98 $2,408 92% $508 74% $64 15% 14% 4.7x 4.0x 14.8x 18.3x
25th Percentile $957 $818 94% $204 66% $9 6% 6% 2.8x 2.5x 9.4x 10.6x

22PIPER JAFFRAY
Infrastructure / IT Management
Source: S&P Capital IQ, Thomson Reuter’s Consensus, and Renaissance Capital.
EV/Revenue > 20x Not Meaningful (NM).
EV/EBITDA > 60x Not Meaningful (NM).
Market Enterprise Gross Revenue EV / EV /
Cap Value Price % Revenue Margin EBITDA Growth Revenue EBITDA
($ in millions, except per share data) 9/30/2017 9/30/2017 52 Wk High LTM LTM LTM 2017 2018 2017 2018 2017 2018
Infrastructure / IT Management
Atlassian Corporation Plc $8,088 $7,475 90% $677 80% $127 35% 33% 10.4x 7.8x 43.6x 27.8x
Box, Inc. $2,584 $2,502 92% $453 73% ($27) 27% 23% 5.0x 4.0x NM NM
CA, Inc. $14,062 $14,162 91% $4,078 86% $1,314 2% 4% 3.4x 3.3x 9.6x 8.6x
Citrix Systems, Inc. 11,878 10,717 80% 3,464 85% 1,185 (17%) 2% 3.8 3.7 10.7 11.3
Cloudera, Inc. 2,787 2,509 71% 310 56% (118) 37% 26% 7.0 5.6 NM NM
Commvault Systems, Inc. 2,808 2,310 94% 673 87% 82 7% 12% 3.4 3.0 26.2 21.9
Constellation Software Inc. 14,426 14,323 94% 2,356 38% 354 16% 14% 5.8 5.1 22.3 19.4
Hortonworks, Inc. 1,196 1,132 96% 239 67% (100) 39% 27% 4.4 3.5 NM NM
Micro Focus International plc 10,385 11,785 83% 1,381 88% 581 84% 70% 4.7 2.8 11.6 7.1
MuleSoft, Inc. 2,617 2,284 69% 263 73% (43) 55% 35% 7.9 5.8 NM NM
NetScout Systems, Inc. 2,897 2,882 84% 1,104 72% 238 (1%) 11% 2.6 2.3 11.1 8.8
Nutanix, Inc. 3,469 3,120 48% 767 57% (154) 57% 42% 3.3 2.3 NM NM
Pegasystems, Inc. 4,489 4,294 89% 801 67% 106 7% 11% 5.3 4.8 44.4 38.2
Progress Software Corporation 1,846 1,778 99% 399 87% 147 (2%) 1% 4.5 4.4 9.7 9.7
Red Hat, Inc. 20,290 18,732 97% 2,644 85% 686 16% 19% 6.9 5.8 26.3 21.2
ServiceNow, Inc. 20,298 19,353 99% 1,772 73% 366 38% 31% 10.1 7.7 46.1 30.5
Software Aktiengesellschaft 3,044 2,942 92% 1,020 76% 347 2% 3% 2.8 2.8 8.7 8.8
Talend S.A. 1,192 1,097 98% 138 77% (20) 40% 30% 7.4 5.7 NM NM
Tintri, Inc. 98 69 42% 140 62% (85) 16% 18% 0.5 0.4 NM NM
Twilio Inc. 2,751 2,467 45% 366 56% (4) 40% 24% 6.4 5.1 NM NM
Upland Software, Inc. 440 479 83% 89 65% 22 29% 11% 5.0 4.5 16.1 13.2
VMware, Inc. 45,070 37,517 97% 7,093 85% 2,486 10% 7% 4.8 4.5 12.9 12.0
75th Percentile $11,505 $11,518 95% $1,674 85% $363 39% 29% 6.8x 5.5x 26.3x 21.7x
Median $2,970 $2,912 90% $722 73% $116 21% 18% 4.9x 4.4x 14.5x 12.6x
Mean $8,033 $7,451 83% $1,374 73% $340 24% 21% 5.2x 4.3x 21.4x 17.0x
25th Percentile $2,593 $2,290 81% $324 65% ($26) 7% 11% 3.5x 3.1x 10.8x 9.0x

23PIPER JAFFRAY
Source: S&P Capital IQ, Thomson Reuter’s Consensus, and Renaissance Capital.
EV/Revenue > 20x Not Meaningful (NM).
EV/EBITDA > 60x Not Meaningful (NM).
Market Enterprise Gross Revenue EV / EV /
Cap Value Price % Revenue Margin EBITDA Growth Revenue EBITDA
($ in millions, except per share data) 9/30/2017 9/30/2017 52 Wk High LTM LTM LTM 2017 2018 2017 2018 2017 2018
Large-Cap Technology
Adobe Systems Incorporated $74,649 $71,163 94% $6,903 86% $2,738 24% 20% 9.8x 8.2x 23.4x 18.3x
HP Inc. 33,832 33,646 99% 50,641 18% 4,406 4% 3% 0.7 0.6 7.9 7.4
International Business Machines Corp 135,393 165,014 79% 78,366 46% 17,368 (2%) 0% 2.1 2.1 8.6 8.3
Intuit Inc. 37,099 36,779 97% 5,177 85% 1,952 9% 12% 7.0 6.2 18.6 16.9
Oracle Corporation 207,131 193,892 91% 38,320 59% 16,327 3% 6% 5.1 4.8 11.3 10.3
Salesforce.com, inc. 68,139 66,562 95% 9,388 73% 1,421 24% 20% 6.4 5.3 29.1 23.6
SAP SE 129,452 128,690 96% 27,261 70% 8,158 7% 6% 4.7 4.4 13.6 12.8
75th Percentile $132,422 $146,852 97% $44,481 79% $12,242 16% 16% 6.7x 5.8x 21.0x 17.6x
Median $74,649 $71,163 95% $27,261 70% $4,406 7% 6% 5.1x 4.8x 13.6x 12.8x
Mean $97,957 $99,392 93% $30,865 62% $7,481 10% 10% 5.1x 4.5x 16.1x 13.9x
25th Percentile $52,619 $51,670 93% $8,146 52% $2,345 3% 4% 3.4x 3.3x 9.9x 9.3x
Large-Cap Technology

24PIPER JAFFRAY
Human Capital Management
Source: S&P Capital IQ, Thomson Reuter’s Consensus, and Renaissance Capital.
EV/Revenue > 20x Not Meaningful (NM).
EV/EBITDA > 60x Not Meaningful (NM).
Market Enterprise Gross Revenue EV / EV /
Cap Value Price % Revenue Margin EBITDA Growth Revenue EBITDA
($ in millions, except per share data) 9/30/2017 9/30/2017 52 Wk High LTM LTM LTM 2017 2018 2017 2018 2017 2018
Human Capital Management
Benefitfocus, Inc. $1,052 $1,118 79% $253 51% $13 10% 9% 4.4x 4.0x NM 39.0x
Cornerstone OnDemand, Inc. 2,351 2,250 87% 459 70% 21 14% 4% 4.7 4.5 34.5 25.4
Paycom Software, Inc. 4,466 4,434 98% 407 85% 122 31% 25% 10.3 8.2 33.4 26.4
Paylocity Holding Corporation 2,666 2,569 98% 316 59% 50 24% 24% 7.8 6.3 NM 30.8
The Ultimate Software Group, Inc. 5,834 5,705 81% 900 62% 210 20% 19% 6.1 5.1 26.6 20.7
WageWorks, Inc. 2,444 1,796 75% 462 63% 125 32% 10% 3.7 3.4 12.3 10.8
Workday, Inc. 21,921 20,353 95% 1,853 70% 212 34% 25% 9.7 7.7 NM 45.2
75th Percentile $5,150 $5,069 96% $681 70% $167 31% 25% 8.8x 7.0x 33.7x 34.9x
Median $2,666 $2,569 87% $459 63% $122 24% 19% 6.1x 5.1x 30.0x 26.4x
Mean $5,819 $5,461 88% $664 66% $108 23% 17% 6.7x 5.6x 26.7x 28.3x
25th Percentile $2,398 $2,023 80% $362 60% $36 17% 10% 4.5x 4.2x 23.0x 23.0x

25PIPER JAFFRAY
HR Outsourcing
Source: S&P Capital IQ, Thomson Reuter’s Consensus, and Renaissance Capital.
EV/Revenue > 20x Not Meaningful (NM).
EV/EBITDA > 60x Not Meaningful (NM).
Market Enterprise Gross Revenue EV / EV /
Cap Value Price % Revenue Margin EBITDA Growth Revenue EBITDA
($ in millions, except per share data) 9/30/2017 9/30/2017 52 Wk High LTM LTM LTM 2017 2018 2017 2018 2017 2018
HR Outsourcing
Aon plc $37,592 $41,240 99% $11,935 42% $2,555 (14%) 6% 4.2x 3.9x 16.4x 14.6x
Automatic Data Processing, Inc. 48,647 48,275 90% 12,542 43% 2,860 5% 7% 3.8 3.5 18.4 16.5
Barrett Business Services, Inc. 426 302 84% 897 61% 36 11% 11% 0.3 0.3 7.8 6.8
CBIZ, Inc. 907 1,082 98% 839 12% 95 7% 5% 1.3 1.2 10.5 9.6
H&R Block, Inc. 5,536 6,362 83% 3,049 49% 919 1% 2% 2.1 2.0 7.7 7.5
Insperity, Inc. 1,834 1,609 94% 3,203 17% 156 12% 10% 0.5 0.4 9.2 8.0
Instructure, Inc. 986 920 95% 147 71% (33) 41% 29% 5.9 4.6 NM NM
Paychex, Inc. 21,664 20,869 95% 3,183 71% 1,426 6% 7% 6.4 6.0 15.0 13.9
TriNet Group, Inc. 2,404 2,557 81% 3,239 18% 267 (74%) 4% 3.2 3.1 9.2 9.2
WageWorks, Inc. 2,444 1,796 75% 462 63% 125 32% 10% 3.7 3.4 12.3 10.8
75th Percentile $17,632 $17,243 95% $3,230 63% $1,299 12% 10% 4.1x 3.8x 15.0x 13.9x
Median $2,424 $2,176 92% $3,116 46% $211 6% 7% 3.5x 3.2x 10.5x 9.6x
Mean $12,244 $12,501 90% $3,949 45% $841 3% 9% 3.1x 2.9x 11.8x 10.8x
25th Percentile $1,198 $1,214 84% $853 24% $103 2% 5% 1.5x 1.4x 9.2x 8.0x

26PIPER JAFFRAY
CRM / Marketing
Source: S&P Capital IQ, Thomson Reuter’s Consensus, and Renaissance Capital.
EV/Revenue > 20x Not Meaningful (NM).
EV/EBITDA > 60x Not Meaningful (NM).
Market Enterprise Gross Revenue EV / EV /
Cap Value Price % Revenue Margin EBITDA Growth Revenue EBITDA
($ in millions, except per share data) 9/30/2017 9/30/2017 52 Wk High LTM LTM LTM 2017 2018 2017 2018 2017 2018
CRM / Marketing
Bazaarvoice, Inc. $419 $362 81% $203 62% $14 1% 6% 1.8x 1.7x 21.8x 13.7x
Callidus Software Inc. 1,679 1,503 90% 240 61% 27 21% 20% 6.0 5.0 42.5 31.1
ChannelAdvisor Corporation 306 252 73% 120 78% 6 8% 9% 2.1 1.9 NM 36.8
Coupa Software Incorporated 1,670 1,461 75% 159 68% (14) 33% 25% 8.2 6.6 NM NM
Marin Software Incorporated 69 41 64% 80 59% (10) NA NA NA NA NA NA
Mimecast Limited 1,629 1,537 94% 222 74% 19 34% 28% 6.7 5.2 NM NM
MINDBODY, Inc. 1,207 997 87% 171 71% 4 31% 25% 5.5 4.4 NM NM
Model N, Inc. 437 436 99% 131 54% (19) 26% 9% 3.1 2.9 NM NM
Salesforce.com, inc. 68,139 66,562 95% 9,388 73% 1,421 24% 20% 6.4 5.3 29.1 23.6
The Trade Desk, Inc. 2,722 2,616 98% 278 79% 85 51% 28% 8.5 6.7 28.9 21.7
Zendesk, Inc. 2,955 2,638 93% 396 70% (7) 37% 29% 6.2 4.8 NM NM
75th Percentile $2,200 $2,076 95% $259 73% $23 34% 27% 6.6x 5.3x 32.5x 31.1x
Median $1,629 $1,461 90% $203 70% $6 28% 22% 6.1x 4.9x 29.0x 23.6x
Mean $7,385 $7,128 86% $1,035 68% $139 27% 20% 5.5x 4.4x 30.6x 25.4x
25th Percentile $428 $399 78% $145 61% ($9) 21% 12% 3.7x 3.3x 27.1x 21.7x
27PIPER JAFFRAY
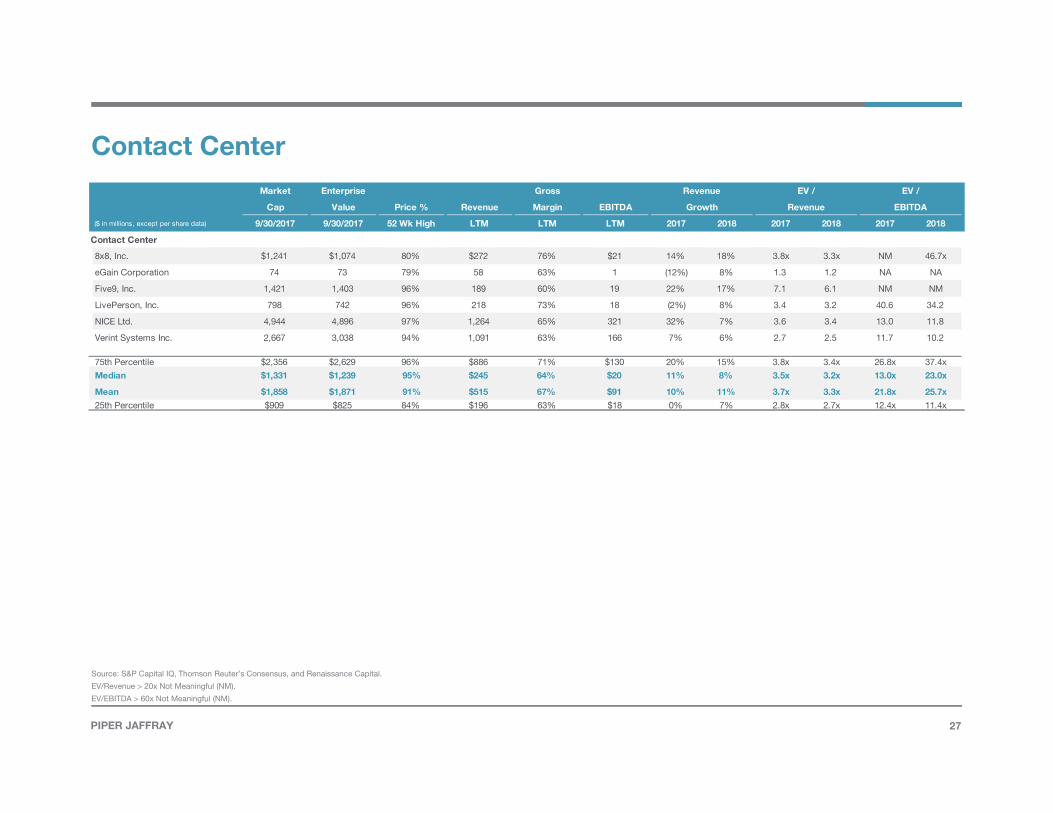
Contact Center
Source: S&P Capital IQ, Thomson Reuter’s Consensus, and Renaissance Capital.
EV/Revenue > 20x Not Meaningful (NM).
EV/EBITDA > 60x Not Meaningful (NM).
Market Enterprise Gross Revenue EV / EV /
Cap Value Price % Revenue Margin EBITDA Growth Revenue EBITDA
($ in millions, except per share data) 9/30/2017 9/30/2017 52 Wk High LTM LTM LTM 2017 2018 2017 2018 2017 2018
Contact Center
8x8, Inc. $1,241 $1,074 80% $272 76% $21 14% 18% 3.8x 3.3x NM 46.7x
eGain Corporation 74 73 79% 58 63% 1 (12%) 8% 1.3 1.2 NA NA
Five9, Inc. 1,421 1,403 96% 189 60% 19 22% 17% 7.1 6.1 NM NM
LivePerson, Inc. 798 742 96% 218 73% 18 (2%) 8% 3.4 3.2 40.6 34.2
NICE Ltd. 4,944 4,896 97% 1,264 65% 321 32% 7% 3.6 3.4 13.0 11.8
Verint Systems Inc. 2,667 3,038 94% 1,091 63% 166 7% 6% 2.7 2.5 11.7 10.2
75th Percentile $2,356 $2,629 96% $886 71% $130 20% 15% 3.8x 3.4x 26.8x 37.4x
Median $1,331 $1,239 95% $245 64% $20 11% 8% 3.5x 3.2x 13.0x 23.0x
Mean $1,858 $1,871 91% $515 67% $91 10% 11% 3.7x 3.3x 21.8x 25.7x
25th Percentile $909 $825 84% $196 63% $18 0% 7% 2.8x 2.7x 12.4x 11.4x

28PIPER JAFFRAY
SecurityMarket Enterprise Gross Revenue EV / EV /
Cap Value Price % Revenue Margin EBITDA Growth Revenue EBITDA
($ in millions, except per share data) 9/30/2017 9/30/2017 52 Wk High LTM LTM LTM 2017 2018 2017 2018 2017 2018
Security
Akamai Technologies, Inc. $8,356 $7,599 68% $2,456 65% $836 6% 8% 3.1x 2.8x 8.3x 7.9x
Barracuda Networks, Inc. 1,323 1,117 91% 367 75% 67 6% 8% 3.0 2.8 16.8 13.7
CA, Inc. 14,062 14,162 91% 4,078 86% 1,314 2% 4% 3.4 3.3 9.6 8.6
Check Point Software Technologies L 18,945 15,080 98% 1,835 89% 999 7% 6% 8.1 7.6 14.7 13.8
CyberArk Software Ltd. 1,484 1,187 73% 246 84% 53 19% 19% 4.6 3.9 20.8 16.6
Experian plc 13,944 17,047 88% 4,335 43% 1,576 2% 3% 3.7 3.6 10.7 10.6
Everbridge, Inc. 746 699 98% 96 70% (6) 35% 26% 6.7 5.3 NM NM
FireEye, Inc. 3,096 2,987 96% 734 64% 17 4% 8% 4.0 3.7 36.2 27.6
Fortinet, Inc. 6,414 4,879 86% 1,441 74% 305 17% 14% 3.3 2.9 15.8 13.2
Imperva, Inc. 1,476 1,133 76% 309 80% 47 22% 18% 3.5 3.0 26.5 20.7
MobileIron, Inc. 355 273 55% 173 82% (19) 6% 7% 1.6 1.5 NM NM
NetScout Systems, Inc. 2,897 2,882 84% 1,104 72% 238 (1%) 11% 2.6 2.3 11.1 8.8
Okta, Inc. 2,696 2,483 84% 205 67% (61) 53% 35% 10.1 7.5 NM NM
Palo Alto Networks, Inc. 13,234 11,595 87% 1,762 73% 377 22% 24% 6.1 4.9 26.0 18.8
Parkit Enterprise Inc. 14 (2) 87% 2 100% 1 NA NA NA NA NA NA
Proofpoint, Inc. 3,910 3,832 90% 477 72% 60 36% 28% 7.5 5.9 NM 42.5
Qualys, Inc. 2,087 1,744 97% 220 78% 80 16% 17% 7.6 6.5 20.6 17.6
Radware Ltd. 741 410 92% 205 81% 13 6% 7% 2.0 1.8 28.8 18.6
Rapid7, Inc. 767 682 91% 188 73% (21) 26% 20% 3.4 2.9 NM NM
SecureWorks Corp. 1,001 903 95% 456 52% (13) 8% 10% 1.9 1.8 NM NM
Splunk Inc. 9,300 8,292 95% 1,074 79% 96 28% 26% 6.8 5.4 NM 40.4
Symantec Corporation 20,342 24,366 96% 4,571 78% 1,225 30% 4% 4.9 4.7 11.2 9.6
Trend Micro Incorporated 768,993 572,791 93% 147,474 82% 53,309 11% 8% 3.9 3.6 11.5 10.6
Varonis Systems, Inc. 1,166 1,038 97% 199 90% 5 28% 19% 4.9 4.2 NM NM
VASCO Data Security International, In 481 318 65% 186 70% 13 (2%) 8% 1.7 1.5 15.4 15.5
VeriSign, Inc. 13,200 13,241 100% 1,156 83% 806 2% 4% 11.4 10.9 16.5 15.3
Zix Corporation 270 237 73% 64 81% 17 9% 8% 3.6 3.4 13.0 10.9
75th Percentile $11,250 $9,943 96% $1,601 82% $591 25% 19% 6.6x 5.2x 20.7x 18.6x
Median $2,696 $2,483 91% $456 78% $60 10% 9% 3.8x 3.6x 15.6x 14.5x
Mean $33,752 $26,332 87% $6,497 76% $2,272 15% 13% 4.8x 4.1x 17.4x 17.1x` 25th Percentile $884 $801 84% $202 71% $9 6% 8% 3.1x 2.8x 11.3x 10.6x
Source: S&P Capital IQ, Thomson Reuter’s Consensus, and Renaissance Capital.
EV/Revenue > 20x Not Meaningful (NM).
EV/EBITDA > 60x Not Meaningful (NM).

Piper Jaffray Companies (NYSE: PJC) is a leading investment bank and asset management firm. Securities brokerage and investment banking services are offered in the U.S. through Piper Jaffray & Co., member SIPC and FINRA; in Europe through Piper Jaffray Ltd., authorized and regulated by the U.K. Financial Conduct Authority; and in Hong Kong through Piper Jaffray Hong Kong Limited, authorized and regulated by the Securities and Futures Commission. Asset management products and services are offered through five separate investment advisory affiliates―U.S. Securities and Exchange Commission (SEC) registered Advisory Research, Inc., Piper Jaffray Investment Management LLC, PJC Capital Partners LLC and Piper Jaffray & Co., and Guernsey-based Parallel General Partners Limited, authorized and regulated by the Guernsey Financial Services Commission.
Information contained in this publication is based on data obtained from sources we deem to be reliable; however, it is not guaranteed as to accuracy and does not purport to be complete. Nothing contained in this publication is intended to be a recommendation of a specific security or company nor is any of the information contained herein intended to constitute an analysis of any company or security reasonably sufficient to form the basis for any investment decision.
© 2017 Piper Jaffray Companies. 800 Nicollet Mall, Suite 1000, Minneapolis, Minnesota 55402-7036
Date of First Use 8/28/17