Embed Size (px)
DESCRIPTION
pipeline design technical
Citation preview
Appendix Q4
Technical Details
Q4.1: Onshore Pipeline Design Review Q4.2: Offshore Design Basis and Addendum No 1 to
Offshore Design Basis Q4.3: Landfall Valve Installation Design Justification
and Overview Q4.4: Appraisal of Alternative Configurations for the
LVI Safety Shutdown System Q4.5: Aspects of Process Engineering Design of the
Corrib Production System Q4.6: Reliability of Overpressure Protection Systems
for Offshore and Onshore Pipelines Q4.7: Materials and Corrosion Management Premises Q4.8: Assessment of Locally Corroded Pipe Wall Area Q4.9: Assessment of Wet Gas Operation,
Internal Corrosion and Erosion Q4.10: Denting and Puncturing Evaluation
Shell E & P Ireland Limited
CORRIB FIELD DEVELOPMENT PROJECT
REPORT
Corrib Onshore Pipeline EIS PROJECT No.
052377.01
APPENDIX Q4.1 REF
CTR 349
ONSHORE PIPELINE DESIGN OVERVIEW No OF SHEETS
18
DOCUMENT No OFFICE CODE
05PROJECT No
2377AREA
01DIS
PTYPE
3NUMBER
043
03 17/05/10 Issued for Planning Application JG GSW GSW JG
02 4/05/10 Issued for Comment JG GSW GSW JG
01 8/03/10 Issued for IDC JG GSW GSW JG
REV DATE DESCRIPTION BY CHK ENG PM CLIENT
Corrib Onshore Pipeline EISAppendix Q4.1
Onshore Pipeline Design Overview
Page 2 of 18
CONTENTS
1 INTRODUCTION ............................................................................................................4
2 GENERAL DESIGN PARAMETERS............................................................................42.1 Environmental Data.........................................................................................................42.2 Design Life.......................................................................................................................4
3 PIPELINE ROUTE..........................................................................................................43.1 Route Summary ..............................................................................................................43.2 Glengad Headland ..........................................................................................................53.3 Tunnel Under Sruwaddacon Bay....................................................................................53.4 Aghoos to Gas Terminal .................................................................................................53.5 Tie-in at Gas Terminal.....................................................................................................53.6 Stone Road......................................................................................................................6
4 ONSHORE GAS PIPELINE DESIGN ...........................................................................74.1 Flow Rates.......................................................................................................................74.2 Pressures.........................................................................................................................74.3 Temperatures ..................................................................................................................74.4 Fatigue .............................................................................................................................74.5 Gas Production................................................................................................................74.6 Design Pressure..............................................................................................................74.7 Selection of MAOP..........................................................................................................84.8 Hydrostatic Pressure Test...............................................................................................84.9 Design Location and Design Factor ...............................................................................84.10 Corrosion Allowance .......................................................................................................84.11 Selected Wall Thickness.................................................................................................94.12 Materials ..........................................................................................................................94.13 Field Welding...................................................................................................................94.14 External Coating..............................................................................................................94.15 Cathodic Protection .......................................................................................................104.16 Bends.............................................................................................................................104.17 Pigging ...........................................................................................................................104.18 Crossings.......................................................................................................................114.19 Anchor............................................................................................................................114.20 Leak Detection...............................................................................................................11
5 OUTFALL DESIGN......................................................................................................125.1 General ..........................................................................................................................125.2 Operational Parameters ................................................................................................125.3 Codes and Standards ...................................................................................................125.4 Outfall Design ................................................................................................................12
6 UMBILICAL DESIGN...................................................................................................136.1 General ..........................................................................................................................136.2 Umbilical Configuration .................................................................................................136.3 Connectors ....................................................................................................................146.4 Service Fluids ................................................................................................................146.5 Codes and Standards ...................................................................................................156.6 Materials ........................................................................................................................156.7 Tubing Material..............................................................................................................15
Corrib Onshore Pipeline EISAppendix Q4.1
Onshore Pipeline Design Overview
Page 3 of 18
6.8 LVI Offtake.....................................................................................................................156.9 Prevention of Failure .....................................................................................................166.10 Leak Detection...............................................................................................................16
7 FIBRE OPTIC CABLE DESIGN..................................................................................167.1 Communications............................................................................................................167.2 Supplementary Leak Detection.....................................................................................16
8 SIGNAL CABLE DESIGN ...........................................................................................17
ATTACHMENT Q4.1A
Onshore Pipeline Stone Road Settlement Analysis For Pipelines And Services
Corrib Onshore Pipeline EISAppendix Q4.1
Onshore Pipeline Design Overview
Page 4 of 18
1 INTRODUCTION The purpose of this document is to provide a design overview of the onshore gas pipeline and associated service lines between the Landfall Valve Installation (LVI) at Glengad through to the Bellanaboy Bridge Gas Terminal. The service lines comprise the outfall pipeline, the three umbilicals, the fibre optic cable and the electrical signal cable.
2 GENERAL DESIGN PARAMETERS
2.1 Environmental Data
Environmental data for the pipeline route is listed below, for years 1991 to 2000. Data received from Met Eireann.
Max air temperature: 28 deg C
Monthly mean max temperature range: 8.9 to 18.2 deg C
Min air temperature: -5.5 deg C
Monthly mean min. temperature range: 3.9 to 12.2 deg C
Mean annual rainfall: 1269 mm
Max daily rainfall: 40 mm
Max hourly rainfall: 25.9 mm
Mean days 0.2mm rainfall: 254 days/year
Mean monthly wind speed range: 11.7 to 16.2 knots
Max wind speed (gust): 93 knots
2.2 Design Life
The pipeline, outfall pipeline, the umbilical and both the fibre optic and signal cables have a design life of 30 years.
3 PIPELINE ROUTE
3.1 Route Summary
The selected route for the Corrib onshore pipeline is detailed in Chapter 3 and illustrated in Appendix A Drawing DG103.
The onshore gas pipeline commences from the tie-in weld at the downstream barred tee of the LVI. The pipeline then traverses the Glengad headland, in an east-south-easterly direction for approximately 640m. The pipeline then proceeds ~4.9 km within a dedicated tunnel in generally a south easterly direction beneath Sruwaddacon Bay. The end of the Tunnel is situated near Aghoos. At Aghoos, the pipeline route turns in an easterly direction for approximately 0.9km, traversing an area of blanket bog within which it crosses an approximately 40m wide estuarine river channel. The route then enters an area of forested bog (approximately 2.2km long) where it turns in a southerly direction, at the crossing of the L1202, and continues to the Bellanaboy Bridge Gas Terminal site.
Corrib Onshore Pipeline EISAppendix Q4.1
Onshore Pipeline Design Overview
Page 5 of 18
3.2 Glengad Headland
The section of route from the LVI to the Tunnel entrance along the Glengad Headland is generally improved grassland and the gas pipeline will be buried with a minimum of 1.2m depth to the top of pipe. This section is traversed by a number of small ditches with run-off from the surrounding terrain. Additional protection will be incorporated to minimise any impact of scour or 3rd party damage.
The cross section of trench for the gas pipeline and the associated services within this section is illustrated in Appendix A, Drawing DG604.
3.3 Tunnel Under Sruwaddacon Bay
A description of the Tunnel through Sruwaddacon Bay is provided in Chapter 5 and. Appendix A, Drawings DG401 to DG404.
The Tunnel is a concrete segment lined construction of some 3.5m internal diameter. The alignment of the Tunnel in Sruwaddacon Bay has been selected to meet the hazard and risk assessment criteria set by the authorities and to minimise the impact on the environment.
The pipeline and associated services will be installed individually in the Tunnel and the cross section is illustrated in Chapter 5 Figure 5.5. On completion the Tunnel will be fully grouted.
3.4 Aghoos to Gas Terminal
From the Tunnel exit near Aghoos, the pipeline transverses a 0.9km section of blanket bog and then crosses the approximately 40m wide Leenamore river channel. From there the route enters forested bog up to the road crossing (RDX1) of the L1202. From the road crossing the route continues with a short section of forested bog and then blanket bog to the boundary of the Gas Terminal.
Throughout this section the pipeline and associated services will be installed within a stone road (refer Section 3.6). At the Leenamore crossing a specific crossing technique will be adopted as detailed in Chapter 5 and illustrated in Appendix A Drawing DG703.
Similarly at RDX1 a specific road crossing method will be adopted as illustrated in Appendix A Drawing DG701.
Throughout this section of the route, the gas pipeline will be buried to a minimum depth of 1.2 m.
The cross section of the gas pipeline and the associated services within the stone road is illustrated in Appendix A, Drawing DG601.
3.5 Tie-in at Gas Terminal
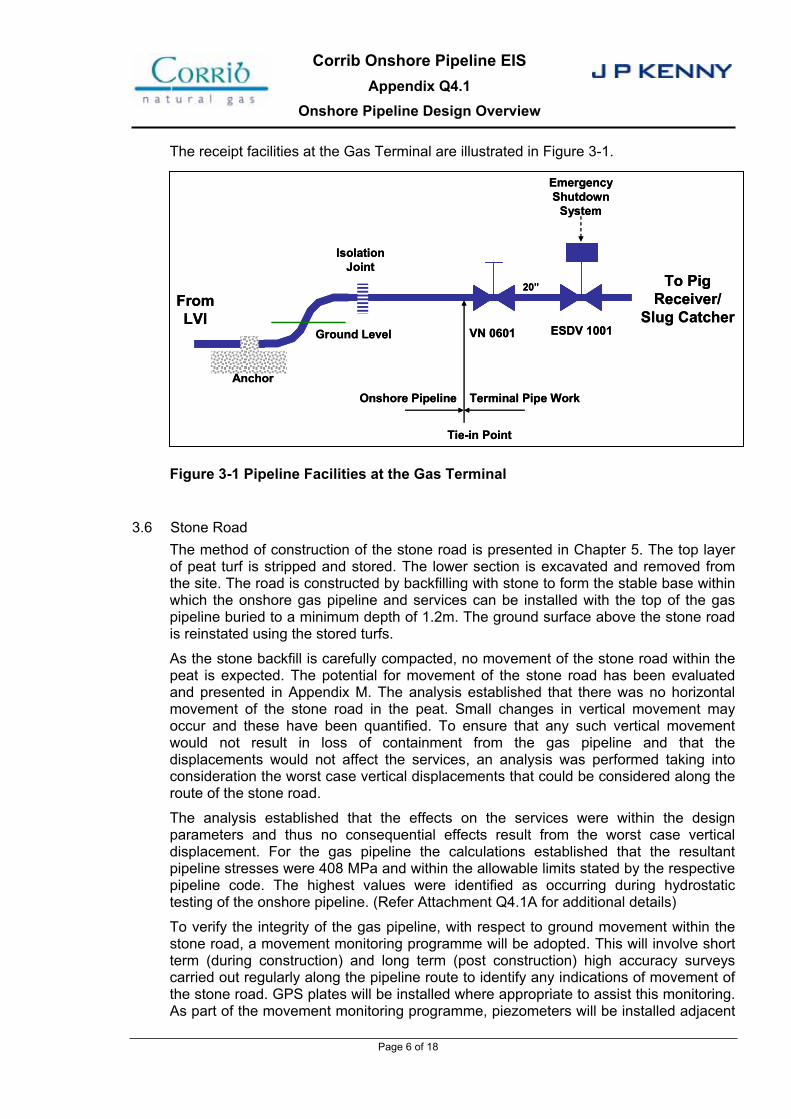
As the pipeline approaches the Gas Terminal boundary fence, the depth of cover will be maintained at a minimum of 1.2m to the top of the gas pipeline. Within the Gas Terminal site the pipeline crosses an internal site access road before rising above ground for interconnection to the Gas Terminal isolation valves and pig receiver. Where the pipeline rises above ground, an specially manufactured Isolation Joint will provide electrical isolation between the Gas Terminal pipe work and the onshore pipeline Cathodic Protection system. To minimise the forces imposed on the Gas Terminal above ground pipe work a buried concrete anchor block will be installed before the onshore pipeline rises above ground. (Refer Section 4.19)
The outfall pipeline, the umbilicals, the fibre optic cable and the signal cable will all terminate at positions close to the gas pipeline pig receiver.
Corrib Onshore Pipeline EISAppendix Q4.1
Onshore Pipeline Design Overview
Page 6 of 18
The receipt facilities at the Gas Terminal are illustrated in Figure 3-1.
Figure 3-1 Pipeline Facilities at the Gas Terminal
3.6 Stone Road
The method of construction of the stone road is presented in Chapter 5. The top layer of peat turf is stripped and stored. The lower section is excavated and removed from the site. The road is constructed by backfilling with stone to form the stable base within which the onshore gas pipeline and services can be installed with the top of the gas pipeline buried to a minimum depth of 1.2m. The ground surface above the stone road is reinstated using the stored turfs.
As the stone backfill is carefully compacted, no movement of the stone road within the peat is expected. The potential for movement of the stone road has been evaluated and presented in Appendix M. The analysis established that there was no horizontal movement of the stone road in the peat. Small changes in vertical movement may occur and these have been quantified. To ensure that any such vertical movement would not result in loss of containment from the gas pipeline and that the displacements would not affect the services, an analysis was performed taking into consideration the worst case vertical displacements that could be considered along the route of the stone road.
The analysis established that the effects on the services were within the design parameters and thus no consequential effects result from the worst case vertical displacement. For the gas pipeline the calculations established that the resultant pipeline stresses were 408 MPa and within the allowable limits stated by the respective pipeline code. The highest values were identified as occurring during hydrostatic testing of the onshore pipeline. (Refer Attachment Q4.1A for additional details)
To verify the integrity of the gas pipeline, with respect to ground movement within the stone road, a movement monitoring programme will be adopted. This will involve short term (during construction) and long term (post construction) high accuracy surveys carried out regularly along the pipeline route to identify any indications of movement of the stone road. GPS plates will be installed where appropriate to assist this monitoring. As part of the movement monitoring programme, piezometers will be installed adjacent
FromLVI
ESDV 1001
IsolationJoint
20”
VN 0601
To Pig Receiver/
Slug Catcher
Anchor
Ground Level
EmergencyShutdown
System
Onshore Pipeline Terminal Pipe Work
Tie-in Point
FromLVI
ESDV 1001
IsolationJoint
20”
VN 0601
To Pig Receiver/
Slug Catcher
Anchor
Ground Level
EmergencyShutdown
System
Onshore Pipeline Terminal Pipe Work
Tie-in Point
Corrib Onshore Pipeline EISAppendix Q4.1
Onshore Pipeline Design Overview
Page 7 of 18
to the stone road to allow monitoring of groundwater levels. The frequency of monitoring will be tailored based on the results of the ongoing monitoring. The monitoring proposals are included in Appendix M2.
4 ONSHORE GAS PIPELINE DESIGN
4.1 Flow Rates
Design Flow Rate 350 MMSCFD (dry sales gas)
Maximum Flow Rate: 350 MMSCFD (dry sales gas)
4.2 Pressures
Design Pressure: 144 barg
Normal Operating Pressure (onshore section, at start of field life): 90 to 85 barg
Hydrostatic Test Pressure 504 barg
4.3 Temperatures
Maximum Design Temperature: 50oC
Minimum Design Temperature
20 inch pipeline from LVI to ~1100m downstream of the LVI -20°C
20 inch pipeline from ~1100 m downstream of the LVI to Gas Terminal -10°C
For design conditions at the Landfall Valve Installation refer to Appendix Q4.3.
4.4 Fatigue
Normal Diurnal Pressure Range: 90 to 85 barg
Number of Cycles Between Diurnal Pressure Range: 11000
Number of Cycles Between Design Pressure Range: 30
Pressure cycles in the pipeline will be recorded via the DCS at the Gas Terminal. This data will be evaluated on an annual basis and the pressure cycles will be counted. The actual pressure cycles will be compared with the allowable pressure cycles to assess potential fatigue.
4.5 Gas Production
The Corrib field gas will be produced as water saturated gas with small quantities of free water. Early years of production, including start-up, will require use of the wellhead choke valves. Cooling of the gas subsea reduces the temperature to below the hydrate formation point at normal operating pressure. Methanol is used during start-up and in normal operation to prevent hydrate formation.
For information on well product composition, produced water and production profile refer to Appendix Q4.2.
No operational blowdown of the gas pipeline is planned. If required under upset conditions, a pipeline depressurisation procedure at the Gas Terminal will be undertaken in such a manner so as not to induce hydrate formation.
4.6 Design Pressure
TAG recommended, following issue of the Advantica Independent Safety Review, that the pressure in the onshore pipeline should be limited to no greater than 144 barg. This
Corrib Onshore Pipeline EISAppendix Q4.1
Onshore Pipeline Design Overview
Page 8 of 18
value of 144 barg was therefore selected as the design pressure for the onshore gas pipeline.
4.7 Selection of MAOP
From the pipeline codes; the maximum allowable operating pressure (MAOP) is the maximum steady state pressure at which a pipeline system is allowed to be continuously operated. The MAOP is the sum of the static head pressure, the pressure required to overcome friction loss and any required backpressure. Furthermore, the MAOP shall not exceed the design pressure. In pipeline code I.S. 328 this is referred to as the maximum operating pressure (MOP).
For the onshore pipeline the highest daily operating pressure at the LVI is expected to be around 90 barg. Allowing a margin for the over-pressurisation protection trip settings an MAOP of 100 barg has been established.
4.8 Hydrostatic Pressure Test
Prior to commissioning, the onshore pipeline will be hydrostatically tested to a defined pressure at the lowest point of the pipeline. The test pressure will be maintained for a period of 24 hours.
The hydrostatic test pressure for the onshore pipeline was established following the recommendation from the Advantica and TAG reports and presented is in Appendix Q5.3. This determined that the onshore pipeline Hydrostatic test pressure will be 504 barg. This is defined in the codes as a High-level hydrostatic strength test. Successful completion of the test at this level demonstrates that any remaining defects are considerably smaller than would fail at the operating pressure. It provides a rigorous demonstration of a quantified safety margin that accommodates an allowance for defect growth during service.
This hydrostatic test pressure is:
5.6 times the daily operating pressure (90 barg)
5.0 times the MAOP (100 barg)
3.5 times the Design Pressure
4.9 Design Location and Design Factor
From the TAG recommendations following issue of the Advantica Independent Safety Review, the classification of design location should be suburban which would be consistent with the design of pipelines passing through more densely populated suburban areas. In I.S. 328 this is defined as a population density exceeding 2.5 persons per hectare but not classified as central areas of highly populated towns and cities. This is more stringent than the rural classification where the population does not exceed 2.5 persons per hectare.
Subsequently the design factor for the onshore pipeline will be 0.3 (as defined in pipeline code I.S. 328). This is further detailed in Appendix Q6.2.
4.10 Corrosion Allowance
From a detailed analysis of the potential for corrosion over the expected field life of the project, an allowance of 1.0 mm was determined for the Onshore Pipeline. Refer to Appendices Q4.7 and Q4.9.
Corrib Onshore Pipeline EISAppendix Q4.1
Onshore Pipeline Design Overview
Page 9 of 18
4.11 Selected Wall Thickness
The wall thickness of the onshore pipeline is determined in accordance with pipeline code I.S. 328. It should be noted that each of the codes utilise the same principle of the Barlow formula. However each code applies the formulae with subtle differences.
The factors comprising the Barlow formula are design pressure, pipe diameter, wall thickness of the pipe, design factor and specified minimum yield strength of the pipe (i.e. SMYS or the strength of the pipe material).
It is noted that a lower numerical value of Design Factor increases the wall thickness. Also the higher the design pressure the higher the wall thickness.
By applying the design parameters to the Barlow formula gives a value of wall thickness for pressure containment. Added to this are manufacturing tolerances (1mm) and the corrosion allowance of 1mm giving a nominal pipe wall thickness of 27.1 mm.
4.12 Materials
The line pipe has been manufactured from carbon steel as specified in DNV pipeline code DNV-OS-F101:2000. The specification includes the following main points:
SMYS: 485 N/mm2
Wall thickness manufacturing tolerance: +/- 1mm
Corrosion allowance: 1mm
Nominal Wall thickness (onshore section): 27.1mm (inclusive of 1mm corrosion allowance)
Nominal outside diameter: 20”
4.13 Field Welding
The lengths of 20” dia onshore line pipe will be welded in the field by qualified welders. Welding will be in accordance with the requirements of I.S.328:2003 and in particular I.S. EN 12732.
4.14 External Coating
4.14.1 Linepipe
The factory applied external anti-corrosion coating protection for the onshore line pipe is a three layer polypropylene systems (3LPP). This system comprises a high performance fusion bonded epoxy (FBE) followed by a copolymer adhesive and an outer layer of polypropylene which provides the toughest, most durable pipe coating solution available.
4.14.2 Field joints
Where the line pipe sections are welded together in the field, the section of jointed pipe at the weld is protected by an anti-corrosion coating termed field joint coatings. For the onshore pipeline they take the form of a sleeve or wrap. This shrinks in the circumferential direction under the influence of heat forming an adherent field joint coating. The shrink sleeve consists of a polyolefin based backing with an adhesive layer (mastic or hot melt) on one side. The shrink sleeve will be applied with a primer.
Corrib Onshore Pipeline EISAppendix Q4.1
Onshore Pipeline Design Overview
Page 10 of 18
4.15 Cathodic Protection
The onshore pipeline will be primarily protected against external corrosion by a high integrity external coating (Refer Section 4.14). Secondary protection will be provided by cathodic protection. Cathodic protection is maintained in two distinct stages:
Temporary cathodic protection will be provided for the pipeline during installation. It will also ensure that no part of the pipeline is exposed to the environment unprotected for more than thirty days after backfill.
The completed onshore pipeline installation will be cathodically protected by a permanent impressed current system from a mains powered transformer rectifier unit located at the Gas Terminal. The system will include test facilities for proper adjustment and monitoring to ensure that it does not interfere with and cause corrosion to third party facilities encountered along the pipeline route. An anode ground bed supported by carbonaceous backfill will be installed near the Gas Terminal.
The Advantica Independent Safety Review recommended that a factory built insulation joint should be considered at the landfall to separate the offshore and onshore CP systems. Alternatively the detailed CP system design should be revised to take account of the possible effects of the offshore section.
An independent review of the inclusion of an isolating joint at the LVI concluded that an isolation joint should not be installed at the interface with the offshore and onshore pipelines. The review noted that the structural integrity of the pipeline system could be compromised. In addition, it would provide a point susceptible to internal corrosion damage. Furthermore burial of the isolation joint at the LVI was not considered best practice.
The review confirmed that validation of the effectiveness of the cathodic protection onshore can be achieved through use of ‘polarisation coupons’ installed at frequent points along the pipeline route. Current drain of the onshore impressed current CP system from the offshore pipeline was considered unlikely but could be mitigated by appropriate design of the onshore CP system. TAG evaluated and accepted this independent review.
Electrical isolation will be provided for any above ground, earthed or bare connections at the LVI or any other metallic connections to the gas pipeline.
Electrical isolation will be provided upstream of the Terminal by means of a monolithic isolation joint.
Cathodic Protection Test Posts will be located along the route of the onshore gas pipeline and at the LVI. These enable the CP voltage potentials to be measured and interpreted to establish the effectiveness of the CP system. Within the Tunnel the test cables will be brought to the Tunnel entrances and connected to the test posts.
4.16 Bends
The minimum bend radius for factory made hot bends shall be 5D. The minimum bend radius for cold field bends shall be 40D.
4.17 Pigging
The onshore pipeline shall be designed to permit intelligent pigging. Pipeline internal diameters shall meet the requirements for the operation of all forms of pigs. There is no normal operational requirement to run pigs.
Corrib Onshore Pipeline EISAppendix Q4.1
Onshore Pipeline Design Overview
Page 11 of 18
During operation pigs will be launched from the subsea manifold removable pig trap and received at the pig receiver located in the Gas Terminal. The 20” dia mainline valve at the LVI will be opened during pigging and the LVI will be permanently manned during the pigging operation.
4.18 Crossings
The onshore pipeline route includes estuary, stream, road and track/ditch crossings.
For the tunnel under Sruwaddacon bay, refer to Section 3.3.
The protection of the pipeline at road and track crossings will be as illustrated in Appendix A Drawing DG701.
In addition, road crossings will be in accordance with the requirements of the appropriate regional or local highways agency. Crossings of roads and tracks will generally be open cut.
Ditches and minor waterways will be crossed using the open cut method with cofferdams and the pipe laid under the base of the watercourse and protected where dredging and cleaning of the channels is expected.
Other buried services will be crossed in accordance with the individual owner’s requirements but will follow the convention of crossing beneath existing services with protection between them unless indicated otherwise.
Pipeline protection in the form of concrete coating, concrete slabs and marker tape will be incorporated where required against external interference.
4.19 Anchor
A pipeline anchor will be installed in the Gas Terminal site, at a point before the onshore pipeline comes above ground for interconnection to the Gas Terminal pig receiver. The purpose of the anchor is to withstand the forces transferred from the pipeline to the above ground pipe work and thus prevent movement of the pig receiver and above ground pipe work. The forces in the pipeline are generated when there are changes in pressure and/or temperature of the buried onshore pipeline between the installation conditions and the operating or test conditions. At the Gas Terminal, the highest forces occur during hydrostatic testing of the onshore pipeline.
The anchor typically comprises a special carbon steel flange (solid circular plate) and a reinforced concrete foundation. The anchor flange is fully welded in the pipeline and does not include any bolted connection or gasket. The flange extends outside the circumference of the onshore pipeline in order to engage into the concrete foundation. This enables the transfer of load to the reinforced concrete foundation, and then into the ground.
4.20 Leak Detection
The primary Leak Detection System for the Corrib pipeline, which includes the onshore section and the LVI, is achieved by a mass balance system. This compares the pressures and flows at subsea and at the Gas Terminal using various statistical and mass balance techniques. It monitors both the onshore and offshore sections with an interface to the DCS that alerts the operator in the event of a problem.
A secondary independent system for the onshore pipeline utilises the properties of the fibre optic cable and is described in Section 7.2.
Corrib Onshore Pipeline EISAppendix Q4.1
Onshore Pipeline Design Overview
Page 12 of 18
5 OUTFALL DESIGN
5.1 General
The outfall pipeline will be designed to carry treated surface drainage water from the Gas Terminal to a diffuser positioned approximately 12.8 km offshore in Broadhaven Bay. The onshore section of the gas pipeline and outfall pipeline will be laid adjacent to each other within a common easement. The outfall pipeline may also be utilised during hydrostatic testing of the onshore gas pipeline between the LVI and the Gas Terminal (Refer Appendix Q2.1 Section 7)]
The outfall will be full of potable water once testing and commissioning has taken place.
5.2 Operational Parameters
The outfall pipeline is designed for the following conditions after commissioning:
Design Maximum Flow Rate: 85 m3/hr
Minimum Pump Flow: 3 m3/hr
Design Pressure: 16 barg
Maximum Operating Pressure: 8.5 barg
Minimum Operating Pressure: 0 barg
Maximum Design temperature: 350C
Minimum Design Temperature: 00C
Design Life: 30 years
Prior to commissioning, the maximum pressure in the outfall line during pipeline hydrostatic testing will be 20 barg at the low point.
5.3 Codes and Standards
The primary code applicable to the planning, design, construction and commissioning of the onshore section of the outfall pipeline shall be:
I.S. EN 14161 2004 Petroleum and Natural Gas Industries – Pipeline Transportation Systems (ISO 13623:2000 Modified)
The following standards shall also be deemed to apply:
ISO. 4427-2007 Plastic piping systems – Polyethylene (PE) pipes and fittings for water supply.
5.4 Outfall Design
Taking into account pressure losses, velocity limits, installation requirements and flow cycles amongst other considerations the outside diameter selected for the outfall pipeline is 250mm.
The design pressure for the Outfall Pipeline will be 16 barg.
The offshore section of the outfall pipeline has been installed as a piggy-back with the offshore gas pipeline. It has been hydrostatically tested to 6 barg.
The onshore section of the outfall pipeline will be hydrostatically tested to 20 barg.
The 250 mm OD polyethylene (PE) pipe is selected with grade of PE80 SDR17 for the offshore section and PE100 SDR11 for the onshore section.

Corrib Onshore Pipeline EISAppendix Q4.1
Onshore Pipeline Design Overview
Page 13 of 18
The subsea diffuser is buried and discharges to sea in a vertical direction.
Along the onshore section of the outfall line, permanently installed vent valves will be required to facilitate commissioning. These will be located at high points and installed below ground. They may be used infrequently during operation should air become entrapped in the outfall line (Refer Appendix A Drawing DG802 for a typical vent valve).
The outfall line ties-in to the Gas Terminal facilities at a point close to the gas pipeline pig receiver.
6 UMBILICAL DESIGN
6.1 General
The umbilicals are utilised to communicate services between the Gas Terminal and the subsea facilities. At the subsea manifold the individual connections are made to the subsea wells via jumpers. The cores within the umbilical are described in Section 6.2.
The offshore section from the landfall to the LVI is constructed as a single umbilical laid parallel to the 20” dia gas pipeline. The limit to the maximum umbilical length that can be installed offshore in a single length depends on the maximum weight & volume of the umbilical that can be accommodated by the installation vessel. The number of functions (tubes & cables) is an important determinant of the weight & volume per unit length and thus of the maximum umbilical length achievable. The installation payload of the latest generation of marine construction vessels, equipped either with reels or hull or deck carousels continuously increases. For the Corrib application the offshore umbilical has been reeled as two equal lengths.
The onshore umbilical system will run a distance in the region of 8.3km between the Landfall Valve Installation at Glengad, where a connection with the offshore umbilical shall be made at an Onshore Termination Unit (OTU), and the gas processing Gas Terminal at an Onshore Terminal Termination Unit (OTTU). The umbilicals will be a composite system containing methanol injection system cores, control system lines (communication signals, electrical and hydraulic power) and produced water. To facilitate handling and installation, the onshore umbilical system comprises three umbilicals with intermediate connections at suitable intervals (~ 1km to 1.5 km).
The typical cross section for the onshore umbilical is presented in Appendix A Drawing DG801 and Chapter 4 Figure 3 and illustrated in Figure 6-1.
Figure 6-1. A schematic of the Corrib onshore umbilicals
6.2 Umbilical Configuration
The singe offshore umbilical combines all the services into a single multi-element cable.
Corrib Onshore Pipeline EISAppendix Q4.1
Onshore Pipeline Design Overview
Page 14 of 18
Onshore, two of the umbilicals (No’s 2 and 3) carry the electrical power supply cables, data communications cables, hydraulic fluid pressure lines and methanol lines. The third umbilical (No 1) carries a spare hydraulic fluid pressure line, a supply line for treated produced water disposal, and a spare cable. The duplicated electrical power supply cables, data communication cables and hydraulic fluid pressure lines are carried in different umbilicals.
Details of the elements that comprise the umbilical system are as follows:
6.2.1 Electrical Power and Communications Systems
Duplicated Electrical Power Supply Cables: Screened Twisted Pairs
Duplicated Data Communications Cables: Screened Twisted Pairs
One Common Spare Cable: Screened Twisted Pair
All cables are 16mm2 CSA.
6.2.2 Hydraulic Fluid Supply Systems
LP Supply Lines
Duplicated 210 barg rated: 19mm ID Steel Tubes (proof test 315 barg)
HP Supply Lines
Duplicated 610 barg rated: 12.7mm ID Steel Tubes (proof test 1007 barg)
6.2.3 Methanol Supply System
The four of the methanol supply lines in the Onshore Umbilical System are 25.4mm ID steel tubes rated to 345 barg (proof test 570 barg). Methanol lines will carry a mixture of methanol, corrosion inhibitor and scale inhibitor.
6.2.4 Produced Water Disposal System
One 610 barg rated: 19mm ID Steel Tube (proof test 1007 barg)
One 345 barg rated: 25.4mm ID Steel Tube (proof test 570 barg)
6.3 Connectors
Only proven fully qualified connector designs and systems within umbilical terminations or in-line connection systems will be used.
6.4 Service Fluids
The umbilical cores shall be designed for use with the following fluids:
6.4.1 Hydraulic Control Fluid
A water-based subsea production control fluid. Castrol Transaqua HT2, is transported within the hydraulic lines.
Castrol Transaqua HT2 is 2007 OSPAR compliant with no substitutable components. It is specifically formulated for use as the control medium in surface and subsea production control systems. The fluid incorporates all the features required for operation in a wide range of equipment, and can therefore be used as the operating medium throughout the control system including subsurface safety valve and well control areas.
Corrib Onshore Pipeline EISAppendix Q4.1
Onshore Pipeline Design Overview
Page 15 of 18
Castrol Transaqua HT2 has been developed and qualified under a Quality Management System with ISO 9001:2000 certification and an Environmental Management System with ISO14001:2004 certification for Research and Development.
Qualification testing carried out in accordance with ISO 13628-6 Annex C (2006 E).
6.4.2 Chemical Fluids
The primary fluid is methanol which is transported from the Gas Terminal via the umbilical and injected subsea at the wellheads and manifold to mitigate hydrate formation in the unprocessed gas.
A chemical corrosion inhibitor will be added at the appropriate dosage into the methanol in the Gas Terminal. The methanol and corrosion inhibitor mixture will be chemically scavenged for oxygen. Any potential limitations and/or material compatibility issues associated with the methanol, oxygen scavenger and selected corrosion inhibitor will be identified and tested.
6.4.3 Treated Produced Water
Two cores will be used to transport treated produced water from the onshore Gas Terminal to the offshore subsea manifold, where it will be dispersed subsea.
6.5 Codes and Standards
The primary standards for the umbilical system shall be:
ISO/CD 13628 – 5 Design and Operation of Subsea Production Systems – Subsea Control Umbilicals.
ISO/CD 13628 – 6 Design and Operation of Subsea Production Systems – Subsea Production Control Systems.
The latest editions of all codes including revisions and addenda shall be applied.
6.6 Materials
The materials selected for the Onshore Umbilical System shall be fully compatible with the fluids with which they are to be used. Steel tubes shall comply with the requirements of ISO standard 13628-part 5 or API 17E.
All hydraulic and methanol supply and produced water disposal cores and electrical cables within the Onshore Umbilical System shall be uniquely identified.
6.7 Tubing Material
Steel tubes for the hydraulic, methanol and water supply services shall be seamless ferritic-austenitic (super duplex) stainless steel.
The minimum allowable wall thickness for each of the hydraulic and chemical lines and allowable working pressures given the strength of steel to be used, based on the requirements of ISO 13628 part 5, shall be calculated.
6.8 LVI Offtake
The Onshore Termination Unit (OTU) located at the Landfall Valve Installation will provide the connection between the onshore and offshore umbilicals. At the OTU an offtake will be provided to supply methanol to the Landfall Valve Installation.
Corrib Onshore Pipeline EISAppendix Q4.1
Onshore Pipeline Design Overview
Page 16 of 18
6.9 Prevention of Failure
The umbilical will be tested to the proof pressures (Refer Section 6.2) to verify the pressure integrity of the installed umbilicals.
The umbilical tubing is manufactured from super duplex steel to protect them from internal corrosion. Also it has an external sheath of polyethylene to provide mechanical and external corrosion protection during handling, installation and use.
To minimise risk from third party damage, the onshore gas pipeline, services (including the three umbilicals) will be laid in a trench approximately 2-3m wide with a minimum depth of cover of 1.2m to the onshore gas pipeline.
Measures which further reduce the risk of accidental damage include regular line walks, marker posts at field boundaries, marker tape about 1 foot above the top of the buried gas pipeline and services together with regular liaison with landowners and utility services.
Where the onshore pipeline traverses Sruwaddacon Bay, the pipeline and umbilicals are installed in a tunnel and thus protected from third party damage. The offshore umbilical is installed in a trench over its full length to protect against third party damage
6.10 Leak Detection
A leak detection system will monitor the methanol lines. This will measure the inlet and outlet flow and pressure of the methanol umbilical cores at the Gas Terminal and the wellheads. A leak of any significant rate would be detected within a short period of time. The Gas Terminal Operator will be alerted to any changes in the flow/pressure patterns and the individual umbilical core can be isolated.
7 FIBRE OPTIC CABLE DESIGN The steel wire armoured 24 core fibre optic cable will be compliant to ITU-T Rec. G.652. The fibres are manufactured from high grade silica, doped as necessary to achieve the required light guiding properties and designed with a matched-cladding, step-index profile. The fibre coating is a dual layer structure of ultra-violet cured acrylate resin. The outer layer is optimised for abrasion resistance and fibre processing properties.
7.1 Communications
Seven pairs of cores of the fibre optic cable will be utilised for communication between the LVI and the Gas Terminal. These will transfer data regarding the status of equipment at the LVI, measurements from various instruments, the position of valves etc. together with CCTV and security information.
7.2 Supplementary Leak Detection
Up to three cores within the fibre optic cable will be utilised to monitor for leaks or disturbances along the route of the onshore gas pipeline.
The technology to be utilized is based on fibre optic distributed acoustic sensing (DAS). This technique turns the length of fibre optic cable into a series of “electronic microphones” that listen to sounds around the pipeline and the umbilicals. The system typically separates the fibre optic cable in to 10m lengths as individual microphones. All data will be processed simultaneously by the processing unit located at the Gas Terminal.

Corrib Onshore Pipeline EISAppendix Q4.1
Onshore Pipeline Design Overview
Page 17 of 18
The processing unit will have the ability to interpret the acoustic signal data received and generate alarms / warnings for the Operator. The system will be configured to recognise and report leaks in pipeline / umbilicals, excavation near to the pipeline and pipeline pig movements.
8 SIGNAL CABLE DESIGN The signal cable will be a five pair, 1.5mm2 cross section, cross layered polyethylene insulated cores overall screen, low smoke zero halogen filler, galvanised steel wire armour, low smoke zero halogen outer sheath.
Two separate circuits are used within the cable to transmit the LVI safety shutdown valve close command from the Operator in the Gas Terminal to the LVI.
Field connections between the discrete lengths of signal cable will be required along the length of the installed cable to facilitate handling and installation.

Corrib Onshore Pipeline EISAppendix Q4.1
Onshore Pipeline Design Overview
Page 18 of 18
ATTACHMENT Q4.1 A
Onshore Pipeline Stone Road Settlement Analysis For Pipelines And Services
Shell E&P Ireland Limited
CORRIB FIELD DEVELOPMENT PROJECT
REPORT
Corrib Onshore Pipeline EIS PROJECT No.
052377.01
ATTACHMENT Q4.1A REF
CTR 349
STONE ROAD SETTLEMENT ANALYSIS FOR PIPELINES AND SERVICES
No Of Pages16
DOCUMENT No OFFICE CODE
05PROJECT No
2377AREA
01DIS
PTYPE
3NUMBER
051
03 20/05/2010 Issued For Planning Application GSW JG GSW JG
02 5/05/2010 Issued for Comment GSW JG GSW JG
01 14/04/2010 Issued for IDC NKM GSW GSW JG
REV DATE DESCRIPTION BY CHK ENG PM CLIENT
Corrib Onshore Pipeline EIS Attachment Q4.1A
Stone Road Settlement Analysis For Pipelines and Services
Page 2 of 16
TABLE OF CONTENTS
1 INTRODUCTION.............................................................................................................................3
1.1 General ...............................................................................................................................31.2 Objective.............................................................................................................................31.3 Abbreviations.....................................................................................................................3
2 EXECUTIVE SUMMARY................................................................................................................4
3 OVERVIEW.....................................................................................................................................5
3.1 The Analysis Methodology...............................................................................................53.2 Investigated Pipelines/ Services......................................................................................6
4 LOAD CONDITIONS MODELLED.................................................................................................7
4.1 Key Inputs ..........................................................................................................................7
5 RESULTS .......................................................................................................................................8
5.1 Onshore Gas Pipeline .......................................................................................................85.2 Outfall Pipeline ................................................................................................................105.3 Umbilicals.........................................................................................................................115.4 Fibre Optic Cable & Signal Cable in Duct .....................................................................13
6 CONCLUSION..............................................................................................................................15
7 REFERENCES..............................................................................................................................16
Corrib Onshore Pipeline EIS Attachment Q4.1A
Stone Road Settlement Analysis For Pipelines and Services
Page 3 of 16
1 INTRODUCTION
1.1 General
This report should be read in conjunction with Appendix M2 [1].
This report presents the results from Finite Element Analysis (FEA) modelling for the onshore gas pipeline, umbilicals, outfall pipeline, fibre optic cable and signal cable, when subjected to settlement of the stone road in which they are constructed.
This report supersedes the previous report submitted to the 2009 Oral Hearing, 05-2377-01-P-3-035 Rev 02 Stone Road Settlement Analysis, which assessed the onshore gas pipeline.
1.2 Objective
The objectives of this report are:
1) To assess the effect of settlement in all pipelines and services in the trench and to demonstrate that the design settlement values will not cause loss of containment. The pipelines and services covered in this study includes the onshore gas pipeline, outfall pipeline, umbilicals, fibre optic cable and signal cable;
2) To demonstrate the safety margin inherent in the design by estimating the settlement required to cause loss of containment in the onshore gas pipeline;
3) To assess the stresses developed in the onshore gas pipeline during operation due to an unsupported length occurring within the stone road.
1.3 Abbreviations
FEA Finite Element Analysis
FOC Fibre Optic Cable
LVI Landfall Valve Installation
MRS Minimum Required Strength (for polyethylene pipe)
SEPIL Shell E&P Ireland Limited
SMYS Specified Minimum Yield Strength (for steel pipe)
Corrib Onshore Pipeline EIS Attachment Q4.1A
Stone Road Settlement Analysis For Pipelines and Services
Page 4 of 16
2 EXECUTIVE SUMMARY
A load-displacement analysis of the onshore pipelines and services has been performed to assess the impact on these when subjected to settlement of the stone road. To ensure that the analysis is conservative, and thereby provide a sufficient margin of safety, the analysis has used the displacement values corresponding to Settlement Case 1 [1]. Note that Settlement Case 1 represents the worst case settlement profile.
The study has shown that all pipelines and services remain within their allowable limits under Design and Hydrostatic test (where appropriate) conditions.
For the design case, the onshore gas pipeline is required by the code to remain under 90% of the material SMYS. With the design temperature and pressure, and the Settlement Case 1 profile applied, the onshore gas pipeline remains below 31% of SMYS (or 34% of the allowable stress).
Furthermore, the analyses performed for the onshore gas pipeline use elastic design (the maximum stress calculated using the Von Mises theory must be less than 90% of SMYS). It is noted that a stress level equal to SMYS does not necessarily cause loss of containment. With the pipe stress at SMYS there is further deformation capacity available. With increased loading, local yielding and strain concentration would occur. A strain based approach would show that a significantly higher load can be applied without loss of containment. With the onshore gas pipeline D/t ratio, local buckling/wrinkling is unlikely to occur.
The study for the onshore gas pipeline was extended to determine the settlement displacements at which the onshore gas pipeline would reach SMYS (which is a conservative predictor for pipe loss of containment). This was then compared to the Settlement Case 1 values to demonstrate an additional margin of safety in the design. This showed that the settlement values would need to be increased by a factor of 10 to cause the onshore gas pipeline to reach its SMYS during operation.
Corrib Onshore Pipeline EIS Attachment Q4.1A
Stone Road Settlement Analysis For Pipelines and Services
Page 5 of 16
3 OVERVIEW
3.1 The Analysis Methodology
Finite Element Analysis was used to perform load-displacement analysis of the onshore gas pipeline and services while subject to settlement. The analysis has used the maximum displacement values, which correspond to Settlement Case 1 [1].
Settlement Case 1 is summarised in Section 4.1 of this report below, and represents the worst case settlement. For a full description of Settlement Case 1, refer to the referenced report.
The FEA model includes the complete length of the onshore gas pipeline within the peat areas, and the corresponding Settlement Case 1 displacements.
The displacements provided are at various distances along the onshore gas pipeline route. The spacing between data points varies from 29m to 160m. Where the onshore gas pipeline is routed through an area of no peat (and negligible settlement) into an area of peat (potential increase of settlement) it will do so with a gradual change from one settlement condition to another.
The stone road will be installed from Aghoos (approximately KP 88.908) to the Gas Terminal (approximately KP 91.720). The FEA model has been set up to represent this section of the onshore gas pipeline.
The FEA model has been intentionally built conservatively. The model includes changes in settlement which occur over short distances, which result in higher calculated stresses than would occur in a gradual transition from an area of no peat, to a peat area. The FEA included fixed end and free end models to cover the worst cases.
The FEA evaluation considers two load conditions:
The first is settlement during hydrostatic testing when the onshore gas pipeline is full of pressurised water, and
The second during the onshore gas pipeline operation when the pipeline is full of gas.
For additional conservatism, the design pressure has been used to represent the operating condition. This uses a higher pressure and contents density than the MAOP, and therefore provides higher calculated stresses.
The onshore gas pipeline assessment for unsupported lengths was assessed by calculation, and verified using Caesar II pipe stressing software.
Corrib Onshore Pipeline EIS Attachment Q4.1A
Stone Road Settlement Analysis For Pipelines and Services
Page 6 of 16
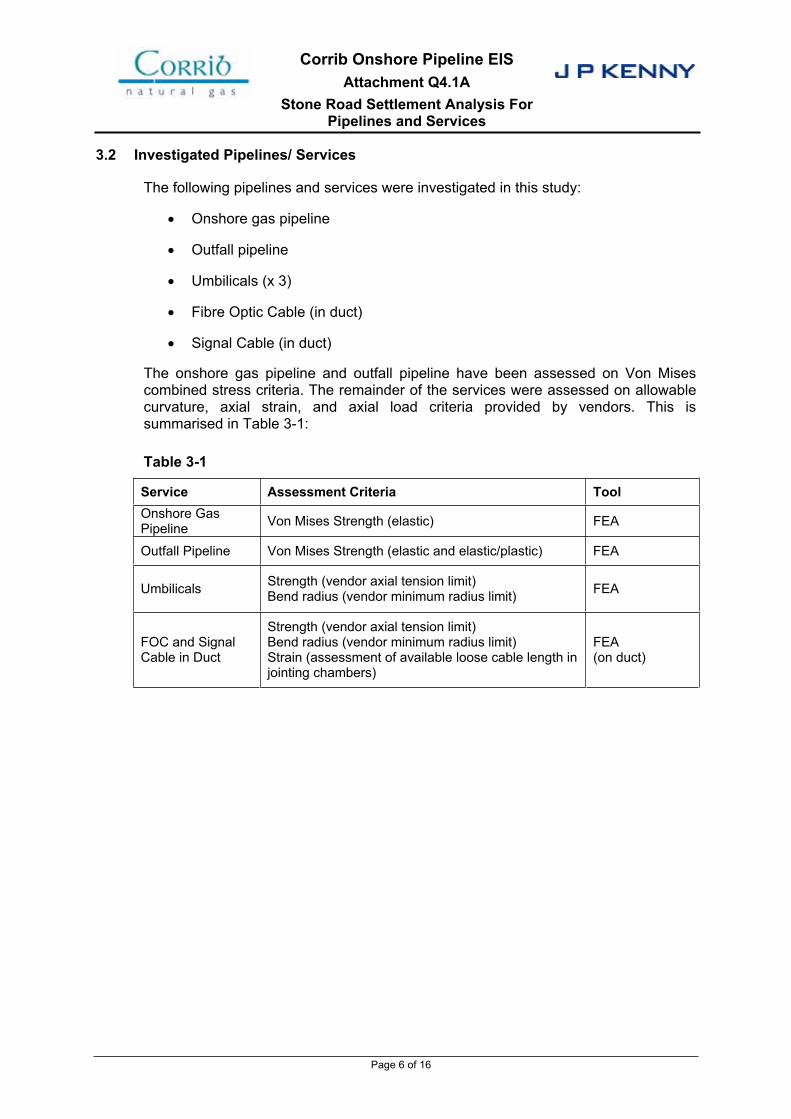
3.2 Investigated Pipelines/ Services
The following pipelines and services were investigated in this study:
Onshore gas pipeline
Outfall pipeline
Umbilicals (x 3)
Fibre Optic Cable (in duct)
Signal Cable (in duct)
The onshore gas pipeline and outfall pipeline have been assessed on Von Mises combined stress criteria. The remainder of the services were assessed on allowable curvature, axial strain, and axial load criteria provided by vendors. This is summarised in Table 3-1:
Table 3-1
Service Assessment Criteria Tool Onshore Gas Pipeline
Von Mises Strength (elastic) FEA
Outfall Pipeline Von Mises Strength (elastic and elastic/plastic) FEA
Umbilicals Strength (vendor axial tension limit) Bend radius (vendor minimum radius limit)
FEA
FOC and Signal Cable in Duct
Strength (vendor axial tension limit) Bend radius (vendor minimum radius limit) Strain (assessment of available loose cable length in jointing chambers)
FEA(on duct)
Corrib Onshore Pipeline EIS Attachment Q4.1A
Stone Road Settlement Analysis For Pipelines and Services
Page 7 of 16
4 LOAD CONDITIONS MODELLED
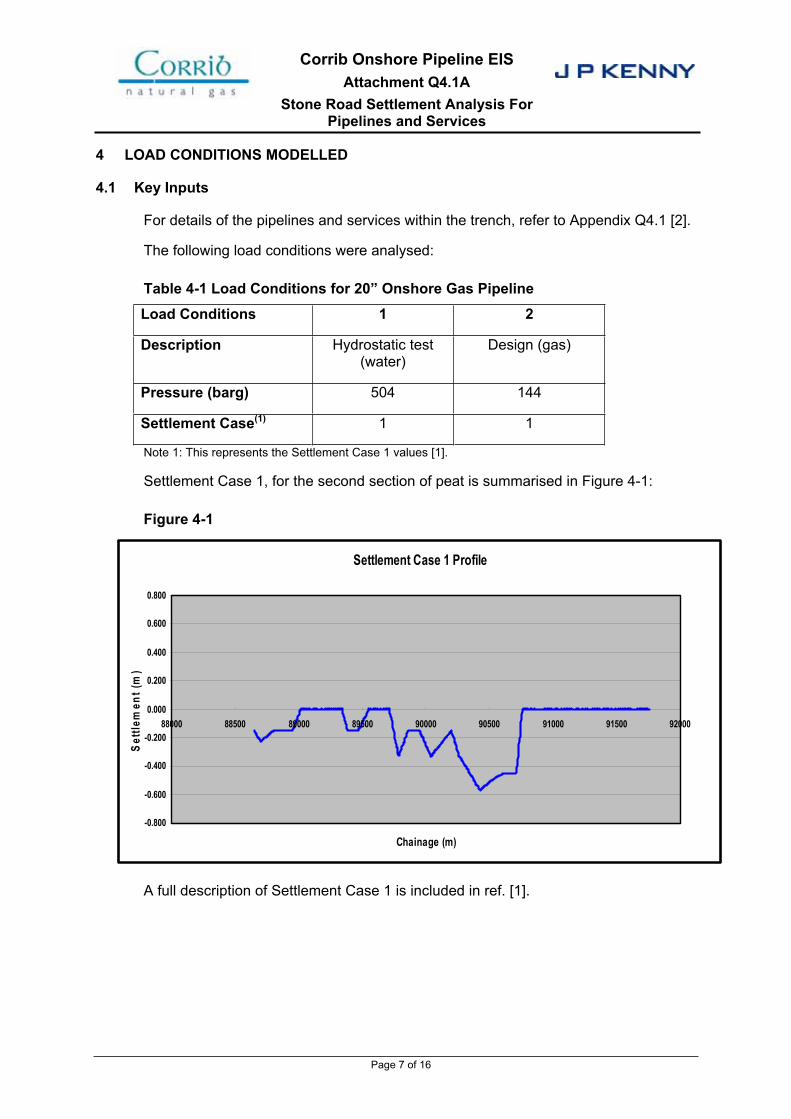
4.1 Key Inputs
For details of the pipelines and services within the trench, refer to Appendix Q4.1 [2].
The following load conditions were analysed:
Table 4-1 Load Conditions for 20” Onshore Gas Pipeline
Load Conditions 1 2
Description Hydrostatic test (water)
Design (gas)
Pressure (barg) 504 144
Settlement Case(1) 1 1
Note 1: This represents the Settlement Case 1 values [1].
Settlement Case 1, for the second section of peat is summarised in Figure 4-1:
Figure 4-1
Settlement Case 1 Profile
-0.800
-0.600
-0.400
-0.200
0.000
0.200
0.400
0.600
0.800
88000 88500 89000 89500 90000 90500 91000 91500 92000
Chainage (m)
Settl
emen
t (m
)
A full description of Settlement Case 1 is included in ref. [1].
Corrib Onshore Pipeline EIS Attachment Q4.1A
Stone Road Settlement Analysis For Pipelines and Services
Page 8 of 16
5 RESULTS
The results of this study are presented below for each pipeline or service. This includes an assessment of the effect of settlement in the particular pipeline or service, for the load conditions as defined in Section 4 of this report.
The results include the calculated and allowable values for the assessment criteria (e.g. stress, tension, bend radius) and the chainage for peak results.
As mentioned above, the onshore gas pipeline assessment was extended to estimate the settlement (in excess of the Settlement Case 1 values) which could lead to loss of containment.
5.1 Onshore Gas Pipeline
The effect of settlement on the onshore gas pipeline was assessed for the load condition as defined in Section 4, and the results are shown below.
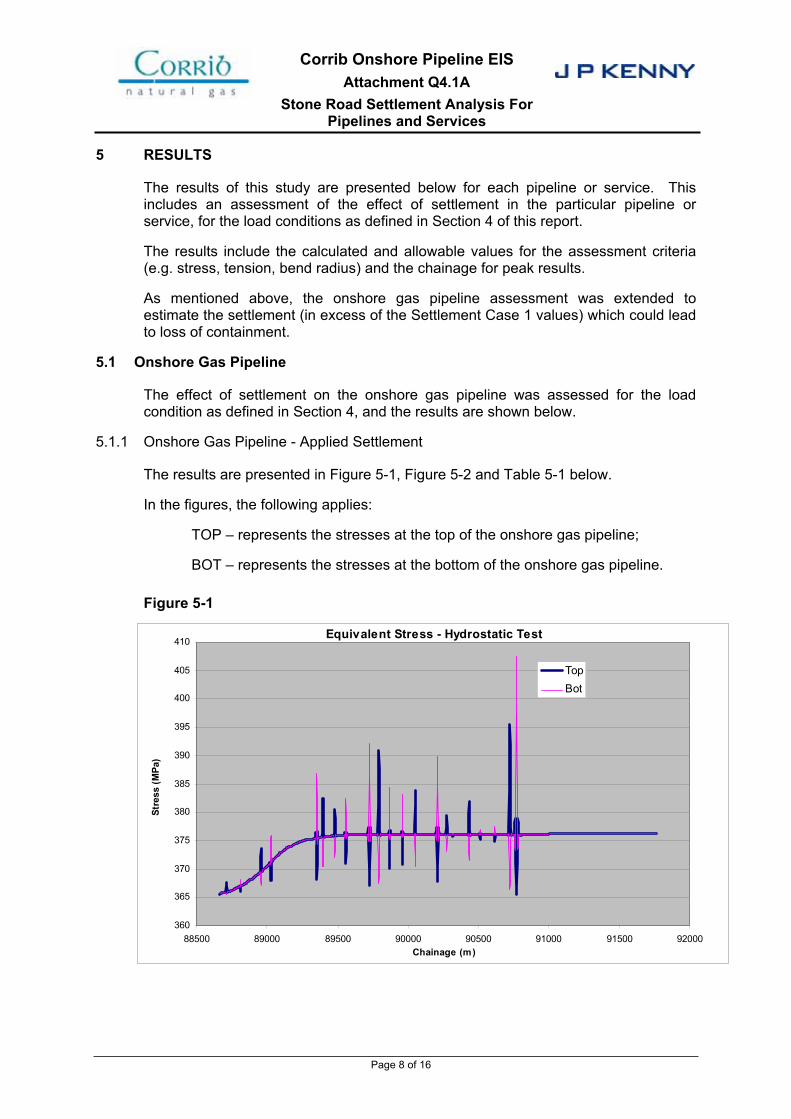
5.1.1 Onshore Gas Pipeline - Applied Settlement
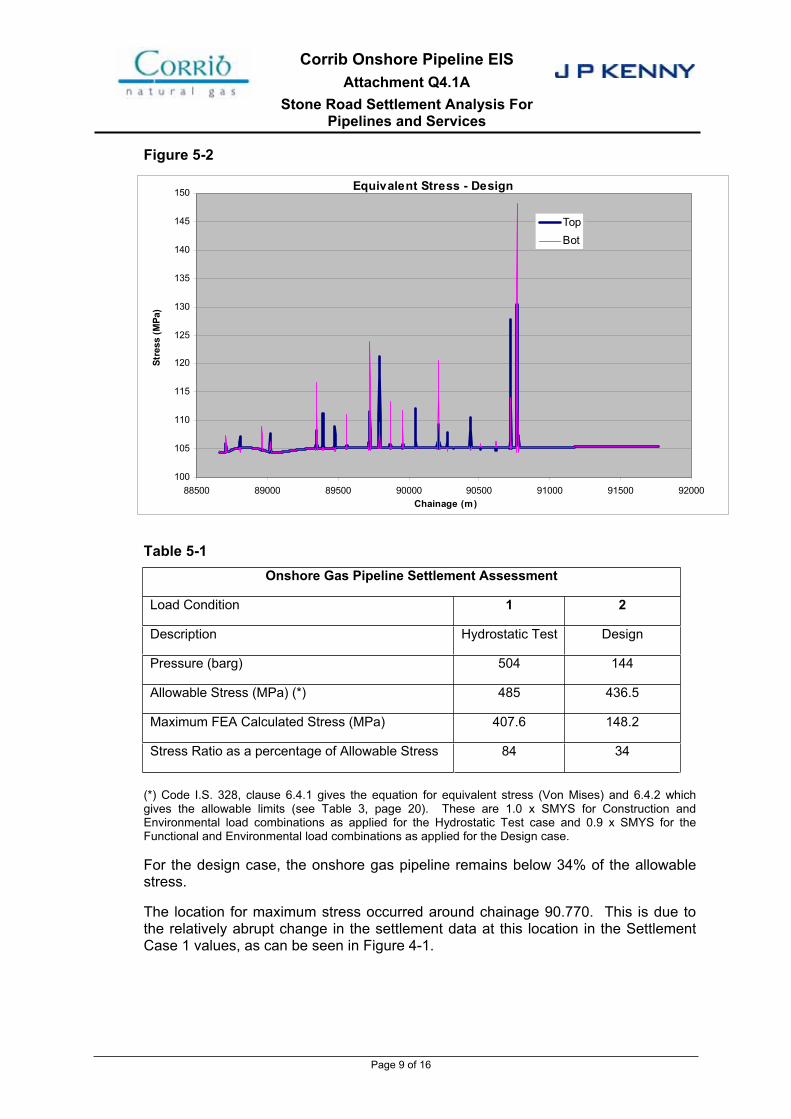
The results are presented in Figure 5-1, Figure 5-2 and Table 5-1 below.
In the figures, the following applies:
TOP – represents the stresses at the top of the onshore gas pipeline;
BOT – represents the stresses at the bottom of the onshore gas pipeline.
Figure 5-1
Equivalent Stress - Hydrostatic Test
360
365
370
375
380
385
390
395
400
405
410
88500 89000 89500 90000 90500 91000 91500 92000
Chainage (m)
Stre
ss (M
Pa)
Top
Bot
Corrib Onshore Pipeline EIS Attachment Q4.1A
Stone Road Settlement Analysis For Pipelines and Services
Page 9 of 16
Figure 5-2
Equivalent Stress - Design
100
105
110
115
120
125
130
135
140
145
150
88500 89000 89500 90000 90500 91000 91500 92000
Chainage (m)
Stre
ss (M
Pa)
Top
Bot
Table 5-1 Onshore Gas Pipeline Settlement Assessment
Load Condition 1 2
Description Hydrostatic Test Design
Pressure (barg) 504 144
Allowable Stress (MPa) (*) 485 436.5
Maximum FEA Calculated Stress (MPa) 407.6 148.2
Stress Ratio as a percentage of Allowable Stress 84 34
(*) Code I.S. 328, clause 6.4.1 gives the equation for equivalent stress (Von Mises) and 6.4.2 which gives the allowable limits (see Table 3, page 20). These are 1.0 x SMYS for Construction and Environmental load combinations as applied for the Hydrostatic Test case and 0.9 x SMYS for the Functional and Environmental load combinations as applied for the Design case.
For the design case, the onshore gas pipeline remains below 34% of the allowable stress.
The location for maximum stress occurred around chainage 90.770. This is due to the relatively abrupt change in the settlement data at this location in the Settlement Case 1 values, as can be seen in Figure 4-1.
Corrib Onshore Pipeline EIS Attachment Q4.1A
Stone Road Settlement Analysis For Pipelines and Services
Page 10 of 16
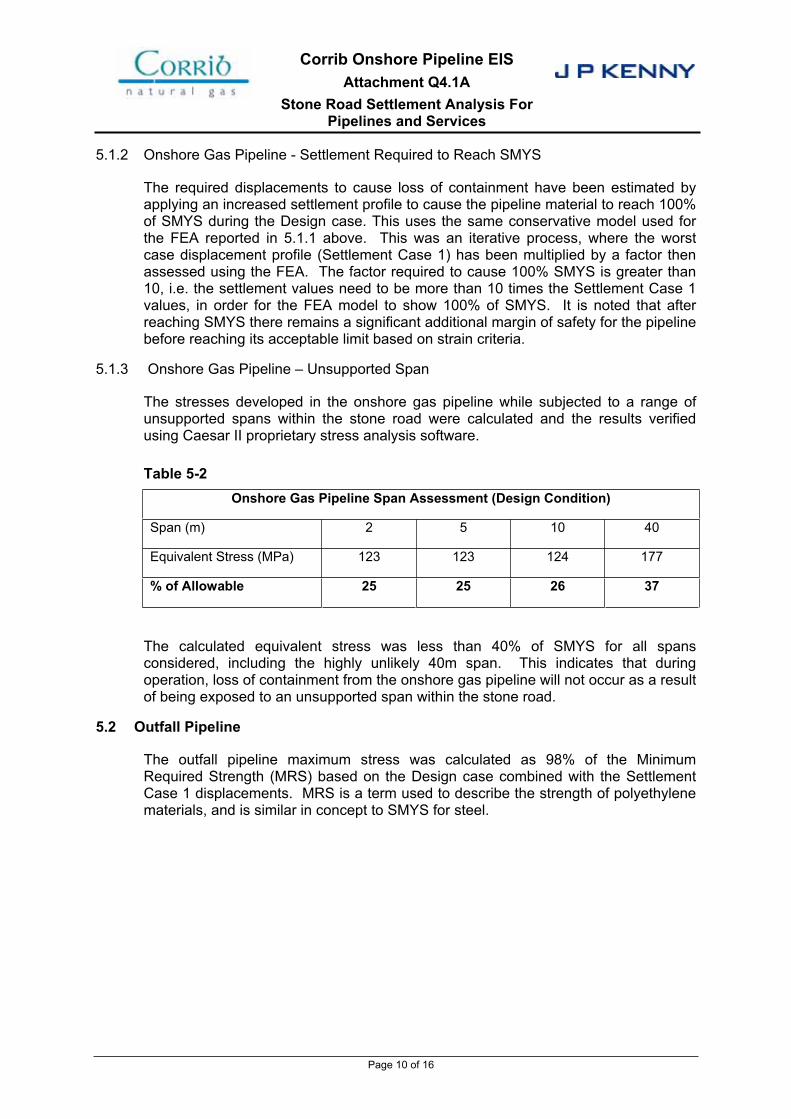
5.1.2 Onshore Gas Pipeline - Settlement Required to Reach SMYS
The required displacements to cause loss of containment have been estimated by applying an increased settlement profile to cause the pipeline material to reach 100% of SMYS during the Design case. This uses the same conservative model used for the FEA reported in 5.1.1 above. This was an iterative process, where the worst case displacement profile (Settlement Case 1) has been multiplied by a factor then assessed using the FEA. The factor required to cause 100% SMYS is greater than 10, i.e. the settlement values need to be more than 10 times the Settlement Case 1 values, in order for the FEA model to show 100% of SMYS. It is noted that after reaching SMYS there remains a significant additional margin of safety for the pipeline before reaching its acceptable limit based on strain criteria.
5.1.3 Onshore Gas Pipeline – Unsupported Span
The stresses developed in the onshore gas pipeline while subjected to a range of unsupported spans within the stone road were calculated and the results verified using Caesar II proprietary stress analysis software.
Table 5-2 Onshore Gas Pipeline Span Assessment (Design Condition)
Span (m) 2 5 10 40
Equivalent Stress (MPa) 123 123 124 177
% of Allowable 25 25 26 37
The calculated equivalent stress was less than 40% of SMYS for all spans considered, including the highly unlikely 40m span. This indicates that during operation, loss of containment from the onshore gas pipeline will not occur as a result of being exposed to an unsupported span within the stone road.
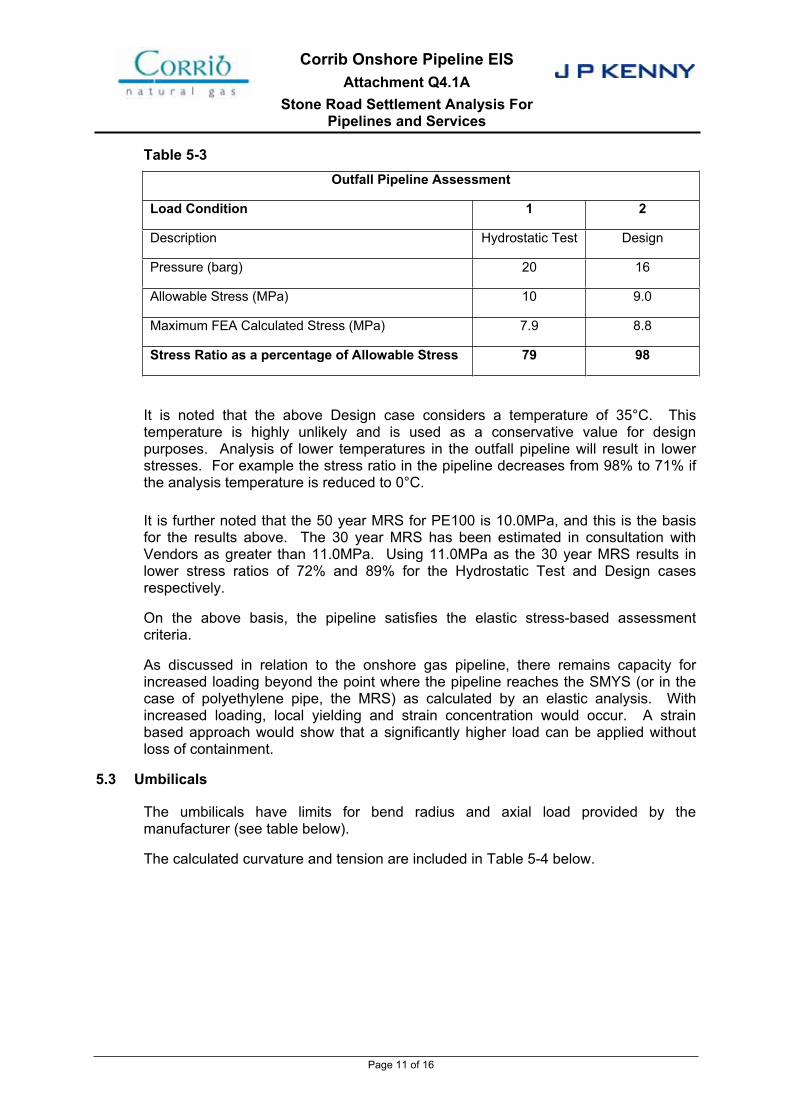
5.2 Outfall Pipeline
The outfall pipeline maximum stress was calculated as 98% of the Minimum Required Strength (MRS) based on the Design case combined with the Settlement Case 1 displacements. MRS is a term used to describe the strength of polyethylene materials, and is similar in concept to SMYS for steel.
Corrib Onshore Pipeline EIS Attachment Q4.1A
Stone Road Settlement Analysis For Pipelines and Services
Page 11 of 16
Table 5-3 Outfall Pipeline Assessment
Load Condition 1 2
Description Hydrostatic Test Design
Pressure (barg) 20 16
Allowable Stress (MPa) 10 9.0
Maximum FEA Calculated Stress (MPa) 7.9 8.8
Stress Ratio as a percentage of Allowable Stress 79 98
It is noted that the above Design case considers a temperature of 35°C. This temperature is highly unlikely and is used as a conservative value for design purposes. Analysis of lower temperatures in the outfall pipeline will result in lower stresses. For example the stress ratio in the pipeline decreases from 98% to 71% if the analysis temperature is reduced to 0°C.
It is further noted that the 50 year MRS for PE100 is 10.0MPa, and this is the basis for the results above. The 30 year MRS has been estimated in consultation with Vendors as greater than 11.0MPa. Using 11.0MPa as the 30 year MRS results in lower stress ratios of 72% and 89% for the Hydrostatic Test and Design cases respectively.
On the above basis, the pipeline satisfies the elastic stress-based assessment criteria.
As discussed in relation to the onshore gas pipeline, there remains capacity for increased loading beyond the point where the pipeline reaches the SMYS (or in the case of polyethylene pipe, the MRS) as calculated by an elastic analysis. With increased loading, local yielding and strain concentration would occur. A strain based approach would show that a significantly higher load can be applied without loss of containment.
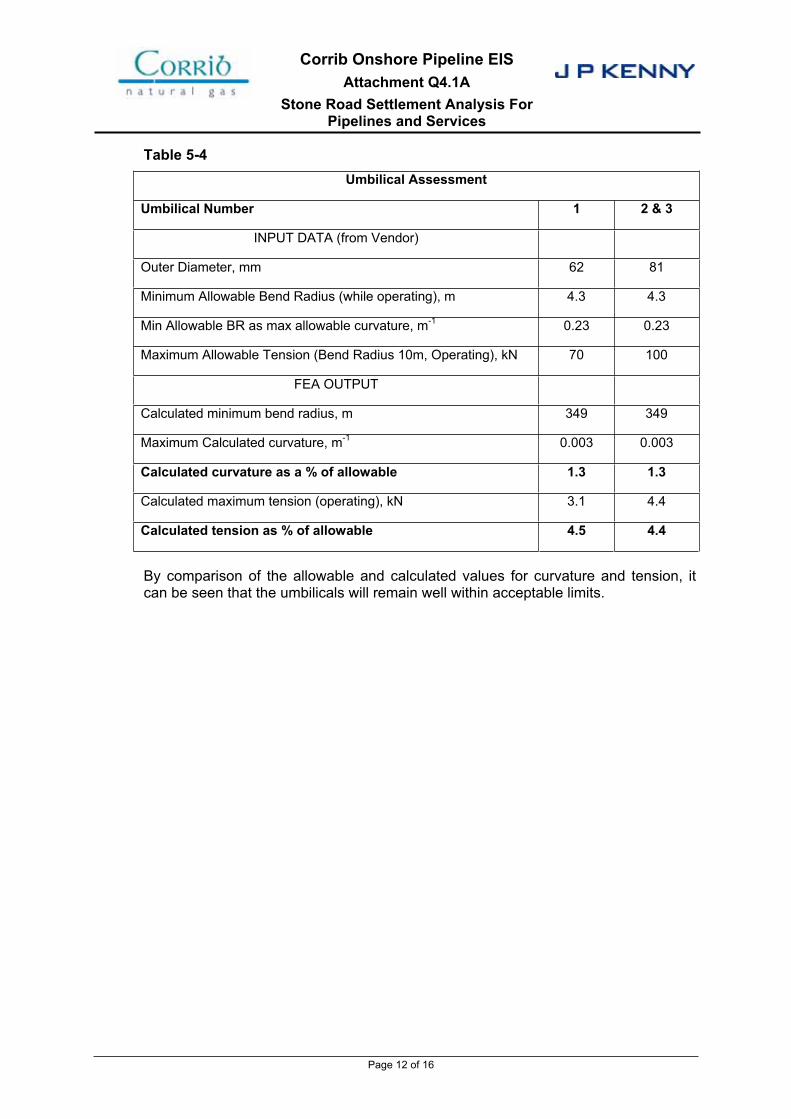
5.3 Umbilicals
The umbilicals have limits for bend radius and axial load provided by the manufacturer (see table below).
The calculated curvature and tension are included in Table 5-4 below.
Corrib Onshore Pipeline EIS Attachment Q4.1A
Stone Road Settlement Analysis For Pipelines and Services
Page 12 of 16
Table 5-4 Umbilical Assessment
Umbilical Number 1 2 & 3
INPUT DATA (from Vendor)
Outer Diameter, mm 62 81
Minimum Allowable Bend Radius (while operating), m 4.3 4.3
Min Allowable BR as max allowable curvature, m-1 0.23 0.23
Maximum Allowable Tension (Bend Radius 10m, Operating), kN 70 100
FEA OUTPUT
Calculated minimum bend radius, m 349 349
Maximum Calculated curvature, m-1 0.003 0.003
Calculated curvature as a % of allowable 1.3 1.3
Calculated maximum tension (operating), kN 3.1 4.4
Calculated tension as % of allowable 4.5 4.4
By comparison of the allowable and calculated values for curvature and tension, it can be seen that the umbilicals will remain well within acceptable limits.
Corrib Onshore Pipeline EIS Attachment Q4.1A
Stone Road Settlement Analysis For Pipelines and Services
Page 13 of 16
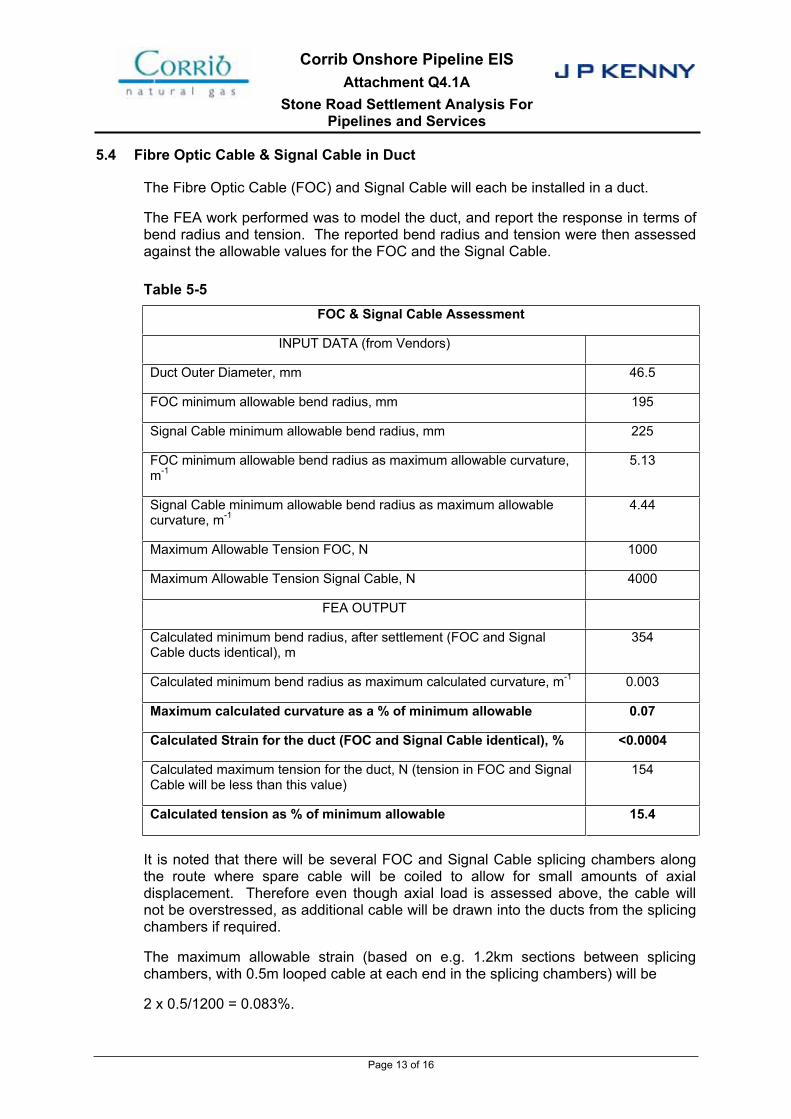
5.4 Fibre Optic Cable & Signal Cable in Duct
The Fibre Optic Cable (FOC) and Signal Cable will each be installed in a duct.
The FEA work performed was to model the duct, and report the response in terms of bend radius and tension. The reported bend radius and tension were then assessed against the allowable values for the FOC and the Signal Cable.
Table 5-5 FOC & Signal Cable Assessment
INPUT DATA (from Vendors)
Duct Outer Diameter, mm 46.5
FOC minimum allowable bend radius, mm 195
Signal Cable minimum allowable bend radius, mm 225
FOC minimum allowable bend radius as maximum allowable curvature, m-1
5.13
Signal Cable minimum allowable bend radius as maximum allowable curvature, m-1
4.44
Maximum Allowable Tension FOC, N 1000
Maximum Allowable Tension Signal Cable, N 4000
FEA OUTPUT
Calculated minimum bend radius, after settlement (FOC and Signal Cable ducts identical), m
354
Calculated minimum bend radius as maximum calculated curvature, m-1 0.003
Maximum calculated curvature as a % of minimum allowable 0.07
Calculated Strain for the duct (FOC and Signal Cable identical), % <0.0004
Calculated maximum tension for the duct, N (tension in FOC and Signal Cable will be less than this value)
154
Calculated tension as % of minimum allowable 15.4
It is noted that there will be several FOC and Signal Cable splicing chambers along the route where spare cable will be coiled to allow for small amounts of axial displacement. Therefore even though axial load is assessed above, the cable will not be overstressed, as additional cable will be drawn into the ducts from the splicing chambers if required.
The maximum allowable strain (based on e.g. 1.2km sections between splicing chambers, with 0.5m looped cable at each end in the splicing chambers) will be
2 x 0.5/1200 = 0.083%.

Corrib Onshore Pipeline EIS Attachment Q4.1A
Stone Road Settlement Analysis For Pipelines and Services
Page 14 of 16
The calculated strain over the modelled route length (above) is less than 0.0004% average. Therefore on an average basis, the calculated strain is two orders of magnitude (100 times) lower than the maximum allowable strain.
The maximum calculated local strain is not considered. This is for two reasons:
1 the duct is polyethylene, and suitable for strain greater than 1% meaning that the duct will not rupture, and
2 the duct is ribbed and lubricated to allow the cable to slide inside the duct, thus the cable will slide within the duct instead of developing tension and axial strain.
Corrib Onshore Pipeline EIS Attachment Q4.1A
Stone Road Settlement Analysis For Pipelines and Services
Page 15 of 16
6 CONCLUSION
The finite element analysis has used the worst case displacements (Settlement Case 1 [1]) for stone road settlement, under two conditions (Hydrostatic Test and Design Pressure) and over the sections of pipeline and services which are routed through significant areas of peat (including the transitions to non-peat areas).
The model has been intentionally built conservatively. The model includes changes in settlement which occur over short distances, which result in higher calculated stresses than would occur in a gradual transition from an area of no peat, to a peat area.
It should be noted that most of the settlement will occur during construction of the stone road, and thus the trench level will be corrected for the majority of the settlement prior to installation of the onshore gas pipeline.
Any further settlement would take place during laying of the onshore gas pipeline and filling of the pipeline with hydrostatic test water. Therefore there would be minimal settlement, if any at all, after gas is introduced into the pipeline.
It is for these reasons that the results of the analysis are considered to be conservative.
The results show that for the onshore gas pipeline, should settlement take place during hydrostatic testing, with the pressure in the pipeline at 504 barg, the calculated stress is within the allowable stress limit.
During operation the pressure will remain below the MAOP. However for conservative calculation purposes the design pressure (144 barg) has been assessed. Should potential settlement occur coincidentally with the design pressure, then the results are also within the allowable stress limit.
It is concluded that the onshore gas pipeline routed through areas of peat and installed in the proposed stone road would not be subject to loss of containment of the linepipe due to the predicted worst case settlement of the stone road.
The effect of settlement on the services such as outfall pipeline, umbilicals, FOC and signal cable was evaluated. These services were assessed on allowable stress, curvature, axial strain, and axial load criteria provided by vendors. The results showed that the design settlement values will not cause failure.
Corrib Onshore Pipeline EIS Attachment Q4.1A
Stone Road Settlement Analysis For Pipelines and Services
Page 16 of 16
7 REFERENCES
1. Appendix M2, ‘'Report on Corrib Onshore Pipeline Ground Stability Assessment’
2. Appendix Q4.1 Onshore Pipeline Design Overview (JPK 05-2377-01-P-3-043)
Allseas Construction Contractors SA
CORRIB FIELD DEVELOPMENT PROJECT
PROJECT No.
052102.01
OFFSHORE DESIGN BASIS REF
No OF SHEETS
23
DOCUMENT No OFFICE CODE
05PROJECT No
2102AREA
01DIS
PTYPE
3NUMBER
100
ALLSEAS DOCUMENT NO.: 8820/D100-01
04 10/05/02 Re-approved for Design CW WAB CW MG GD
03 31/01/02 Approved for Design SMR CW CW SMR GD
02 24/10/01 Issued for Approval CW CS CW MG
01 10/08/01 Issued for Comment CW IK CW MG
REV DATE DESCRIPTION BY CHK ENG PM CLIENT

CORRIB FIELD DEVELOPMENT PROJECT Offshore Design Basis
\\jpkgis\jpkall\052377 corrib\ctr 336 new planning application\offshore design basis\01-p-3-100-04 offshore design basis.doc
Page 2 of 23 2102-01-P-3-100 Rev04
Document Comment Sheet Page of
Date of Review: Reviewed by: Response by: Lead Engineer: Project Engineer:
Areas of Particular Concern:
Review Finding Project Response
Distribution : Project File, Lead Engineer, Project Engineer Manager, Project Manager
CORRIB FIELD DEVELOPMENT PROJECT Offshore Design Basis
\\jpkgis\jpkall\052377 corrib\ctr 336 new planning application\offshore design basis\01-p-3-100-04 offshore design basis.doc
Page 3 of 23 2102-01-P-3-100 Rev04
TABLE OF CONTENTS
1 INTRODUCTION.............................................................................................................................4
1.1 General ...............................................................................................................................4 1.2 Objectives...........................................................................................................................4 1.3 Abbreviations.....................................................................................................................4
2 FIELD DEVELOPMENT .................................................................................................................5
2.1 General ...............................................................................................................................5 2.2 Locations............................................................................................................................5 2.3 Infield Configuration .........................................................................................................6
3 CODES AND STANDARDS...........................................................................................................8
3.1 General ...............................................................................................................................8 3.2 Primary Codes ...................................................................................................................8
4 OPERATIONAL PARAMETERS....................................................................................................9
4.1 General ...............................................................................................................................9 4.2 Reservoir Conditions ........................................................................................................9 4.3 Production Data.................................................................................................................9 4.4 Product Details ................................................................................................................11 4.5 Produced Water ...............................................................................................................12 4.6 Water Outfall Pipeline .....................................................................................................154.7 Umbilical Conduit ............................................................................................................15 4.8 Pigging..............................................................................................................................15
5 ENVIRONMENTAL DATA............................................................................................................16
5.1 General .............................................................................................................................16 5.2 Bathymetry.......................................................................................................................16 5.3 Waves & Currents............................................................................................................16 5.4 Seawater ...........................................................................................................................17
6 SEABED .......................................................................................................................................18
6.1 General .............................................................................................................................18 6.2 Overview...........................................................................................................................18 6.3 Pipeline Route..................................................................................................................18
7 FISHING ACTIVITIES...................................................................................................................20
7.1 General .............................................................................................................................20 7.2 Pelagic Trawling ..............................................................................................................20
8 DESIGN OF SEALINE..................................................................................................................21
8.1 General .............................................................................................................................21 8.2 Routing .............................................................................................................................21 8.3 Wall Thickness.................................................................................................................21 8.4 Stability.............................................................................................................................21 8.5 Mechanical Protection ....................................................................................................218.6 Corrosion Protection & Monitoring ...............................................................................21 8.7 Freespans.........................................................................................................................22 8.8 Landfall .............................................................................................................................22 8.9 Water Outfall Pipeline .....................................................................................................228.10 Umbilical Sleeve ..............................................................................................................22 8.11 PLEM.................................................................................................................................22 8.12 Manifold Tie-in Spool ......................................................................................................22
9 REFERENCES..............................................................................................................................23

CORRIB FIELD DEVELOPMENT PROJECT Offshore Design Basis
\\jpkgis\jpkall\052377 corrib\ctr 336 new planning application\offshore design basis\01-p-3-100-04 offshore design basis.doc
Page 4 of 23 2102-01-P-3-100 Rev04
1 INTRODUCTION
1.1 General
JP Kenny Ltd. has been contracted by Allseas Construction Contractors SA to prepare the detailed design of the pipeline system for the Corrib Field development Project.
Corrib, being developed by Enterprise Energy Ireland Ltd, is a gas field located in 350 m of water some 60 to 65 km off the County Mayo coastline. The field will be developed as a long-range subsea tieback to an onshore facility. The gas will then be treated to meet the defined gas specification before onward transportation to the Bord Gais Eireann (BGE) grid via a new cross-country pipeline.
The subsea facilities will consist of a manifold with cluster wells, together with a number of satellite wells. The pipeline system comprises flexible flowlines from the satellite wells to the manifold, and an export line to shore. This 83km 20-inch subsea pipeline from the manifold makes a landfall at Broadhaven Bay in County Mayo, and thence a further 9km onshore pipeline leads to the terminal. An electro-hydraulic umbilical system will run parallel to the pipeline system, and a water outfall pipeline will also run from the terminal to a diffuser some distance offshore.
1.2 Objectives
The purpose of this document is to collate all the basic design data to be used for the detailed design of the offshore section of the Corrib pipeline system, and the approach to be used for each aspect of the work is also briefly outlined. Design data for the infield and onshore elements is covered in separate documents (Refs 8 & 9).
As further data or constraints become available during the project, this document will be revised to incorporate such requirements, but results and conclusions from engineering of the pipeline system will not be addressed.
Note that although the engineering covered by this document covers the offshore pipeline system, work associated with the tie-in spool at the manifold has been subcontracted by Allseas to Stolt Offshore. This is addressed within the infield facilities.
1.3 Abbreviations
BGE - Bord Gais Eireann
DTM - digital terrain model
EEI - Enterprise Energy Ireland Ltd
ETRF - European Terrestrial Reference Frame
FEED - front end engineering design
JPK - JP Kenny Limited
KP - kilometre point
LAT - lowest astronomical tide
PLEM - pipeline end manifold
SWL - still water level
WGS - World Geodetic System
UTM - Universal Transverse Mercator
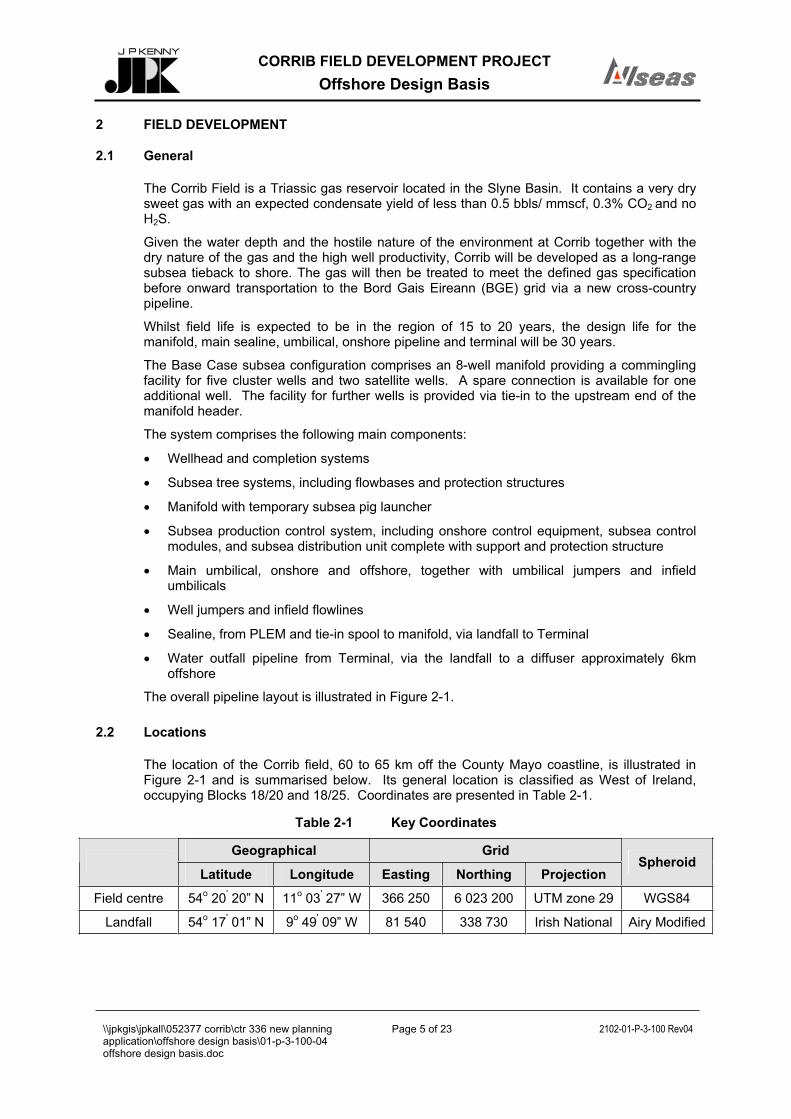
CORRIB FIELD DEVELOPMENT PROJECT Offshore Design Basis
\\jpkgis\jpkall\052377 corrib\ctr 336 new planning application\offshore design basis\01-p-3-100-04 offshore design basis.doc
Page 5 of 23 2102-01-P-3-100 Rev04
2 FIELD DEVELOPMENT
2.1 General
The Corrib Field is a Triassic gas reservoir located in the Slyne Basin. It contains a very dry sweet gas with an expected condensate yield of less than 0.5 bbls/ mmscf, 0.3% CO2 and no H2S.
Given the water depth and the hostile nature of the environment at Corrib together with the dry nature of the gas and the high well productivity, Corrib will be developed as a long-range subsea tieback to shore. The gas will then be treated to meet the defined gas specification before onward transportation to the Bord Gais Eireann (BGE) grid via a new cross-country pipeline.
Whilst field life is expected to be in the region of 15 to 20 years, the design life for the manifold, main sealine, umbilical, onshore pipeline and terminal will be 30 years.
The Base Case subsea configuration comprises an 8-well manifold providing a commingling facility for five cluster wells and two satellite wells. A spare connection is available for one additional well. The facility for further wells is provided via tie-in to the upstream end of the manifold header.
The system comprises the following main components:
Wellhead and completion systems
Subsea tree systems, including flowbases and protection structures
Manifold with temporary subsea pig launcher
Subsea production control system, including onshore control equipment, subsea control modules, and subsea distribution unit complete with support and protection structure
Main umbilical, onshore and offshore, together with umbilical jumpers and infield umbilicals
Well jumpers and infield flowlines
Sealine, from PLEM and tie-in spool to manifold, via landfall to Terminal
Water outfall pipeline from Terminal, via the landfall to a diffuser approximately 6km offshore
The overall pipeline layout is illustrated in Figure 2-1.
2.2 Locations
The location of the Corrib field, 60 to 65 km off the County Mayo coastline, is illustrated in Figure 2-1 and is summarised below. Its general location is classified as West of Ireland, occupying Blocks 18/20 and 18/25. Coordinates are presented in Table 2-1.
Table 2-1 Key Coordinates
Geographical Grid
Latitude Longitude Easting Northing ProjectionSpheroid
Field centre 54o 20' 20” N 11o 03' 27” W 366 250 6 023 200 UTM zone 29 WGS84
Landfall 54o 17' 01” N 9o 49' 09” W 81 540 338 730 Irish National Airy Modified

CORRIB FIELD DEVELOPMENT PROJECT Offshore Design Basis
\\jpkgis\jpkall\052377 corrib\ctr 336 new planning application\offshore design basis\01-p-3-100-04 offshore design basis.doc
Page 6 of 23 2102-01-P-3-100 Rev04
Note that the exact landfall location may be revised during detailed design. Field centre is the approximate location of the well cluster at the Main Drill Centre, and will depend on the final configuration of the cluster.
The offshore engineering work is to be carried out in terms of the ETRF89 geodetic reference frame, which for all practical purposes can be assumed to be based on WGS84. The landfall and onshore parts of the offshore pipelines will be designed using the Irish National Grid (1975), which is based on the Airy Modified Spheroid.
At the landfall, where there is an interface between onshore & offshore systems, co-ordinates will be shown in both systems.
Coordinates of existing wells are listed in Table 2-2. Additional wells are planned at the Main Drill Centre.
Table 2-2 Well Locations
UTM coordinate Well ID Location
Easting Northing
18/20-2z Main Drill Centre 366 242.2 6 023 184.5
18/20-4 Main Drill Centre 366 253.1 6 023 158.8
18/20-3 NE satellite 367 558.5 6 024 112.7
18/25-3 SW daisy chain 365 302.0 6 021 077.0
18/25-1 SE spur 366 753.6 6 020 972.2
2.3 Infield Configuration
At the Main Drill Centre, a total of five wells will be clustered around the manifold, connected by flowline and umbilical jumpers.
Infield flowlines and umbilicals will connect the two satellite wells identified in Table 2-2 to the central manifold. Further infield lines will link the spur well, 18/25-1, in a daisy-chain configuration via the 18/25-3 satellite.
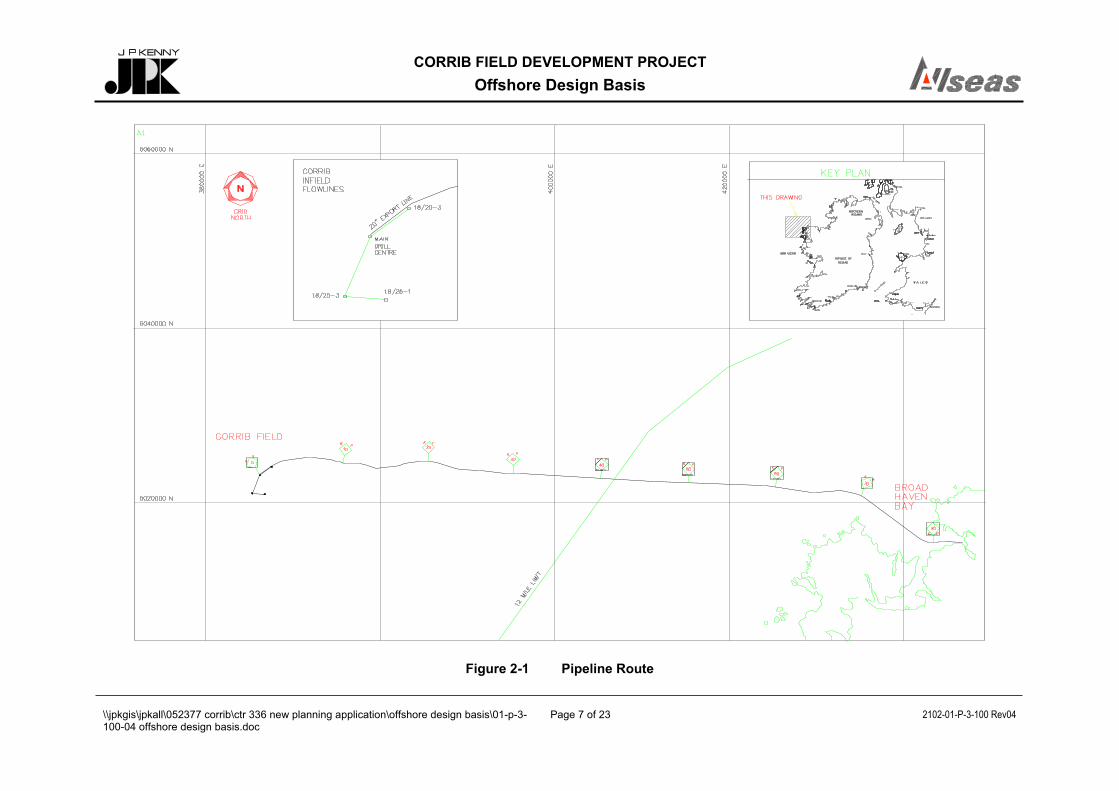
CORRIB FIELD DEVELOPMENT PROJECT Offshore Design Basis
\\jpkgis\jpkall\052377 corrib\ctr 336 new planning application\offshore design basis\01-p-3-100-04 offshore design basis.doc
Page 7 of 23 2102-01-P-3-100 Rev04
Figure 2-1 Pipeline Route
CORRIB FIELD DEVELOPMENT PROJECT Offshore Design Basis
\\jpkgis\jpkall\052377 corrib\ctr 336 new planning application\offshore design basis\01-p-3-100-04 offshore design basis.doc
Page 8 of 23 2102-01-P-3-100 Rev04
3 CODES AND STANDARDS
3.1 General
The pipeline system shall comply with the prevailing legislation applicable to the planning, design, construction, testing, commissioning and operation of pipelines in the Republic of Ireland.
The latest editions of all regulations shall be applied, including revisions and addenda.
The pipeline system from the wells to the terminal is to be classified as an upstream pipeline under the Gas (Interim) (Regulation) Act 2001. Enterprise Energy Ireland are applying for consent under section 40 of the Gas Acts 1976 to 2001 (as amended by the Gas (Interim) (Regulation) Act 2001 section 9(1)(b) ) from the Department of the Marine and Natural Resources to construct and operate an upstream pipeline, which includes both the offshore and onshore elements.
3.2 Primary Codes
The primary code for the design, construction, testing, commissioning and operation of the offshore pipelines is:
DnV OS-F101, Submarine Pipeline Systems (“DnV 2000”).
Where this primary code is non-specific or ambiguous reference shall be made to relevant alternatives, according to good industry practice.
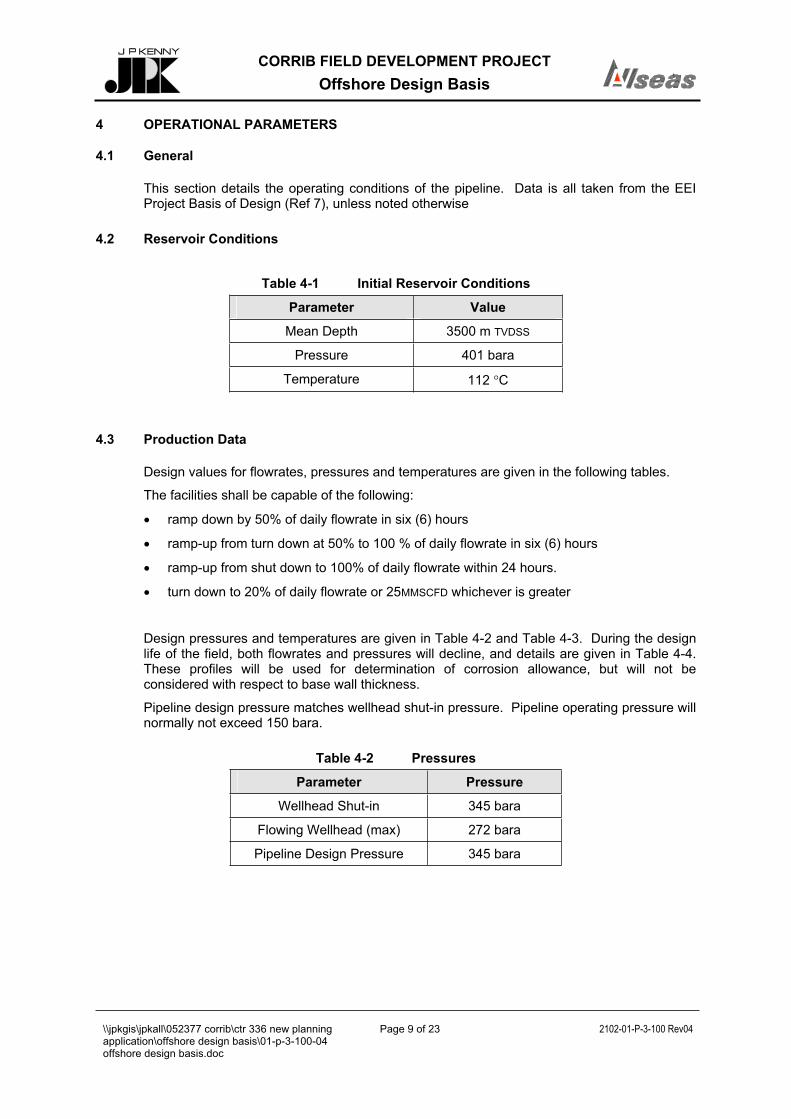
CORRIB FIELD DEVELOPMENT PROJECT Offshore Design Basis
\\jpkgis\jpkall\052377 corrib\ctr 336 new planning application\offshore design basis\01-p-3-100-04 offshore design basis.doc
Page 9 of 23 2102-01-P-3-100 Rev04
4 OPERATIONAL PARAMETERS
4.1 General
This section details the operating conditions of the pipeline. Data is all taken from the EEI Project Basis of Design (Ref 7), unless noted otherwise
4.2 Reservoir Conditions
Table 4-1 Initial Reservoir Conditions
Parameter Value
Mean Depth 3500 m TVDSS
Pressure 401 bara
Temperature 112 C
4.3 Production Data
Design values for flowrates, pressures and temperatures are given in the following tables.
The facilities shall be capable of the following:
ramp down by 50% of daily flowrate in six (6) hours
ramp-up from turn down at 50% to 100 % of daily flowrate in six (6) hours
ramp-up from shut down to 100% of daily flowrate within 24 hours.
turn down to 20% of daily flowrate or 25MMSCFD whichever is greater
Design pressures and temperatures are given in Table 4-2 and Table 4-3. During the design life of the field, both flowrates and pressures will decline, and details are given in Table 4-4. These profiles will be used for determination of corrosion allowance, but will not be considered with respect to base wall thickness.
Pipeline design pressure matches wellhead shut-in pressure. Pipeline operating pressure will normally not exceed 150 bara.
Table 4-2 Pressures
Parameter Pressure
Wellhead Shut-in 345 bara
Flowing Wellhead (max) 272 bara
Pipeline Design Pressure 345 bara
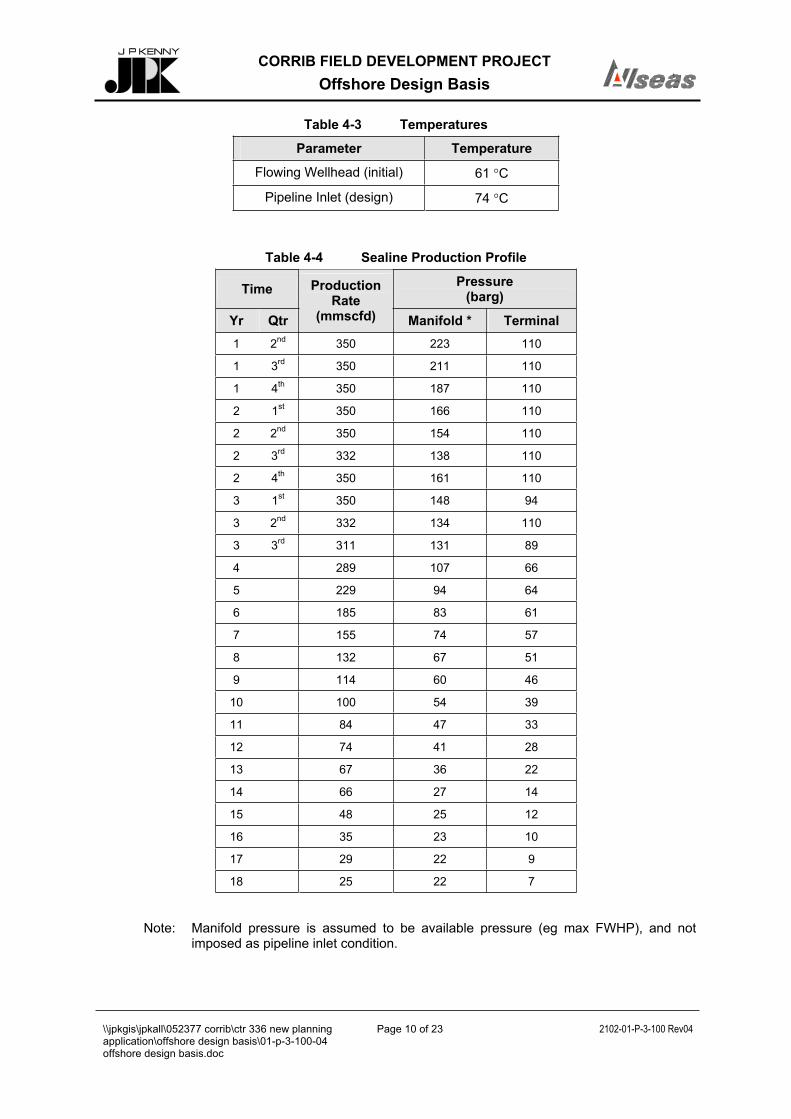
CORRIB FIELD DEVELOPMENT PROJECT Offshore Design Basis
\\jpkgis\jpkall\052377 corrib\ctr 336 new planning application\offshore design basis\01-p-3-100-04 offshore design basis.doc
Page 10 of 23 2102-01-P-3-100 Rev04
Table 4-3 Temperatures
Parameter Temperature
Flowing Wellhead (initial) 61 C
Pipeline Inlet (design) 74 C
Table 4-4 Sealine Production Profile
Time Pressure (barg)
Yr Qtr
ProductionRate
(mmscfd) Manifold * Terminal1 2nd 350 223 110
1 3rd 350 211 110
1 4th 350 187 110
2 1st 350 166 110
2 2nd 350 154 110
2 3rd 332 138 110
2 4th 350 161 110
3 1st 350 148 94
3 2nd 332 134 110
3 3rd 311 131 89
4 289 107 66
5 229 94 64
6 185 83 61
7 155 74 57
8 132 67 51
9 114 60 46
10 100 54 39
11 84 47 33
12 74 41 28
13 67 36 22
14 66 27 14
15 48 25 12
16 35 23 10
17 29 22 9
18 25 22 7
Note: Manifold pressure is assumed to be available pressure (eg max FWHP), and not imposed as pipeline inlet condition.

CORRIB FIELD DEVELOPMENT PROJECT Offshore Design Basis
\\jpkgis\jpkall\052377 corrib\ctr 336 new planning application\offshore design basis\01-p-3-100-04 offshore design basis.doc
Page 11 of 23 2102-01-P-3-100 Rev04
4.4 Product Details
Although test data is available from five Corrib wells, for process simulation and pipeline design purposes, the properties given in the following tables shall be used.
Table 4-5 Product Properties
WellParameter
18/ 25-1 18/20-3 18/ 20-4
Relative Density (Air=1) 0.587 0.589 0.586
Average MW (g/mole) 17.0 17.0 17.0
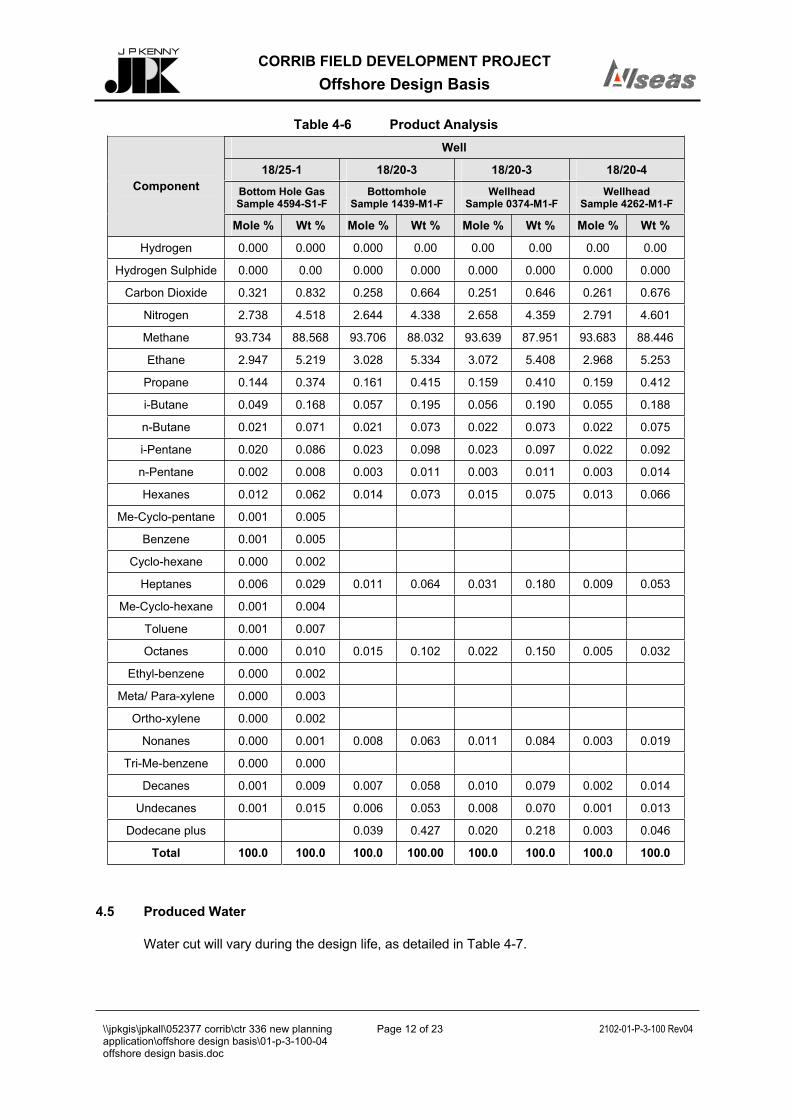
CORRIB FIELD DEVELOPMENT PROJECT Offshore Design Basis
\\jpkgis\jpkall\052377 corrib\ctr 336 new planning application\offshore design basis\01-p-3-100-04 offshore design basis.doc
Page 12 of 23 2102-01-P-3-100 Rev04
Table 4-6 Product Analysis Well
18/25-1 18/20-3 18/20-3 18/20-4
Bottom Hole Gas Sample 4594-S1-F
Bottomhole Sample 1439-M1-F
WellheadSample 0374-M1-F
WellheadSample 4262-M1-F
Component
Mole % Wt % Mole % Wt % Mole % Wt % Mole % Wt %
Hydrogen 0.000 0.000 0.000 0.00 0.00 0.00 0.00 0.00
Hydrogen Sulphide 0.000 0.00 0.000 0.000 0.000 0.000 0.000 0.000
Carbon Dioxide 0.321 0.832 0.258 0.664 0.251 0.646 0.261 0.676
Nitrogen 2.738 4.518 2.644 4.338 2.658 4.359 2.791 4.601
Methane 93.734 88.568 93.706 88.032 93.639 87.951 93.683 88.446
Ethane 2.947 5.219 3.028 5.334 3.072 5.408 2.968 5.253
Propane 0.144 0.374 0.161 0.415 0.159 0.410 0.159 0.412
i-Butane 0.049 0.168 0.057 0.195 0.056 0.190 0.055 0.188
n-Butane 0.021 0.071 0.021 0.073 0.022 0.073 0.022 0.075
i-Pentane 0.020 0.086 0.023 0.098 0.023 0.097 0.022 0.092
n-Pentane 0.002 0.008 0.003 0.011 0.003 0.011 0.003 0.014
Hexanes 0.012 0.062 0.014 0.073 0.015 0.075 0.013 0.066
Me-Cyclo-pentane 0.001 0.005
Benzene 0.001 0.005
Cyclo-hexane 0.000 0.002
Heptanes 0.006 0.029 0.011 0.064 0.031 0.180 0.009 0.053
Me-Cyclo-hexane 0.001 0.004
Toluene 0.001 0.007
Octanes 0.000 0.010 0.015 0.102 0.022 0.150 0.005 0.032
Ethyl-benzene 0.000 0.002
Meta/ Para-xylene 0.000 0.003
Ortho-xylene 0.000 0.002
Nonanes 0.000 0.001 0.008 0.063 0.011 0.084 0.003 0.019
Tri-Me-benzene 0.000 0.000
Decanes 0.001 0.009 0.007 0.058 0.010 0.079 0.002 0.014
Undecanes 0.001 0.015 0.006 0.053 0.008 0.070 0.001 0.013
Dodecane plus 0.039 0.427 0.020 0.218 0.003 0.046
Total 100.0 100.0 100.0 100.00 100.0 100.0 100.0 100.0
4.5 Produced Water
Water cut will vary during the design life, as detailed in Table 4-7.
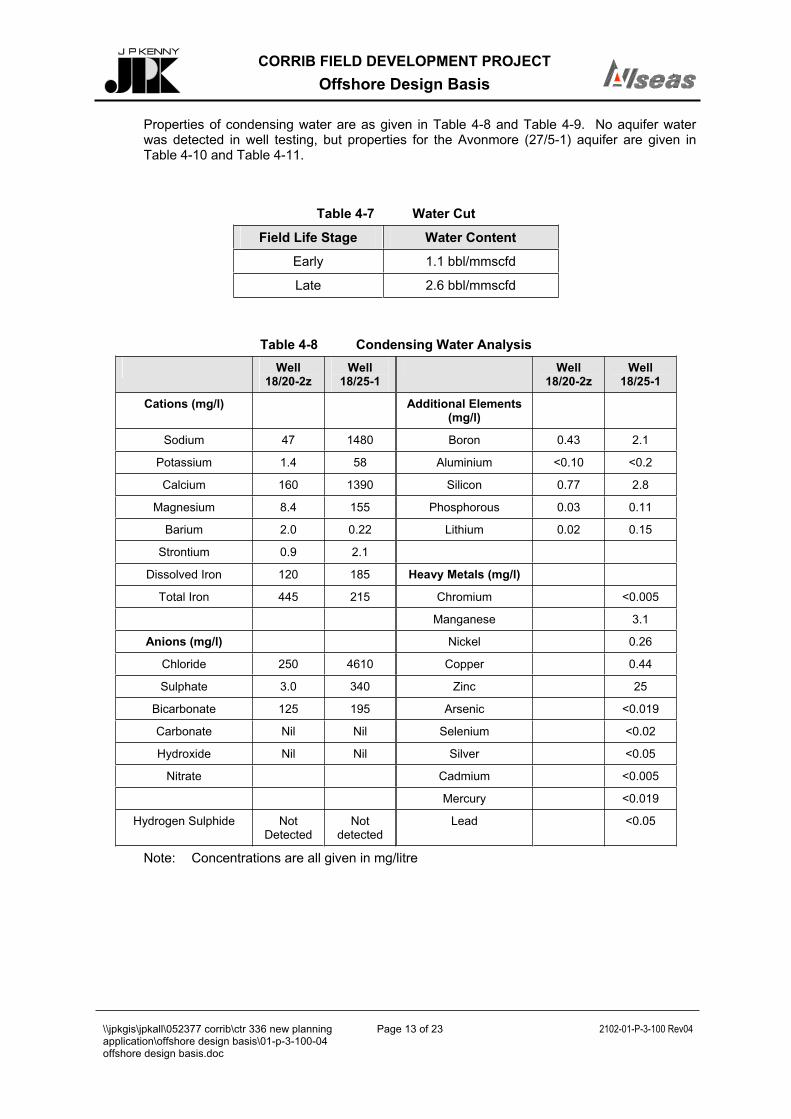
CORRIB FIELD DEVELOPMENT PROJECT Offshore Design Basis
\\jpkgis\jpkall\052377 corrib\ctr 336 new planning application\offshore design basis\01-p-3-100-04 offshore design basis.doc
Page 13 of 23 2102-01-P-3-100 Rev04
Properties of condensing water are as given in Table 4-8 and Table 4-9. No aquifer water was detected in well testing, but properties for the Avonmore (27/5-1) aquifer are given in Table 4-10 and Table 4-11.
Table 4-7 Water Cut
Field Life Stage Water Content
Early 1.1 bbl/mmscfd
Late 2.6 bbl/mmscfd
Table 4-8 Condensing Water Analysis Well
18/20-2z Well
18/25-1 Well
18/20-2z Well
18/25-1
Cations (mg/l) Additional Elements (mg/l)
Sodium 47 1480 Boron 0.43 2.1
Potassium 1.4 58 Aluminium <0.10 <0.2
Calcium 160 1390 Silicon 0.77 2.8
Magnesium 8.4 155 Phosphorous 0.03 0.11
Barium 2.0 0.22 Lithium 0.02 0.15
Strontium 0.9 2.1
Dissolved Iron 120 185 Heavy Metals (mg/l)
Total Iron 445 215 Chromium <0.005
Manganese 3.1
Anions (mg/l) Nickel 0.26
Chloride 250 4610 Copper 0.44
Sulphate 3.0 340 Zinc 25
Bicarbonate 125 195 Arsenic <0.019
Carbonate Nil Nil Selenium <0.02
Hydroxide Nil Nil Silver <0.05
Nitrate Cadmium <0.005
Mercury <0.019
Hydrogen Sulphide NotDetected
Notdetected
Lead <0.05
Note: Concentrations are all given in mg/litre
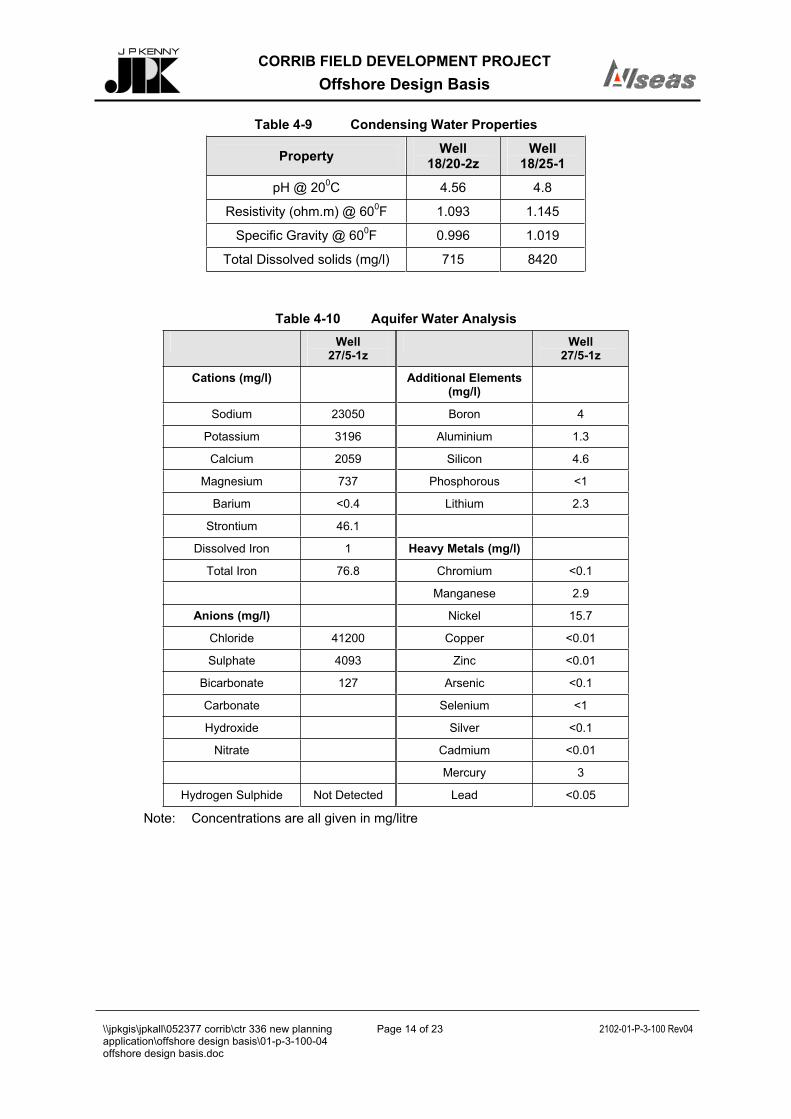
CORRIB FIELD DEVELOPMENT PROJECT Offshore Design Basis
\\jpkgis\jpkall\052377 corrib\ctr 336 new planning application\offshore design basis\01-p-3-100-04 offshore design basis.doc
Page 14 of 23 2102-01-P-3-100 Rev04
Table 4-9 Condensing Water Properties
Property Well18/20-2z
Well18/25-1
pH @ 200C 4.56 4.8
Resistivity (ohm.m) @ 600F 1.093 1.145
Specific Gravity @ 600F 0.996 1.019
Total Dissolved solids (mg/l) 715 8420
Table 4-10 Aquifer Water Analysis Well
27/5-1zWell
27/5-1z
Cations (mg/l) Additional Elements (mg/l)
Sodium 23050 Boron 4
Potassium 3196 Aluminium 1.3
Calcium 2059 Silicon 4.6
Magnesium 737 Phosphorous <1
Barium <0.4 Lithium 2.3
Strontium 46.1
Dissolved Iron 1 Heavy Metals (mg/l)
Total Iron 76.8 Chromium <0.1
Manganese 2.9
Anions (mg/l) Nickel 15.7
Chloride 41200 Copper <0.01
Sulphate 4093 Zinc <0.01
Bicarbonate 127 Arsenic <0.1
Carbonate Selenium <1
Hydroxide Silver <0.1
Nitrate Cadmium <0.01
Mercury 3
Hydrogen Sulphide Not Detected Lead <0.05
Note: Concentrations are all given in mg/litre
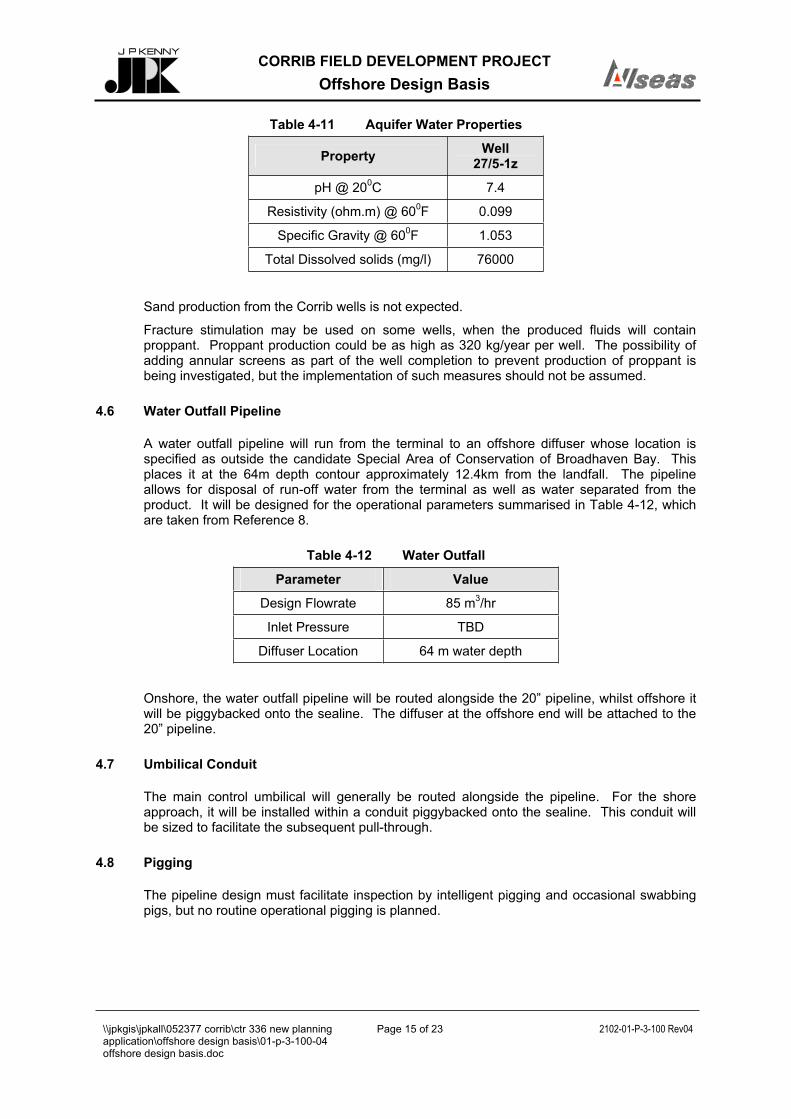
CORRIB FIELD DEVELOPMENT PROJECT Offshore Design Basis
\\jpkgis\jpkall\052377 corrib\ctr 336 new planning application\offshore design basis\01-p-3-100-04 offshore design basis.doc
Page 15 of 23 2102-01-P-3-100 Rev04
Table 4-11 Aquifer Water Properties
Property Well27/5-1z
pH @ 200C 7.4
Resistivity (ohm.m) @ 600F 0.099
Specific Gravity @ 600F 1.053
Total Dissolved solids (mg/l) 76000
Sand production from the Corrib wells is not expected.
Fracture stimulation may be used on some wells, when the produced fluids will contain proppant. Proppant production could be as high as 320 kg/year per well. The possibility of adding annular screens as part of the well completion to prevent production of proppant is being investigated, but the implementation of such measures should not be assumed.
4.6 Water Outfall Pipeline
A water outfall pipeline will run from the terminal to an offshore diffuser whose location is specified as outside the candidate Special Area of Conservation of Broadhaven Bay. This places it at the 64m depth contour approximately 12.4km from the landfall. The pipeline allows for disposal of run-off water from the terminal as well as water separated from the product. It will be designed for the operational parameters summarised in Table 4-12, which are taken from Reference 8.
Table 4-12 Water Outfall
Parameter Value
Design Flowrate 85 m3/hr
Inlet Pressure TBD
Diffuser Location 64 m water depth
Onshore, the water outfall pipeline will be routed alongside the 20” pipeline, whilst offshore it will be piggybacked onto the sealine. The diffuser at the offshore end will be attached to the 20” pipeline.
4.7 Umbilical Conduit
The main control umbilical will generally be routed alongside the pipeline. For the shore approach, it will be installed within a conduit piggybacked onto the sealine. This conduit will be sized to facilitate the subsequent pull-through.
4.8 Pigging
The pipeline design must facilitate inspection by intelligent pigging and occasional swabbing pigs, but no routine operational pigging is planned.
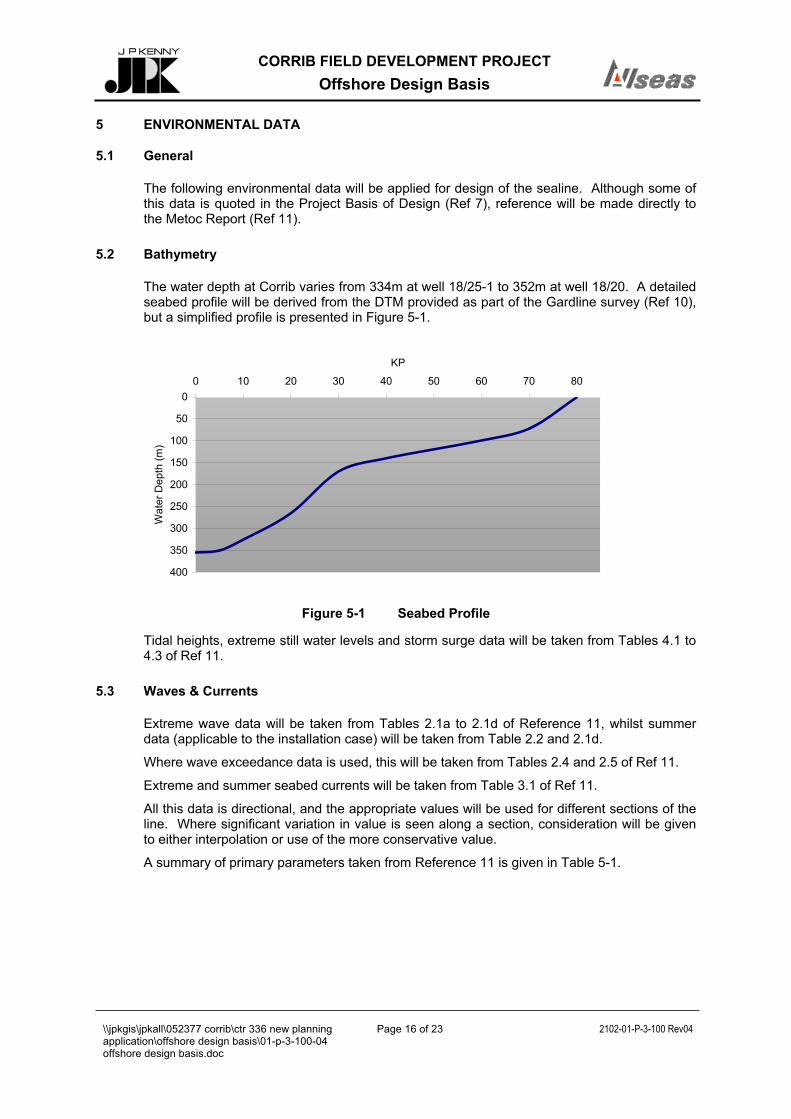
CORRIB FIELD DEVELOPMENT PROJECT Offshore Design Basis
\\jpkgis\jpkall\052377 corrib\ctr 336 new planning application\offshore design basis\01-p-3-100-04 offshore design basis.doc
Page 16 of 23 2102-01-P-3-100 Rev04
5 ENVIRONMENTAL DATA
5.1 General
The following environmental data will be applied for design of the sealine. Although some of this data is quoted in the Project Basis of Design (Ref 7), reference will be made directly to the Metoc Report (Ref 11).
5.2 Bathymetry
The water depth at Corrib varies from 334m at well 18/25-1 to 352m at well 18/20. A detailed seabed profile will be derived from the DTM provided as part of the Gardline survey (Ref 10), but a simplified profile is presented in Figure 5-1.
Figure 5-1 Seabed Profile
Tidal heights, extreme still water levels and storm surge data will be taken from Tables 4.1 to 4.3 of Ref 11.
5.3 Waves & Currents
Extreme wave data will be taken from Tables 2.1a to 2.1d of Reference 11, whilst summer data (applicable to the installation case) will be taken from Table 2.2 and 2.1d.
Where wave exceedance data is used, this will be taken from Tables 2.4 and 2.5 of Ref 11.
Extreme and summer seabed currents will be taken from Table 3.1 of Ref 11.
All this data is directional, and the appropriate values will be used for different sections of the line. Where significant variation in value is seen along a section, consideration will be given to either interpolation or use of the more conservative value.
A summary of primary parameters taken from Reference 11 is given in Table 5-1.
0
50
100
150
200
250
300
350
400
0 10 20 30 40 50 60 70 80
KP
Wa
ter
De
pth
(m
)

CORRIB FIELD DEVELOPMENT PROJECT Offshore Design Basis
\\jpkgis\jpkall\052377 corrib\ctr 336 new planning application\offshore design basis\01-p-3-100-04 offshore design basis.doc
Page 17 of 23 2102-01-P-3-100 Rev04
Table 5-1 Wave & Current Summary (Corrib Field)
Return Period (Years)
1 5 100
Significant Wave Height, Hs (m) 15.9 18.1 22.4
Period, Tz (s) 13.5 14.5 16.1
Maximum Wave Height, Hmax (m) 27.8 31.8 39.2
Period, Tmax (s) 17.3 18.5 20.6
Current @ 1m above seabed(m/s) 0.42 0.45 0.50
5.4 Seawater
Properties of seawater are given in Table 5-2 below
Table 5-2 Seawater Properties
Parameter Value
Density 1025 kg/m3
Viscosity 1.51x10⁻⁶ m2/s
Seawater temperatures for both extreme and installation cases will be taken from Table 5.1 of Ref 11. For the Corrib Field location, extremes are as given in Table 5-3
Table 5-3 Extreme Temperatures at Corrib
Temperature Value
Minimum 6 C
Maximum 12.7 C
CORRIB FIELD DEVELOPMENT PROJECT Offshore Design Basis
\\jpkgis\jpkall\052377 corrib\ctr 336 new planning application\offshore design basis\01-p-3-100-04 offshore design basis.doc
Page 18 of 23 2102-01-P-3-100 Rev04
6 SEABED
6.1 General
The following summary of seabed conditions and soils is taken from the Gardline Route Survey (Ref 10).
KP’s run from zero at appraisal well 18/20-2z, to shallow water at KP82.5.
6.2 Overview
The route lies on the Continental shelf and slope. The shelf break occurs at approximately KP15 at a water depth of around 200m and represents the change from the shelf to the steeper slope. The topography of the slope is attributed to many causes, including the volume of sediment transport from the shelves, the angularity of the underlying Tertiary age erosional surfaces, slope instability, current erosion and deposition, and iceberg scouring. The upper slope, to a depth of approximately 500m, shows small scale irregularities due to iceberg scouring, whereas the middle and lower slopes (in deeper water than the proposed development) range from smooth to hummocky, resulting from the actions of mass flow deposits. Scarps, gullies and channels are common. The slope steepens to the west of the Corrib Field, reaching a depth of about 2500m in the Rockall Trough.
The seabed is covered by a patchy veneer of unconsolidated sediments, consisting of a mixture of terrigenous and biogenic derived material. These range in thickness from a few centimetres up to about 2m.
Sandy gravels cover the seabed on the shelf from shallow water down to around 100m depth, beyond which sandy sediments will predominate. Shallow bedrock and glacial till will underlie these, and be exposed locally.
The present-day shelf break is taken to be at approximately 200m water depth, with firm to hard (>40 kPa) Late Pleistocene / Holocene glacial tills above the shelf break. Below the shelf break, very soft to soft (<40 kPa) Late Pleistocene / Holocene mud (>50% mud, <5% gravel). Soft to firm glacial tills may occur immediately below the shelf break. Quaternary deposits are likely to exceed 100m in thickness beyond the shelf break. Gravel and cobble beds, including occasional boulders, have been described in the region of the shelfbreak north of the route, and their possible occurrence along the route should be considered.
Sandy muds should be prevalent on the slope, while muds occupy the deeper waters.
No significant bedforms are anticipated, although localised zones of sand streaks, sand ribbons, and longitudinal sand patches may occur above the shelf break. Where sand ribbons occur on the slope (down to water depths of 600m), they are likely to be approximately 15m apart, up to 1500m long, and less than 1m high. Abundant evidence of iceberg ploughmarks is described in a swathe approximately 25km wide following the shelf break. Sand and clay should partially fill iceberg scour marks and other hollows.
6.3 Pipeline Route
The following is a description of the main route, taken from the SEtech Soils Report forming Appendix N to Volume 7 of the Gardline Survey (Ref 10).
KP0.0 – KP14
A veneer of silty sand, less than 0.5m thick (and locally absent), overlies very soft to soft sandy, occasionally gravelly, clay. Coarse gravel and cobbles occasionally occur locally. Numerous small ploughmarks are described and, during the survey, were attributed to dewatering of the upper sediments. Localised iceberg ploughmarks occur, infilled by soft silty clay. Coarse gravel and cobbles occur on the ploughmark shoulders.

CORRIB FIELD DEVELOPMENT PROJECT Offshore Design Basis
\\jpkgis\jpkall\052377 corrib\ctr 336 new planning application\offshore design basis\01-p-3-100-04 offshore design basis.doc
Page 19 of 23 2102-01-P-3-100 Rev04
Beyond KP8.5, the clay becomes soft to firm, then firm beyond KP11.5.
KP14 – KP71
A veneer of silty sand, less than 0.5m thick (and locally absent), overlies firm to stiff sandy, occasionally gravelly, clay. Coarse gravel and cobbles occasionally occur locally. Localised iceberg ploughmarks occur, infilled by soft silty clay. Coarse gravel and cobbles occur on the ploughmark shoulders.
Around KP17, thin megarippled sand overlies the clay infill to ploughmarks. Similar megaripples occur within the sand veneer at the seabed from KP19-28. Beyond KP19 the sand veneer becomes predominantly coarse gravel, with local cobbles and small boulders. The sand tends to be present only in depressions.
Beyond KP18, the clay becomes a firm to stiff, locally hard, gravelly sandy clay, becoming stiff to hard beyond KP19.
Beyond KP25.5 the clay is described as a structureless firm to stiff (locally soft to firm) gravelly sandy clay. Up to 0.5m of the upper section of this clay formation comprises a dense gravel layer. A medium dense to dense sand layer, initially less than 1m thick but increasing to in excess of 2m, occurs above this. This sand is locally rippled, gravelly and/or absent.
Beyond KP43, the clay becomes stiff to hard, and very stiff to hard beyond KP52. The sand cover also becomes more patchy between KP52 and KP69.
KP71 – KP82.5
The sand layer continues to increase in thickness, such that any underlying sediments are not identified by sampling or geophysics. They are described as being dense to very dense sands, becoming sands and gravels, exceeding 5m in thickness (>10m by KP73).
Rock is indicated to subcrop at 5-10m depth between KP74.5-75.
The geophysics identified a peat deposit between KP80.7-81.2, although no physical sampling or testing verifies this.
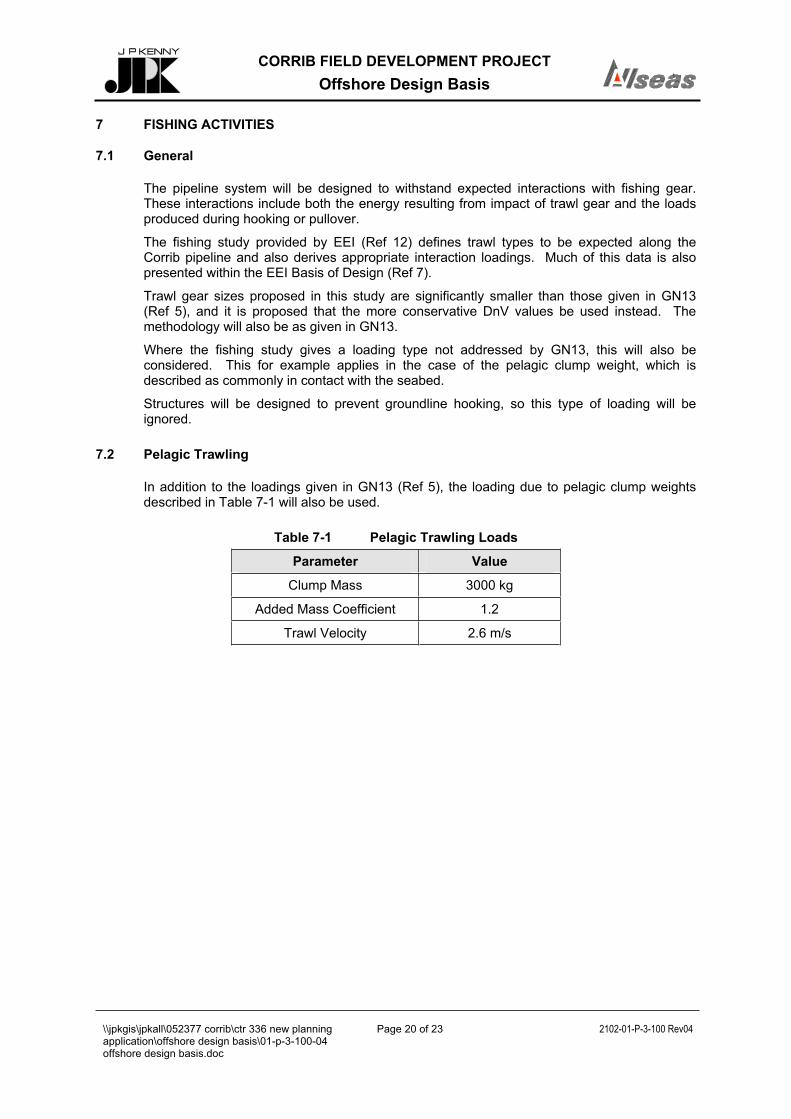
CORRIB FIELD DEVELOPMENT PROJECT Offshore Design Basis
\\jpkgis\jpkall\052377 corrib\ctr 336 new planning application\offshore design basis\01-p-3-100-04 offshore design basis.doc
Page 20 of 23 2102-01-P-3-100 Rev04
7 FISHING ACTIVITIES
7.1 General
The pipeline system will be designed to withstand expected interactions with fishing gear. These interactions include both the energy resulting from impact of trawl gear and the loads produced during hooking or pullover.
The fishing study provided by EEI (Ref 12) defines trawl types to be expected along the Corrib pipeline and also derives appropriate interaction loadings. Much of this data is also presented within the EEI Basis of Design (Ref 7).
Trawl gear sizes proposed in this study are significantly smaller than those given in GN13 (Ref 5), and it is proposed that the more conservative DnV values be used instead. The methodology will also be as given in GN13.
Where the fishing study gives a loading type not addressed by GN13, this will also be considered. This for example applies in the case of the pelagic clump weight, which is described as commonly in contact with the seabed.
Structures will be designed to prevent groundline hooking, so this type of loading will be ignored.
7.2 Pelagic Trawling
In addition to the loadings given in GN13 (Ref 5), the loading due to pelagic clump weights described in Table 7-1 will also be used.
Table 7-1 Pelagic Trawling Loads
Parameter Value
Clump Mass 3000 kg
Added Mass Coefficient 1.2
Trawl Velocity 2.6 m/s
CORRIB FIELD DEVELOPMENT PROJECT Offshore Design Basis
\\jpkgis\jpkall\052377 corrib\ctr 336 new planning application\offshore design basis\01-p-3-100-04 offshore design basis.doc
Page 21 of 23 2102-01-P-3-100 Rev04
8 DESIGN OF SEALINE
8.1 General
This section defines the approaches to be taken to detailed design of the sealine. The extent of the sealine is taken as being from the connection with the tie-in spool at the upstream side of the PLEM to the landward end of the shore pull. The piggy-backed umbilical conduit and outfall pipe are also included.
This work will be performed directly for Allseas.
The primary design code is DnV OS-F101 (Ref 1), but for various elements this code makes reference to a number of other codes and guidelines.
Design life is 30 years.
8.2 Routing
Routing will be based on the “Base Case Route” defined in the FEED, ie the northern option will be ignored. Minor route variations will be addressed in order to optimise span remedial work.
8.3 Wall Thickness
Design of pipe wall thickness to resist internal & external pressures will be made in accordance with DnV OS-F101 (Ref 1). The design pressure specified in Table 4-2 will also be used as the maximum incidental pressure, since it will only actually occur as an upset condition.
A suitable corrosion allowance will be determined, using the operational conditions specified in section 3. Allowance will be given for the decline in pressure through field life.
8.4 Stability
Stabilisation measures for the pipeline will be designed in accordance with DnV RP E305 (Ref 3). Where appropriate, a more detailed, quasi-dynamic analysis will be performed using the AGA stability program.
8.5 Mechanical Protection
Additional protection against mechanical loading, such as results from interaction with fishing gear or dropped objects, will be provided by either concrete coating, trenching, burial or mattresses. Where no such measures are proposed, evaluations will be made of the resistance of the exposed pipe to the appropriate impacts, loadings etc.
8.6 Corrosion Protection & Monitoring
A high integrity anti-corrosion coating will provide primary external corrosion protection. A sacrificial anode system will be designed in accordance with DnV RP B401 (Ref 2).
At the interface with the onshore pipeline, either compatibility of the two CP systems will be ensured, or electrical isolation will be provided. Full compatibility with the subsea facilities will be assumed.
Provision of an internal corrosion monitoring system will be addressed.
CORRIB FIELD DEVELOPMENT PROJECT Offshore Design Basis
\\jpkgis\jpkall\052377 corrib\ctr 336 new planning application\offshore design basis\01-p-3-100-04 offshore design basis.doc
Page 22 of 23 2102-01-P-3-100 Rev04
8.7 Freespans
Allowable pipeline spans will be calculated in accordance with the methods given in DnV GN14 (Ref 4).
8.8 Landfall
Landfall is made at Dooncarton Point. A conventional shore pull configuration will be assumed.
The interface between onshore and offshore sections of the pipeline is located at the landward end of the landfall. This is represented by the extent of the onshore pull.
At the interface, a welded connection will be made.
8.9 Water Outfall Pipeline
Design of the water outfall pipeline will be addressed as part of the onshore system, as outlined in Ref 8.
Installation of the offshore section of the water outfall pipeline will be addressed, since it will be performed by piggy-backing on the 20” sealine.
Protection of the diffuser at the seaward end of the outfall will be provided by a suitable structure attached to the sealine.
8.10 Umbilical Sleeve
Design of the umbilical is not part of the pipeline scope, but in the shore approach, a sleeve will be pre-installed to allow pull-in to shore of the beginning of the offshore umbilical. This sleeve will be piggybacked to the sealine.
8.11 PLEM
The PLEM near the manifold end of the sealine houses an isolation valve. The structure will be designed to protect this valve from accidental loads in accordance with API RP2A (Ref 6).
Pipeline expansion movement will be accommodated, and due account will be taken of proposed installation methods. Location of the PLEM will be finalised to accommodate diverless connection of the tie-in spool using the Matis system
8.12 Manifold Tie-in Spool
Although forming part of the pipeline, design of the tie-in spool will be addressed under the Subsea Facilities. See section 1.2.
CORRIB FIELD DEVELOPMENT PROJECT Offshore Design Basis
\\jpkgis\jpkall\052377 corrib\ctr 336 new planning application\offshore design basis\01-p-3-100-04 offshore design basis.doc
Page 23 of 23 2102-01-P-3-100 Rev04
9 REFERENCES
1. DnV OS-F101, Submarine Pipeline Systems (“DnV 2000”)
2. DnV, RP-B401, Cathodic Protection Design
3. DnV, RP-E305, On-Bottom Stability Design of Submarine Pipelines
4. DnV, Guideline no.14, Free Spanning Pipelines (“GN14”)
5. DnV, Guideline no.13, Interference between Trawl Gear & Pipelines (“GN13”)
6. API RP 2A, Recommended Practice for Planning, Designing and Constructing Fixed Offshore Platforms
7. Basis of Design, EEI document no. COR-10-SP-001-6
8. Onshore Design Basis, JPK document no. 05-2102-02-P-3-800
9. Infield Layout, Flowlines, Offshore Umbilcals & Tie-in Spool Design Basis, JPK document no. 05-2199-01-P-3-200
10. Corrib Field Development Pipeline Route Survey, Gardline project ref 5465.1, 06/10/00
11. Metocean Criteria Corrib Field & Sealine Route, Metoc Report No. 978, Oct 2000
12. Corrib Pipeline & Subsea Equipment Design Basis for Fishing Protection, Trevor Jee report, 19/09/00
SHELL E&P IRELAND LIMITED
CORRIB FIELD DEVELOPMENT PROJECT
REPORT
Corrib Onshore Pipeline EISPROJECT No.
052377
APPENDIX Q4.2 REFCTR 349
ADDENDUM NO 1 TO OFFSHORE DESIGN BASIS
No OF SHEETS
4
DOCUMENT No OFFICE CODE
05PROJECT No
2377AREA
01DIS
PTYPE
3NUMBER
027
04 17/05/10 Revised for Planning Application JG GSW JG
03 15/01/09 Revised for Planning Application JG GSW JG
02 07/03/08 For Planning Application CW JG JG
01 13/02/08 For Review by SEPIL CW JG JG
REV DATE DESCRIPTION BY CHK ENG PM CLIENT
Corrib Onshore Pipeline EIS Appendix Q4.2
Addendum No 1 Offshore Design Basis
Page 2 of 3
Reference Document: OFFSHORE DESIGN BASIS
J P Kenny Document 05-2102-01-P-3-100 Rev 04 dated 10/5/02 issued as Allseas Document No.: 8820/D100-01
ADDENDUM No 1 General
J P Kenny Document 05-2102-01-P-3-100 Rev 04 dated 10/5/02 (also issued as Allseas Document No: 8820/D100-01) presented the Design Basis for the Corrib Offshore Pipeline.
Since that issue a number of statements or items of data have changed and the purpose of this Addendum No 1 is record and document these changes as at May 2010.
The original document remains a valid basis for design of the offshore section of the Corrib export pipeline. None of the changes identified below materially affect the original design basis for the offshore pipeline.
A copy of the original Offshore Design Basis is attached following this Addendum No 1 for reference purposes.
Item Section Description
1 1.1 Shell E&P Ireland Ltd has replaced Enterprise Energy Ireland Ltd as the owner of the Corrib Field.
Length of onshore section is now 8.3km
2 1.2 Manifold tie-in is no longer part of the Allseas scope. Allseas subcontract with Stolt Offshore is closed.
3 2.1 Distance from landfall to water outfall diffuser is more than 12km. This change has been incorporated in the design (see section 4.6) but the update in this section was omitted in error.
4 2.1 Delete 7th bullet and replace with
Corrib pipeline, from PLEM and tie-in spool to manifold, via Landfall Valve Installation (LVI) to Terminal
5 2.2 Landfall location has been revised. Refer drawing 05-2377-01-P-0-007 DG103 Gas Export Pipeline Overall Route Layout, latest revision.
6 3.1 The system for Regulatory Approvals has been substantially changed. The prevailing system for Regulatory Approvals will be applied.
7 3.2 A newer revision of DNV OS F-101 has since been issued (2007), but the offshore pipeline is designed and constructed, as stated, to the 2000 issue.
Corrib Onshore Pipeline EIS Appendix Q4.2
Addendum No 1 Offshore Design Basis
Page 3 of 3
Item Section Description
8 4.2 Delete sentence “Pipeline operating pressure will normally not exceed 150 bara” and replace with “Offshore pipeline operating pressure will not exceed the stated maximum allowable operating pressure.”
9 4.3 Add to Table 4-2, Maximum Allowable Operating Pressure 150 barg
10 4.3 The data set for Table 4-4 is now superseded as the inlet pressure to the Gas Terminal has been reduced resulting in a corresponding pressure reduction at the manifold.
11 4.5 Last paragraph replaced with;
One well has been hydraulically fractured. Based on production testing to date no significant proppant production is expected. The production system has been designed to tolerate proppant production up to 320kg/year per well. A sand detector has been installed on the production manifold and in the unlikely event that excessive proppant or sand is produced, the individual well will be closed in until it can be repaired. There are no plans to fracture any other wells.
12 4.6 The water outfall pipeline will only transport treated run-off water from the Terminal. Produced water from the Terminal will be transported via the Umbilical to the subsea facilities
13 8.1 Delete first paragraph and replace with;
This section defines the approaches to be taken to detailed design of the sealine. The extent of the sealine is taken as being from the connection with the tie-in spool at the upstream side of the PLEM to the tie-in weld with the Landfall Valve Installation. The piggy-backed umbilical conduit and outfall pipe are also included.
14 8.8 Delete second paragraph and replace with following two paragraphs;
The interface between Offshore pipeline and the Onshore pipeline is at the Landfall Valve Installation system.
The interface between the Onshore pipeline and the Landfall Valve Installation is at the downstream weld of the downstream barred-tee of the LVI.
END OF ADDENDUM
Shell E & P Ireland Limited
CORRIB FIELD DEVELOPMENT PROJECT
REPORT
Corrib Onshore Pipeline EIS PROJECT No.
052377.01
Appendix Q4.3 REF
CTR 349
LANDFALL VALVE INSTALLATION DESIGN JUSTIFICATION AND OVERVIEW
No OF SHEETS
17
DOCUMENT No OFFICE CODE
05PROJECT No
2377AREA
01DIS
PTYPE
3NUMBER
045
03 17/05/10 Issued for Planning Application JG GSW GSW JG
02 4/05/10 Issued for Comment JG GSW GSW JG
01 8/03/10 Issued for IDC JG GSW GSW JG
REV DATE DESCRIPTION BY CHK ENG PM CLIENT
Corrib Onshore Pipeline EIS Appendix Q4.3
Landfall Valve Installation Design Justification and Overview
Page 2 of 17
CONTENTS
1 INTRODUCTION............................................................................................................... 31.1 Purpose.......................................................................................................................... 31.2 Background ................................................................................................................... 32 DESIGN STANDARDS..................................................................................................... 42.1 Applicable Codes and Standards............................................................................... 42.2 Applicable Design Standard ....................................................................................... 43 DESIGN AND OPERATING PARAMETERS.................................................................. 53.1 Flow Rate ....................................................................................................................... 53.2 Pressure......................................................................................................................... 53.3 Temperature .................................................................................................................. 53.4 Hydrostatic Test Pressures......................................................................................... 53.5 Design Life..................................................................................................................... 53.6 Location ......................................................................................................................... 53.7 Environmental Constraints ......................................................................................... 53.8 Production Flow Rates, Pressures and Composition ............................................. 53.9 Environmental Data...................................................................................................... 54 LVI DEVELOPMENT OF DESIGN CONCEPT................................................................ 74.1 Design Implications...................................................................................................... 74.2 Design Constraints....................................................................................................... 75 LVI DESIGN DETAILS.................................................................................................... 105.1 LVI Overview ............................................................................................................... 105.2 LVI Over-Pressurisation Protection System Functionality................................... 115.3 Restart Requirements ................................................................................................ 125.4 Primary Valve Selection............................................................................................. 125.5 Material Selection ....................................................................................................... 125.6 Erosion and Corrosion............................................................................................... 135.7 Cathodic Protection.................................................................................................... 135.8 Vibration....................................................................................................................... 135.9 Noise............................................................................................................................. 135.10 Emissions .................................................................................................................... 135.11 Instrument Cabin ........................................................................................................ 145.12 Fire Detection and Protection ................................................................................... 145.13 Control and Communications................................................................................... 145.14 Electrical Hazardous Areas....................................................................................... 145.15 Security of Electrical Supply..................................................................................... 155.16 Lighting ........................................................................................................................ 155.17 Lightning and Earthing .............................................................................................. 155.18 Umbilical and Methanol Supply................................................................................ 155.19 Outfall Line .................................................................................................................. 155.20 Access for Maintenance ............................................................................................ 155.21 Drainage.......................................................................................................................165.22 Site Security ................................................................................................................ 166 LVI OPERATION AND MAINTENANCE....................................................................... 176.1 Operation ..................................................................................................................... 176.2 Maintenance Strategy ................................................................................................ 17
Corrib Onshore Pipeline EIS Appendix Q4.3
Landfall Valve Installation Design Justification and Overview
Page 3 of 17
1 INTRODUCTION
1.1 Purpose
The purpose of this document is to provide an evaluation of the design adopted for the LVI and to provide an overview of the facilities that will be installed at the site.
The Corrib Onshore Pipeline Environmental Impact Statement presents an environmental assessment of the LVI regarding its alternative locations and its impact on the environment. Refer Chapters 3 and 4.
1.2 Background
The original Corrib offshore and onshore proposed pipelines were designed to 345 barg to withstand the highest possible shut-in wellhead pressures. The onshore section of the pipeline traversed mainly an overland route to the Gas Terminal. The previous design comprised a manually operated 20” isolating valve with a bypass located at the landfall.
Following the recommendations of the Corrib Technical Advisory Group (TAG), the Advantica report re-classified the onshore pipeline as a Class 2 (Suburban) pipeline (0.3 design factor) and reduced the design pressure of the onshore pipeline section from its original 345 barg down to a lower design pressure of 144 barg.
Subsequent to the issue of the TAG/Advantica recommendations, maximum allowable operating pressures (MAOP) for the Corrib pipelines were defined. These are:
Corrib – Offshore pipeline and Landfall Valve Installation 150 barg
Corrib – Onshore pipeline 100 barg.
In accordance with the respective pipeline codes the daily operating pressure shall not exceed the stated MAOP in either the offshore on onshore pipelines. Thus the MAOP takes precedence over the requirement to remain within the design pressure of the respective pipelines.
To comply with the relevant design codes, the overall system design required a high reliability over-pressurisation protection system to be installed at the landfall. This facility would limit the pressure in the onshore section to below 100 barg.
In addition TAG required that there were facilities to initiate, from the Gas Terminal, remote isolation between the offshore and the onshore pipelines sections at the landfall.

Corrib Onshore Pipeline EIS Appendix Q4.3
Landfall Valve Installation Design Justification and Overview
Page 4 of 17
2 DESIGN STANDARDS
2.1 Applicable Codes and Standards
The principal authorities associated with regulatory codes, standards and legislative compliance, applicable to the aspects of design; construction, installation and commissioning of the LVI are listed below in alphabetical order.
Det Norske Veritas (DNV)
European Community Legislative Standards.
Institute of Petroleum (IP)
International Organization for Standardization (ISO)
National Fire Protection Association Codes (NFPA)
Republic of Ireland National Standards.
Shell Design and Engineering Practice (DEP)
2.2 Applicable Design Standard
A review of the Codes and Standards recommended by TAG following issue of the Independent Safety Review of the Onshore Section of the proposed Corrib Gas Pipeline by Advantica, and their application to the LVI and the onshore pipeline is presented in Appendix Q3.2.
In summary, TAG has designated that the design of the onshore pipeline shall be in accordance with I.S. EN 14161; however I.S. 328 and BS PD 8010 shall apply where they exceed I.S. EN 14161.
The application of these standards to the design of the onshore pipeline has been evaluated and a Design Code Review issued to TAG (Refer Appendix Q3.3). The Design Code Review sets out the application of the individual standards to the design of the onshore pipelines. TAG subsequently accepted the findings of the design code review.
The DNV-OS-F101 code for submarine pipeline systems is applied to the design of the offshore pipeline (issue 2000) and the LVI (issue 2007).
The break between the two codes, namely DNV-FS-101 and I.S.EN 14161 is at the weld between the downstream barred tee of the LVI and the onshore pipeline.
Corrib Onshore Pipeline EIS Appendix Q4.3
Landfall Valve Installation Design Justification and Overview
Page 5 of 17
3 DESIGN AND OPERATING PARAMETERS
3.1 Flow Rate
Design Flow Rate 350 MMSCFD of dry sales gas
Maximum Flow Rate 350 MMSCFD of dry sales gas
3.2 Pressure
Design Pressure (upstream of code break) 345 barg
Design Pressure (downstream of code break) 144 barg
MAOP (upstream of code break) 150 barg
MAOP (downstream of code break) 100 barg
3.3 Temperature
Maximum Design Temperature 50°C
Minimum Design Temperature
20 inch pipeline from installed offshore line to LVI 0°C
20 inch pipeline at LVI to ~1100 m downstream LVI -20°C
20 inch pipeline from ~1100 m downstream of the LVI to Gas Terminal -10°C
16 inch/ 4 inch shutdown/restart spools at LVI -26°C
3.4 Hydrostatic Test Pressures
LVI linepipe, mainline valve and shutdown loop and valves 504 barg
From installed offshore linepipe to LVI 504 barg
3.5 Design Life
The LVI shall have a design life of 30 years.
3.6 Location
The location of the LVI is presented in drawing number DG2101 Site Plan.
3.7 Environmental Constraints
Presented in the Corrib Onshore Pipeline Environmental Impact Statement.
3.8 Production Flow Rates, Pressures and Composition
Refer to Appendix Q2.1.
3.9 Environmental Data
Environmental data for the pipeline route is listed below, for years 1991 to 2000.
Data received from Met Eireann.
Maximum air temperature 28°C
Monthly mean maximum temperature range 8.9°C to 18.2°C
Minimum air temperature -5.5°C
Monthly mean minimum temperature range 3.9°C to 12.2°C

Corrib Onshore Pipeline EIS Appendix Q4.3
Landfall Valve Installation Design Justification and Overview
Page 6 of 17
Mean annual rainfall 1269mm
Maximum daily rainfall 67.8mm
Maximum hourly rainfall 25.9mm
Mean days 0.2mm rainfall 254 days/year
Mean monthly wind speed range 11.7 to 16.2 knots
Max wind speed (gust) 93 knots
Corrib Onshore Pipeline EIS Appendix Q4.3
Landfall Valve Installation Design Justification and Overview
Page 7 of 17
4 LVI DEVELOPMENT OF DESIGN CONCEPT
4.1 Design Implications
To meet the objectives outlined in Section 1.2, the pipeline design codes require that where there is a change in design pressure or maximum allowable operating pressure, that is from offshore to onshore, then the downstream pipeline must be protected by an over-pressurisation protection system. Thus additional facilities are required at the landfall and these would replace the previous single, manually operated, 20” dia beach valve.
These additional facilities at the landfall would comprise part of an overall Corrib pipeline over-pressurisation protection system (Refer Appendix Q2.1). This requires a high integrity safety shutdown system to be installed at the landfall in a new facility termed the Landfall Valve Installation (LVI). Isolation between the offshore and onshore sections will be initiated should the pressure in the downstream pipeline exceed a pre-set trip value.
4.2 Design Constraints
The constraints influencing the design of the LVI were as follows:
Selection of the safety shutdown system and the optimum pipe configuration.
Offshore to onshore pipeline interface at LVI to be suitable for intelligent pigging.
Maximise safety at the LVI.
Mitigate visual impact at Glengad.
Minimise the footprint of the LVI site.
Site security and lighting.
Each of these constraints are discussed in further detail below.
4.2.1 Pigging Continuity
It is a requirement that the offshore and onshore pipelines be suitable for intelligent pigging which necessitates a continuous connection between the 20” dia offshore and onshore pipeline sections. Consideration was given for provision of temporary receiver and launcher at the LVI, however this was discounted due to extended footprint, visual impact and safety implications.
4.2.2 Selection of the Safety Shutdown System and Pipe Configuration
The safety shutdown system comprises two inline shutdown valves located in the 16” bypass of the locked closed 20” mainline valve. The actuators for the shutdown valves are “spring to close” and hydraulic pressure to maintain open. The tripping of the safety shutdown valves will be achieved by measuring the downstream pipeline pressure via triple transmitters and through a 2 out of 3 voting logic, close the shutdown valves should the measured pressure exceed a prescribed trip value.
Locating the safety shutdown system inline with the 20” dia offshore and onshore pipeline was considered (Refer Appendix Q4.4). However, following evaluation, this configuration was discounted as there were no 20” dia high integrity safety shutdown valve systems available for the given design pressure and having a proven field track record. In addition there was potential consequential reduction in reliability of closing the shutdown valves due to pigging operations. Finally there was no significant improvement in safety at Glengad.
Corrib Onshore Pipeline EIS Appendix Q4.3
Landfall Valve Installation Design Justification and Overview
Page 8 of 17
The largest safety shutdown systems with proven track record were up to 16” dia and non-piggable. From flow calculations it was determined that the maximum design flow rate that could be accommodated in a 16” diameter pipe without resulting in excessive gas flow velocities.
Thus it was elected to install a 20” dia mainline isolation valve between the onshore and offshore pipeline sections (normally locked fully closed) and accommodate the two inline safety shutdown valves in a 16” dia bypass of the 20” dia mainline valve.
4.2.3 Maximise Safety at the LVI
To maximise safety at the LVI, it was located as remotely as practicable from normally occupied buildings. All of the pipe work at the LVI below ground will have a minimum cover of 1.2 m. In addition all above ground small bore connections to the buried valves would be capped with a bolted flange. Security cages will be installed over all above ground actuators and instrumentation
4.2.4 Mitigate Visual Impact at Glengad
The location of the LVI at Glengad is in an area of protected views. A number of alternative civil designs were evaluated which included:
Conventional Above Ground Installation
Installation on the Cliff Edge
Underground and Enclosed Installation
Installation in Excavated Lower Terrain Position
From the evaluation of the alternatives the installation in an excavated lower terrain position (Dished) was elected as the optimum arrangement which mitigated the visual impact of the LVI at Glengad.
4.2.5 Minimise the Footprint of the LVI Site.
Based upon the “dished” arrangement for the LVI, the overall foot print of the LVI was minimised to reduce as far as possible the visual impact at Glengad while maintaining the design requirements for safe working at the installation. The factors that influenced the size of the footprint were:
Safety distances from the points of potential emissions from the pipe work and valves.
The size required for a secure enclosure to house the electronic and electrical equipment.
Access to the buried valves.
Access to the connection between the onshore and offshore umbilicals.
Space for the outfall pipeline manual and control valves.
Vehicle access to the LVI compound area in the dished profile.
Crane access for maintenance.
4.2.6 Site security and lighting
In accordance with the pipeline design code, access to stations shall be controlled and fenced, with locked gates. Thus the LVI compound area housing the LVI valves and buried pipe work is enclosed in a security fence with a locked main gate and an

Corrib Onshore Pipeline EIS Appendix Q4.3
Landfall Valve Installation Design Justification and Overview
Page 9 of 17
emergency gate. As there may be occasions to visit the LVI at night, low-level site lighting is required. All above-ground actuators and instrumentation are protected by security cages.
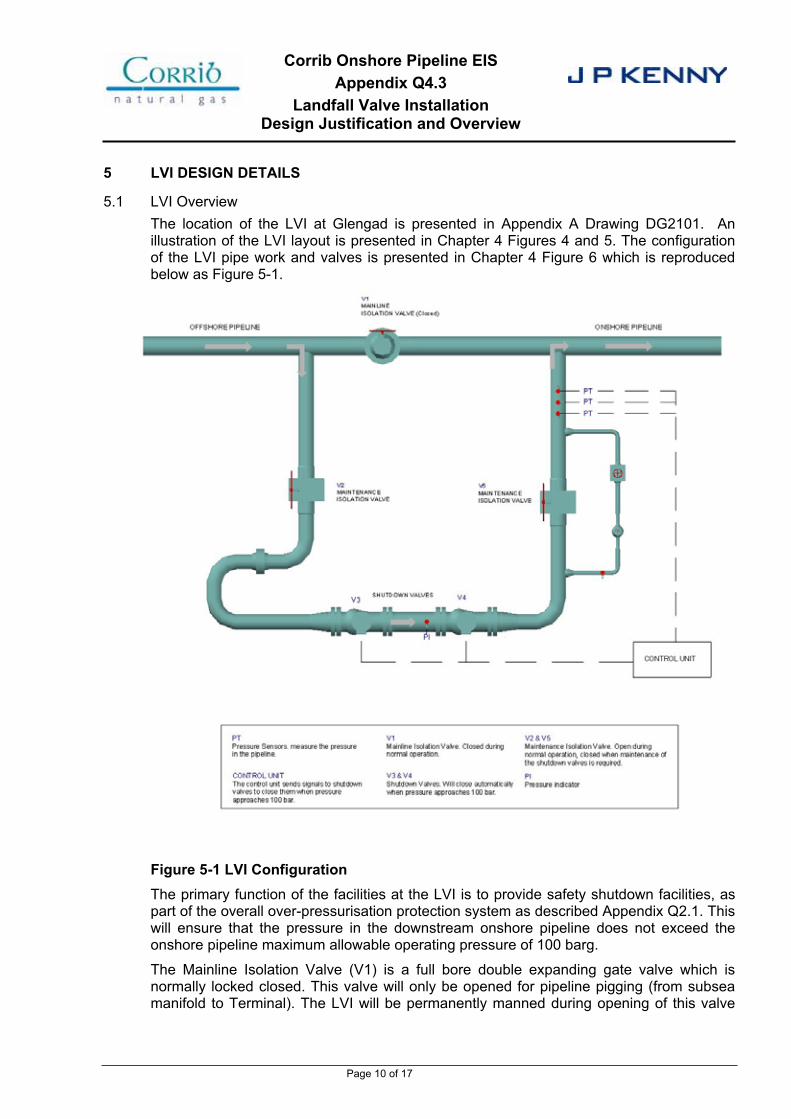
Corrib Onshore Pipeline EIS Appendix Q4.3
Landfall Valve Installation Design Justification and Overview
Page 10 of 17
5 LVI DESIGN DETAILS
5.1 LVI Overview
The location of the LVI at Glengad is presented in Appendix A Drawing DG2101. An illustration of the LVI layout is presented in Chapter 4 Figures 4 and 5. The configuration of the LVI pipe work and valves is presented in Chapter 4 Figure 6 which is reproduced below as Figure 5-1.
Figure 5-1 LVI Configuration The primary function of the facilities at the LVI is to provide safety shutdown facilities, as part of the overall over-pressurisation protection system as described Appendix Q2.1. This will ensure that the pressure in the downstream onshore pipeline does not exceed the onshore pipeline maximum allowable operating pressure of 100 barg.
The Mainline Isolation Valve (V1) is a full bore double expanding gate valve which is normally locked closed. This valve will only be opened for pipeline pigging (from subsea manifold to Terminal). The LVI will be permanently manned during opening of this valve

Corrib Onshore Pipeline EIS Appendix Q4.3
Landfall Valve Installation Design Justification and Overview
Page 11 of 17
and the pigging operation will be executed under the Gas Terminal permit to work system. A full risk-assessment will be undertaken prior to a pigging operation.
Normal flow is therefore via the 16” diameter Shutdown Spool which is connected to the mainline pipeline via barred tees. This spool comprises two Safety Shutdown Valves (V3 and V4) and upstream and downstream 16” Isolation Valves (V2 and V5). A 4” Restart Spool is installed around isolation valve V5. This spool includes a Restart Control Valve and a 4” Isolation Valve. This spool is used for re-pressurisation of the downstream onshore pipeline following a shutdown of the LVI.
The barred tees and the interconnecting 20” pipe together with V1 will be fabricated with corrosion resistant materials. Also the complete shutdown spool, restart spool and valves will be fabricated with corrosion resistant materials. Both duplex and internally clad carbon steel materials will be used as the corrosion resistant materials.
The actuators on the Safety Shutdown Valves (V3 and V4) will be hydraulically opened, spring closed, i.e. fail-closed. The remaining valves are all operated manually.
The Safety Shutdown Valves will be axial flow type valves and the Isolation Valves (V1, V2, V5 and the restart spool) will be double expanding gate valves which provide an integral double block and bleed isolation.
Three pressure transmitters located downstream of the downstream Isolation Valve V5, prior to the barred tee, will measure the pressure in the onshore pipeline and will be connected to the electronic Logic Solver Unit. The instrument piping connections to the buried pipe work will be heat traced to mitigate potential hydrate formation.
To mitigate hydrate formation during restart following a shutdown, a methanol injection connection is located on the upstream of the Control Valve in the restart spool. The methanol will be obtained via permanent piping from the subsea umbilical line, which is routed through the LVI. The methanol injection connection is isolated during normal operation.
A pressure indicator is located between the Safety Shutdown Valves to facilitate restart and is used when the valve seals are checked during maintenance. The temperature transmitter downstream of the three pressure transmitters is used to monitor the pipe temperature during restart.
5.2 LVI Over-Pressurisation Protection System Functionality
The high integrity safety shutdown facilities at the LVI comprise the duplicated safety shutdown valves (V3 and V4), the triplicate pressure measurement instruments and the electronic control unit termed a Logic Solver.
Under normal operation V3 and V4 are maintained open under hydraulic pressure and the pressure in the onshore pipeline is maintained below its MAOP of 100 barg. The independent readings from the three pressure transmitters are compared using a two–out–of-three (2oo3) voting system within the Logic Solver. Provided that the measured pressure is maintained below a preset trip pressure, valves V3 and V4 remain fully open. However should the measured pressure (2oo3) of the onshore pipeline exceed the preset trip pressure, then the logic solver will immediately release the hydraulic pressure from the actuators on both valve V3 and V4, and their respective spring actuators will promptly close the valves, thus isolating the pressure between the onshore and offshore pipelines.
The system will be designed such valves V3 and V4 will fail to the closed position.
The Logic Solver will also receive the remote close signal from the operator at the Gas Terminal and initiate closure of both V3 and V4 for the purposes of inventory control.
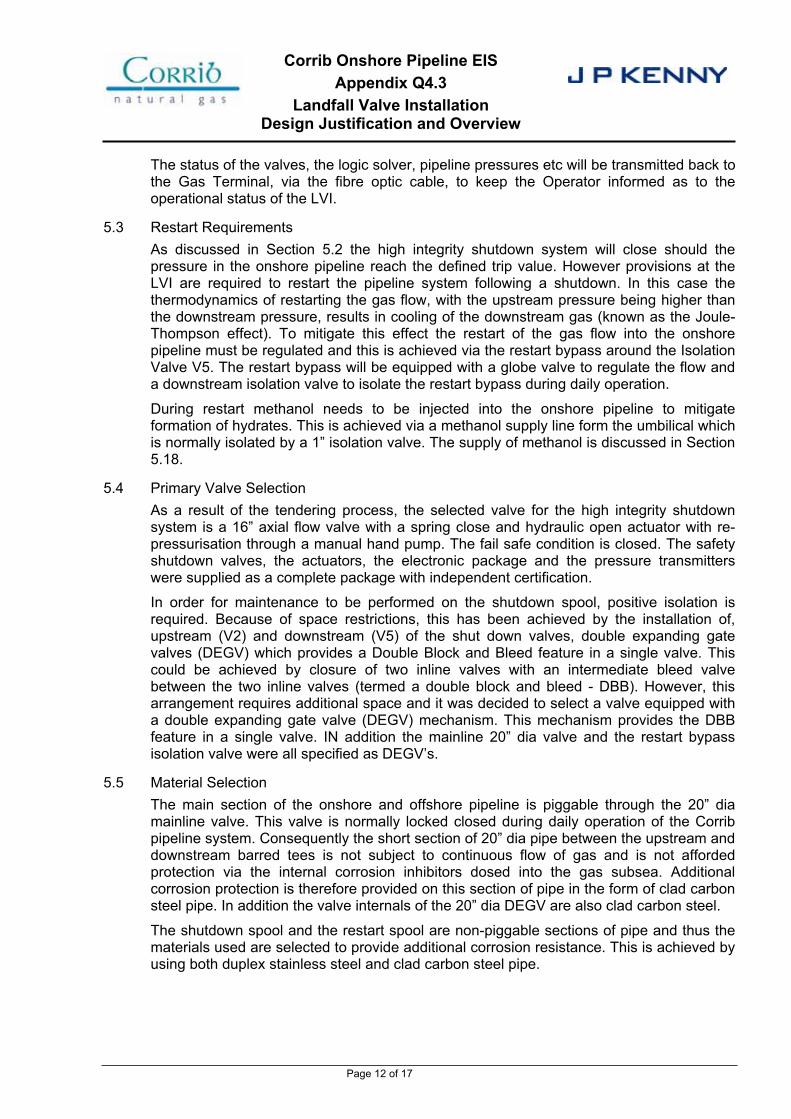
Corrib Onshore Pipeline EIS Appendix Q4.3
Landfall Valve Installation Design Justification and Overview
Page 12 of 17
The status of the valves, the logic solver, pipeline pressures etc will be transmitted back to the Gas Terminal, via the fibre optic cable, to keep the Operator informed as to the operational status of the LVI.
5.3 Restart Requirements
As discussed in Section 5.2 the high integrity shutdown system will close should the pressure in the onshore pipeline reach the defined trip value. However provisions at the LVI are required to restart the pipeline system following a shutdown. In this case the thermodynamics of restarting the gas flow, with the upstream pressure being higher than the downstream pressure, results in cooling of the downstream gas (known as the Joule-Thompson effect). To mitigate this effect the restart of the gas flow into the onshore pipeline must be regulated and this is achieved via the restart bypass around the Isolation Valve V5. The restart bypass will be equipped with a globe valve to regulate the flow and a downstream isolation valve to isolate the restart bypass during daily operation.
During restart methanol needs to be injected into the onshore pipeline to mitigate formation of hydrates. This is achieved via a methanol supply line form the umbilical which is normally isolated by a 1” isolation valve. The supply of methanol is discussed in Section 5.18.
5.4 Primary Valve Selection
As a result of the tendering process, the selected valve for the high integrity shutdown system is a 16” axial flow valve with a spring close and hydraulic open actuator with re-pressurisation through a manual hand pump. The fail safe condition is closed. The safety shutdown valves, the actuators, the electronic package and the pressure transmitters were supplied as a complete package with independent certification.
In order for maintenance to be performed on the shutdown spool, positive isolation is required. Because of space restrictions, this has been achieved by the installation of, upstream (V2) and downstream (V5) of the shut down valves, double expanding gate valves (DEGV) which provides a Double Block and Bleed feature in a single valve. This could be achieved by closure of two inline valves with an intermediate bleed valve between the two inline valves (termed a double block and bleed - DBB). However, this arrangement requires additional space and it was decided to select a valve equipped with a double expanding gate valve (DEGV) mechanism. This mechanism provides the DBB feature in a single valve. IN addition the mainline 20” dia valve and the restart bypass isolation valve were all specified as DEGV’s.
5.5 Material Selection
The main section of the onshore and offshore pipeline is piggable through the 20” dia mainline valve. This valve is normally locked closed during daily operation of the Corrib pipeline system. Consequently the short section of 20” dia pipe between the upstream and downstream barred tees is not subject to continuous flow of gas and is not afforded protection via the internal corrosion inhibitors dosed into the gas subsea. Additional corrosion protection is therefore provided on this section of pipe in the form of clad carbon steel pipe. In addition the valve internals of the 20” dia DEGV are also clad carbon steel.
The shutdown spool and the restart spool are non-piggable sections of pipe and thus the materials used are selected to provide additional corrosion resistance. This is achieved by using both duplex stainless steel and clad carbon steel pipe.
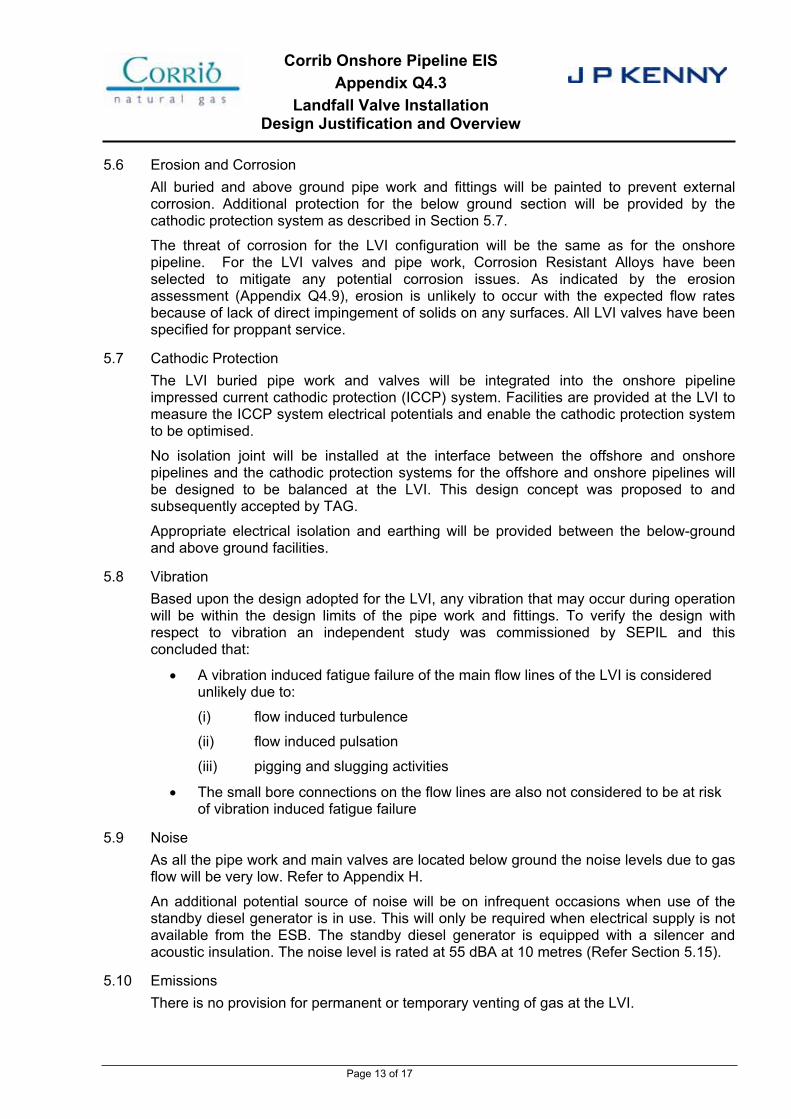
Corrib Onshore Pipeline EIS Appendix Q4.3
Landfall Valve Installation Design Justification and Overview
Page 13 of 17
5.6 Erosion and Corrosion
All buried and above ground pipe work and fittings will be painted to prevent external corrosion. Additional protection for the below ground section will be provided by the cathodic protection system as described in Section 5.7.
The threat of corrosion for the LVI configuration will be the same as for the onshore pipeline. For the LVI valves and pipe work, Corrosion Resistant Alloys have been selected to mitigate any potential corrosion issues. As indicated by the erosion assessment (Appendix Q4.9), erosion is unlikely to occur with the expected flow rates because of lack of direct impingement of solids on any surfaces. All LVI valves have been specified for proppant service.
5.7 Cathodic Protection
The LVI buried pipe work and valves will be integrated into the onshore pipeline impressed current cathodic protection (ICCP) system. Facilities are provided at the LVI to measure the ICCP system electrical potentials and enable the cathodic protection system to be optimised.
No isolation joint will be installed at the interface between the offshore and onshore pipelines and the cathodic protection systems for the offshore and onshore pipelines will be designed to be balanced at the LVI. This design concept was proposed to and subsequently accepted by TAG.
Appropriate electrical isolation and earthing will be provided between the below-ground and above ground facilities.
5.8 Vibration
Based upon the design adopted for the LVI, any vibration that may occur during operation will be within the design limits of the pipe work and fittings. To verify the design with respect to vibration an independent study was commissioned by SEPIL and this concluded that:
A vibration induced fatigue failure of the main flow lines of the LVI is considered unlikely due to:
(i) flow induced turbulence
(ii) flow induced pulsation
(iii) pigging and slugging activities
The small bore connections on the flow lines are also not considered to be at risk of vibration induced fatigue failure
5.9 Noise
As all the pipe work and main valves are located below ground the noise levels due to gas flow will be very low. Refer to Appendix H.
An additional potential source of noise will be on infrequent occasions when use of the standby diesel generator is in use. This will only be required when electrical supply is not available from the ESB. The standby diesel generator is equipped with a silencer and acoustic insulation. The noise level is rated at 55 dBA at 10 metres (Refer Section 5.15).
5.10 Emissions
There is no provision for permanent or temporary venting of gas at the LVI.
Corrib Onshore Pipeline EIS Appendix Q4.3
Landfall Valve Installation Design Justification and Overview
Page 14 of 17
Each of the valves with a small bore connection to the body cavity, has connections which are routed above ground and fitted with a blank flange. All of the connections will be checked periodically for fugitive emission during maintenance visits.
5.11 Instrument Cabin
There are a number of items of electronic and electrical equipment at the LVI that must be housed in a custom built cabin. As this Instrument Cabin is located in the compound it must be classified as a safe area to house the electrical/electronic equipment. Therefore the internal pressure within the Instrument Cabin is maintained positive with respect to the external air pressure. This is achieved by the HVAC system installed in the cabin. The Instrument cabin will house:
A Uninterruptible Power Supply with battery back-up.
The shutdown logic electronic equipment.
The controllers for the security systems.
The DCS safety node (for communication with the Gas Terminal Control Systems).
The HVAC system.
The site lighting controls.
5.12 Fire Detection and Protection
The above ground valve actuators for the safety shutdown valves will be fitted with passive fire protection.
Portable fire extinguishers will be located in the Instrument Cabin.
Internal smoke detectors will be provided in the Instrument Cabin
Smoke and gas detection will be provided in the Instrument Cabin and an alarm provided to the Gas Terminal control room.
5.13 Control and Communications
Various data from the LVI will be required for display to the operator in the Gas Terminal Control Room. This data is gathered at the LVI from the shutdown logic, the HVAC system and the smoke and gas detectors via a Distributed Control System (DCS) safety node installed at the LVI. Communication to the Gas Terminal will be via the Fibre Optic cable installed parallel to the onshore gas pipeline.
Facilities to remotely close the safety shutdown valves from the Gas Terminal are achieved via the signal cable installed parallel to the onshore gas pipeline. The signal cable will connect directly to the electronic shutdown logic controller which operates the safety shutdown valves. Multiple cores are assigned within the signal cable for the “LVI close” command. Should the signal cable connection between the LVI and Gas Terminal be lost, then the shutdown logic will automatically close the safety shutdown valves at the LVI.
5.14 Electrical Hazardous Areas
Field instrumentation located within electrical hazardous areas shall be rated accordingly for safe operation within the designated zone in general accordance with I.S. EN 60079 and Institute of Petroleum, Model Code of Safety Practice Part 15.
Instrumentation shall be rated suitable for a Zone 1 Group II B T3 area.
Corrib Onshore Pipeline EIS Appendix Q4.3
Landfall Valve Installation Design Justification and Overview
Page 15 of 17
The Zone 2 area will extend to the upper edge of the lowered area within which the LVI compound is installed.
5.15 Security of Electrical Supply
Electrical Power will be required at the LVI for the electronic instrumentation and control systems together with the site lighting, CCTV and intruder detection systems.
The supply of electricity to the LVI will be via the Electricity Supply Board (ESB) local overhead electrical supply system. As there are potential periods of outage from this supply, provisions are included in the LVI design to maintain essential loads from a battery system which will provide more than 4 hours electrical back-up. In the event of prolonged electrical supply outage, a standby diesel generator will be brought to the site from the Gas Terminal and this will provide a source of electrical power until the main ESB electrical supply is restored.
5.16 Lighting
Security lighting will be installed at the LVI to illuminate the compound perimeter. Under normal conditions the LVI will not be illuminated at night. Lighting will also be installed to illuminate the Instrument Cabin and valve controls and be adequate for both operational and security purposes.
The LVI site will be illuminated for required site attendance such as maintenance or for security purposes and on detection of unauthorised entry. The site lighting can be controlled from the Gas Terminal control room.
5.17 Lightning and Earthing
The level of lightning strikes in the Glengad area is rated as low and thus no specific provisions are needed to manage lightning. There will be a site earth at the LVI to ensure all metal structures are correctly bonded to earth for personnel safety and to protect the electrical/electronic equipment.
5.18 Umbilical and Methanol Supply
At the LVI the three onshore umbilical cables inter-connect into the single offshore umbilical cable via an Onshore Termination Unit (OTU). At this point methanol is piped from one of the umbilical cores through to the restart bypass pipe work. The methanol pressure is measured within the methanol off-take piping. Facilities are provided to control the methanol injection flow rate and valves are provided to isolate the methanol off-take.
5.19 Outfall Line
The outfall line transporting treated surface water from the Gas Terminal though to disposal subsea in Broadhaven Bay will be routed through the LVI compound. At the LVI a backpressure control valve will ensure that the outfall pipe is maintained at a positive pressure to avoid slack line operation and water surges.
5.20 Access for Maintenance
During maintenance various elements of the LVI facilities will require access.
The safety shutdown valves will require removal and refurbishment after a prescribed period of time to ensure their high integrity to close when demanded. Thus these valves are flanged and are installed in a chamber, which is normally sand filled, to facilitate access for maintenance. In addition the buried pipe work upstream of these valves is arranged to facilitate removal and re-installation of the valves and includes an additional
Corrib Onshore Pipeline EIS Appendix Q4.3
Landfall Valve Installation Design Justification and Overview
Page 16 of 17
buried flange. This arrangement also provides a method of access to the LVI bypass pipe work for internal visual inspection or external verification of the pipe work wall thickness.
Controlled access will also be provided to the Onshore Termination Unit (OTU).
5.21 Drainage
As the LVI compound is located at the bottom of the dished area specific provisions are included to manage surface water drainage and changes in the water table level. The drainage system is around the boundary of the compound area and drains to a designated surface water drain with an outfall through the cliff onto the beach area. The construction of the surface water outfall will be subject to further optimisation to reduce potential impacts where possible.
Should the water level in the compound rise above a prescribed threshold then an alarm is alerted to the Operator in the Gas Terminal.
5.22 Site Security
As the location of the LVI is some distance from the Gas Terminal, provisions are included at the LVI for site security. These comprise:
Locked fenced compound
CCTV (covers only the dished area of LVI)
Intruder Detection
Security cages over above ground valve actuators etc.
All authorised access to the LVI site will be controlled and in accordance with Gas Terminal work permit procedures.
Corrib Onshore Pipeline EIS Appendix Q4.3
Landfall Valve Installation Design Justification and Overview
Page 17 of 17
6 LVI OPERATION AND MAINTENANCE
6.1 Operation
There are no specific operation actions to be undertaken at the LVI which will function as an unmanned location. Daily monitoring of the LVI will be undertaken from the Gas Terminal Control Room where operational and alarm data, obtained via the LVI DCS safety node and communication system, is displayed and alerted to the Operator.
Visits to the LVI site will be conducted on at least a weekly frequency to monitor overall equipment condition and perform the associated task instructions. The Operator will also attend the LVI on an as needed basis in response to any alarms.
In the event of outage of the electrical supply to the LVI the Operator will determine the need to mobilise the standby diesel generator from the Gas Terminal to the LVI. While the standby generator supply is at the LVI, the site will be manned.
6.2 Maintenance Strategy
The LVI equipment is subject to the same Risk Reliability Management (RRM) analysis adopted for the Gas Terminal. Every item of equipment is identified and analysed using Shell’s RRM analysis tool. From the analysis, preventative maintenance routines are established together with the maintenance frequencies needed to mitigate potential failures. The maintenance plans are controlled by a computerised maintenance management system CMMS-SAP. The maintenance scheduler will ensure that work orders for the preventative maintenance routines (PMR’s) are planned and executed in a timely manner by competent and trained technicians.
Examples of Preventative Maintenance Routines are;
Annual ESDV testing to prove that valve closes and does not pass (performance standard criteria and test results verified by independent assessor).
Major overhaul by the original equipment manufacturer of the safety shutdown valves to replace seals (not greater than every 5 years).
Pressure, Temperature, Level Transmitter calibration checks to ensure specified measurement accuracies are achieved.
HVAC checks on dampers. Monthly handheld vibration measurements of all rotating equipment and the above ground process pipe work.
Electrical checks for ATEX compliance on all equipment.
Motor/Switchgear/UPS/Battery electrical inspections for contactors and ancillaries.
Inspections of fencing, drainage and security systems.
Examples of Corrective Maintenance are;
Replacement of failed electrical component (e.g. light fittings)
Replacement of broken V belt in fan
Rectification of a seized HVAC damper
Shell E & P Ireland Limited
CORRIB FIELD DEVELOPMENT PROJECT
REPORT
Corrib Onshore Pipeline EIS PROJECT No.
052377.01
Appendix Q4.4 REF
CTR 349
Appraisal of Alternative Configurations for the LVI Safety Shutdown System
No OF SHEETS
12
DOCUMENT No OFFICE CODE
05PROJECT No
2377AREA
01DIS
PTYPE
3NUMBER
046
03 13/05/10 Issued for Planning Application JG GSW GSW JG
02 4/05/10 Issued for Comment JG GSW GSW JG
01 8/03/10 Issued for IDC JG GSW GSW JG
REV DATE DESCRIPTION BY CHK ENG PM CLIENT
Corrib Onshore Pipeline EISAppendix Q4.4
Appraisal of Alternative Configurations for the LVI Safety Shutdown System
Page 2 of 12
CONTENTS
1 INTRODUCTION ...............................................................................................................31.1 Background ...................................................................................................................31.2 Purpose ..........................................................................................................................32 SYSTEM REQUIREMENTS .............................................................................................42.1 Over Pressurisation Protection ..................................................................................42.2 Restart ............................................................................................................................42.3 Testing of the Shutdown Systems .............................................................................42.4 Pipeline Pigging ............................................................................................................42.5 Potential Configurations..............................................................................................43 AVAILABILITY OF SAFETY SHUTDOWN VALVES .....................................................53.1 Potential Suppliers .......................................................................................................53.2 Industry Track-Record .................................................................................................54 SHUTDOWN CONFIGURATION – STRAIGHT PIPE.....................................................74.1 Pipe Configuration........................................................................................................74.2 Corrosion/ Erosion .......................................................................................................74.3 Layout Arrangement.....................................................................................................74.4 Testing of the Shutdown Systems .............................................................................85 SHUTDOWN CONFIGURATION- BYPASS....................................................................95.1 Pipe Configuration........................................................................................................95.2 Corrosion/ Erosion .......................................................................................................95.3 Layout Arrangement...................................................................................................105.4 Testing of the Shutdown Systems ...........................................................................106 SAFETY ...........................................................................................................................11
7 SUMMARY AND CONCLUSION ...................................................................................12
Corrib Onshore Pipeline EISAppendix Q4.4
Appraisal of Alternative Configurations for the LVI Safety Shutdown System
Page 3 of 12
1 INTRODUCTION
1.1 Background Following the issue of the Corrib Technical Advisory Group (TAG) and Advantica Independent Safety Review recommendations in 2006, the design of the Landfall Valve Installation (LVI) was initiated to provide a safety shutdown system at the landfall to prevent the pressure in the onshore pipeline section exceeding the new, lower, design pressure. At the time of design, the maximum size of field proven high integrity safety shutdown valves available from the market was 16” dia. These valves were not suitable for the passage of pipeline pigs. Thus the design of the LVI as previously presented was based upon a configuration with the safety shutdown valves located in a 16” dia bypass around a 20” dia full bore mainline valve which facilitated pipeline pigging.
An Bord Pleanála letter dated 2nd November 2009 and subsequent clarification in their letter dated 29th January 2010 requested that further consideration be given to adopting a straight pipe configuration for the LVI with a potential for increase in safety at Glengad. This has been interpreted as locating the safety shutdown valves in the 20” dia pipeline.
A high integrity safety shutdown system remains a requirement at the Glengad Landfall in order to limit the pressure in the onshore section of the upstream pipeline to a Maximum Allowable Operating Pressure (MAOP) of 100 barg.
1.2 Purpose The purpose of this report is to re-evaluate the potential configurations of the safety shutdown system at the LVI, taking into consideration any developments available in the market, any impacts on the functionality of the LVI and determine any increase in safety to the population in the Glengad area.
Corrib Onshore Pipeline EISAppendix Q4.4
Appraisal of Alternative Configurations for the LVI Safety Shutdown System
Page 4 of 12
2 SYSTEM REQUIREMENTS
2.1 Over Pressurisation Protection The over pressurisation protection evaluation, initiated following issue of the TAG and Advantica recommendations, determined that a high integrity safety shutdown system was required at the LVI. This would comprise dual fail safe inline safety shutdown valves (hydraulic open, spring close) and valve closure would be initiated when the pressure of the onshore pipeline at the LVI attains a preset trip value which would not exceed the designated MAOP for the onshore pipeline. The initiation system would be via triple individual pressure transmitters with a two out of three (2oo3) voting logic. That is, if two of the three pressure transmitters exceed a pressure higher than a preset trip value, then the two safety shutdown valves will close.
2.2 Restart The over pressurisation protection system evaluation also identified that restarting the onshore pipeline following closure of the safety shutdown valves would require use of a manually operated control valve. This would enable controlled re-pressurisation of the onshore pipeline and ensure that the downstream temperature in the onshore pipeline was maintained within the pipeline material design limits.
2.3 Testing of the Shutdown Systems The safety shutdown system would require periodic testing to validate the operation of the system and to ensure that the valves were maintaining a gas tight seal.
2.4 Pipeline Pigging When the onshore and offshore pipelines are being pigged, the pig will be launched from the subsea manifold and run through to the Gas Terminal. The pigs will pass through the Glengad Landfall and therefore any configuration adopted must accommodate internal pipeline pigging. This means that any valve inline with the pipeline must be the same internal diameter as the adjacent pipe (full bore) and be suitable for the passage of pigs.
Pigging of the offshore and onshore pipelines is an integral part of verifying the integrity of the complete pipeline system. Thus the ability to pig the pipelines is a fundamental requirement for the design of the LVI
It is recognised as best practise within Shell that high integrity safety shutdown valves should not be pigged to avoid any potential for damage to the valve seals which may affect the ability and reliability of the valve to close on demand.
2.5 Potential Configurations There are two potential configurations for the high integrity safety shutdown system at the Glengad landfall. These are the Bypass arrangement (as proposed) and the straight Pipe arrangement as indicated in the An Bord Pleanála correspondence. These can be summarised as follows:
Straight Pipe – The two safety shutdown valves are mounted inline with the onshore and offshore pipelines and thus the straight pipe configuration requires piggable safety shutdown valves (Refer Section 4).
Bypass – The two safety shutdown valves are mounted in a non-piggable bypass (Refer Section 5).
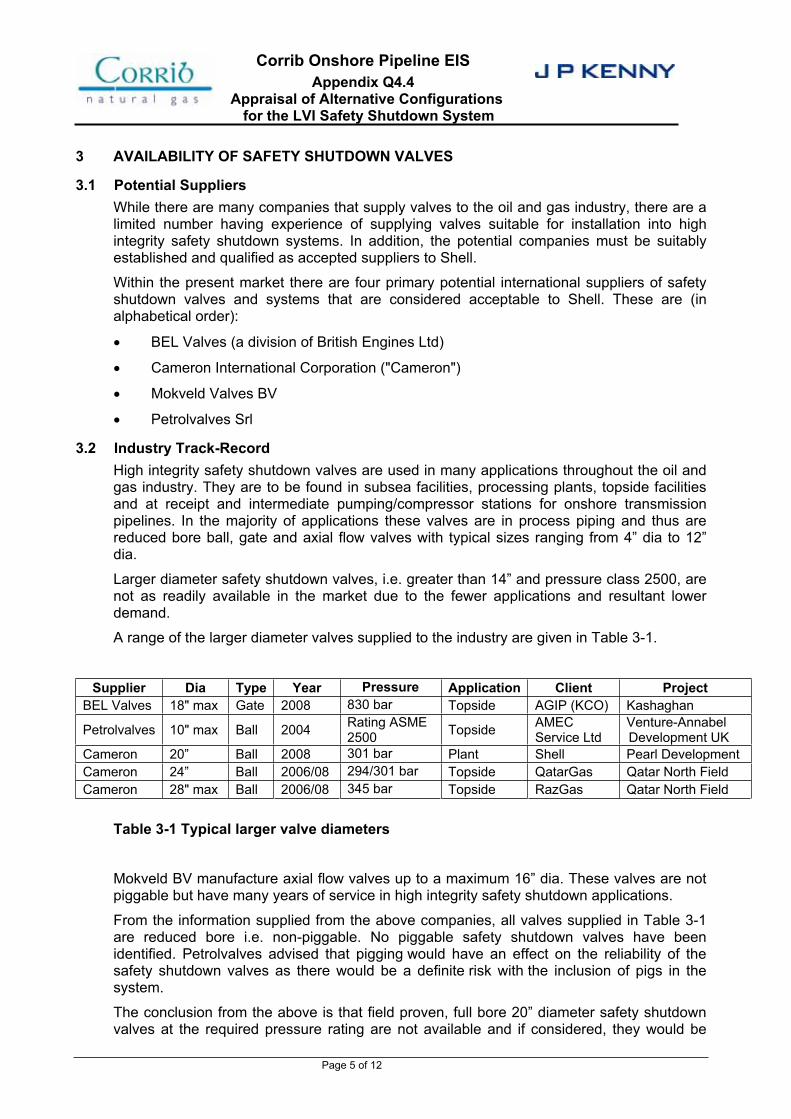
Corrib Onshore Pipeline EISAppendix Q4.4
Appraisal of Alternative Configurations for the LVI Safety Shutdown System
Page 5 of 12
3 AVAILABILITY OF SAFETY SHUTDOWN VALVES
3.1 Potential Suppliers While there are many companies that supply valves to the oil and gas industry, there are a limited number having experience of supplying valves suitable for installation into high integrity safety shutdown systems. In addition, the potential companies must be suitably established and qualified as accepted suppliers to Shell.
Within the present market there are four primary potential international suppliers of safety shutdown valves and systems that are considered acceptable to Shell. These are (in alphabetical order):
BEL Valves (a division of British Engines Ltd)
Cameron International Corporation ("Cameron")
Mokveld Valves BV
Petrolvalves Srl
3.2 Industry Track-Record High integrity safety shutdown valves are used in many applications throughout the oil and gas industry. They are to be found in subsea facilities, processing plants, topside facilities and at receipt and intermediate pumping/compressor stations for onshore transmission pipelines. In the majority of applications these valves are in process piping and thus are reduced bore ball, gate and axial flow valves with typical sizes ranging from 4” dia to 12” dia.
Larger diameter safety shutdown valves, i.e. greater than 14” and pressure class 2500, are not as readily available in the market due to the fewer applications and resultant lower demand.
A range of the larger diameter valves supplied to the industry are given in Table 3-1.
Supplier Dia Type Year Pressure Application Client ProjectBEL Valves 18" max Gate 2008 830 bar Topside AGIP (KCO) Kashaghan
Petrolvalves 10" max Ball 2004 Rating ASME 2500
Topside AMECService Ltd
Venture-Annabel Development UK
Cameron 20” Ball 2008 301 bar Plant Shell Pearl Development Cameron 24” Ball 2006/08 294/301 bar Topside QatarGas Qatar North Field Cameron 28" max Ball 2006/08 345 bar Topside RazGas Qatar North Field
Table 3-1 Typical larger valve diameters
Mokveld BV manufacture axial flow valves up to a maximum 16” dia. These valves are not piggable but have many years of service in high integrity safety shutdown applications.
From the information supplied from the above companies, all valves supplied in Table 3-1 are reduced bore i.e. non-piggable. No piggable safety shutdown valves have been identified. Petrolvalves advised that pigging would have an effect on the reliability of the safety shutdown valves as there would be a definite risk with the inclusion of pigs in the system.
The conclusion from the above is that field proven, full bore 20” diameter safety shutdown valves at the required pressure rating are not available and if considered, they would be

Corrib Onshore Pipeline EISAppendix Q4.4
Appraisal of Alternative Configurations for the LVI Safety Shutdown System
Page 6 of 12
one-off specials. SEPIL do not consider one-off specials with no proven track record are appropriate for the Corrib project.
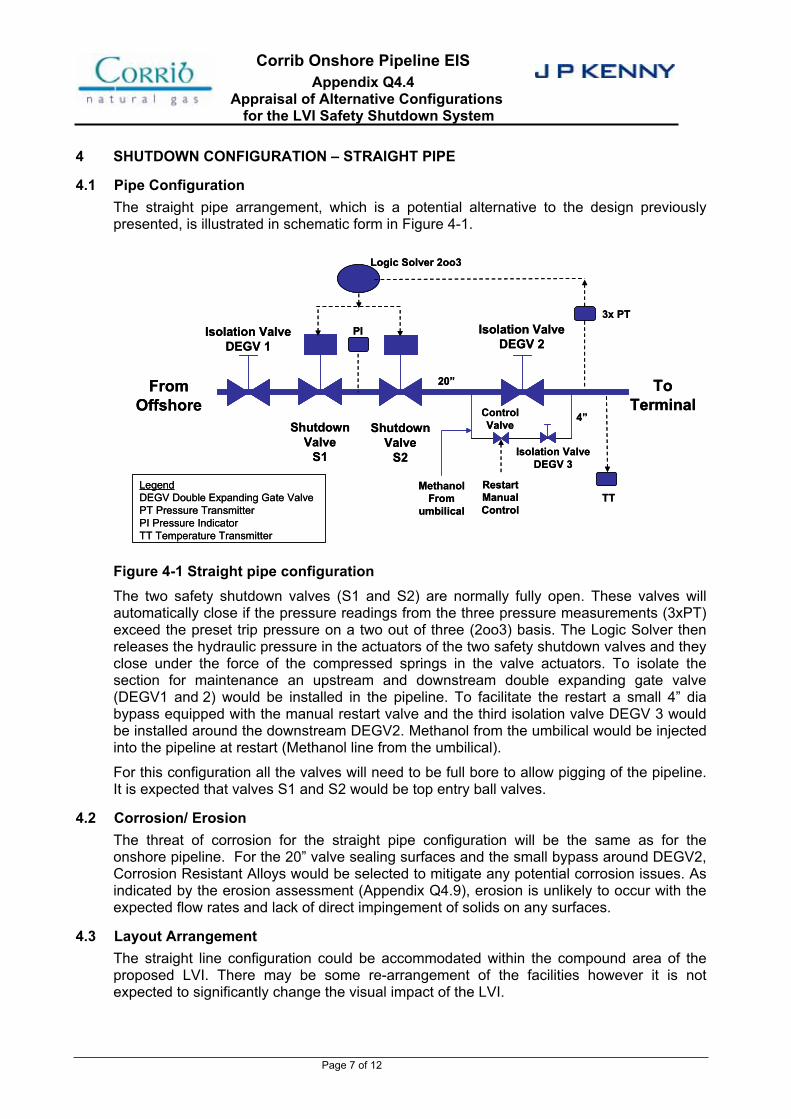
Corrib Onshore Pipeline EISAppendix Q4.4
Appraisal of Alternative Configurations for the LVI Safety Shutdown System
Page 7 of 12
4 SHUTDOWN CONFIGURATION – STRAIGHT PIPE
4.1 Pipe Configuration The straight pipe arrangement, which is a potential alternative to the design previously presented, is illustrated in schematic form in Figure 4-1.
Figure 4-1 Straight pipe configuration The two safety shutdown valves (S1 and S2) are normally fully open. These valves will automatically close if the pressure readings from the three pressure measurements (3xPT) exceed the preset trip pressure on a two out of three (2oo3) basis. The Logic Solver then releases the hydraulic pressure in the actuators of the two safety shutdown valves and they close under the force of the compressed springs in the valve actuators. To isolate the section for maintenance an upstream and downstream double expanding gate valve (DEGV1 and 2) would be installed in the pipeline. To facilitate the restart a small 4” dia bypass equipped with the manual restart valve and the third isolation valve DEGV 3 would be installed around the downstream DEGV2. Methanol from the umbilical would be injected into the pipeline at restart (Methanol line from the umbilical).
For this configuration all the valves will need to be full bore to allow pigging of the pipeline. It is expected that valves S1 and S2 would be top entry ball valves.
4.2 Corrosion/ Erosion The threat of corrosion for the straight pipe configuration will be the same as for the onshore pipeline. For the 20” valve sealing surfaces and the small bypass around DEGV2, Corrosion Resistant Alloys would be selected to mitigate any potential corrosion issues. As indicated by the erosion assessment (Appendix Q4.9), erosion is unlikely to occur with the expected flow rates and lack of direct impingement of solids on any surfaces.
4.3 Layout Arrangement The straight line configuration could be accommodated within the compound area of the proposed LVI. There may be some re-arrangement of the facilities however it is not expected to significantly change the visual impact of the LVI.
FromOffshore
ShutdownValve
S1
ShutdownValve
S2
Control Valve
ToTerminal
TTRestartManualControl
3x PT
Logic Solver 2oo3
MethanolFrom
umbilical
Isolation ValveDEGV 1
Isolation ValveDEGV 2
4”
20”
Isolation ValveDEGV 3
PI
LegendDEGV Double Expanding Gate ValvePT Pressure TransmitterPI Pressure IndicatorTT Temperature Transmitter

Corrib Onshore Pipeline EISAppendix Q4.4
Appraisal of Alternative Configurations for the LVI Safety Shutdown System
Page 8 of 12
4.4 Testing of the Shutdown Systems In this configuration two top entry ball valves could be used to maintain the safety shutdown valves without removal from the pipeline. The two safety shutdown valves would be isolated by DEGV 1 and DEGV 2 to facilitate maintenance.
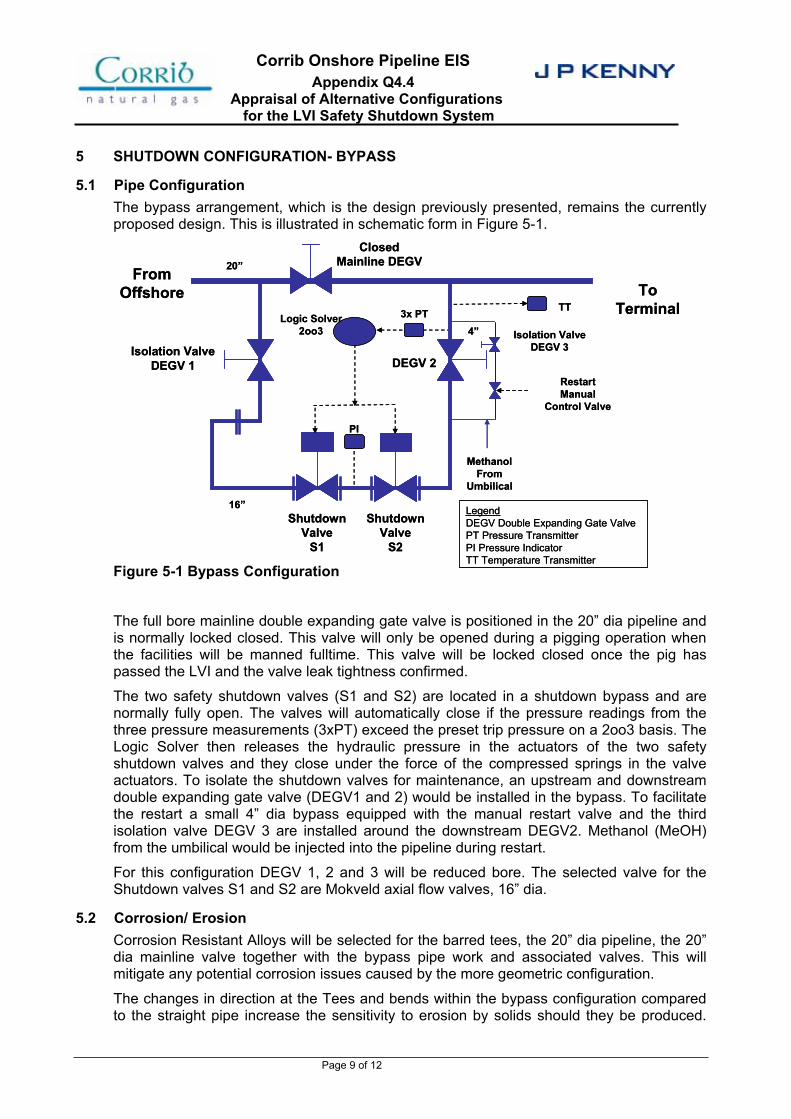
Corrib Onshore Pipeline EISAppendix Q4.4
Appraisal of Alternative Configurations for the LVI Safety Shutdown System
Page 9 of 12
5 SHUTDOWN CONFIGURATION- BYPASS
5.1 Pipe Configuration The bypass arrangement, which is the design previously presented, remains the currently proposed design. This is illustrated in schematic form in Figure 5-1.
Figure 5-1 Bypass Configuration
The full bore mainline double expanding gate valve is positioned in the 20” dia pipeline and is normally locked closed. This valve will only be opened during a pigging operation when the facilities will be manned fulltime. This valve will be locked closed once the pig has passed the LVI and the valve leak tightness confirmed.
The two safety shutdown valves (S1 and S2) are located in a shutdown bypass and are normally fully open. The valves will automatically close if the pressure readings from the three pressure measurements (3xPT) exceed the preset trip pressure on a 2oo3 basis. The Logic Solver then releases the hydraulic pressure in the actuators of the two safety shutdown valves and they close under the force of the compressed springs in the valve actuators. To isolate the shutdown valves for maintenance, an upstream and downstream double expanding gate valve (DEGV1 and 2) would be installed in the bypass. To facilitate the restart a small 4” dia bypass equipped with the manual restart valve and the third isolation valve DEGV 3 are installed around the downstream DEGV2. Methanol (MeOH) from the umbilical would be injected into the pipeline during restart.
For this configuration DEGV 1, 2 and 3 will be reduced bore. The selected valve for the Shutdown valves S1 and S2 are Mokveld axial flow valves, 16” dia.
5.2 Corrosion/ Erosion Corrosion Resistant Alloys will be selected for the barred tees, the 20” dia pipeline, the 20” dia mainline valve together with the bypass pipe work and associated valves. This will mitigate any potential corrosion issues caused by the more geometric configuration.
The changes in direction at the Tees and bends within the bypass configuration compared to the straight pipe increase the sensitivity to erosion by solids should they be produced.
FromOffshore
ShutdownValve
S1
ShutdownValve
S2
ToTerminalTT3x PTLogic Solver
2oo3
Isolation ValveDEGV 1 DEGV 2
20”
RestartManual
Control Valve
MethanolFrom
Umbilical
4” Isolation ValveDEGV 3
PI
ClosedMainline DEGV
16”LegendDEGV Double Expanding Gate ValvePT Pressure TransmitterPI Pressure IndicatorTT Temperature Transmitter
Corrib Onshore Pipeline EISAppendix Q4.4
Appraisal of Alternative Configurations for the LVI Safety Shutdown System
Page 10 of 12
However, as indicated by the erosion assessment (Appendix Q4.9), erosion is not likely to be significant and is within the design parameters.
The likelihood of liquid slugs in the pipeline is considered to be negligible and thus no design issues for either configuration are expected with respect to slugging (Refer Appendix Q 4.5).
5.3 Layout Arrangement The LVI compound area has been sized to accommodate the bypass configuration.
5.4 Testing of the Shutdown Systems In this configuration the safety shutdown valves are axial flow types and require to be removed from the pipeline for full maintenance after a prescribed period of time. This is to ensure the high reliability of these valves. Consequently the valves are flanged. To facilitate removal of these two valves, an additional flange and a U shaped pipe section is included immediately upstream of shutdown valve S1. This work will be coordinated within the period assigned for a planned shutdown of the Gas Terminal and pipeline system.
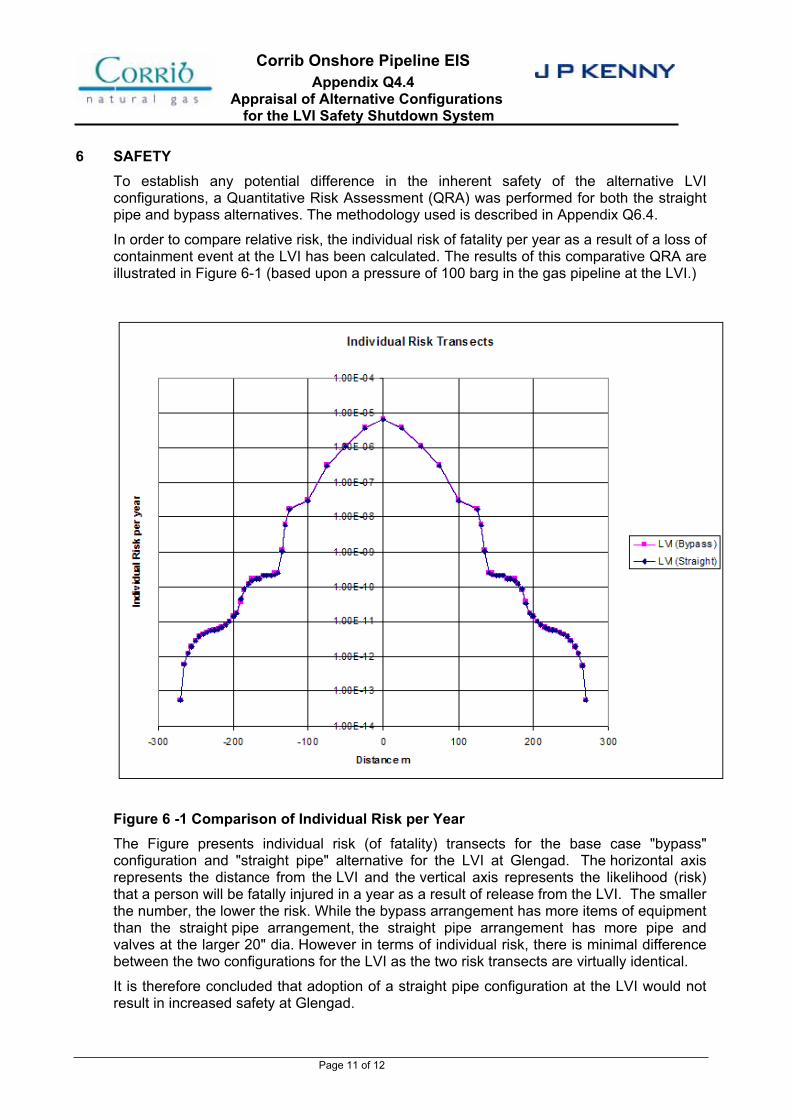
Corrib Onshore Pipeline EISAppendix Q4.4
Appraisal of Alternative Configurations for the LVI Safety Shutdown System
Page 11 of 12
6 SAFETY To establish any potential difference in the inherent safety of the alternative LVI configurations, a Quantitative Risk Assessment (QRA) was performed for both the straight pipe and bypass alternatives. The methodology used is described in Appendix Q6.4.
In order to compare relative risk, the individual risk of fatality per year as a result of a loss of containment event at the LVI has been calculated. The results of this comparative QRA are illustrated in Figure 6-1 (based upon a pressure of 100 barg in the gas pipeline at the LVI.)
Figure 6 -1 Comparison of Individual Risk per Year The Figure presents individual risk (of fatality) transects for the base case "bypass" configuration and "straight pipe" alternative for the LVI at Glengad. The horizontal axis represents the distance from the LVI and the vertical axis represents the likelihood (risk) that a person will be fatally injured in a year as a result of release from the LVI. The smaller the number, the lower the risk. While the bypass arrangement has more items of equipment than the straight pipe arrangement, the straight pipe arrangement has more pipe and valves at the larger 20" dia. However in terms of individual risk, there is minimal difference between the two configurations for the LVI as the two risk transects are virtually identical.
It is therefore concluded that adoption of a straight pipe configuration at the LVI would not result in increased safety at Glengad.
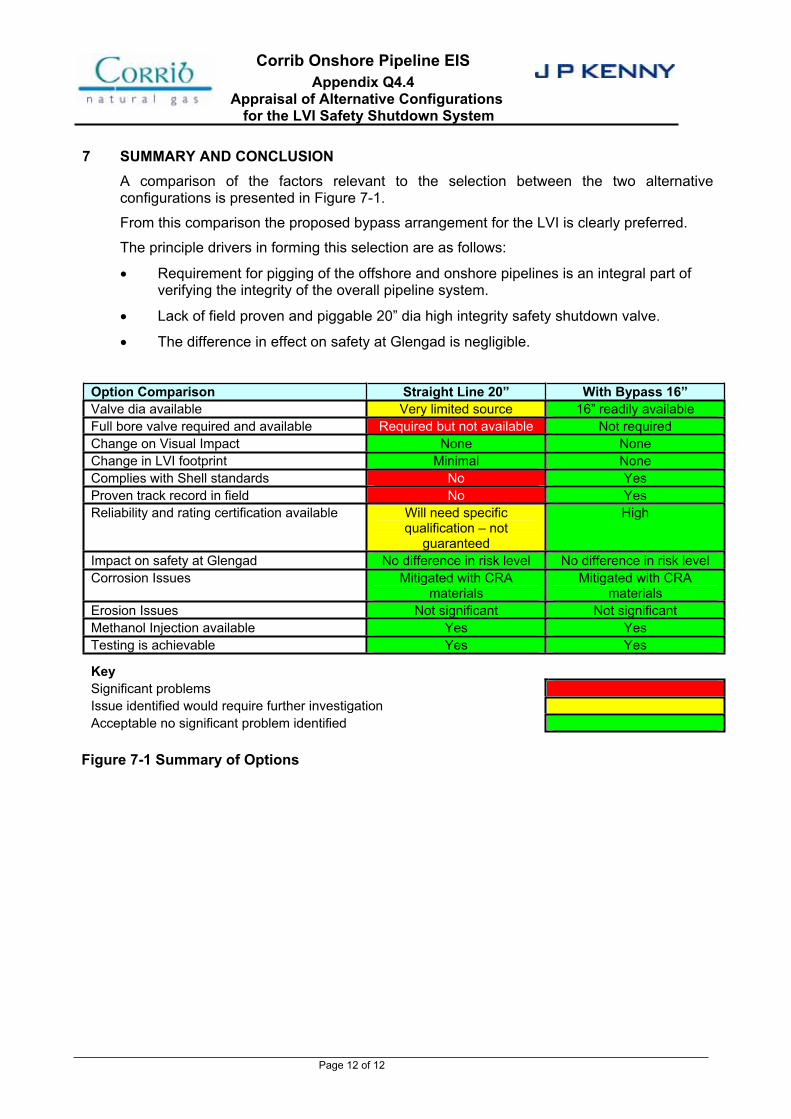
Corrib Onshore Pipeline EISAppendix Q4.4
Appraisal of Alternative Configurations for the LVI Safety Shutdown System
Page 12 of 12
7 SUMMARY AND CONCLUSION A comparison of the factors relevant to the selection between the two alternative configurations is presented in Figure 7-1.
From this comparison the proposed bypass arrangement for the LVI is clearly preferred.
The principle drivers in forming this selection are as follows:
Requirement for pigging of the offshore and onshore pipelines is an integral part of verifying the integrity of the overall pipeline system.
Lack of field proven and piggable 20” dia high integrity safety shutdown valve.
The difference in effect on safety at Glengad is negligible.
Option Comparison Straight Line 20” With Bypass 16” Valve dia available Very limited source 16” readily available Full bore valve required and available Required but not available Not required Change on Visual Impact None None Change in LVI footprint Minimal None Complies with Shell standards No Yes Proven track record in field No Yes Reliability and rating certification available Will need specific
qualification – not guaranteed
High
Impact on safety at Glengad No difference in risk level No difference in risk level Corrosion Issues Mitigated with CRA
materials Mitigated with CRA
materials Erosion Issues Not significant Not significant Methanol Injection available Yes Yes Testing is achievable Yes Yes
Key Significant problems Issue identified would require further investigation Acceptable no significant problem identified
Figure 7-1 Summary of Options
SHELL E&P IRELAND LIMITED
CORRIB GAS FIELD DEVELOPMENT PROJECT
Q4.5 ASPECTS OF PROCESS ENGINEERING DESIGN OF THE CORRIBPRODUCTION SYSTEM
DOCUMENT No: COR 25 SH 0012
Corrib Onshore Pipeline EIS Q4.5 Aspects of Process Engineering Design of the Corrib Production System
COR-25-SH-0012 ii
TABLE OF CONTENTS
1 INTRODUCTION ..............................................................................................................................12 PIPELINE PROCESS SAFEGUARDING DESIGN & MAOP ..........................................................3
2.1 MAXIMUM ALLOWABLE OPERATING PRESSURE (MAOP) ....................................................3
2.2 SUPERSEDED PIPELINE PROCESS SAFEGUARDING PHILOSOPHY ........................................3
2.3 CURRENT PIPELINE PROCESS SAFEGUARDING PHILOSOPHY ..............................................4
2.4 NORMAL OPERATING PIPELINE PRESSURE PHILOSOPHY ....................................................6
2.5 PIPELINE PROCESS SAFEGUARDING IN DETAIL ................................................................7
2.5.1 Subsea Tripping Nomenclature .........................................................................7
2.5.2 Safeguarding Layers of Protection ....................................................................9
3 SEVERING OF THE UMBILICAL ..................................................................................................123.1 UMBILICAL DESCRIPTION ................................................................................................12
3.2 ASSESSMENT OF SEVERED UMBILICALS IMPACT ON PIPELINE PRESSURES .......................13
3.2.1 Introduction ......................................................................................................13
3.2.2 Electrical Power Cables...................................................................................13
3.2.3 Communication Cables ...................................................................................14
3.2.4 HP Hydraulic Fluid...........................................................................................15
3.2.5 LP Hydraulic Fluid............................................................................................15
3.2.6 Methanol/Corrosion Inhibitor ...........................................................................15
3.2.7 Conclusions .....................................................................................................16
3.3 HEALTH, SAFETY AND PIPELINE INTEGRITY CONSEQUENCES OF ONSHORE UMBILICAL
FAILURE.........................................................................................................................16
3.4 SPILL VOLUMES AND POTENTIAL FOR ENVIRONMENTAL IMPACT .......................................16
4 POTENTIAL AND EFFECT OF PASSING (‘LEAKING’) VALVES IN THE CORRIB PIPELINE .184.1 SUMMARY ......................................................................................................................18
4.2 BACKGROUND ................................................................................................................20
4.2.1 Introduction ......................................................................................................20
4.2.2 Basis of Analysis..............................................................................................20
4.2.3 Trip and Alarm Settings & Sequence ..............................................................22
4.2.4 The LVI Valves ................................................................................................24
4.2.5 Valve In Situ Testing Regime ..........................................................................26
4.3 VALVE LEAKAGE SCENARIOS ..........................................................................................27
4.3.1 Valve Leakage Scenario 1: Planned Shutdown for Maintenance ...................27
4.3.2 Valve Leakage Scenario 2: Unplanned Shutdown due to a High Pressure
Trip...................................................................................................................30
5 CORRIB PIPELINE FLOW REGIME .............................................................................................346 HYDRATES ....................................................................................................................................37
6.1 INTRODUCTION...............................................................................................................37
6.2 CORRIB HYDRATE MANAGEMENT STRATEGY: HYDRATE INHIBITION...................................37
Corrib Onshore Pipeline EIS Q4.5 Aspects of Process Engineering Design of the Corrib Production System
COR-25-SH-0012 iii
6.3 CONSEQUENCE OF HYDRATE FORMATION .......................................................................38
6.4 HYDRATE REMEDIATION ..........................................................................................39
7 COLD VENTING AT GLENGAD (THE LVI COMPOUND)............................................................407.1 OBJECTIVE.....................................................................................................................40
7.2 PRESENT ARRANGEMENT ...............................................................................................40
7.3 COLD VENT SIZING.........................................................................................................40
7.4 VENT LOCATION .............................................................................................................41
7.5 CONSEQUENCES ............................................................................................................41
7.6 CONCLUSION .................................................................................................................41
GLOSSARY ...........................................................................................................................................42
LIST OF TABLES
Table 1.1: displays queries that have been previously raised and the corresponding section of this document which addresses each query................................................................................................. 1
Table 2.1A: Simplified Subsea Trips and Explanations ......................................................................... 8
Table 2.1B: Detailed Subsea Trips and Explanations ........................................................................... 8
Table 2.2: The major layers of protection in the Corrib production system to prevent overpressurisation.................................................................................................................................. 9
Table 3.1: Functions of services provided by umbilical ....................................................................... 12
Corrib Onshore Pipeline EIS Q4.5 Aspects of Process Engineering Design of the Corrib Production System
COR-25-SH-0012 iv
LIST OF FIGURES
Figure 3.1: A schematic of the Corrib onshore umbilicals ................................................................... 13
Figure 4.1: Pressure margin available for ‘valve leakage’ in the offshore pipeline for various scenarios. ............................................................................................................................................. 18
Figure 4.2: Pressure trends at the manifold and upstream (u/s) of the LVI after an offshore pipeline unplanned shutdown due to a high pressure trip................................................................................. 19
Figure 4.3: Pipeline Overpressure Protection System......................................................................... 20
Figure 4.4: Some of the main elements of a typical Corrib well and subsea tree tied into the manifold............................................................................................................................................................. 21
Figure 4.5: The configuration of the LVI pipework and valves............................................................. 24
Figure 4.6: Pressure trends at the manifold and upstream (u/s) of the LVI after an offshore pipeline planned shutdown.. .............................................................................................................................. 28
Figure 4.7: Pressure trends at the manifold and upstream (u/s) of the LVI after an offshore pipeline planned shutdown.. .............................................................................................................................. 29
Figure 4.8: Pressure trends at the manifold and upstream (u/s) of the LVI after an offshore pipeline unplanned shutdown due to a high pressure trip.. ............................................................................... 31
Figure 4.9: Pressure trends at the manifold and upstream (u/s) of the LVI after an offshore pipeline unplanned shutdown due to a high pressure trip.. ............................................................................... 32
Figure 4.10: Pressure trends downstream (d/s) of the LVI and at the pipeline outlet (located at the Terminal) after an onshore pipeline unplanned shutdown due to a high pressure trip........................ 33
Figure 6.1: Flow patterns in horizontal pipelines ................................................................................. 34
Figure 6.2a: Typical flow pattern map.................................................................................................. 35
Figure 6.2b: Flow pattern map for early and late field life of Corrib ..................................................... 36
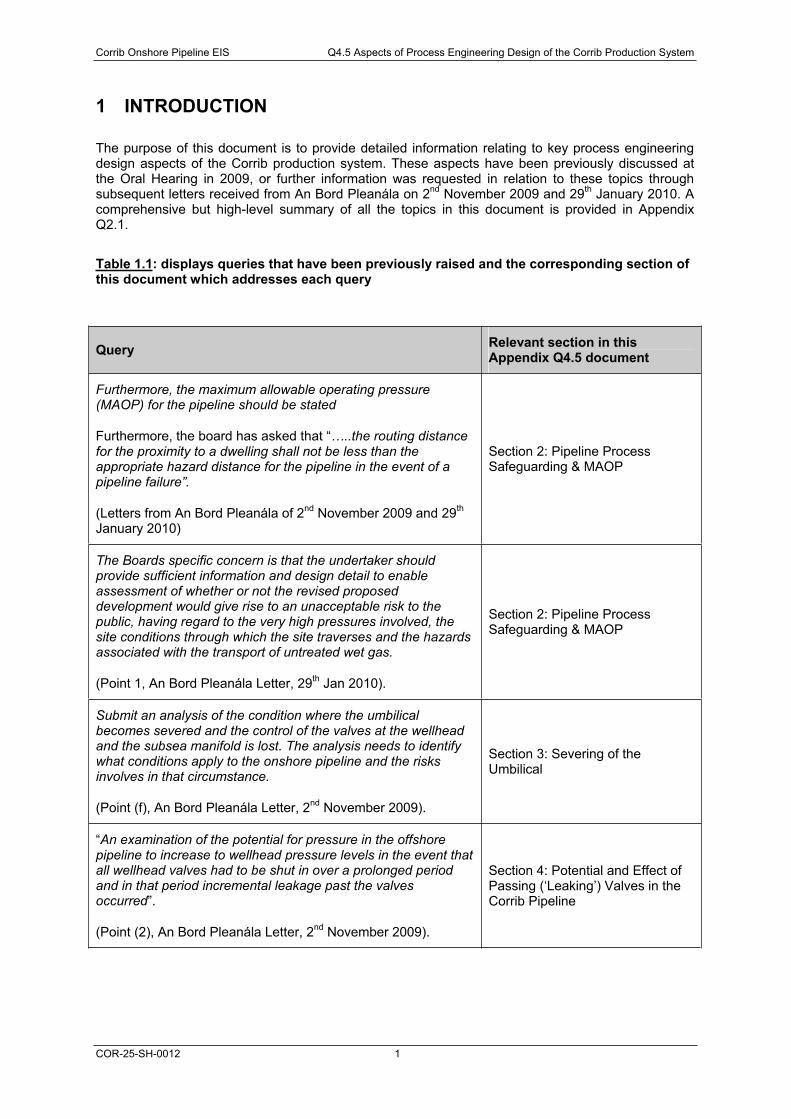
Corrib Onshore Pipeline EIS Q4.5 Aspects of Process Engineering Design of the Corrib Production System
COR-25-SH-0012 1
1 INTRODUCTION
The purpose of this document is to provide detailed information relating to key process engineering design aspects of the Corrib production system. These aspects have been previously discussed at the Oral Hearing in 2009, or further information was requested in relation to these topics through subsequent letters received from An Bord Pleanála on 2nd November 2009 and 29th January 2010. A comprehensive but high-level summary of all the topics in this document is provided in Appendix Q2.1.
Table 1.1: displays queries that have been previously raised and the corresponding section of this document which addresses each query
Query Relevant section in this Appendix Q4.5 document
Furthermore, the maximum allowable operating pressure (MAOP) for the pipeline should be stated
Furthermore, the board has asked that “…..the routing distance for the proximity to a dwelling shall not be less than the appropriate hazard distance for the pipeline in the event of a pipeline failure”.
(Letters from An Bord Pleanála of 2nd November 2009 and 29th
January 2010)
Section 2: Pipeline Process Safeguarding & MAOP
The Boards specific concern is that the undertaker should provide sufficient information and design detail to enable assessment of whether or not the revised proposed development would give rise to an unacceptable risk to the public, having regard to the very high pressures involved, the site conditions through which the site traverses and the hazards associated with the transport of untreated wet gas.
(Point 1, An Bord Pleanála Letter, 29th Jan 2010).
Section 2: Pipeline Process Safeguarding & MAOP
Submit an analysis of the condition where the umbilical becomes severed and the control of the valves at the wellhead and the subsea manifold is lost. The analysis needs to identify what conditions apply to the onshore pipeline and the risks involves in that circumstance.
(Point (f), An Bord Pleanála Letter, 2nd November 2009).
Section 3: Severing of the Umbilical
“An examination of the potential for pressure in the offshore pipeline to increase to wellhead pressure levels in the event that all wellhead valves had to be shut in over a prolonged period and in that period incremental leakage past the valves occurred”.
(Point (2), An Bord Pleanála Letter, 2nd November 2009).
Section 4: Potential and Effect of Passing (‘Leaking’) Valves in the Corrib Pipeline
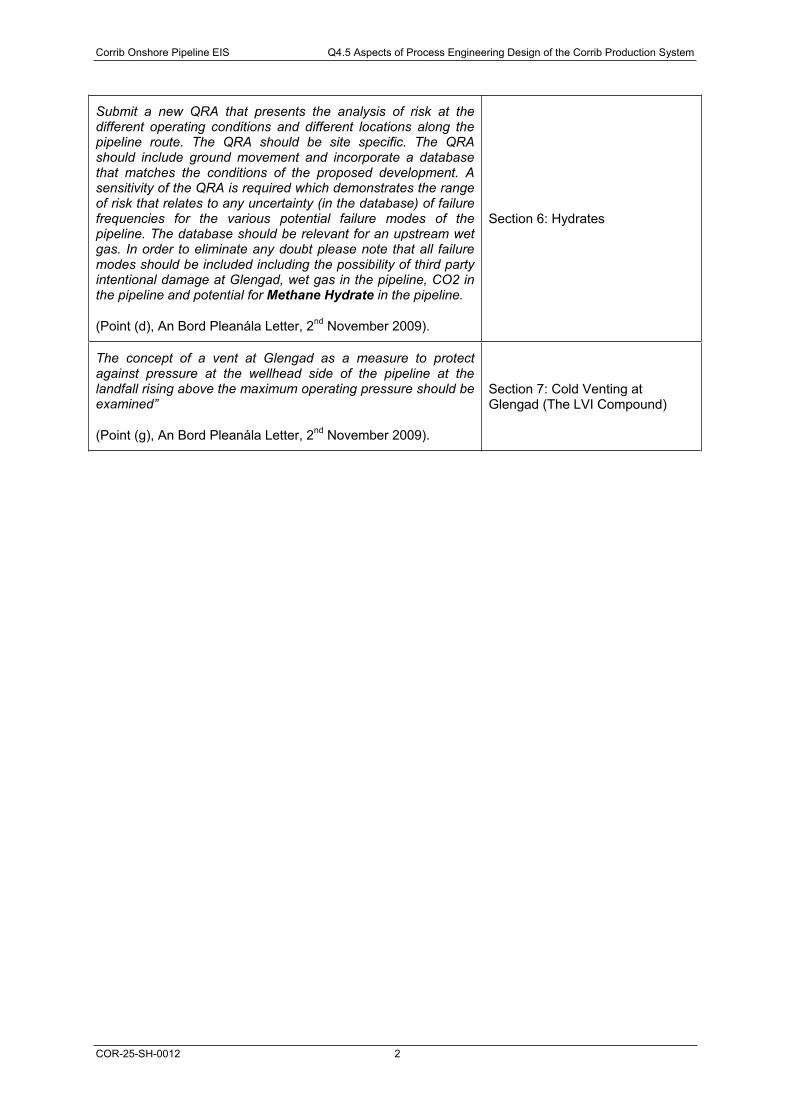
Corrib Onshore Pipeline EIS Q4.5 Aspects of Process Engineering Design of the Corrib Production System
COR-25-SH-0012 2
Submit a new QRA that presents the analysis of risk at the different operating conditions and different locations along the pipeline route. The QRA should be site specific. The QRA should include ground movement and incorporate a database that matches the conditions of the proposed development. A sensitivity of the QRA is required which demonstrates the range of risk that relates to any uncertainty (in the database) of failure frequencies for the various potential failure modes of the pipeline. The database should be relevant for an upstream wet gas. In order to eliminate any doubt please note that all failure modes should be included including the possibility of third party intentional damage at Glengad, wet gas in the pipeline, CO2 in the pipeline and potential for Methane Hydrate in the pipeline.
(Point (d), An Bord Pleanála Letter, 2nd November 2009).
Section 6: Hydrates
The concept of a vent at Glengad as a measure to protect against pressure at the wellhead side of the pipeline at the landfall rising above the maximum operating pressure should be examined”
(Point (g), An Bord Pleanála Letter, 2nd November 2009).
Section 7: Cold Venting at Glengad (The LVI Compound)

Corrib Onshore Pipeline EIS Q4.5 Aspects of Process Engineering Design of the Corrib Production System
COR-25-SH-0012 3
2 PIPELINE PROCESS SAFEGUARDING DESIGN & MAOP
2.1 MAXIMUM ALLOWABLE OPERATING PRESSURE (MAOP)
In the letters received on 2nd November 2009 and 29th January 2010, An Bord Pleanála requested the setting of both an onshore and an offshore MAOP. Furthermore, An Bord Pleanála asked that “…..the routing distance for the proximity to a dwelling shall not be less than the appropriate hazard distance for the pipeline in the event of a pipeline failure”. An Bord Pleanála have also indicated how the hazard distance should be calculated, in which MAOP is a key input.
Although hazard distance is not a standard measure for pipeline safety, in order to comply with the An Bord Pleanála request, SEPIL has undertaken a review of the required MAOPs.
The outcome of this review is that SEPIL has established the minimum required offshore and onshore pipeline MAOP to maintain a sufficient operating envelope to meet the contractual and technical requirements of the already approved and constructed Gas Terminal. This review has resulted in the maximum allowable operating pressures (MAOPs) of the pipelines being set to 150barg and 100barg for the offshore and onshore pipelines respectively.
SEPIL have modified the design to satisfy the requirements of An Bord Pleanála, as described in their letters of 2nd November 2009 and 29th January 2010. Note that further lowering of the pipeline MAOP would not allow for the Gas Terminal to operate within its operating envelope, as per the basis upon which approval has been granted for the Gas Terminal.
2.2 SUPERSEDED PIPELINE PROCESS SAFEGUARDING PHILOSOPHY
This section presents the development of the Corrib Pipeline Process Safeguarding Philosophy from 2002 to 2009.
The Corrib pipeline system between the Corrib subsea wells and the Gas Terminal is divided into two sections:
- An offshore pipeline from the subsea manifold to the inlet of the beach valve (a valve located at the beach serving as an isolation valve, no overpressure protection function)
- An onshore pipeline from the beach valve to the Gas Terminal
The Corrib pipeline was originally designed and has been procured for a design pressure of 345 barg, equal to the maximum pressure from the Corrib wells plus some margin. Thus the original pipeline system was designed as a “fully rated” system.
With respect to the operating envelope, the operating pressure was limited to approximately 150 barg based on various constraints within the system (methanol injection capabilities).
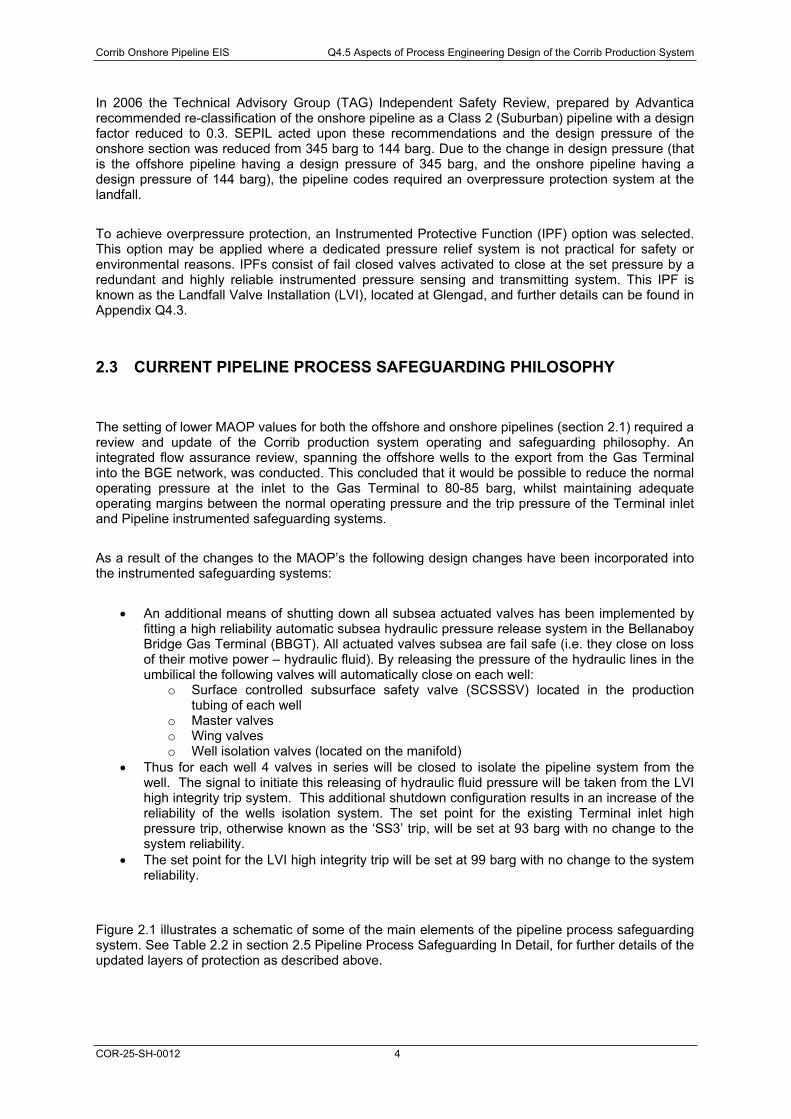
Corrib Onshore Pipeline EIS Q4.5 Aspects of Process Engineering Design of the Corrib Production System
COR-25-SH-0012 4
In 2006 the Technical Advisory Group (TAG) Independent Safety Review, prepared by Advantica recommended re-classification of the onshore pipeline as a Class 2 (Suburban) pipeline with a design factor reduced to 0.3. SEPIL acted upon these recommendations and the design pressure of the onshore section was reduced from 345 barg to 144 barg. Due to the change in design pressure (that is the offshore pipeline having a design pressure of 345 barg, and the onshore pipeline having a design pressure of 144 barg), the pipeline codes required an overpressure protection system at the landfall.
To achieve overpressure protection, an Instrumented Protective Function (IPF) option was selected. This option may be applied where a dedicated pressure relief system is not practical for safety or environmental reasons. IPFs consist of fail closed valves activated to close at the set pressure by a redundant and highly reliable instrumented pressure sensing and transmitting system. This IPF is known as the Landfall Valve Installation (LVI), located at Glengad, and further details can be found in Appendix Q4.3.
2.3 CURRENT PIPELINE PROCESS SAFEGUARDING PHILOSOPHY
The setting of lower MAOP values for both the offshore and onshore pipelines (section 2.1) required a review and update of the Corrib production system operating and safeguarding philosophy. An integrated flow assurance review, spanning the offshore wells to the export from the Gas Terminal into the BGE network, was conducted. This concluded that it would be possible to reduce the normal operating pressure at the inlet to the Gas Terminal to 80-85 barg, whilst maintaining adequate operating margins between the normal operating pressure and the trip pressure of the Terminal inlet and Pipeline instrumented safeguarding systems.
As a result of the changes to the MAOP’s the following design changes have been incorporated into the instrumented safeguarding systems:
An additional means of shutting down all subsea actuated valves has been implemented by fitting a high reliability automatic subsea hydraulic pressure release system in the Bellanaboy Bridge Gas Terminal (BBGT). All actuated valves subsea are fail safe (i.e. they close on loss of their motive power – hydraulic fluid). By releasing the pressure of the hydraulic lines in the umbilical the following valves will automatically close on each well:
o Surface controlled subsurface safety valve (SCSSSV) located in the production tubing of each well
o Master valves o Wing valves o Well isolation valves (located on the manifold)
Thus for each well 4 valves in series will be closed to isolate the pipeline system from the well. The signal to initiate this releasing of hydraulic fluid pressure will be taken from the LVI high integrity trip system. This additional shutdown configuration results in an increase of the reliability of the wells isolation system. The set point for the existing Terminal inlet high pressure trip, otherwise known as the ‘SS3’ trip, will be set at 93 barg with no change to the system reliability.
The set point for the LVI high integrity trip will be set at 99 barg with no change to the system reliability.
Figure 2.1 illustrates a schematic of some of the main elements of the pipeline process safeguarding system. See Table 2.2 in section 2.5 Pipeline Process Safeguarding In Detail, for further details of the updated layers of protection as described above.
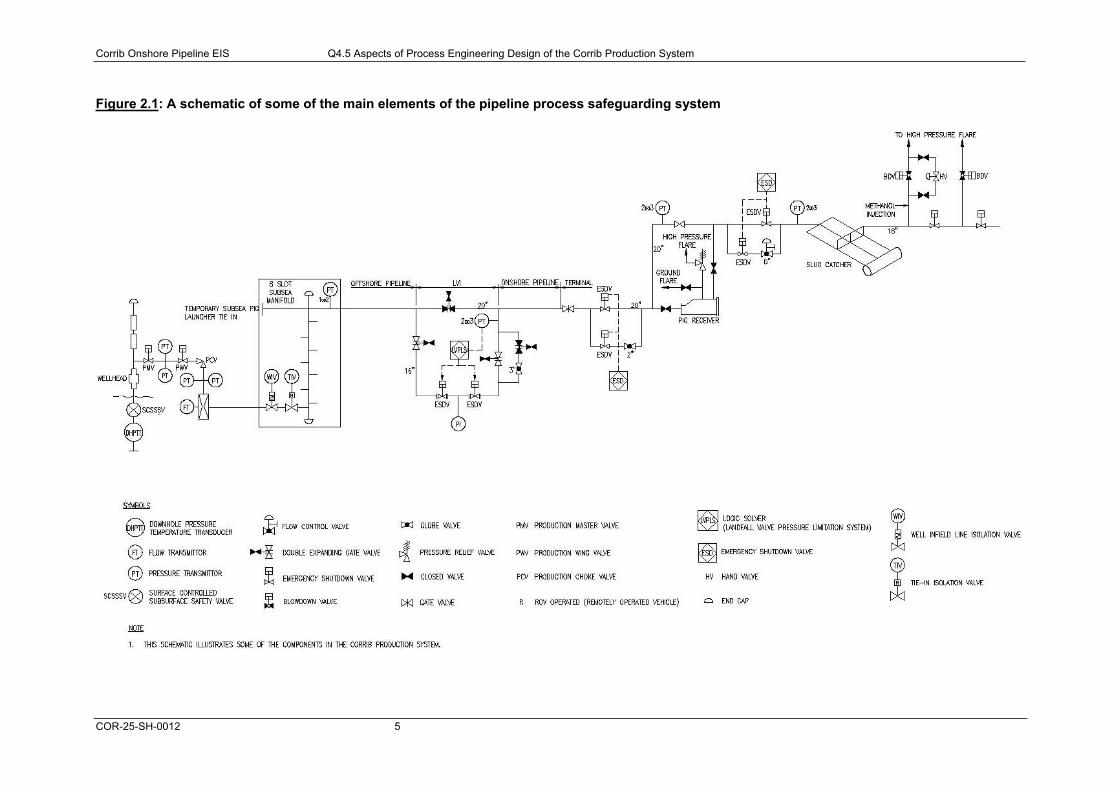
Corrib Onshore Pipeline EIS Q4.5 Aspects of Process Engineering Design of the Corrib Production System
COR-25-SH-0012 5
Figure 2.1: A schematic of some of the main elements of the pipeline process safeguarding system
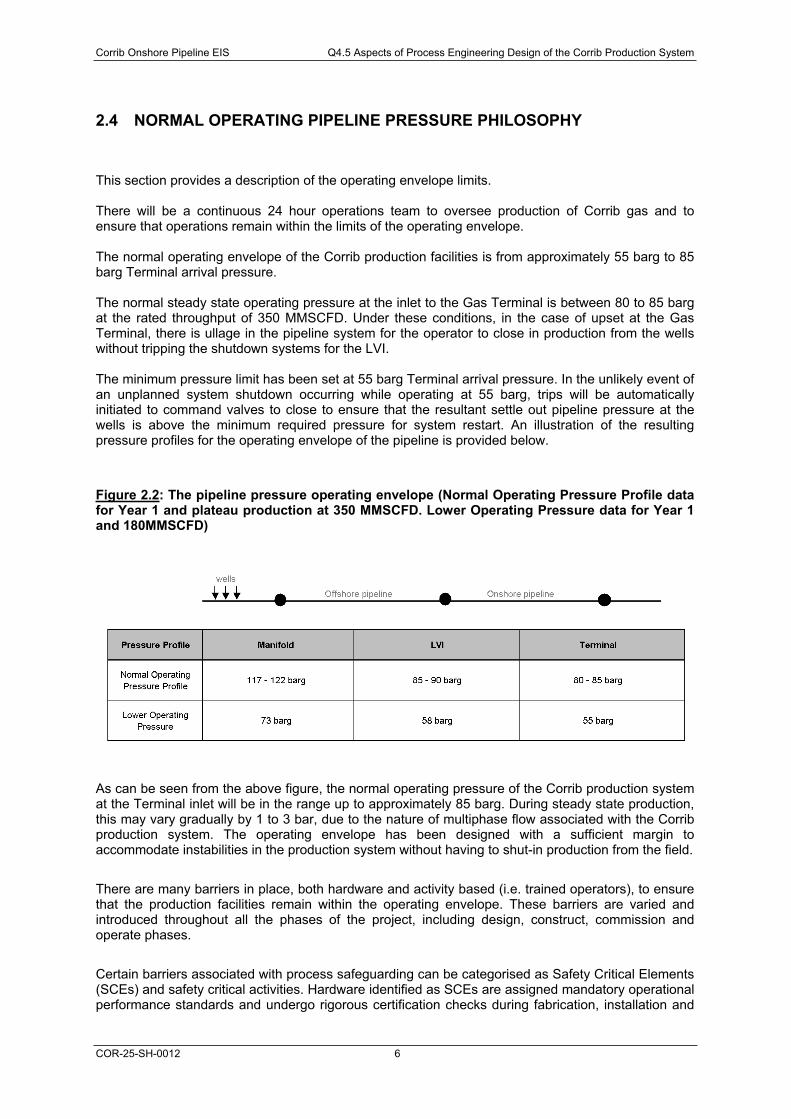
Corrib Onshore Pipeline EIS Q4.5 Aspects of Process Engineering Design of the Corrib Production System
COR-25-SH-0012 6
2.4 NORMAL OPERATING PIPELINE PRESSURE PHILOSOPHY
This section provides a description of the operating envelope limits.
There will be a continuous 24 hour operations team to oversee production of Corrib gas and to ensure that operations remain within the limits of the operating envelope.
The normal operating envelope of the Corrib production facilities is from approximately 55 barg to 85 barg Terminal arrival pressure.
The normal steady state operating pressure at the inlet to the Gas Terminal is between 80 to 85 barg at the rated throughput of 350 MMSCFD. Under these conditions, in the case of upset at the Gas Terminal, there is ullage in the pipeline system for the operator to close in production from the wells without tripping the shutdown systems for the LVI.
The minimum pressure limit has been set at 55 barg Terminal arrival pressure. In the unlikely event of an unplanned system shutdown occurring while operating at 55 barg, trips will be automatically initiated to command valves to close to ensure that the resultant settle out pipeline pressure at the wells is above the minimum required pressure for system restart. An illustration of the resulting pressure profiles for the operating envelope of the pipeline is provided below.
Figure 2.2: The pipeline pressure operating envelope (Normal Operating Pressure Profile data for Year 1 and plateau production at 350 MMSCFD. Lower Operating Pressure data for Year 1 and 180MMSCFD)
As can be seen from the above figure, the normal operating pressure of the Corrib production system at the Terminal inlet will be in the range up to approximately 85 barg. During steady state production, this may vary gradually by 1 to 3 bar, due to the nature of multiphase flow associated with the Corrib production system. The operating envelope has been designed with a sufficient margin to accommodate instabilities in the production system without having to shut-in production from the field.
There are many barriers in place, both hardware and activity based (i.e. trained operators), to ensure that the production facilities remain within the operating envelope. These barriers are varied and introduced throughout all the phases of the project, including design, construct, commission and operate phases.
Certain barriers associated with process safeguarding can be categorised as Safety Critical Elements (SCEs) and safety critical activities. Hardware identified as SCEs are assigned mandatory operational performance standards and undergo rigorous certification checks during fabrication, installation and
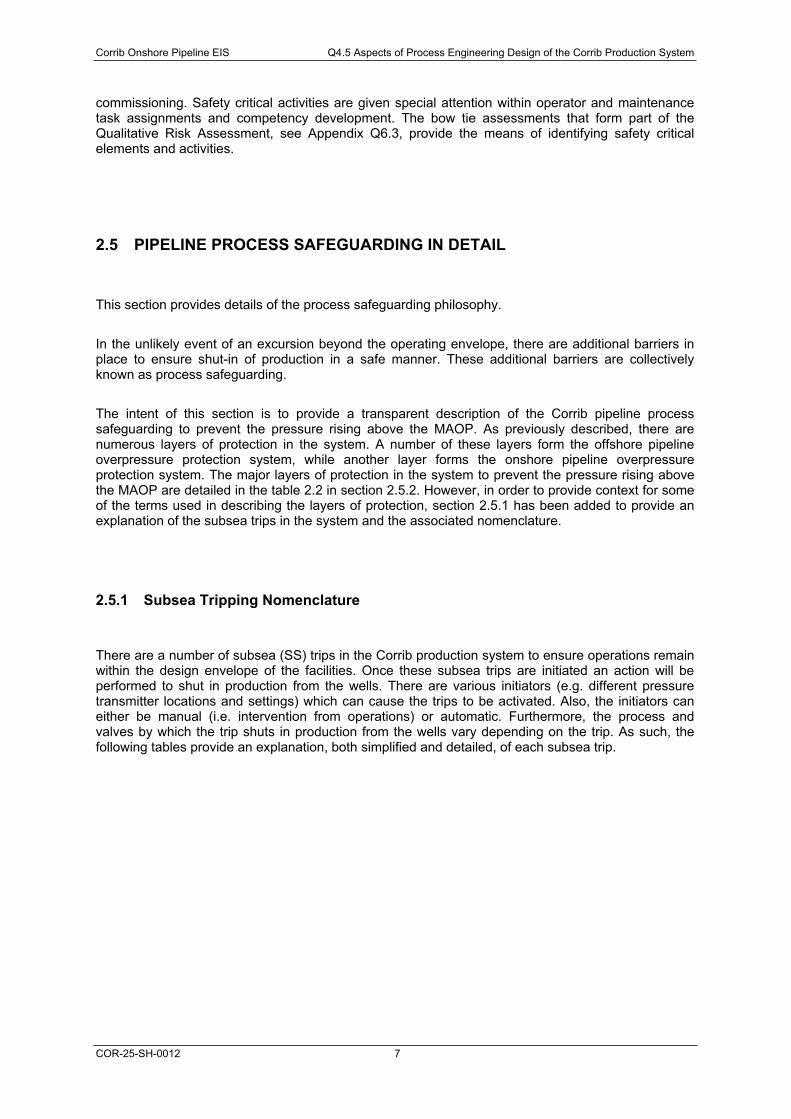
Corrib Onshore Pipeline EIS Q4.5 Aspects of Process Engineering Design of the Corrib Production System
COR-25-SH-0012 7
commissioning. Safety critical activities are given special attention within operator and maintenance task assignments and competency development. The bow tie assessments that form part of the Qualitative Risk Assessment, see Appendix Q6.3, provide the means of identifying safety critical elements and activities.
2.5 PIPELINE PROCESS SAFEGUARDING IN DETAIL
This section provides details of the process safeguarding philosophy.
In the unlikely event of an excursion beyond the operating envelope, there are additional barriers in place to ensure shut-in of production in a safe manner. These additional barriers are collectively known as process safeguarding.
The intent of this section is to provide a transparent description of the Corrib pipeline process safeguarding to prevent the pressure rising above the MAOP. As previously described, there are numerous layers of protection in the system. A number of these layers form the offshore pipeline overpressure protection system, while another layer forms the onshore pipeline overpressure protection system. The major layers of protection in the system to prevent the pressure rising above the MAOP are detailed in the table 2.2 in section 2.5.2. However, in order to provide context for some of the terms used in describing the layers of protection, section 2.5.1 has been added to provide an explanation of the subsea trips in the system and the associated nomenclature.
2.5.1 Subsea Tripping Nomenclature
There are a number of subsea (SS) trips in the Corrib production system to ensure operations remain within the design envelope of the facilities. Once these subsea trips are initiated an action will be performed to shut in production from the wells. There are various initiators (e.g. different pressure transmitter locations and settings) which can cause the trips to be activated. Also, the initiators can either be manual (i.e. intervention from operations) or automatic. Furthermore, the process and valves by which the trip shuts in production from the wells vary depending on the trip. As such, the following tables provide an explanation, both simplified and detailed, of each subsea trip.
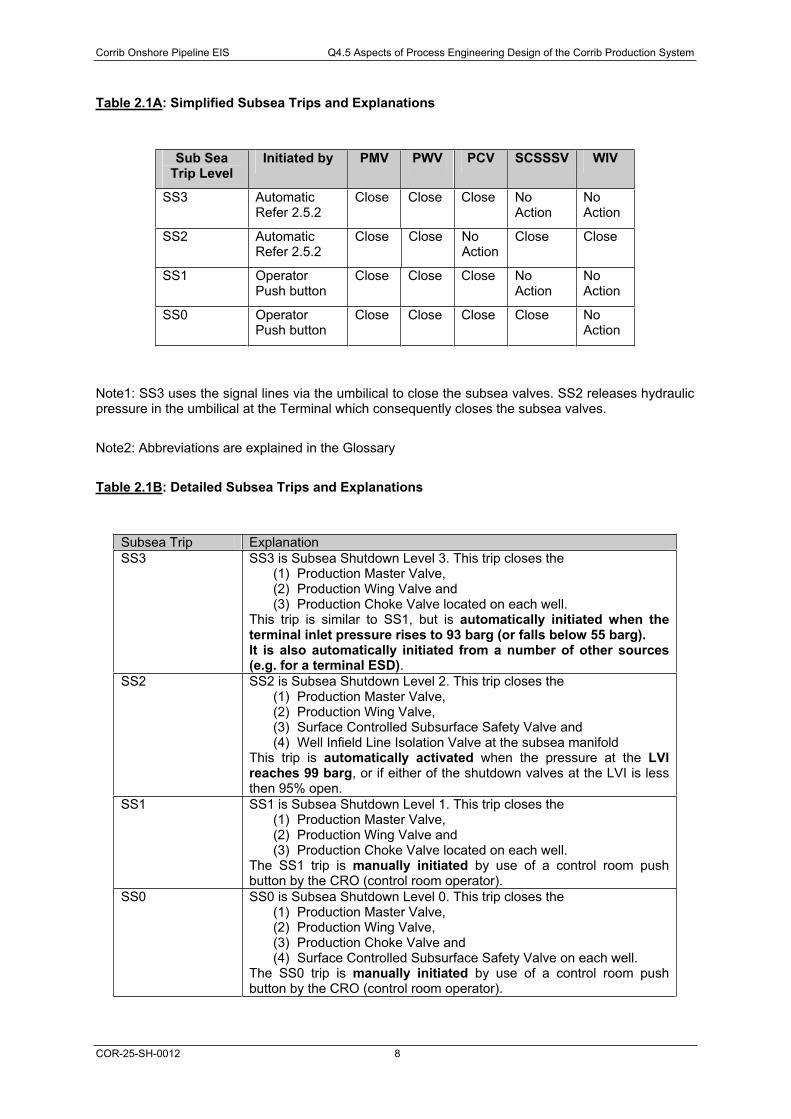
Corrib Onshore Pipeline EIS Q4.5 Aspects of Process Engineering Design of the Corrib Production System
COR-25-SH-0012 8
Table 2.1A: Simplified Subsea Trips and Explanations
Sub Sea Trip Level
Initiated by PMV PWV PCV SCSSSV WIV
SS3 Automatic Refer 2.5.2
Close Close Close No Action
NoAction
SS2 Automatic Refer 2.5.2
Close Close No Action
Close Close
SS1 Operator Push button
Close Close Close No Action
NoAction
SS0 Operator Push button
Close Close Close Close No Action
Note1: SS3 uses the signal lines via the umbilical to close the subsea valves. SS2 releases hydraulic pressure in the umbilical at the Terminal which consequently closes the subsea valves.
Note2: Abbreviations are explained in the Glossary
Table 2.1B: Detailed Subsea Trips and Explanations
Subsea Trip ExplanationSS3 SS3 is Subsea Shutdown Level 3. This trip closes the
(1) Production Master Valve, (2) Production Wing Valve and (3) Production Choke Valve located on each well.
This trip is similar to SS1, but is automatically initiated when the terminal inlet pressure rises to 93 barg (or falls below 55 barg). It is also automatically initiated from a number of other sources (e.g. for a terminal ESD).
SS2 SS2 is Subsea Shutdown Level 2. This trip closes the (1) Production Master Valve, (2) Production Wing Valve, (3) Surface Controlled Subsurface Safety Valve and (4) Well Infield Line Isolation Valve at the subsea manifold
This trip is automatically activated when the pressure at the LVIreaches 99 barg, or if either of the shutdown valves at the LVI is less then 95% open.
SS1 SS1 is Subsea Shutdown Level 1. This trip closes the (1) Production Master Valve, (2) Production Wing Valve and (3) Production Choke Valve located on each well.
The SS1 trip is manually initiated by use of a control room push button by the CRO (control room operator).
SS0 SS0 is Subsea Shutdown Level 0. This trip closes the (1) Production Master Valve, (2) Production Wing Valve, (3) Production Choke Valve and (4) Surface Controlled Subsurface Safety Valve on each well.
The SS0 trip is manually initiated by use of a control room push button by the CRO (control room operator).
Corrib Onshore Pipeline EIS Q4.5 Aspects of Process Engineering Design of the Corrib Production System
COR-25-SH-0012 9
2.5.2 Safeguarding Layers of Protection
The major layers of protection in the system to prevent the pressure rising above the MAOP are detailed in the table below.
The set points for the various trips have been selected based upon detailed simulation of pressure build-up curves in the pipeline using OLGA software. The curves illustrate the increase in pressure along the length of the pipeline with respect to time for various scenarios. This, combined with other data, allows for identification of set points for the various trips. OLGA is a dynamic pipeline simulator for engineering the flow of oil, water and gas in wells, pipelines and receiving facilities, and is recognised and widely used in the international oil and gas industry.
Table 2.2: The major layers of protection in the Corrib production system to prevent overpressurisation
Layer Applicable to pipelines
Trip/Protection SetPoint
Description
Layer 1 Offshore & Onshore
Normal operating procedures
n/a Normal pipeline operating procedures to control pressure within the selected operating pressure range of 80 to 85 barg in initial years, to minimise the risk of triggering the over-pressurisation protection system due to an upset in the Terminal.
Layer 2 Offshore & Onshore
Terminal inlet high pressure trip (SS3)
93barg terminalinlet
Initiates trip SS3: Closes well subsea tree wing, master and choke valves
Layer3a
Offshore & Onshore
LVI pressure trip 99barg, Closes LVI valves and initiates SS3 and SS2 trips. SS2 releases hydraulic pressure from HP and LP hydraulic lines to subsea valves and thus closes actuated subsea valves (surface controlled subsurface safety valve (SCSSSVs), master valves, wing valves, well infield line isolation valves)
Layer3b
Offshore & Onshore
Spurious closure of the LVI shutdown valves
EitherLVI valve less than 95%open
Initiate SS2 trip which releases hydraulic pressure from HP and LP hydraulic lines to subsea valves and thus closes actuated subsea valves (surface controlled subsurface safety valve (SCSSSVs), master valves, wing valves, well infield line isolation valves)
Layer 4 Offshore Subsea manifold pressure trip
145barg subsea manifoldpressure
Initiates an SS3 trip which closes well subsea tree wing, master and choke valves.
Layer 5 Offshore & Manual trip, SS0 or Manual Initiates an SS0 or SS1 trip.
Corrib Onshore Pipeline EIS Q4.5 Aspects of Process Engineering Design of the Corrib Production System
COR-25-SH-0012 10
Onshore SS1 operation SS1 Closes production master valves, choke valves and wing valves, SS0 closes the same as SS1 and closes SCSSSV
Layer 1 of protection is provided by normal operating procedures. This ensures that pressure changes under normal operating conditions allow time for operator intervention. The normal steady state operating pressure at the inlet to the Gas Terminal is between 80 to 85 barg at the rated throughput of 350 MMSCFD. Under these conditions, even in the case of upset at the Gas Terminal, there is ullage in the pipeline system for the operator to close in production from the wells without tripping the shutdown system at the LVI. The maximum operating pressure for the Terminal inlet will be limited to below the first Terminal inlet high pressure trip, which is set at 93 barg.
Layers 2 to 5 combine to form the overall shutdown sequence in the event of the pressure rising. These layers protect the system if excursions occur beyond the normal operating envelope. They do not take account of all barriers previously mentioned (e.g. proficiently trained operators that can intervene). These layers, with the exception of Layer 5, are designed to be automatic without any operator intervention.
Layer 2. This is the Terminal inlet trip designated SS3 with a set point of 93barg and is triggered to prevent a further increase in pipeline pressure. The signal from the Terminal pressure transmitters that detect rising pressure is processed via the Terminal Emergency Shutdown (ESD) system and closes the well master valve and wing valve for each well via the Master Control Station (MCS) located at the terminal. The choke valves will also be commanded closed on this trip. The wing and master valves are immediately commanded closed and do not wait for the production choke valves to close first. Due to the pressure gradient in the pipeline (subsea manifold pressure is approximately 117 – 122 barg) prior to the trip, the resulting settle out pressure at the LVI will increase towards 99 barg (the set point of the next trip). This will cause the subsequent layer, Layer 3a, to automatically trip whenever Layer 2 is initiated. Note: The automatic SS3 trip causes the same valves to close as the control room manual subsea shutdown, designated SS1.
The pressure transmitters used for the Terminal inlet trip are located inboard of the Terminal boundary ESD valve. Closure of this ESD valve isolates the pressure transmitters from the onshore pipeline and impairs this trip function. Thus, to cover spurious closure of the ESD valve, SS3 is tripped if the valve limit switches indicate that the valve is not fully open.
Layer 3a is the ultimate layer to prevent the pressure within both the onshore and offshore pipelines from rising above their MAOP. Pressure is measured at the LVI and the trip pressure is set at 99 barg. Note that this will automatically initiate if Layer 2, as described above, has tripped due to high pressure at the Gas Terminal inlet. This initiates closure of the LVI shutdown valves (2 in series) at the landfall location; this layer also initiates a subsea shutdown via the SS3 and SS2 trips. The LVI is equipped with two in-line ESD valves (i.e. the ‘LVI shutdown valves’), two out of three voting (2oo3) pressure transmitters and a high reliability logic solver; this configuration achieves a very high reliability. A facility to remotely close the LVI valves from the Terminal control room for inventory isolation purposes with high reliability has been provided. LVI pressure transmitter readings, LVI trip status and LVI valve open/closed status are continuously transmitted back to the Terminal and displayed in the control room.
The SS2 trip will initiate four electrically latched solenoid valves at the onshore Terminal HPU to bleed both the LP and HP hydraulic fluids from both ‘A’ and ‘B’ hydraulic rails that provide hydraulic pressure to the subsea valves. The solenoids will act on command signals (hard wired) directly from the Terminal ESD panel which will get its signal from the LVI solid state logic solver (LVPLS). The time taken to release hydraulic fluid pressure in a 92km subsea tie-back is significant. The control system hydraulic analysis indicates that the pressure in both the High Pressure (HP) and Low
Corrib Onshore Pipeline EIS Q4.5 Aspects of Process Engineering Design of the Corrib Production System
COR-25-SH-0012 11
Pressure (LP) supplies reduces to either the valve closing pressure or the solenoid drop out pressure within approximately two hours. This time to release hydraulic fluid pressure has been taken into account in the design and setting of the offshore pipeline MAOP.
Layer 3b is also provided to protect the offshore pipeline from exceeding MAOP in the event of spurious closure of either of the LVI valves. If either valve is less than 95% open this initiates both SS3 and SS2 trips as per paragraph 2.5.1.
Layer 4 is the sub-sea pipeline manifold High Pressure trip. Its main purpose is to limit upstream line packing in the offshore pipeline and hence limit the differential pressure over the LVI following an LVI trip. The trip will be taken from the subsea manifold pressure transducers PT-001 & PT-002 (i.e. designed with a redundant spare) and will activate when the pressure rises to 145 barg. The output of this trip, processed via the Master Control Station (MCS), shall close all wing and master valves, in addition to all production choke valves.
Layer 5 provides a pushbutton for the Control Room Operator (CRO) to command closed all subsea actuated valves via the MCS. This includes closing all SCSSSVs.
The above layers of protection form the instrumented protection to maintain the offshore and onshore pipeline within the respective MAOP. There is also inherent mechanical protection in the design of the pipelines to prevent loss of containment. This is the pipeline wall thickness and the hydrostatic testing of the pipelines. For the onshore pipeline the wall thickness is 27.1mm with a design pressure of 144 barg together with the hydrostatic test pressure of 504 barg. Similarly at the offshore pipeline landfall the wall thickness is also 27.1mm with a design pressure of 345 barg and a hydrostatic test pressure of 380 barg.
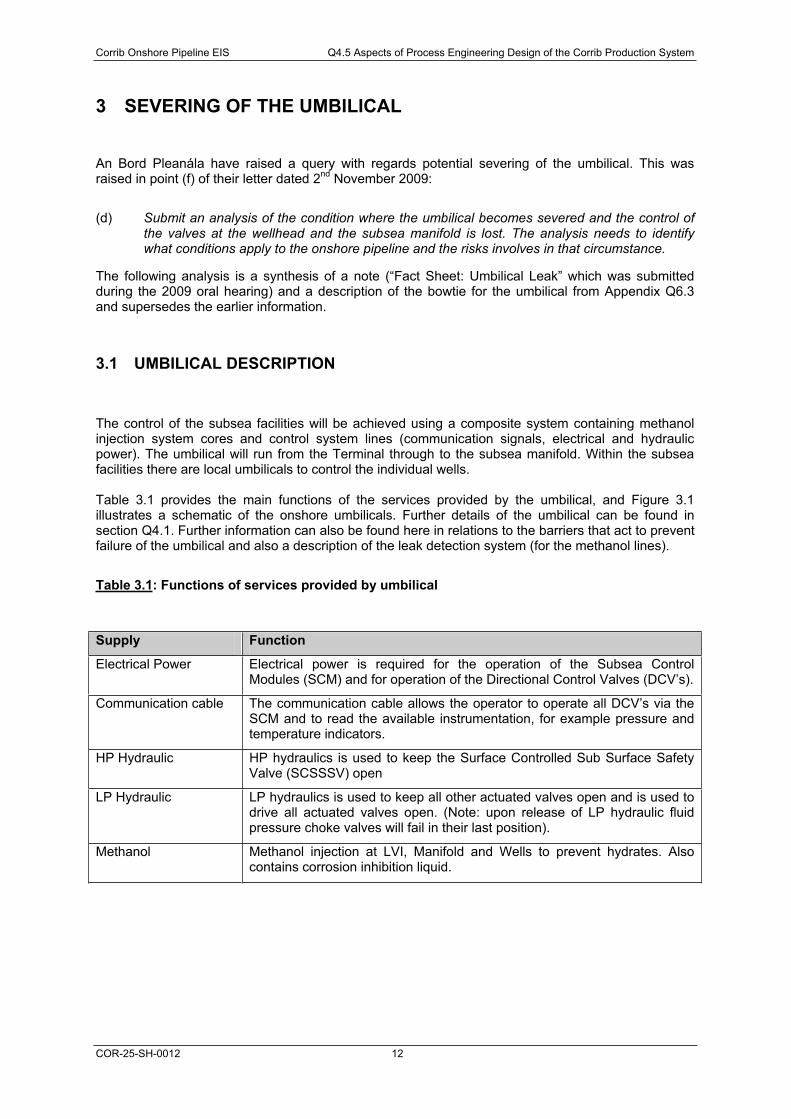
Corrib Onshore Pipeline EIS Q4.5 Aspects of Process Engineering Design of the Corrib Production System
COR-25-SH-0012 12
3 SEVERING OF THE UMBILICAL
An Bord Pleanála have raised a query with regards potential severing of the umbilical. This was raised in point (f) of their letter dated 2nd November 2009:
(d) Submit an analysis of the condition where the umbilical becomes severed and the control of the valves at the wellhead and the subsea manifold is lost. The analysis needs to identify what conditions apply to the onshore pipeline and the risks involves in that circumstance.
The following analysis is a synthesis of a note (“Fact Sheet: Umbilical Leak” which was submitted during the 2009 oral hearing) and a description of the bowtie for the umbilical from Appendix Q6.3 and supersedes the earlier information.
3.1 UMBILICAL DESCRIPTION
The control of the subsea facilities will be achieved using a composite system containing methanol injection system cores and control system lines (communication signals, electrical and hydraulic power). The umbilical will run from the Terminal through to the subsea manifold. Within the subsea facilities there are local umbilicals to control the individual wells.
Table 3.1 provides the main functions of the services provided by the umbilical, and Figure 3.1 illustrates a schematic of the onshore umbilicals. Further details of the umbilical can be found in section Q4.1. Further information can also be found here in relations to the barriers that act to prevent failure of the umbilical and also a description of the leak detection system (for the methanol lines).
Table 3.1: Functions of services provided by umbilical
Supply Function
Electrical Power Electrical power is required for the operation of the Subsea Control Modules (SCM) and for operation of the Directional Control Valves (DCV’s).
Communication cable The communication cable allows the operator to operate all DCV’s via the SCM and to read the available instrumentation, for example pressure and temperature indicators.
HP Hydraulic HP hydraulics is used to keep the Surface Controlled Sub Surface Safety Valve (SCSSSV) open
LP Hydraulic LP hydraulics is used to keep all other actuated valves open and is used to drive all actuated valves open. (Note: upon release of LP hydraulic fluid pressure choke valves will fail in their last position).
Methanol Methanol injection at LVI, Manifold and Wells to prevent hydrates. Also contains corrosion inhibition liquid.
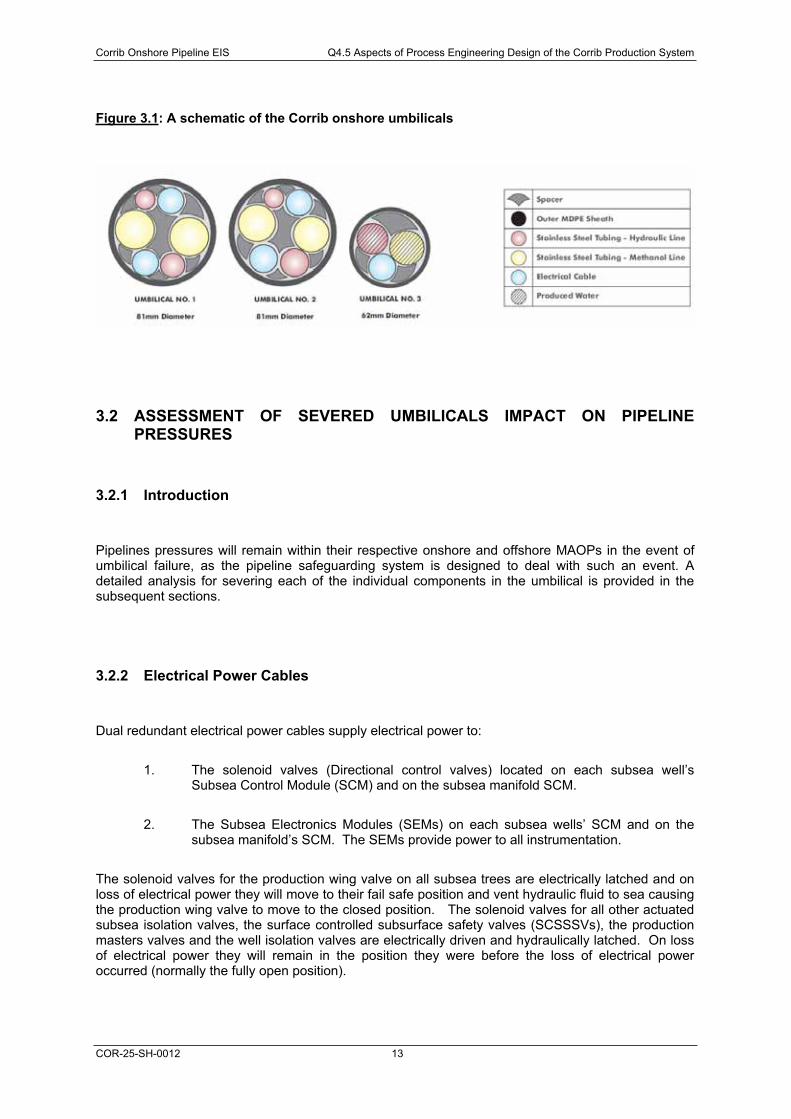
Corrib Onshore Pipeline EIS Q4.5 Aspects of Process Engineering Design of the Corrib Production System
COR-25-SH-0012 13
Figure 3.1: A schematic of the Corrib onshore umbilicals
3.2 ASSESSMENT OF SEVERED UMBILICALS IMPACT ON PIPELINE PRESSURES
3.2.1 Introduction
Pipelines pressures will remain within their respective onshore and offshore MAOPs in the event of umbilical failure, as the pipeline safeguarding system is designed to deal with such an event. A detailed analysis for severing each of the individual components in the umbilical is provided in the subsequent sections.
3.2.2 Electrical Power Cables
Dual redundant electrical power cables supply electrical power to:
1. The solenoid valves (Directional control valves) located on each subsea well’s Subsea Control Module (SCM) and on the subsea manifold SCM.
2. The Subsea Electronics Modules (SEMs) on each subsea wells’ SCM and on the subsea manifold’s SCM. The SEMs provide power to all instrumentation.
The solenoid valves for the production wing valve on all subsea trees are electrically latched and on loss of electrical power they will move to their fail safe position and vent hydraulic fluid to sea causing the production wing valve to move to the closed position. The solenoid valves for all other actuated subsea isolation valves, the surface controlled subsurface safety valves (SCSSSVs), the production masters valves and the well isolation valves are electrically driven and hydraulically latched. On loss of electrical power they will remain in the position they were before the loss of electrical power occurred (normally the fully open position).
Corrib Onshore Pipeline EIS Q4.5 Aspects of Process Engineering Design of the Corrib Production System
COR-25-SH-0012 14
Loss of electrical power to the SEMs and instrumentation will prevent the operator from monitoring the conditions within the subsea wells, well subsea trees and pipelines. The operators will not be able to control any of the actuated subsea valves, other than by releasing the hydraulic fluid pressure at the onshore Terminal and thereby closing all actuated subsea isolation valves. Line insulation monitors in the Electrical Power Unit (EPU) will initiate alarms within the control room, alerting the operators of the loss of electrical power.
Should the pressure in the pipeline rise, the pressure transmitters at the LVI station will detect the rise in pressure and close the LVI isolation valves, preventing the onshore pipeline from rising above its MAOP. Simultaneously, these same pressure transmitters will also send a signal to the Terminal to release the subsea hydraulic fluid pressure, thus closing all actuated subsea isolation valves and preventing the pressure within the offshore pipeline from rising above its MAOP.
As there are dual redundant electrical cables, both cables will need to be severed to lose electrical power to the subsea manifold and wells.
In the event of severance of the electrical power cables, production will be stopped and the pressure in the pipeline will not exceed MAOP.
3.2.3 Communication Cables
Dual redundant communication cables send data between the MCS on the onshore Terminal and the SEMs on the subsea well subsea trees and the subsea manifold. Severing the cables will prevent the operator from monitoring the conditions within the subsea wells, well subsea trees and pipelines and prevent the operators from controlling any of the actuated subsea valves, other than by releasing the hydraulic fluid pressure from within the onshore Terminal and closing all actuated subsea isolation valves. Alarms on the MCS will alert the operators of the loss of data communication.
On loss of signal all subsea isolation valves and the subsea choke valves will remain in the position they were in before loss of communication. Should the pressure in the pipeline rise, the pressure transmitters at the LVI station will detect the rise in pressure and close the LVI isolation valves, preventing the onshore pipeline from rising above its MAOP. Simultaneously, these same pressure transmitters will also send a signal to the Terminal to release the subsea hydraulic fluid pressure, thus closing all actuated subsea isolation valves and preventing the pressure within the offshore pipeline from rising above its MAOP.
The integrity of the communication system between the LVI and the Gas Terminal is monitored, and should the communications be severed, the system will detect this and initiate releasing of the subsea hydraulic fluid pressure, closing all subsea actuated valves.
As there are dual redundant communication cables, both cables will need to be severed to lose communications to the subsea manifold and wells.
In the event of severance of the communications cables, production will be stopped and the pressure in the pipeline will not exceed MAOP
Corrib Onshore Pipeline EIS Q4.5 Aspects of Process Engineering Design of the Corrib Production System
COR-25-SH-0012 15
3.2.4 HP Hydraulic Fluid
There are two hydraulic cores (A and B) for the High Pressure (HP) hydraulic supply. Hydraulic fluid is used to energise subsea actuated valves and keep then in the open position.
The HP Hydraulic Fluid supply is used to keep the SCSSSV on each well open. In the event that the HP Hydraulic supply lines are severed the HP pressure will decrease and the relevant SCSSSV’s will close which will stop flow into the pipeline and therefore will prevent the pipeline pressure from rising.
In the event of severance of the HP hydraulic fluid line production will be stopped and the pressure in the pipeline will not exceed MAOP.
3.2.5 LP Hydraulic Fluid
On loss of hydraulic fluid pressure all actuated valves supplied from the hydraulic fluid core that is severed will move to the closed position, which will stop further inflow and therefore will prevent the pipeline pressure from rising.
There are two hydraulic cores (A and B) for the Low Pressure (LP) hydraulic supply. Hydraulic fluid is used to energise subsea actuated valves and keep them in the open position.
The LP supply is used for all actuated valves apart from the SCSSSV. In the event that the LP Hydraulic supply lines are severed the LP pressure will decrease and the relevant master valves and wing valves will close. The production chokes will be left in the as-is position.
The Subsea Control Modules (SCMs) at the subsea manifold and the SCMs at each of the subsea well subsea trees can be supplied from either the A or the B supply. A typical arrangement will be for some SCMs to be supplied with hydraulic fluid from the A supply and the remaining from the B supply.
In the event of severance of the LP hydraulic fluid line production will be stopped and the pressure in the pipeline will not exceed MAOP.
3.2.6 Methanol/Corrosion Inhibitor
Methanol is injected into the pipeline as a hydrate inhibitor, along with a corrosion inhibitor to prevent corrosion. Severing of these cores will not be a cause for the pressure in the pipelines to rise above their MAOPs.
The pressure in the pipeline will not exceed MAOP in the event of severance of the methanol cores.
Corrib Onshore Pipeline EIS Q4.5 Aspects of Process Engineering Design of the Corrib Production System
COR-25-SH-0012 16
3.2.7 Conclusions
The umbilicals provide a number of services to the subsea facilities. Each of these services was analysed to determine the potential impact on the control of subsea facilities.
If the offshore umbilical or all of the onshore umbilicals are severed, the field will shut down on loss of power and hydraulics. If only one onshore umbilical is severed, a number of the wells may automatically shutdown due to loss of hydraulics. The remaining wells will continue to produce at steady state within the operating envelope. Therefore it can be concluded that whether some or all of the umbilicals are severed, the pressures within the onshore and offshore pipelines will remain within their MAOPs.
3.3 HEALTH, SAFETY AND PIPELINE INTEGRITY CONSEQUENCES OF ONSHORE UMBILICAL FAILURE
See Appendix Q6.4 Quantitative Risk Assessment for further details in relation to consequences associated with the release of methanol from the umbilical as a result of onshore umbilical failure. This section also concludes that the presence of the umbilical adjacent to the onshore pipeline does not present a credible risk of pipeline failure due to umbilical loss of containment.
3.4 SPILL VOLUMES AND POTENTIAL FOR ENVIRONMENTAL IMPACT
The failure of an umbilical core is an unlikely event. However, in the extremely unlikely event that all three umbilicals were ruptured at the same time, a total liquid release of 18.2m3 is estimated. This will consist of approximately 3,000 litres of treated produced water, approximately 8,800 litres of methanol (including very small volumes of corrosion/scale inhibitor) and 6,400 litres of water based hydraulic fluid. These quantities are based on a very conservative response time of 1 hr to detect the leak in the control room and isolate the umbilical. In most cases of a major failure alarm signals in the control room would give rise to prompt operator intervention. Leak detection would be followed by a visual survey along the onshore pipeline route.
Once the spill/leakage has been located, mitigation measures will be activated. This will include applying measures to contain and clean up any liquids which may have escaped into the environment.
Depending on the location of the spillage, liquids could enter soils, surface water or groundwater at that location. The potential impact of this is outlined in the following:
1. The treated produced water is effectively clean water and would not pose an environmental threat to water or soils in the volumes that might be released.
Corrib Onshore Pipeline EIS Q4.5 Aspects of Process Engineering Design of the Corrib Production System
COR-25-SH-0012 17
2. The hydraulic fluid is a water/glycol based fluid known as Castrol Transaqua HT2. There is potential for localised temporary impact to soils and surface water/ground water. However, this fluid is readily biodegradable and the product is not expected to bioaccumulate through food chains in the environment. Its eco-toxicity is not classified as dangerous.
3. The potential impact of a methanol spill is as follows: Methanol degrades readily in the environment under both aerobic and anaerobic conditions, in soils (and sediments) and in the aquatic (freshwater and sea water) environment. Methanol degrades totally into carbon dioxide and water. Methanol is of low toxicity to aquatic and terrestrial organisms and is not bioaccumulated, but in the event of a large spill there may be localised effects. A spill in a water body will result in immediate dilution, which increases the rate of biodegradation and reduces its toxicity.
The water catchments of the route primarily discharge to the marine environment, either directly or via surface water bodies such as drains, streams or rivers. A spill of methanol to the marine environment has limited potential impact – methanol is classified by OSPAR to be a PLONOR substance, i.e. a substance which Poses Little or No Risk to the marine environment.
If such a spillage were to occur in an area which could present a risk of contamination of a private groundwater well, then measures would be put in place to monitor this well and provide an alternative water source if necessary until the contamination dissipates.
The corrosion/scale inhibitor present in the methanol will exist in such low concentrations that it is not expected to result in a significant impact on the receiving environment.

Corrib Onshore Pipeline EIS Q4.5 Aspects of Process Engineering Design of the Corrib Production System
COR-25-SH-0012 18
4 POTENTIAL AND EFFECT OF PASSING (‘LEAKING’) VALVES IN THE CORRIB PIPELINE
4.1 SUMMARY
An Bord Pleanála have raised a query with regard to the potential for valve leakage, subsequent to a shutdown, leading to an increase in pipeline pressure. This was raised in point (g) of their letter dated 2nd November 2009: “An examination of the potential for pressure in the offshore pipeline to increase to wellhead pressure levels in the event that all wellhead valves had to be shut in over a prolonged period and in that period incremental leakage past the valves occurred”.
In order to assess the potential effect of valve leakage subsequent to a shutdown, it is important to determine the conditions resulting from the shutdown (pressures, temperatures and which valves have closed). Therefore, two scenarios have been examined as these represent the critical shutdowns:
(1) A planned shutdown for maintenance,
(2) An unplanned shutdown due to a high pressure trip
After each of these shutdowns, the pressure in the offshore pipeline will ‘settle out’ as the conditions in the pipeline reach equilibrium. The settle out pressures in the offshore pipeline and the associated margin to the offshore pipeline MAOP for the two scenarios can be seen in Figure 4.1.
Figure 4.1: Pressure margin available for ‘valve leakage’ in the offshore pipeline for various scenarios.
The subsea valves have been designed to a high specification to ensure that any leakage is minimal. There are also a number of valves in series to provide isolation for each well, therefore even if one valve does leak, there is another valve isolating each well. The subsea valves are periodically tested
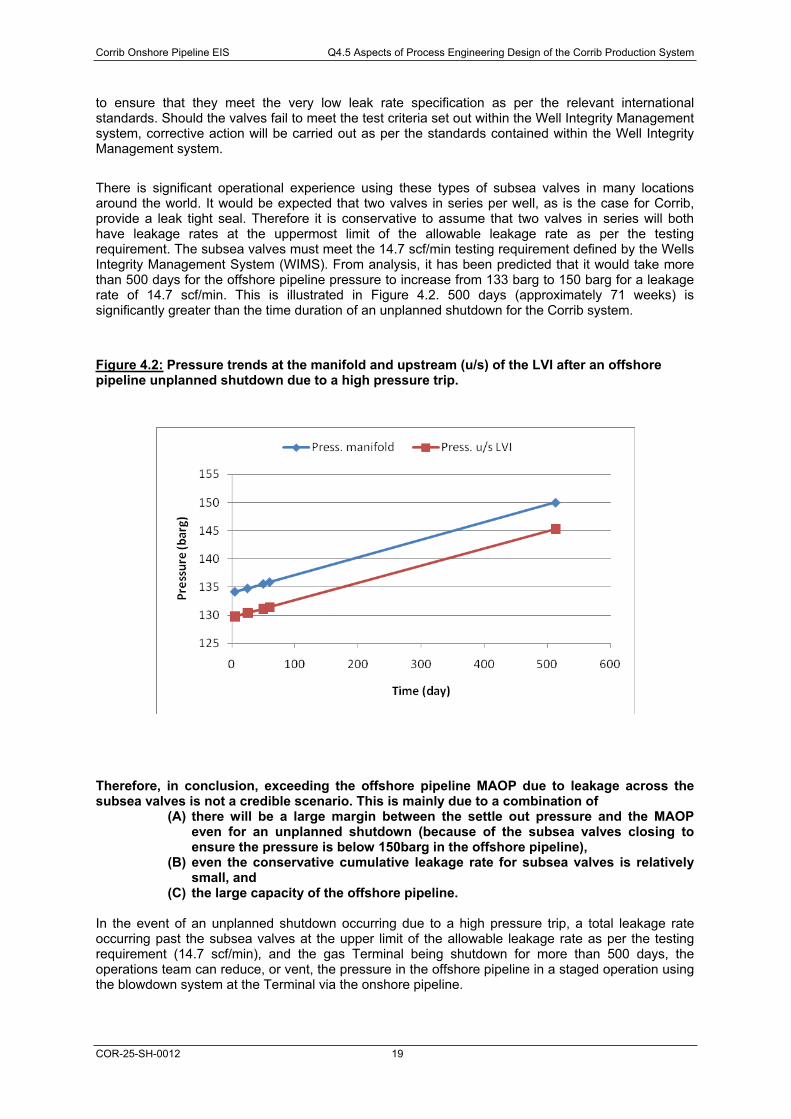
Corrib Onshore Pipeline EIS Q4.5 Aspects of Process Engineering Design of the Corrib Production System
COR-25-SH-0012 19
to ensure that they meet the very low leak rate specification as per the relevant international standards. Should the valves fail to meet the test criteria set out within the Well Integrity Management system, corrective action will be carried out as per the standards contained within the Well Integrity Management system.
There is significant operational experience using these types of subsea valves in many locations around the world. It would be expected that two valves in series per well, as is the case for Corrib, provide a leak tight seal. Therefore it is conservative to assume that two valves in series will both have leakage rates at the uppermost limit of the allowable leakage rate as per the testing requirement. The subsea valves must meet the 14.7 scf/min testing requirement defined by the Wells Integrity Management System (WIMS). From analysis, it has been predicted that it would take more than 500 days for the offshore pipeline pressure to increase from 133 barg to 150 barg for a leakage rate of 14.7 scf/min. This is illustrated in Figure 4.2. 500 days (approximately 71 weeks) is significantly greater than the time duration of an unplanned shutdown for the Corrib system.
Figure 4.2: Pressure trends at the manifold and upstream (u/s) of the LVI after an offshore pipeline unplanned shutdown due to a high pressure trip.
Therefore, in conclusion, exceeding the offshore pipeline MAOP due to leakage across the subsea valves is not a credible scenario. This is mainly due to a combination of
(A) there will be a large margin between the settle out pressure and the MAOP even for an unplanned shutdown (because of the subsea valves closing to ensure the pressure is below 150barg in the offshore pipeline),
(B) even the conservative cumulative leakage rate for subsea valves is relatively small, and
(C) the large capacity of the offshore pipeline.
In the event of an unplanned shutdown occurring due to a high pressure trip, a total leakage rate occurring past the subsea valves at the upper limit of the allowable leakage rate as per the testing requirement (14.7 scf/min), and the gas Terminal being shutdown for more than 500 days, the operations team can reduce, or vent, the pressure in the offshore pipeline in a staged operation using the blowdown system at the Terminal via the onshore pipeline.
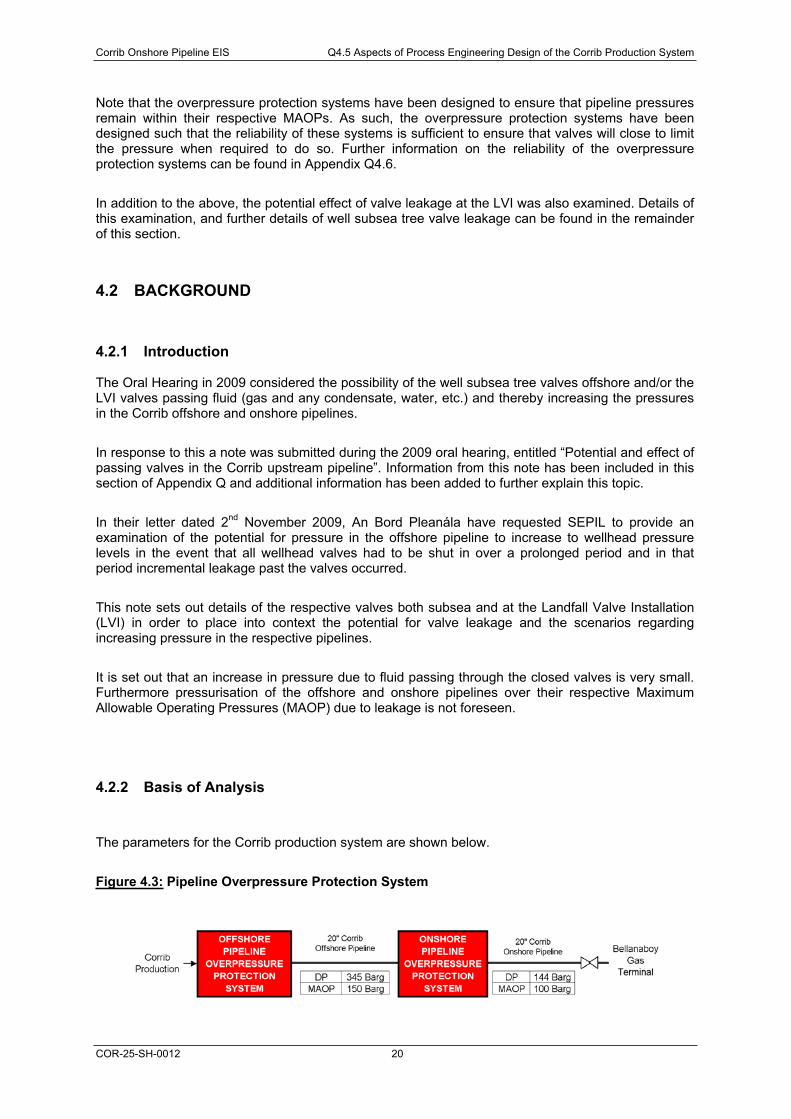
Corrib Onshore Pipeline EIS Q4.5 Aspects of Process Engineering Design of the Corrib Production System
COR-25-SH-0012 20
Note that the overpressure protection systems have been designed to ensure that pipeline pressures remain within their respective MAOPs. As such, the overpressure protection systems have been designed such that the reliability of these systems is sufficient to ensure that valves will close to limit the pressure when required to do so. Further information on the reliability of the overpressure protection systems can be found in Appendix Q4.6.
In addition to the above, the potential effect of valve leakage at the LVI was also examined. Details of this examination, and further details of well subsea tree valve leakage can be found in the remainder of this section.
4.2 BACKGROUND
4.2.1 Introduction
The Oral Hearing in 2009 considered the possibility of the well subsea tree valves offshore and/or the LVI valves passing fluid (gas and any condensate, water, etc.) and thereby increasing the pressures in the Corrib offshore and onshore pipelines.
In response to this a note was submitted during the 2009 oral hearing, entitled “Potential and effect of passing valves in the Corrib upstream pipeline”. Information from this note has been included in this section of Appendix Q and additional information has been added to further explain this topic.
In their letter dated 2nd November 2009, An Bord Pleanála have requested SEPIL to provide an examination of the potential for pressure in the offshore pipeline to increase to wellhead pressure levels in the event that all wellhead valves had to be shut in over a prolonged period and in that period incremental leakage past the valves occurred.
This note sets out details of the respective valves both subsea and at the Landfall Valve Installation (LVI) in order to place into context the potential for valve leakage and the scenarios regarding increasing pressure in the respective pipelines.
It is set out that an increase in pressure due to fluid passing through the closed valves is very small. Furthermore pressurisation of the offshore and onshore pipelines over their respective Maximum Allowable Operating Pressures (MAOP) due to leakage is not foreseen.
4.2.2 Basis of Analysis
The parameters for the Corrib production system are shown below.
Figure 4.3: Pipeline Overpressure Protection System
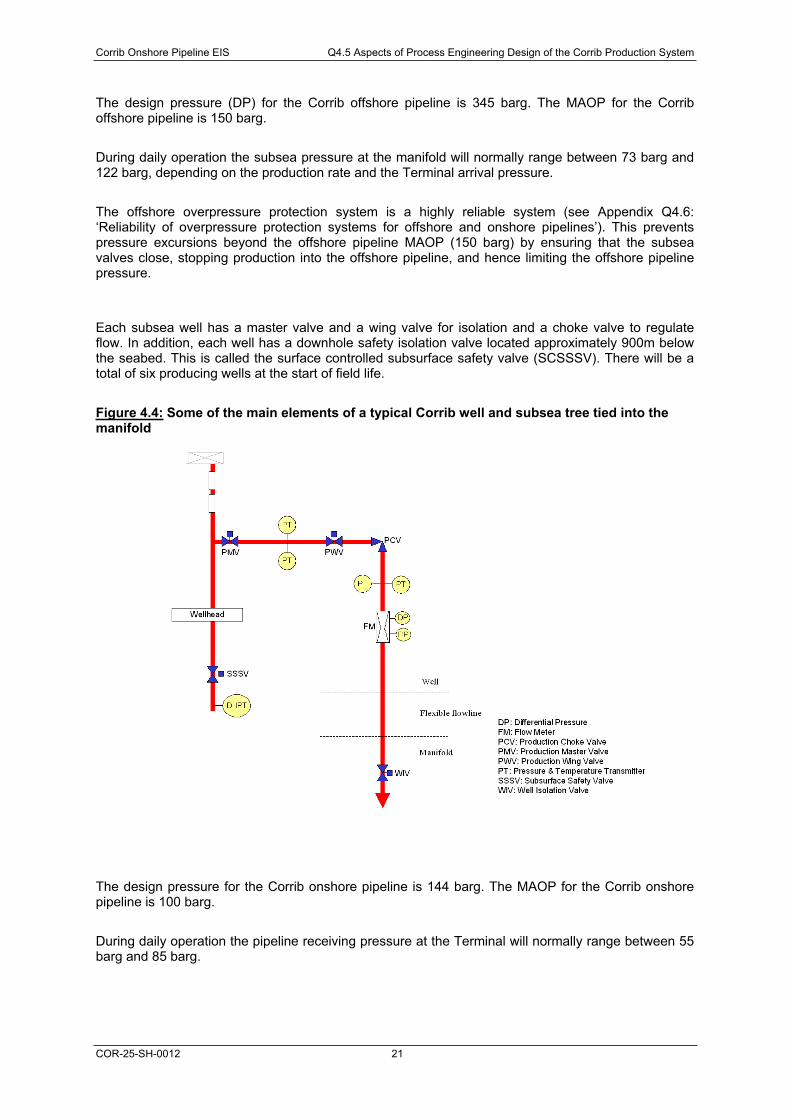
Corrib Onshore Pipeline EIS Q4.5 Aspects of Process Engineering Design of the Corrib Production System
COR-25-SH-0012 21
The design pressure (DP) for the Corrib offshore pipeline is 345 barg. The MAOP for the Corrib offshore pipeline is 150 barg.
During daily operation the subsea pressure at the manifold will normally range between 73 barg and 122 barg, depending on the production rate and the Terminal arrival pressure.
The offshore overpressure protection system is a highly reliable system (see Appendix Q4.6: ‘Reliability of overpressure protection systems for offshore and onshore pipelines’). This prevents pressure excursions beyond the offshore pipeline MAOP (150 barg) by ensuring that the subsea valves close, stopping production into the offshore pipeline, and hence limiting the offshore pipeline pressure.
Each subsea well has a master valve and a wing valve for isolation and a choke valve to regulate flow. In addition, each well has a downhole safety isolation valve located approximately 900m below the seabed. This is called the surface controlled subsurface safety valve (SCSSSV). There will be a total of six producing wells at the start of field life.
Figure 4.4: Some of the main elements of a typical Corrib well and subsea tree tied into the manifold
The design pressure for the Corrib onshore pipeline is 144 barg. The MAOP for the Corrib onshore pipeline is 100 barg.
During daily operation the pipeline receiving pressure at the Terminal will normally range between 55 barg and 85 barg.
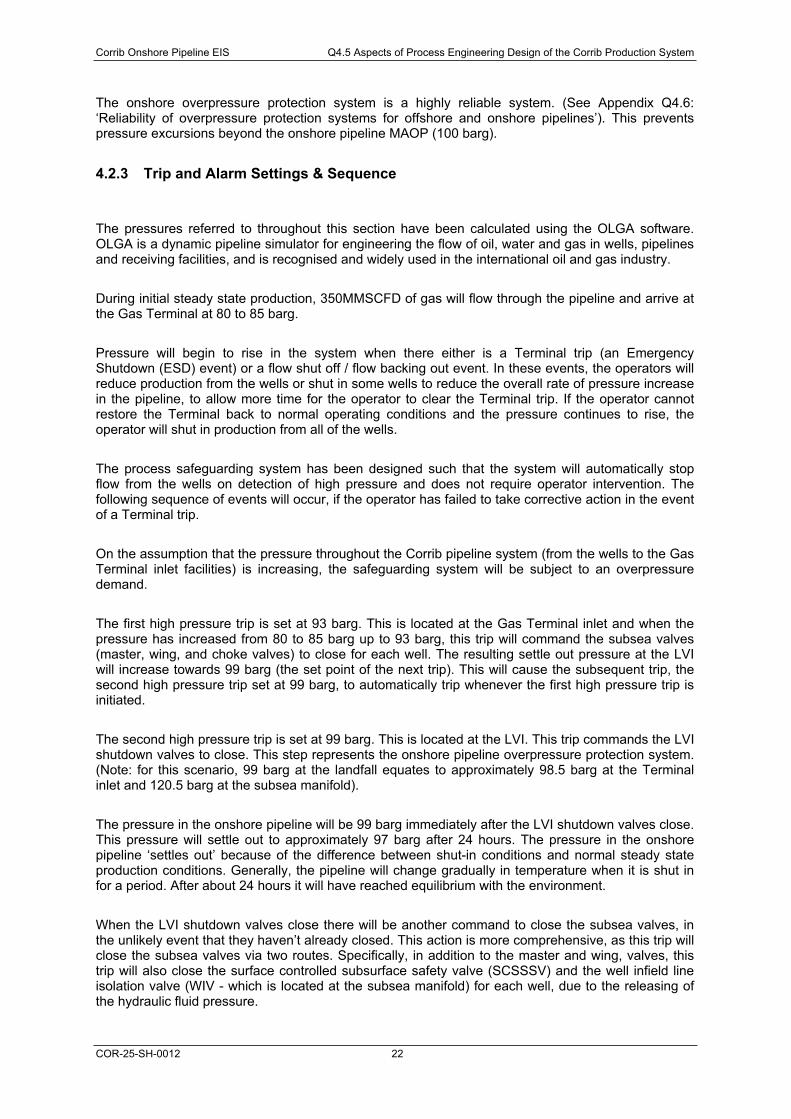
Corrib Onshore Pipeline EIS Q4.5 Aspects of Process Engineering Design of the Corrib Production System
COR-25-SH-0012 22
The onshore overpressure protection system is a highly reliable system. (See Appendix Q4.6: ‘Reliability of overpressure protection systems for offshore and onshore pipelines’). This prevents pressure excursions beyond the onshore pipeline MAOP (100 barg).
4.2.3 Trip and Alarm Settings & Sequence
The pressures referred to throughout this section have been calculated using the OLGA software. OLGA is a dynamic pipeline simulator for engineering the flow of oil, water and gas in wells, pipelines and receiving facilities, and is recognised and widely used in the international oil and gas industry.
During initial steady state production, 350MMSCFD of gas will flow through the pipeline and arrive at the Gas Terminal at 80 to 85 barg.
Pressure will begin to rise in the system when there either is a Terminal trip (an Emergency Shutdown (ESD) event) or a flow shut off / flow backing out event. In these events, the operators will reduce production from the wells or shut in some wells to reduce the overall rate of pressure increase in the pipeline, to allow more time for the operator to clear the Terminal trip. If the operator cannot restore the Terminal back to normal operating conditions and the pressure continues to rise, the operator will shut in production from all of the wells.
The process safeguarding system has been designed such that the system will automatically stop flow from the wells on detection of high pressure and does not require operator intervention. The following sequence of events will occur, if the operator has failed to take corrective action in the event of a Terminal trip.
On the assumption that the pressure throughout the Corrib pipeline system (from the wells to the Gas Terminal inlet facilities) is increasing, the safeguarding system will be subject to an overpressure demand.
The first high pressure trip is set at 93 barg. This is located at the Gas Terminal inlet and when the pressure has increased from 80 to 85 barg up to 93 barg, this trip will command the subsea valves (master, wing, and choke valves) to close for each well. The resulting settle out pressure at the LVI will increase towards 99 barg (the set point of the next trip). This will cause the subsequent trip, the second high pressure trip set at 99 barg, to automatically trip whenever the first high pressure trip is initiated.
The second high pressure trip is set at 99 barg. This is located at the LVI. This trip commands the LVI shutdown valves to close. This step represents the onshore pipeline overpressure protection system. (Note: for this scenario, 99 barg at the landfall equates to approximately 98.5 barg at the Terminal inlet and 120.5 barg at the subsea manifold).
The pressure in the onshore pipeline will be 99 barg immediately after the LVI shutdown valves close. This pressure will settle out to approximately 97 barg after 24 hours. The pressure in the onshore pipeline ‘settles out’ because of the difference between shut-in conditions and normal steady state production conditions. Generally, the pipeline will change gradually in temperature when it is shut in for a period. After about 24 hours it will have reached equilibrium with the environment.
When the LVI shutdown valves close there will be another command to close the subsea valves, in the unlikely event that they haven’t already closed. This action is more comprehensive, as this trip will close the subsea valves via two routes. Specifically, in addition to the master and wing, valves, this trip will also close the surface controlled subsurface safety valve (SCSSSV) and the well infield line isolation valve (WIV - which is located at the subsea manifold) for each well, due to the releasing of the hydraulic fluid pressure.
Corrib Onshore Pipeline EIS Q4.5 Aspects of Process Engineering Design of the Corrib Production System
COR-25-SH-0012 23
The offshore pipeline overpressure protection system is composed of tripping sequence as detailed in the preceding four paragraphs. The design of the system (the logic, automated actions, redundancy in the system, reliability of the equipment involved, etc.) provides a high reliability that offshore pipeline pressure will be prevented from increasing further due to the closure of subsea valves.
High reliability is provided by the offshore pipeline overpressure protection system due to the ability to close the subsea valves via two routes and redundancy within the system. This reduces the potential for common cause failure. Both routes will be automatically activated once the overpressure protection system is initiated.
One of the routes (or ‘systems’) is fast acting and will close the subsea valves almost instantly, while the other route is slower acting. In order to be conservative, it has been assumed that only the second slower acting system functions. Even in this circumstance, with the increased time to close the valves, the pressure in the offshore line will be limited below 150 barg.
Based on the conservative time taken to close the subsea valves (release of hydraulic fluid pressure), the offshore pipeline pressure will be 133 barg immediately after the subsea valves have fully closed. This pressure will settle out to approximately 129 barg after 24 hours. The pressure ‘settles out’ because of the difference between shut-in conditions and normal steady state production conditions.
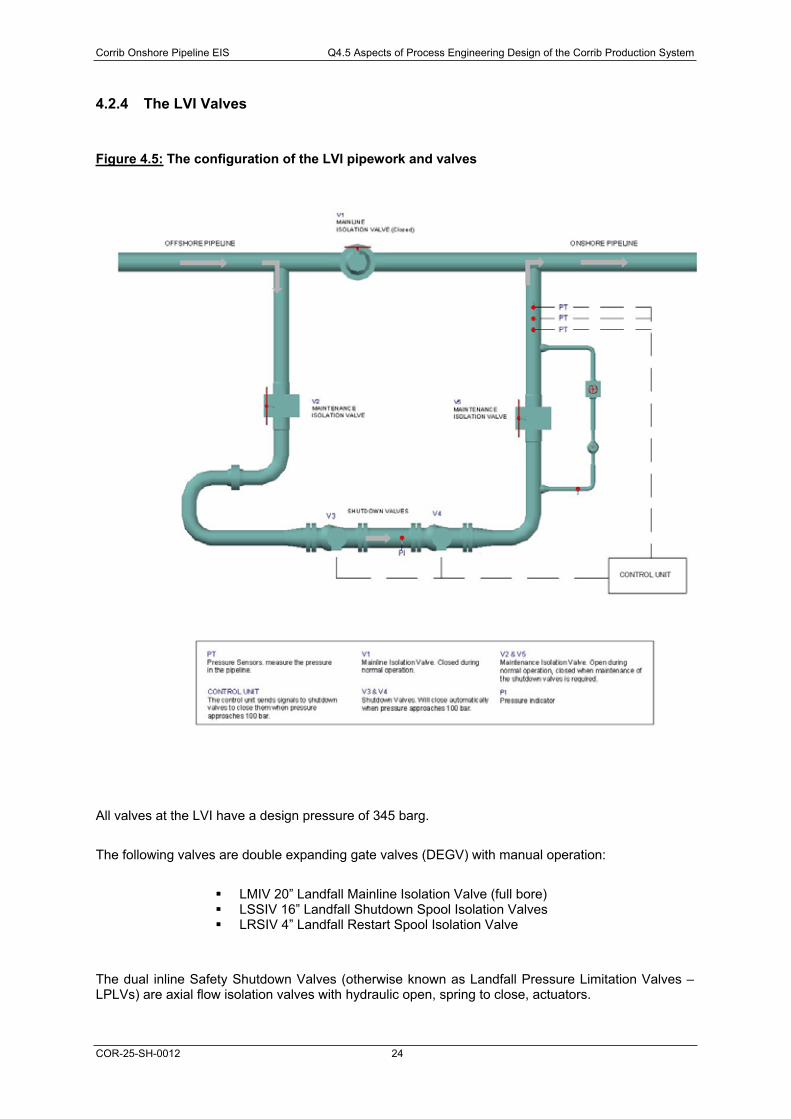
Corrib Onshore Pipeline EIS Q4.5 Aspects of Process Engineering Design of the Corrib Production System
COR-25-SH-0012 24
4.2.4 The LVI Valves
Figure 4.5: The configuration of the LVI pipework and valves
All valves at the LVI have a design pressure of 345 barg.
The following valves are double expanding gate valves (DEGV) with manual operation:
LMIV 20” Landfall Mainline Isolation Valve (full bore) LSSIV 16” Landfall Shutdown Spool Isolation Valves LRSIV 4” Landfall Restart Spool Isolation Valve
The dual inline Safety Shutdown Valves (otherwise known as Landfall Pressure Limitation Valves – LPLVs) are axial flow isolation valves with hydraulic open, spring to close, actuators.
Corrib Onshore Pipeline EIS Q4.5 Aspects of Process Engineering Design of the Corrib Production System
COR-25-SH-0012 25
4.2.4.1 Double Expanding Gate Valves
The DEGV’s at the LVI are designed to operate with a 345 bar differential pressure across the valve. The valves have a zero leak rate (ISO 5028:2008 Rate A).
The sealing components of the double expanding gate valves are coated in an extremely hard tungsten carbide layer which is fused into the surfaces by a specialised process. This coating protects the tight shut faces of the gate and seats from deterioration from erosion, friction and debris.
This type of valve was selected for Corrib based on the good operating performance of this valve and its ability to provide tight shut off over a long life. Unlike the more common soft seated valves, hard coated metal seated valves generally do not have a deteriorating sealing performance in service, and in the case of the DEGV the sealing parts are not in contact during opening and closing – they do not slide across each other, they are separated - thus avoiding wear on the sealing faces. Additionally, the DEGV has two seal rings in series, both of which independently provide tight shut off at full gas pressure in both directions, as has been tested on each Corrib valve at the manufacturers.
This type of valve from the same manufacturer and with the same materials specification is in service with Shell at 845 bar in very corrosive and abrasive duty (Shearwater flowline isolation and other locations) and was tested for 600 open-close-open cycles in dry gas and demonstrated zero seat leakage at 845 barg gas differential pressure at the end of the tests.
4.2.4.2 Axial Flow Valves
The closure mechanism of an axial flow valve (open/closed type) is a balanced movement which seals against both metal seats and soft seats. The design of this valve means the sealing element is out of the flow path so that damage during operation is extremely unlikely.
There are many hundreds of axial flow type valves in service and it has become the industry norm for this duty having demonstrated in service high durability and reliability. This is the reason this type of valve, and the specific manufacturer, was selected for safety shutdown at the LVI. The sealing capability can be tested and demonstrated both in situ and in service.
Both the safety shutdown valves have a zero leak rate (ISO 5028:2008 Rate A).
4.2.4.3 Subsea Valves
Although there will be up to 5 valves in series per well to shut in production, account is only taken for up to 3 valves in series: the surface controlled subsurface safety valve (SCSSSV), the master valve and the wing valve for each well. The purpose of these valves is to provide isolation of the well from the offshore pipeline, and as such they have been designed and tested to a high standard. Further details are provided here for the valves (master and wing valves) on the Horizontal Tree (VG 300 Series) and Tree Valve cavities.
The gate valves (5 1/8" and 2 1/16") are of the Vetco Gray VG 300 series and have been tested in accordance to API 6A Appendix F PR2 to 10,000 psig Maximum Working Pressure (MWP) over the full temperature range of -35 to +350 F.
The VG 300 series valves are very well established in the industry and are used in every key region of the world. The VG 300 series is a slab gate valve with floating/fixed seats. A tee slot style drive
Corrib Onshore Pipeline EIS Q4.5 Aspects of Process Engineering Design of the Corrib Production System
COR-25-SH-0012 26
bushing connects the stem to the gate, this allows the gate to float freely giving a better gate to seat interface. Wave springs, set behind the seats, keep the seats in constant contact with the slab gate, this contact being important to keep the valve body free of contaminants. This provides a sanitary cavity in both the open and closed positions. The slab gate is designed for low operating torque, a low initial breakout torque means less wear on the valve bearings, stem and drive bushing.
The hydraulic actuator requires hydraulic pressure to hold it in its normally operating position, on loss of hydraulic supply pressure the actuator will drive the gate valve to its failsafe close position.
Metal to Metal (MTM) sealing is provided between gate / seat and seat / body. The contact faces of the gate / seat are carbide coated.
Valve Cavities: materials selection for the tree equipment has been made to ensure fitness for purpose with regard to structural integrity and corrosion resistance. Additionally, Inconel 625 corrosion resistance alloy has been used in the valve cavities of the tree, and on seal interfaces on the wellhead components, in order to reduce the effects from corrosion, pitting attack and general metal loss, for a design life of twenty (20) years
4.2.5 Valve In Situ Testing Regime
The subsea tree valves will be leak tested twice per year in line with the well integrity management system (WIMS). This entails shutting in the flowing well and systematically testing each valve in turn. A subsea horizontal xmas tree is an assembly which is locked to the subsea wellhead and contains valves to provide production control for each well. The closed in tubing pressure will be present upstream of the subsea horizontal tree and downstream of the tree this pressure will be equalised to the pipeline pressure. The results will be recorded within the well integrity management system (WIMS). Should the valves fail to meet the test criteria (the subsea valves must meet the 14.7scf/min testing requirement defined by WIMS) set out within the well integrity management system, corrective action will be carried out as per the standards contained within the well integrity management system.
The shutdown valves at the LVI are leak tested on an annual basis. The bypass spool is isolated via the two DEGV’s. Methanol is used to increase the pressure within the short upstream section of pipework to 345 barg. The downstream pipework is then equalised with the onshore pipeline pressure. This allows the valve leakage rate (if any) to be calculated in the normal direction of flow.
The shutdown valves at the LVI are leak tested at least every 12 months. These in situ tests positively verify if the zero leakage rates have been maintained. No release of gas is incurred when undertaking these verification tests.
Corrib Onshore Pipeline EIS Q4.5 Aspects of Process Engineering Design of the Corrib Production System
COR-25-SH-0012 27
4.3 VALVE LEAKAGE SCENARIOS
Even with the high confidence of zero leakage of the LVI valves and subsea valves, prudent design still recognizes that there is a possibility that a valve or valves may leak during the course of the lifetime of the Corrib project. Such a situation is managed in accordance with the Pipeline Integrity Management System (PIMS) and Well Integrity Management System (WIMS), and actions taken to mitigate the level of leakage and a program established to undertake rectification measures.
There are three scenarios which this report analyses in order to comprehensively assess the potential effect of passing valves on pipeline pressure. This is due to the different conditions which will arise for each scenario.
Two locations are assessed for valve leakage for each scenario: leakage at the subsea valves, and leakage at the LVI valves.
4.3.1 Valve Leakage Scenario 1: Planned Shutdown for Maintenance
This section provides the assessment of the potential for the pipeline pressure to increase due to valves passing subsequent to commencement of a planned shutdown.
It also presents the information as requested by the An Bord Pleanála query (as per the 2nd
November 2009 letter) with regards to providing “an examination of the potential for pressure in the offshore pipeline to increase to wellhead pressure levels in the event that all well subsea tree valves had to be shut in over a prolonged period and in that period incremental leakage past the valves occurred”.
A planned shutdown for maintenance represents the only likely scenario during which all well subsea tree valves will be shut in for a period of 14 – 21 days every 4 years (i.e. “over a prolonged period”).
There is a planned maintenance activity which will occur annually (up to 1 day), which will result in a requirement to shut in the Terminal, pipeline and all the wells.
The pipeline will be shut in with a settle out pressure (at the Terminal inlet valve) of 85 barg approximately.
This creates a margin of approximately 15 bar between the settle out pressure and the onshore pipeline MAOP (100 barg).
The settle out pressure in the offshore pipeline will be approximately 90barg. Thus there will be a 60 bar margin approximately between the offshore pipeline settle out pressure and the offshore pipeline MAOP (150 barg).
Note that for a planned shutdown, the LVI will not be used to initiate the shutdown and it will not be initially closed during the planned maintenance period. Therefore the resulting offshore and onshore pipeline shut-in pressure will be very close – the only difference being due to the static head in the pipeline.
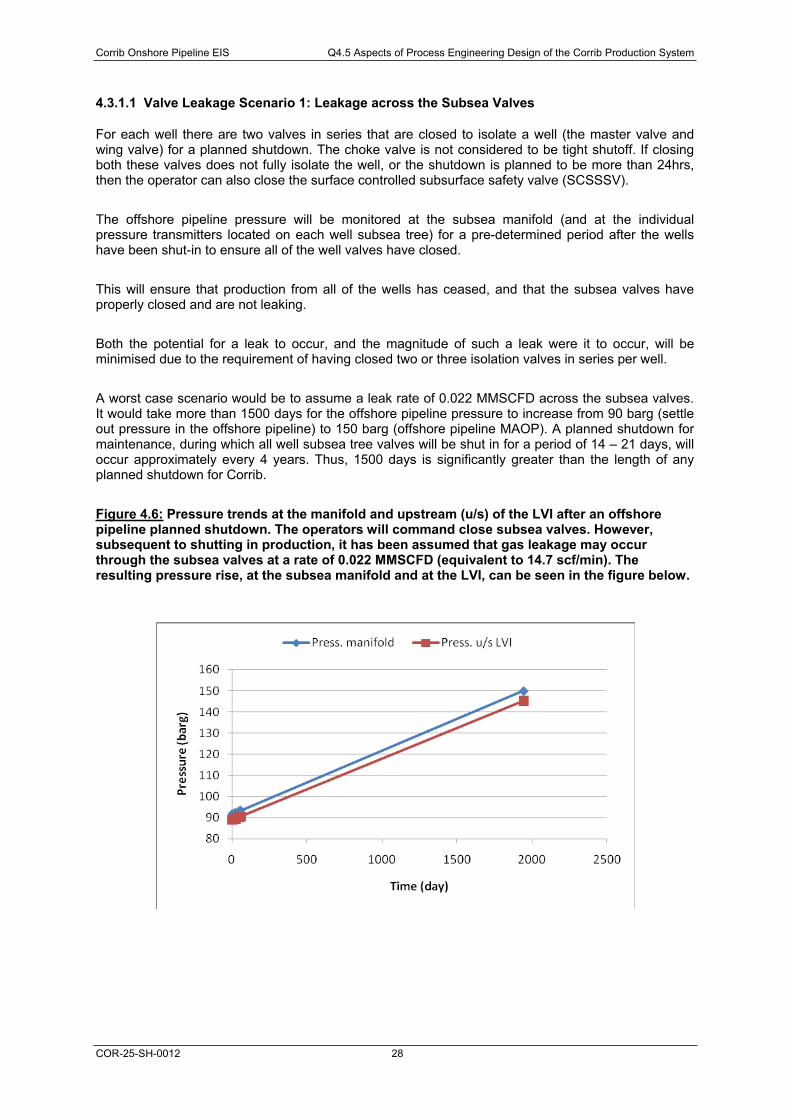
Corrib Onshore Pipeline EIS Q4.5 Aspects of Process Engineering Design of the Corrib Production System
COR-25-SH-0012 28
4.3.1.1 Valve Leakage Scenario 1: Leakage across the Subsea Valves
For each well there are two valves in series that are closed to isolate a well (the master valve and wing valve) for a planned shutdown. The choke valve is not considered to be tight shutoff. If closing both these valves does not fully isolate the well, or the shutdown is planned to be more than 24hrs, then the operator can also close the surface controlled subsurface safety valve (SCSSSV).
The offshore pipeline pressure will be monitored at the subsea manifold (and at the individual pressure transmitters located on each well subsea tree) for a pre-determined period after the wells have been shut-in to ensure all of the well valves have closed.
This will ensure that production from all of the wells has ceased, and that the subsea valves have properly closed and are not leaking.
Both the potential for a leak to occur, and the magnitude of such a leak were it to occur, will be minimised due to the requirement of having closed two or three isolation valves in series per well.
A worst case scenario would be to assume a leak rate of 0.022 MMSCFD across the subsea valves. It would take more than 1500 days for the offshore pipeline pressure to increase from 90 barg (settle out pressure in the offshore pipeline) to 150 barg (offshore pipeline MAOP). A planned shutdown for maintenance, during which all well subsea tree valves will be shut in for a period of 14 – 21 days, will occur approximately every 4 years. Thus, 1500 days is significantly greater than the length of any planned shutdown for Corrib.
Figure 4.6: Pressure trends at the manifold and upstream (u/s) of the LVI after an offshore pipeline planned shutdown. The operators will command close subsea valves. However, subsequent to shutting in production, it has been assumed that gas leakage may occur through the subsea valves at a rate of 0.022 MMSCFD (equivalent to 14.7 scf/min). The resulting pressure rise, at the subsea manifold and at the LVI, can be seen in the figure below.
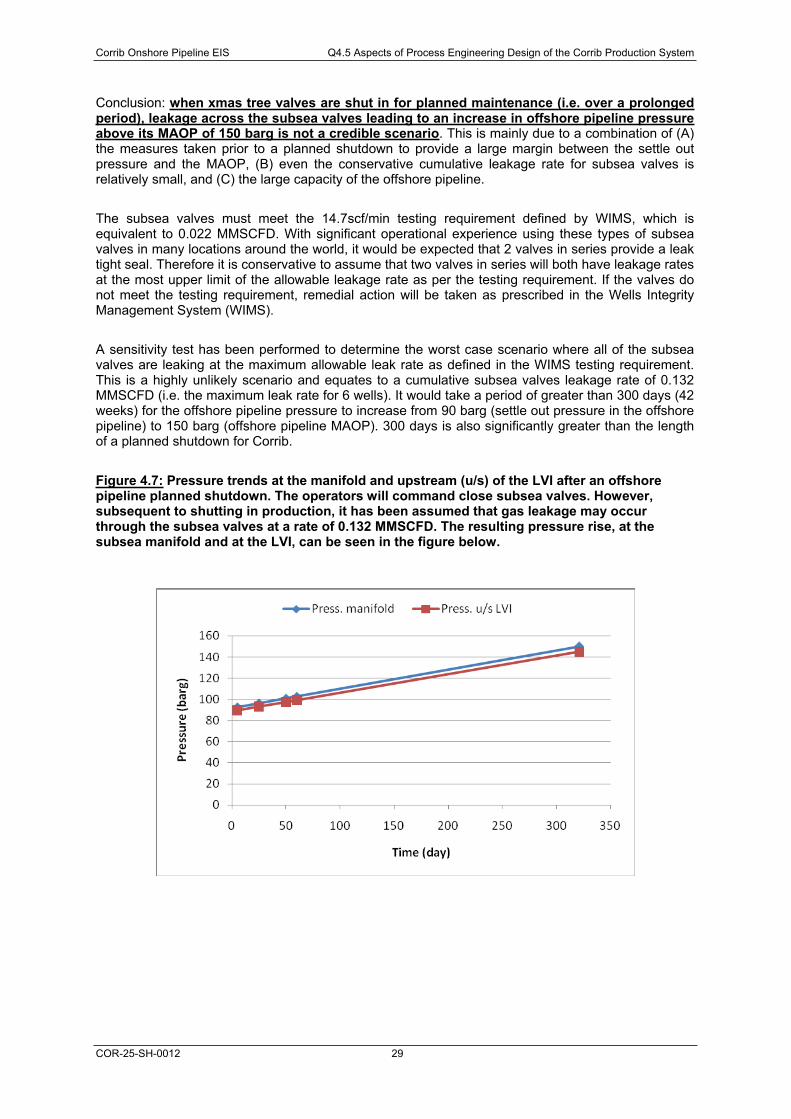
Corrib Onshore Pipeline EIS Q4.5 Aspects of Process Engineering Design of the Corrib Production System
COR-25-SH-0012 29
Conclusion: when xmas tree valves are shut in for planned maintenance (i.e. over a prolonged period), leakage across the subsea valves leading to an increase in offshore pipeline pressure above its MAOP of 150 barg is not a credible scenario. This is mainly due to a combination of (A) the measures taken prior to a planned shutdown to provide a large margin between the settle out pressure and the MAOP, (B) even the conservative cumulative leakage rate for subsea valves is relatively small, and (C) the large capacity of the offshore pipeline.
The subsea valves must meet the 14.7scf/min testing requirement defined by WIMS, which is equivalent to 0.022 MMSCFD. With significant operational experience using these types of subsea valves in many locations around the world, it would be expected that 2 valves in series provide a leak tight seal. Therefore it is conservative to assume that two valves in series will both have leakage rates at the most upper limit of the allowable leakage rate as per the testing requirement. If the valves do not meet the testing requirement, remedial action will be taken as prescribed in the Wells Integrity Management System (WIMS).
A sensitivity test has been performed to determine the worst case scenario where all of the subsea valves are leaking at the maximum allowable leak rate as defined in the WIMS testing requirement. This is a highly unlikely scenario and equates to a cumulative subsea valves leakage rate of 0.132 MMSCFD (i.e. the maximum leak rate for 6 wells). It would take a period of greater than 300 days (42 weeks) for the offshore pipeline pressure to increase from 90 barg (settle out pressure in the offshore pipeline) to 150 barg (offshore pipeline MAOP). 300 days is also significantly greater than the length of a planned shutdown for Corrib.
Figure 4.7: Pressure trends at the manifold and upstream (u/s) of the LVI after an offshore pipeline planned shutdown. The operators will command close subsea valves. However, subsequent to shutting in production, it has been assumed that gas leakage may occur through the subsea valves at a rate of 0.132 MMSCFD. The resulting pressure rise, at the subsea manifold and at the LVI, can be seen in the figure below.
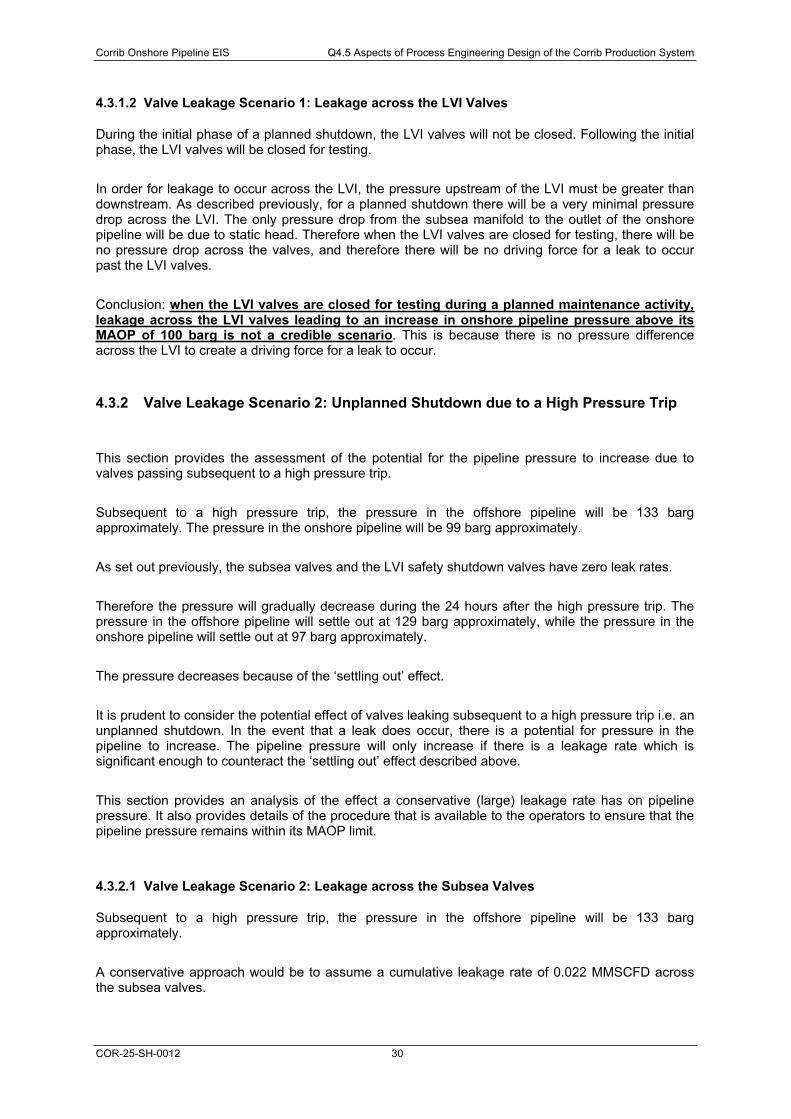
Corrib Onshore Pipeline EIS Q4.5 Aspects of Process Engineering Design of the Corrib Production System
COR-25-SH-0012 30
4.3.1.2 Valve Leakage Scenario 1: Leakage across the LVI Valves
During the initial phase of a planned shutdown, the LVI valves will not be closed. Following the initial phase, the LVI valves will be closed for testing.
In order for leakage to occur across the LVI, the pressure upstream of the LVI must be greater than downstream. As described previously, for a planned shutdown there will be a very minimal pressure drop across the LVI. The only pressure drop from the subsea manifold to the outlet of the onshore pipeline will be due to static head. Therefore when the LVI valves are closed for testing, there will be no pressure drop across the valves, and therefore there will be no driving force for a leak to occur past the LVI valves.
Conclusion: when the LVI valves are closed for testing during a planned maintenance activity, leakage across the LVI valves leading to an increase in onshore pipeline pressure above its MAOP of 100 barg is not a credible scenario. This is because there is no pressure difference across the LVI to create a driving force for a leak to occur.
4.3.2 Valve Leakage Scenario 2: Unplanned Shutdown due to a High Pressure Trip
This section provides the assessment of the potential for the pipeline pressure to increase due to valves passing subsequent to a high pressure trip.
Subsequent to a high pressure trip, the pressure in the offshore pipeline will be 133 barg approximately. The pressure in the onshore pipeline will be 99 barg approximately.
As set out previously, the subsea valves and the LVI safety shutdown valves have zero leak rates.
Therefore the pressure will gradually decrease during the 24 hours after the high pressure trip. The pressure in the offshore pipeline will settle out at 129 barg approximately, while the pressure in the onshore pipeline will settle out at 97 barg approximately.
The pressure decreases because of the ‘settling out’ effect.
It is prudent to consider the potential effect of valves leaking subsequent to a high pressure trip i.e. an unplanned shutdown. In the event that a leak does occur, there is a potential for pressure in the pipeline to increase. The pipeline pressure will only increase if there is a leakage rate which is significant enough to counteract the ‘settling out’ effect described above.
This section provides an analysis of the effect a conservative (large) leakage rate has on pipeline pressure. It also provides details of the procedure that is available to the operators to ensure that the pipeline pressure remains within its MAOP limit.
4.3.2.1 Valve Leakage Scenario 2: Leakage across the Subsea Valves
Subsequent to a high pressure trip, the pressure in the offshore pipeline will be 133 barg approximately.
A conservative approach would be to assume a cumulative leakage rate of 0.022 MMSCFD across the subsea valves.
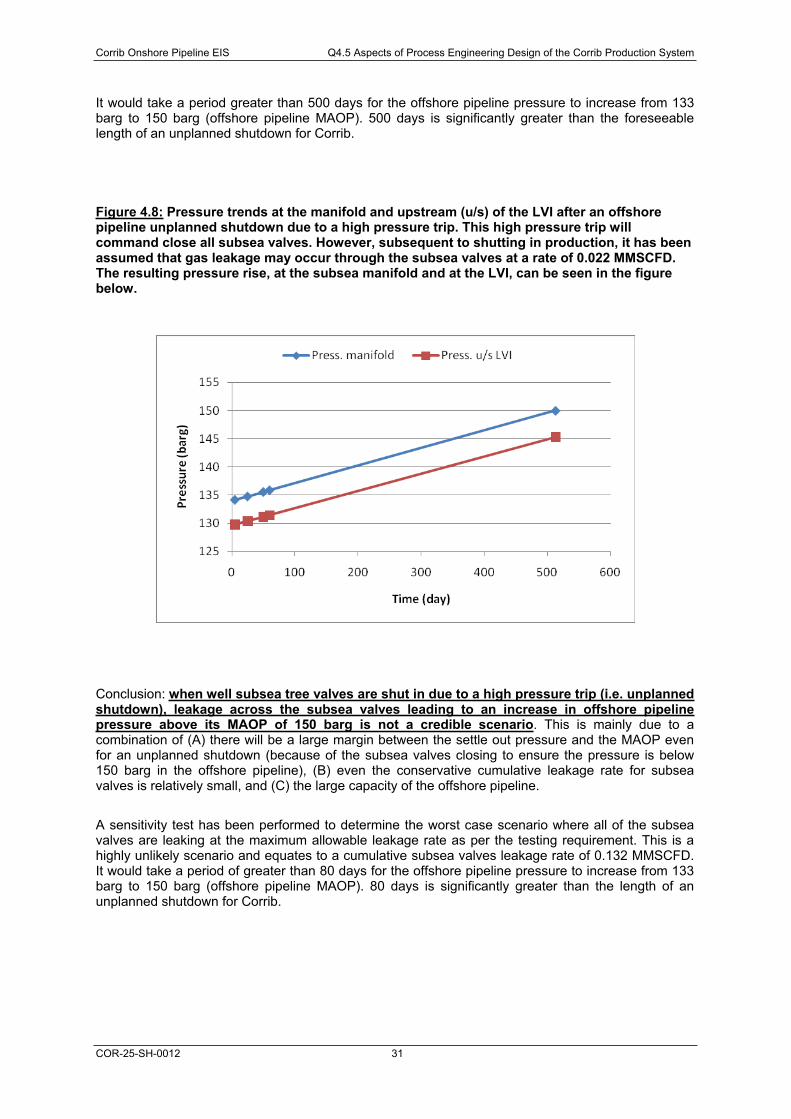
Corrib Onshore Pipeline EIS Q4.5 Aspects of Process Engineering Design of the Corrib Production System
COR-25-SH-0012 31
It would take a period greater than 500 days for the offshore pipeline pressure to increase from 133 barg to 150 barg (offshore pipeline MAOP). 500 days is significantly greater than the foreseeable length of an unplanned shutdown for Corrib.
Figure 4.8: Pressure trends at the manifold and upstream (u/s) of the LVI after an offshore pipeline unplanned shutdown due to a high pressure trip. This high pressure trip will command close all subsea valves. However, subsequent to shutting in production, it has been assumed that gas leakage may occur through the subsea valves at a rate of 0.022 MMSCFD. The resulting pressure rise, at the subsea manifold and at the LVI, can be seen in the figure below.
Conclusion: when well subsea tree valves are shut in due to a high pressure trip (i.e. unplanned shutdown), leakage across the subsea valves leading to an increase in offshore pipeline pressure above its MAOP of 150 barg is not a credible scenario. This is mainly due to a combination of (A) there will be a large margin between the settle out pressure and the MAOP even for an unplanned shutdown (because of the subsea valves closing to ensure the pressure is below 150 barg in the offshore pipeline), (B) even the conservative cumulative leakage rate for subsea valves is relatively small, and (C) the large capacity of the offshore pipeline.
A sensitivity test has been performed to determine the worst case scenario where all of the subsea valves are leaking at the maximum allowable leakage rate as per the testing requirement. This is a highly unlikely scenario and equates to a cumulative subsea valves leakage rate of 0.132 MMSCFD. It would take a period of greater than 80 days for the offshore pipeline pressure to increase from 133 barg to 150 barg (offshore pipeline MAOP). 80 days is significantly greater than the length of an unplanned shutdown for Corrib.
Corrib Onshore Pipeline EIS Q4.5 Aspects of Process Engineering Design of the Corrib Production System
COR-25-SH-0012 32
Figure 4.9: Pressure trends at the manifold and upstream (u/s) of the LVI after an offshore pipeline unplanned shutdown due to a high pressure trip. This high pressure trip will command close all subsea valves. However, subsequent to shutting in production, it has been assumed that gas leakage may occur through the subsea valves at a rate of 0.132 MMSCFD. The resulting pressure rise, at the subsea manifold and at the LVI, can be seen in the figure below.
4.3.2.2 Valve Leakage Scenario 2: Leakage across the LVI Valves
Subsequent to a high pressure trip, the pressure in the onshore pipeline will be 99 barg approximately.
At the LVI there are two potential flow paths. These are via the 20” mainline valve (otherwise known as the Landfall Mainline Isolation Valve (LMIV)) and via the two inline safety shutdown valves (otherwise known as the Landfall Pressure Limitation Valves (LPLVs)).
Following a trip of the LVI at 99 barg then potentially, either or both flow paths could pass fluid due to valve leakage. While the two safety shutdown valves could be isolated by the upstream and downstream isolation valves, this is omitted from this evaluation.
It has been conservatively assumed that either the 20” DEGV or both safety shutdown valves leak at a combined rate based upon ISO 5028 Rate D. This is conservative as both the 20” DEGV and the safety shutdown valves have been tested and accepted with criteria Rate A – no visible leakage/bubbles.
Conservatively assuming that the valves only meet Rate D criteria, this equates to a leakage rate of approximately 0.0000824 MMSCFD.
At this leakage rate, it takes greater than 4 years to reach 100 barg from the moment the LVI has been closed and the onshore pipeline pressure is 99 barg.
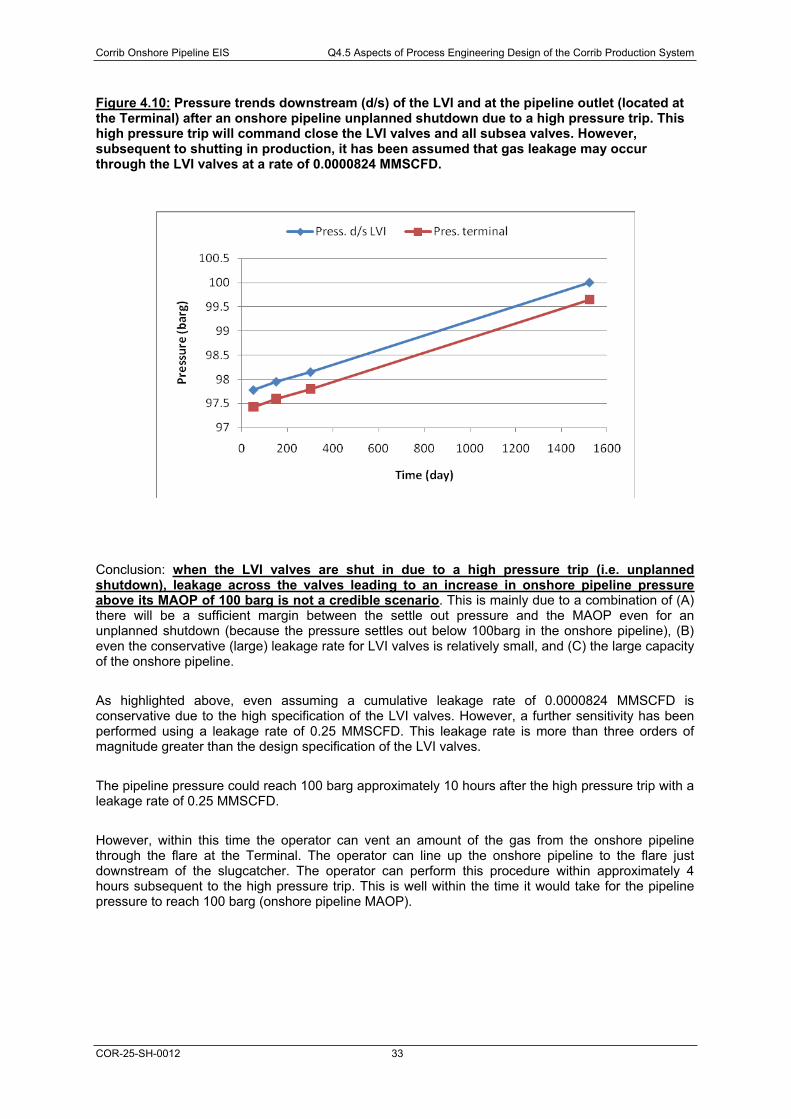
Corrib Onshore Pipeline EIS Q4.5 Aspects of Process Engineering Design of the Corrib Production System
COR-25-SH-0012 33
Figure 4.10: Pressure trends downstream (d/s) of the LVI and at the pipeline outlet (located at the Terminal) after an onshore pipeline unplanned shutdown due to a high pressure trip. This high pressure trip will command close the LVI valves and all subsea valves. However, subsequent to shutting in production, it has been assumed that gas leakage may occur through the LVI valves at a rate of 0.0000824 MMSCFD.
Conclusion: when the LVI valves are shut in due to a high pressure trip (i.e. unplanned shutdown), leakage across the valves leading to an increase in onshore pipeline pressure above its MAOP of 100 barg is not a credible scenario. This is mainly due to a combination of (A) there will be a sufficient margin between the settle out pressure and the MAOP even for an unplanned shutdown (because the pressure settles out below 100barg in the onshore pipeline), (B) even the conservative (large) leakage rate for LVI valves is relatively small, and (C) the large capacity of the onshore pipeline.
As highlighted above, even assuming a cumulative leakage rate of 0.0000824 MMSCFD is conservative due to the high specification of the LVI valves. However, a further sensitivity has been performed using a leakage rate of 0.25 MMSCFD. This leakage rate is more than three orders of magnitude greater than the design specification of the LVI valves.
The pipeline pressure could reach 100 barg approximately 10 hours after the high pressure trip with a leakage rate of 0.25 MMSCFD.
However, within this time the operator can vent an amount of the gas from the onshore pipeline through the flare at the Terminal. The operator can line up the onshore pipeline to the flare just downstream of the slugcatcher. The operator can perform this procedure within approximately 4 hours subsequent to the high pressure trip. This is well within the time it would take for the pipeline pressure to reach 100 barg (onshore pipeline MAOP).
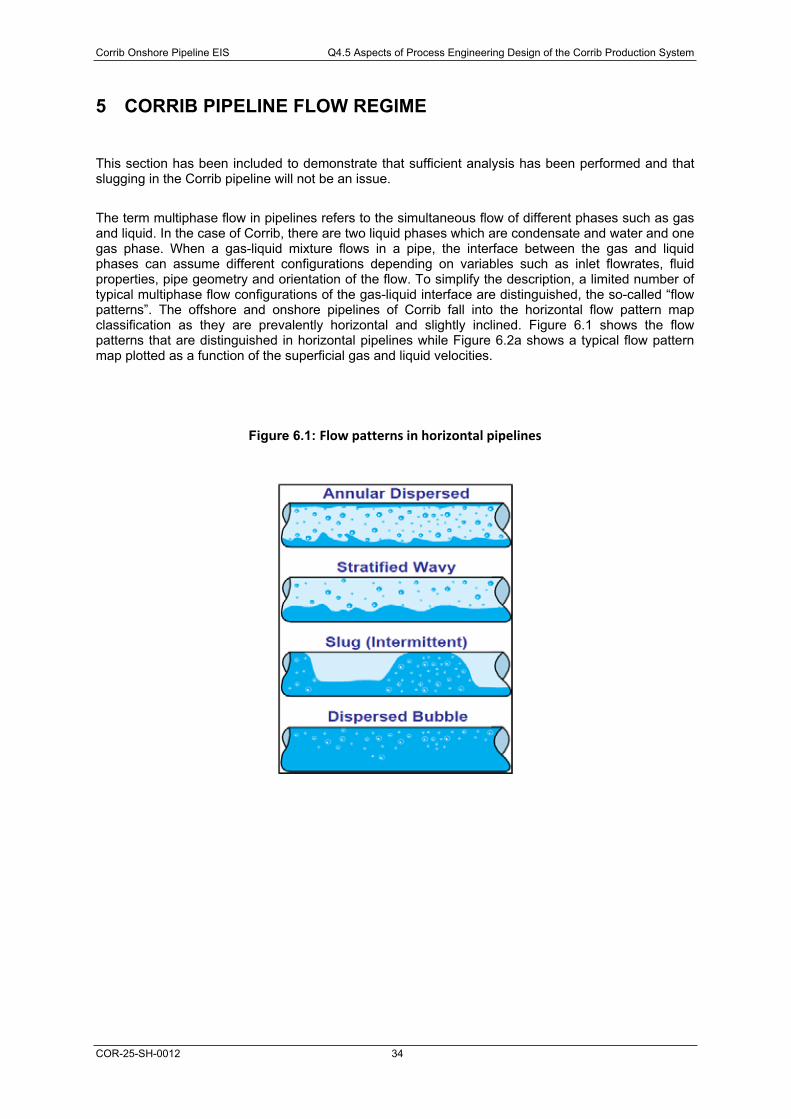
Corrib Onshore Pipeline EIS Q4.5 Aspects of Process Engineering Design of the Corrib Production System
COR-25-SH-0012 34
5 CORRIB PIPELINE FLOW REGIME
This section has been included to demonstrate that sufficient analysis has been performed and that slugging in the Corrib pipeline will not be an issue.
The term multiphase flow in pipelines refers to the simultaneous flow of different phases such as gas and liquid. In the case of Corrib, there are two liquid phases which are condensate and water and one gas phase. When a gas-liquid mixture flows in a pipe, the interface between the gas and liquid phases can assume different configurations depending on variables such as inlet flowrates, fluid properties, pipe geometry and orientation of the flow. To simplify the description, a limited number of typical multiphase flow configurations of the gas-liquid interface are distinguished, the so-called “flow patterns”. The offshore and onshore pipelines of Corrib fall into the horizontal flow pattern map classification as they are prevalently horizontal and slightly inclined. Figure 6.1 shows the flow patterns that are distinguished in horizontal pipelines while Figure 6.2a shows a typical flow pattern map plotted as a function of the superficial gas and liquid velocities.
Figure 6.1: Flow patterns in horizontal pipelines
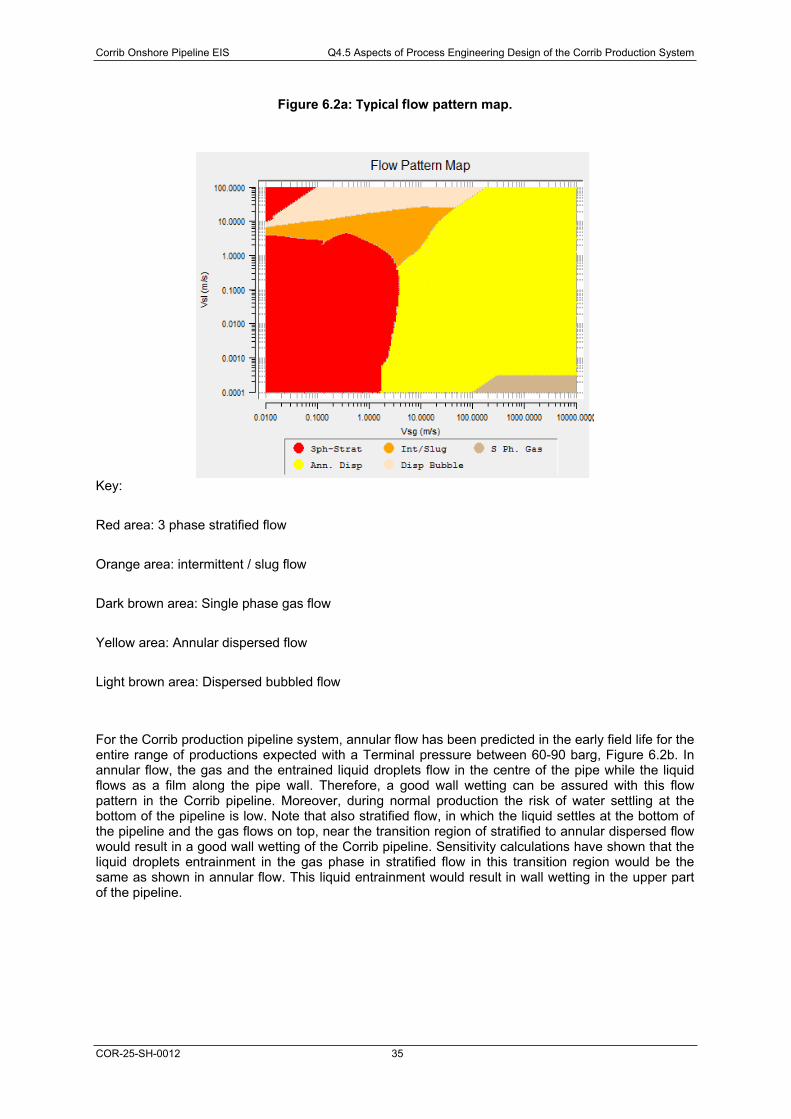
Corrib Onshore Pipeline EIS Q4.5 Aspects of Process Engineering Design of the Corrib Production System
COR-25-SH-0012 35
Figure 6.2a: Typical flow pattern map.
Key:
Red area: 3 phase stratified flow
Orange area: intermittent / slug flow
Dark brown area: Single phase gas flow
Yellow area: Annular dispersed flow
Light brown area: Dispersed bubbled flow
For the Corrib production pipeline system, annular flow has been predicted in the early field life for the entire range of productions expected with a Terminal pressure between 60-90 barg, Figure 6.2b. In annular flow, the gas and the entrained liquid droplets flow in the centre of the pipe while the liquid flows as a film along the pipe wall. Therefore, a good wall wetting can be assured with this flow pattern in the Corrib pipeline. Moreover, during normal production the risk of water settling at the bottom of the pipeline is low. Note that also stratified flow, in which the liquid settles at the bottom of the pipeline and the gas flows on top, near the transition region of stratified to annular dispersed flow would result in a good wall wetting of the Corrib pipeline. Sensitivity calculations have shown that the liquid droplets entrainment in the gas phase in stratified flow in this transition region would be the same as shown in annular flow. This liquid entrainment would result in wall wetting in the upper part of the pipeline.
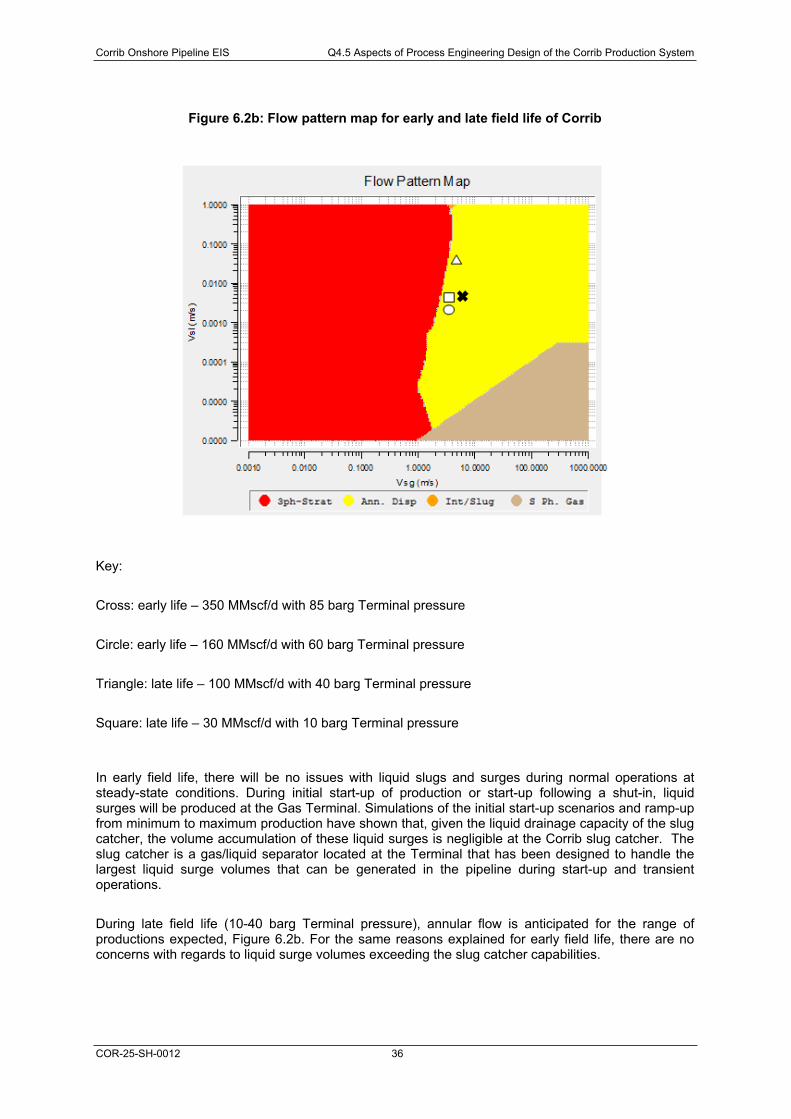
Corrib Onshore Pipeline EIS Q4.5 Aspects of Process Engineering Design of the Corrib Production System
COR-25-SH-0012 36
Figure 6.2b: Flow pattern map for early and late field life of Corrib
Key:
Cross: early life – 350 MMscf/d with 85 barg Terminal pressure
Circle: early life – 160 MMscf/d with 60 barg Terminal pressure
Triangle: late life – 100 MMscf/d with 40 barg Terminal pressure
Square: late life – 30 MMscf/d with 10 barg Terminal pressure
In early field life, there will be no issues with liquid slugs and surges during normal operations at steady-state conditions. During initial start-up of production or start-up following a shut-in, liquid surges will be produced at the Gas Terminal. Simulations of the initial start-up scenarios and ramp-up from minimum to maximum production have shown that, given the liquid drainage capacity of the slug catcher, the volume accumulation of these liquid surges is negligible at the Corrib slug catcher. The slug catcher is a gas/liquid separator located at the Terminal that has been designed to handle the largest liquid surge volumes that can be generated in the pipeline during start-up and transient operations.
During late field life (10-40 barg Terminal pressure), annular flow is anticipated for the range of productions expected, Figure 6.2b. For the same reasons explained for early field life, there are no concerns with regards to liquid surge volumes exceeding the slug catcher capabilities.
Corrib Onshore Pipeline EIS Q4.5 Aspects of Process Engineering Design of the Corrib Production System
COR-25-SH-0012 37
6 HYDRATES
This section addresses the concern of the potential for hydrate formation in the Corrib pipeline. An Bord Pleanála have raised a query with regards the potential for a “Methane Hydrate in the pipeline” to be a potential failure mode for the pipeline. This was raised in point (d) of their letter dated 2nd
November 2009:
(d)…. In order to eliminate any doubt please note that all failure modes should be included including the possibility of third party intentional damage at Glengad, wet gas in the pipeline, CO2 in the pipeline and potential for Methane Hydrate in the pipeline.
6.1 INTRODUCTION
The Corrib produced gas contains hydrate forming components such as methane, ethane, propane and small quantities of carbon-dioxide. At high-pressure and low-temperature, these components along with water form crystalline solids known as “Gas hydrates”. The prevention of gas hydrates is generally recognized as the most important flow-assurance issue for projects such as Corrib because should a hydrate blockage occur, this can then cause large production losses.
6.2 CORRIB HYDRATE MANAGEMENT STRATEGY: HYDRATE INHIBITION
The Corrib subsea system including the main pipeline operates inside the hydrate region during steady-state flowing conditions. Methanol has been chosen as a primary hydrate inhibitor and it will be continuously injected offshore to prevent hydrate formation in the Corrib production system. Methanol is a thermodynamic hydrate inhibitor (similar to Mono-Ethylene Glycol and salt), which mostly dissolves in water but some amount, also dissolves/evaporates in condensate and gas. Depending on the methanol concentration in water, the hydrate formation temperature decreases at a given pressure. Therefore, methanol injection quantities are calculated using thermodynamic PVT software to ensure that sufficient quantities of methanol are injected so that the entire system operates outside the hydrate region.
A robust hydrate management strategy has been developed for Corrib to cover all circumstances and not just the most prevalent (i.e. operating at steady state for the life of the field). Thus, the hydrate management strategy and methanol injection system has been designed and will be managed such that sufficient methanol will be injected and correct operational procedure will be used to prevent hydrate formation during all foreseeable situations (e.g., Cold well start-up, Normal operating conditions, Planned shut-in, Unplanned shut-in, Hydrate plug remediation, Production restart after a hydrate plug event).
Hydrates will only form in the Corrib subsea facility and pipeline if methanol is not injected in sufficient quantities. The operating strategy for Corrib is to immediately stop production in the unlikely event of offshore methanol injection being unavailable. The methanol system has been designed to meet the reliability required by the system.
Corrib Onshore Pipeline EIS Q4.5 Aspects of Process Engineering Design of the Corrib Production System
COR-25-SH-0012 38
6.3 CONSEQUENCE OF HYDRATE FORMATION
There is the potential for an unlikely event to occur whereby a hydrate plug forms in the Corrib production system due to unavailability of the methanol injection system or insufficient methanol injection. This section summarises that in this unlikely event, the formation of a hydrate plug which causes a full bore impermeable blockage in the line will not be sufficient to lead to the pipeline failing.
Subsequent to the formation of a hydrate plug in the Corrib pipeline, operating conditions would begin to change throughout the production system. A surveillance and monitoring plan will be in place and the operators will be trained to detect the formation of hydrates from identification of changes in key operating parameters. The operator would shut down production from the wells on identification of hydrates as per the Corrib hydrate management strategy. However, the hydrate inhibition system has been developed (e.g. sparing for methanol injection equipment, overdosing of methanol volumes) such that the demand for a shutdown due to hydrate formation would be extremely infrequent if at all.
However, in the unlikely event where there has been no manual intervention after the formation of a hydrate plug, the pressure will continue to increase upstream of the plug and decrease downstream of the plug. The following analysis is provided to describe how hydrate formation in 3 locations throughout the Corrib production system has been considered.
(1) Within the Corrib onshore pipeline. In the event of a full bore blockage occurring in the onshore pipeline due to the formation of a hydrate, the pressure upstream of the hydrate blockage (in the onshore section) can only rise to the onshore pipeline MAOP (100 barg). The Landfall Valve Installation (LVI) at Glengad will ensure that the MAOP is not exceeded in the onshore pipeline.
(2) Within the 10km Corrib offshore pipeline section (upstream of LVI). If the hydrate blockage forms in the Corrib offshore pipeline near to Glengad, for example within the 10km section upstream of the LVI, the pressure will decrease downstream of the plug at a faster rate than the increase in pressure upstream of the hydrate blockage. By definition pressure in the 10km section downstream of the full bore hydrate blockage, will not increase beyond the pressure at which the hydrate plug formed. Therefore there will be no exceedance of the offshore pipeline MAOP for this 10km section. In addition to this, due to the location of the blockage, there is a greater volume upstream of the blockage in comparison to downstream of the blockage. As it has been hypothetically assumed that there is no manual intervention, production will continue from the subsea wells into the pipeline at the rate gas is produced from the pipeline into the Gas Terminal. However, due to the blockage, pressure at the Gas Terminal inlet will begin to decrease such that the low pressure terminal trip will be initiated. This will cause the Gas Terminal inlet valve and the subsea valves to close. This will ensure that the offshore pipeline MAOP is not exceeded.
(3) Within the Corrib offshore pipeline section – from subsea manifold to 10km point upstream of LVI. At some point greater than 10km (e.g. approximately half way between the subsea manifold and the Gas Terminal), it is assumed for this analysis, that a hydrate blockage will form. This, by the definition of a full bore blockage, will prevent a pressure increase in the (approximately) 40km section immediately upstream of the LVI. There will be no increase in pressure beyond the pressure at which the hydrate plug formed. Therefore there will be no exceedance of the offshore pipeline MAOP for this 40km section. The rate of pressure increase upstream of the blockage will be equal, or greater, than the decrease in pressure downstream of the blockage. When the pressure upstream of the hydrate blockage reaches 145 barg at the subsea manifold, the safeguarding system will automatically shut down production from the wells (as described in layer 4 of section 2.5.2). This will prevent pressures exceeding the MAOP in the offshore pipeline.
Corrib Onshore Pipeline EIS Q4.5 Aspects of Process Engineering Design of the Corrib Production System
COR-25-SH-0012 39
6.4 HYDRATE REMEDIATION
Hydrate remediation procedures have been developed to prevent pipeline failure subsequent to the unlikely event of the formation of a hydrate plug in the Corrib pipeline. Hydrate remediation will be a lengthy operation, and specialist staff will perform this activity.
Depending on the hydrate plug characteristics (incomplete or complete blockage) and location of a hydrate plug, depressurization and methanol injection are methods to melt a hydrate plug. If possible and feasible, methanol injection is the preferred method to melt a hydrate plug. To prevent hydrate plug movement while applying the depressurization method, necessary steps (such as gradual pressure-reduction in maximum 2-3 bar step) will be taken to avoid large pressure difference across a hydrate plug. From the facilities integrity and safety perspective, this is a very important step as it has been observed in a field test that a hydrate plug can accelerate to high velocity when a large pressure difference exists across a hydrate plug. Therefore, two-sided depressurization is the recommended method to dissociate a completely blocked (full bore) hydrate plug that is close to the production facilities.
In the event of a full bore pipeline hydrate blockage it may be possible to perform a one-sided depressurisation. This will be predicated on the condition of the hydrate plug being located at such a distance that the depressurisation will not result in the plug travelling at high velocities in the proximity of the Terminal or LVI. Because of this requirement (for the depressurisation procedure to specify a method which will not result in pipeline failure arising from a hydrate plug travelling at high velocities), the hydrate plug remediation strategy will be classified as an SCE (Safety Critical Element). Detailed procedures prepared by specialist engineers in this field of expertise and appropriately peer reviewed, will provide a step by step procedure to dissociate a hydrate plug in a safe manner irrespective of location or extent of plug.
Corrib Onshore Pipeline EIS Q4.5 Aspects of Process Engineering Design of the Corrib Production System
COR-25-SH-0012 40
7 COLD VENTING AT GLENGAD (THE LVI COMPOUND)
7.1 OBJECTIVE Consider An Bord Pleanála request to examine cold venting at the LVI to reduce pressure in the upstream offshore pipeline.
“The concept of a vent at Glengad as a measure to protect against pressure at the wellhead side of the pipeline at the landfall rising above the maximum operating pressure should be examined” (Point(g), An Bord Pleanála Letter, 2nd November 2009).
7.2 PRESENT ARRANGEMENT
At present there is no provision for cold venting at the LVI and to date public statements have been made by SEPIL that there will be no venting or flaring of gas at the LVI.
Some small fugitive discharges will occur during maintenance and instrument calibrations / function tests, and if the two safety shutdown valves are removed for maintenance.
7.3 COLD VENT SIZING
A cold vent at the LVI would only be of use should the pressure in the offshore pipeline continue to rise following shut down of the subsea wells and valves. As previously described in section 4: Potential and Effect of Passing (‘Leaking’) Valves in the Corrib Pipeline, exceeding the pipeline MAOPs due to leakage across the valves is not a credible scenario.
In order to explain the usage of a cold vent at the LVI, it requires the use of a hypothetical assumption, which would allow for the potential of pipeline overpressure to occur. Otherwise, there is no requirement for an assessment of a cold vent at Glengad.
Therefore, it has been assumed that in the event of a high pressure occurring in the pipeline, there is no operator intervention, and the wells isolation system fails, such that production from one well continues into the offshore pipeline. It is extremely unlikely for such an event to occur. See Appendix Q4.6 with regards details of the reliability of the wells isolation system (i.e. details the probability of the wells isolation system or the LVI failing to function on demand).
If a cold vent was considered at the LVI for this scenario, then to maintain the pressure in the offshore pipeline below 150 barg will require a substantial cold vent of similar proportions to the flare at the Terminal.
Corrib Onshore Pipeline EIS Q4.5 Aspects of Process Engineering Design of the Corrib Production System
COR-25-SH-0012 41
Typically this would be 200mm to 300mm diameter with a stack height of approximately 30m to ensure sufficient and safe dispersion.
Provision would be required for utilities and auxiliary systems such as knock-out vessels and storage tanks.
7.4 VENT LOCATION
The LVI is situated in protected views and the LVI itself has been positioned in a dished area. Due to the parameters of the Cold Vent, a permanent installation would be required outside the dished area with appropriate foundations and guides.
To connect the Cold Vent to the LVI pipework it is envisaged that a valved connection would be made downstream of Valve V2 to enable isolation of the vent. The vent pipework would be routed up the slope of the dished LVI to the vent foundation.
The Cold Vent would be located down-wind of the prevailing wind at the LVI. A suitable wind sock will be required to verify the prevailing wind.
From the design codes an area of around 150 metres radius around the Vent Stack would be temporary fenced off during venting.
7.5 CONSEQUENCES
Provision of a Cold Vent at the LVI would result in:
· High visual impact.
· High noise levels during venting.
· Release of large gas volumes to atmosphere.
· Increased safety risk during venting.
· Potential for uncontrolled ignition.
7.6 CONCLUSION
It is concluded that provision of a cold vent at the LVI is not a viable option and if release of gas is required then this should be performed at the Terminal where provisions have already been made for safe and controlled release of gas under upset conditions.
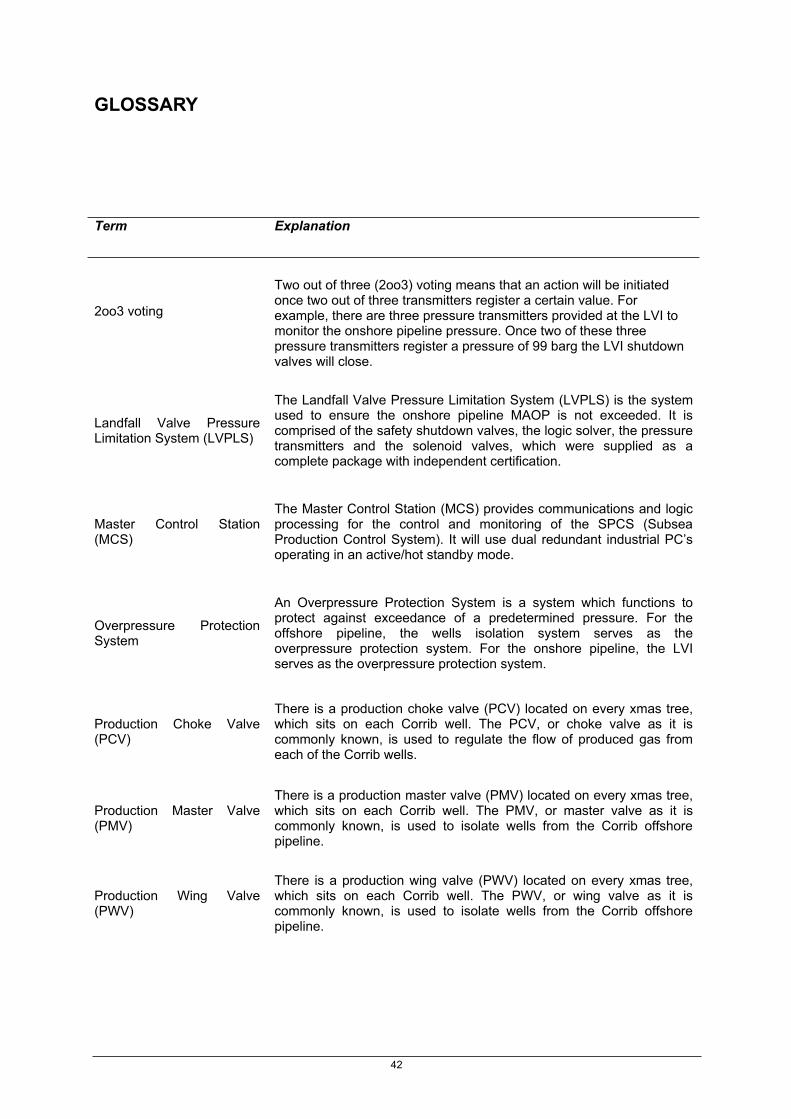
42
GLOSSARY
Term Explanation
2oo3 voting
Two out of three (2oo3) voting means that an action will be initiated once two out of three transmitters register a certain value. For example, there are three pressure transmitters provided at the LVI to monitor the onshore pipeline pressure. Once two of these three pressure transmitters register a pressure of 99 barg the LVI shutdown valves will close.
Landfall Valve Pressure Limitation System (LVPLS)
The Landfall Valve Pressure Limitation System (LVPLS) is the system used to ensure the onshore pipeline MAOP is not exceeded. It is comprised of the safety shutdown valves, the logic solver, the pressure transmitters and the solenoid valves, which were supplied as a complete package with independent certification.
Master Control Station (MCS)
The Master Control Station (MCS) provides communications and logic processing for the control and monitoring of the SPCS (Subsea Production Control System). It will use dual redundant industrial PC’s operating in an active/hot standby mode.
Overpressure Protection System
An Overpressure Protection System is a system which functions to protect against exceedance of a predetermined pressure. For the offshore pipeline, the wells isolation system serves as the overpressure protection system. For the onshore pipeline, the LVI serves as the overpressure protection system.
Production Choke Valve (PCV)
There is a production choke valve (PCV) located on every xmas tree, which sits on each Corrib well. The PCV, or choke valve as it is commonly known, is used to regulate the flow of produced gas from each of the Corrib wells.
Production Master Valve (PMV)
There is a production master valve (PMV) located on every xmas tree, which sits on each Corrib well. The PMV, or master valve as it is commonly known, is used to isolate wells from the Corrib offshore pipeline.
Production Wing Valve (PWV)
There is a production wing valve (PWV) located on every xmas tree, which sits on each Corrib well. The PWV, or wing valve as it is commonly known, is used to isolate wells from the Corrib offshore pipeline.
43
Subsea Valves This is a collective term, which has been used throughout and refers to the xmas tree valves and the surface controlled subsurface safety valve (SCSSSV).
Surface controlled subsurface safety valve (SCSSSV)
In addition to the master and flow wing valves each well also has a surface controlled downhole safety valve installed approximately 900m below the seabed. This valve is designed to be an independent back up for the primary xmas tree valves.
Subsea Tree (or Subsea Xmas Tree)
A structure which sits at the top of each Corrib well and is composed of a series of valves and instruments that can be used to safely manage the Corrib gas production. The main function of the xmas tree is to direct the gas from the well into the flow line and to provide the means to safely and reliably shut in or stop gas production. The primary valves on the xmas tree are the master valve and flow wing valves. These two valves are used to ensure that gas production can be safely shut in either by the operator or, automatically by the control system, should an unexpected event occur. The xmas tree also contains valves to allow methanol and other chemicals to be injected into the well if required. Each xmas tree has a choke valve that the control room operator can use to accurately control the rate and pressure at which the gas flows from the wells into the subsea pipeline.
Tree Valves (or Xmas Tree Valves)
Main valves of interest located on the xmas tree include the production master valve (PMV), the production wing valve (PWV) and the production choke valve (PCV). See Figure 4.4 in section 4.4.2 for a schematic of a typical Corrib xmas tree.
Well Infield Line Isolation Valve (WIV)
Isolation valve located at the subsea manifold. It is included in the design to allow for isolation of each infield flow line that is tied into the subsea manifold.
SHELL E&P IRELAND LIMITED
CORRIB GAS FIELD DEVELOPMENT PROJECT
Q4.6 – RELIABILITY OF OVERPRESSURE PROTECTION SYSTEMS FOROFFSHORE AND ONSHORE PIPELINESDOCUMENT No: COR 25 SH 0013
Corrib Onshore Pipeline EIS Q4.6 Reliability of Overpressure Protection Systems
COR-25-SH-0013 ii
TABLE OF CONTENTS
PREAMBLE ............................................................................................................................................ 11 RELIABILITY OF OVERPRESSURE PROTECTION SYSTEMS................................................... 3
1.1 ONSHORE PIPELINE (THE LANDFALL VALVE INSTALLATION)................................................ 3
1.2 OFFSHORE PIPELINE (THE WELLS ISOLATION SYSTEM) ..................................................... 4
1.2.1 Sub-System 1.................................................................................................... 4
1.2.2 Sub-System 2.................................................................................................... 5
1.2.3 Analysis............................................................................................................. 6
1.3 SUMMARY ....................................................................................................................... 6
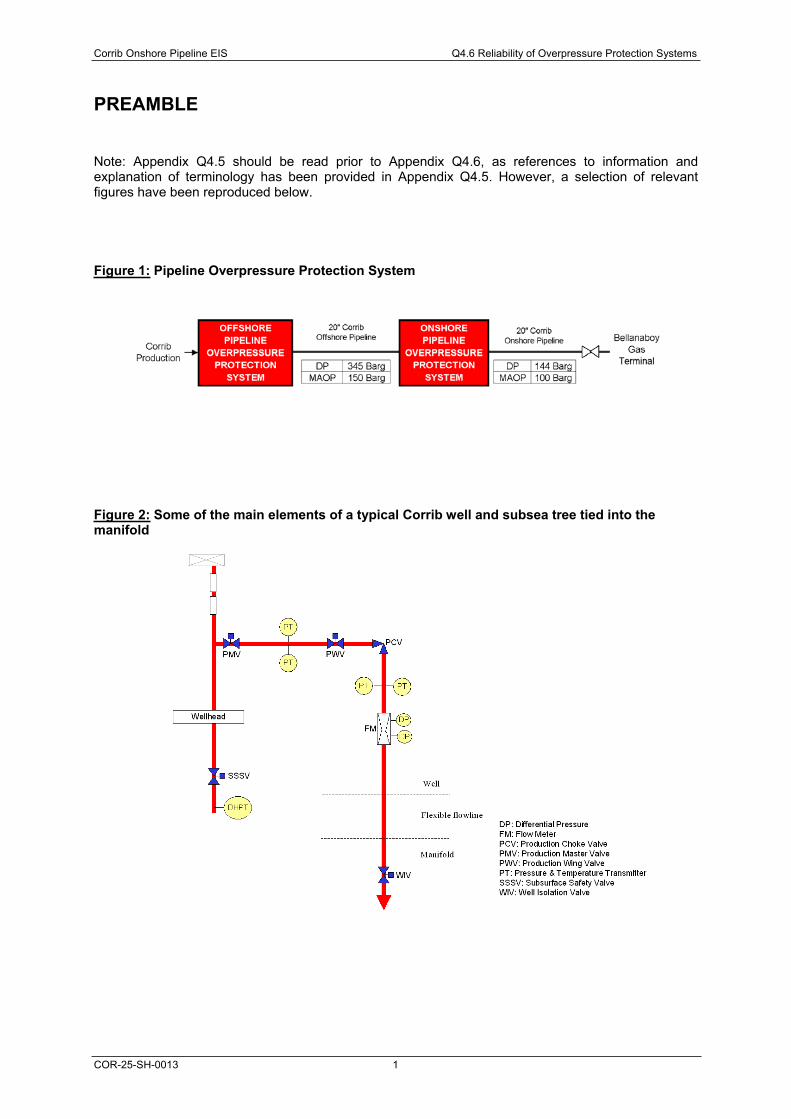
Corrib Onshore Pipeline EIS Q4.6 Reliability of Overpressure Protection Systems
COR-25-SH-0013 1
PREAMBLE
Note: Appendix Q4.5 should be read prior to Appendix Q4.6, as references to information and explanation of terminology has been provided in Appendix Q4.5. However, a selection of relevant figures have been reproduced below.
Figure 1: Pipeline Overpressure Protection System
Figure 2: Some of the main elements of a typical Corrib well and subsea tree tied into the manifold
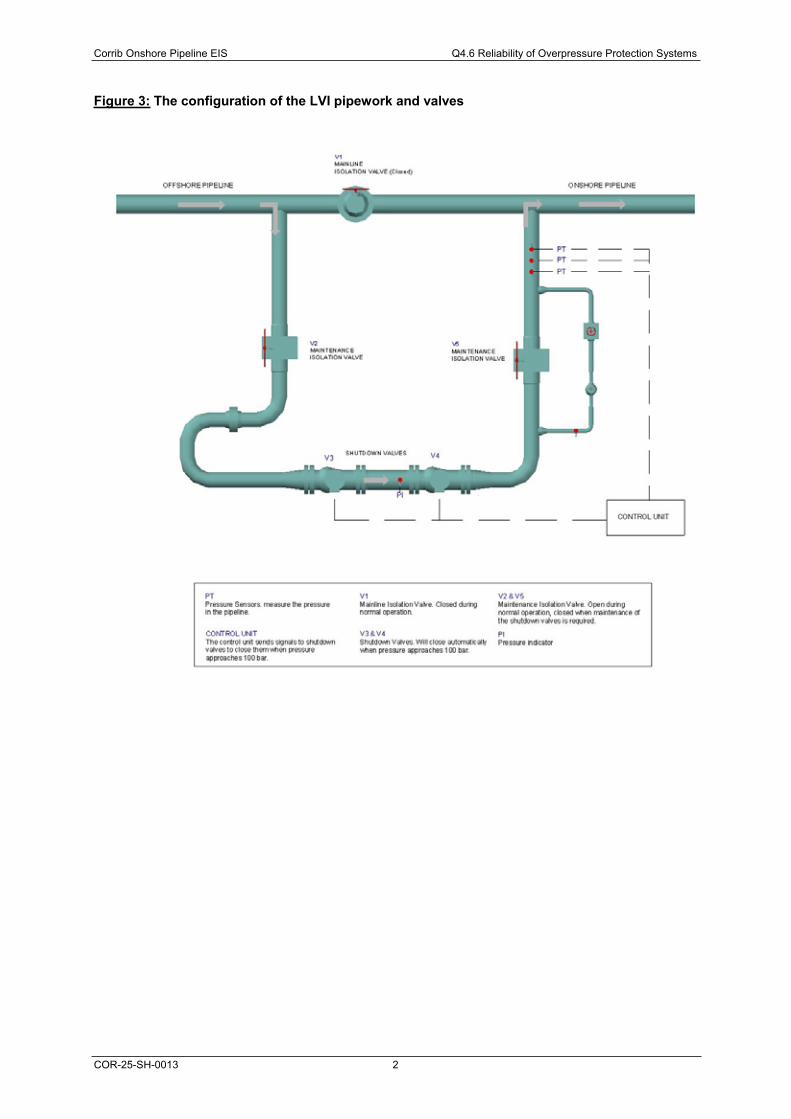
Corrib Onshore Pipeline EIS Q4.6 Reliability of Overpressure Protection Systems
COR-25-SH-0013 2
Figure 3: The configuration of the LVI pipework and valves
Corrib Onshore Pipeline EIS Q4.6 Reliability of Overpressure Protection Systems
COR-25-SH-0013 3
1 RELIABILITY OF OVERPRESSURE PROTECTION SYSTEMS
Overpressure protection systems are in place for both the offshore and the onshore pipelines. These protection systems will restrict the maximum pressure that can be experienced in these pipelines to their respective Maximum Allowable Operating Pressures (MAOPs). The MAOP values have been set based on minimising pressure while maintaining the operability of the Corrib pipeline system and the design throughput. In this document, ‘overpressure’ will refer to exceeding the set value of MAOP.
The Landfall Valve Installation (LVI) is the overpressure protection system for the onshore pipeline. The Wells Isolation System is the overpressure protection system for the offshore pipeline. The purpose of this document is to demonstrate that the reliability of the overpressure protection systems is sufficient to prevent any credible case of overpressure occurring.
This document summarises the reliability calculations of the respective overpressure protection systems.
1.1 ONSHORE PIPELINE (THE LANDFALL VALVE INSTALLATION)
The onshore section of the pipeline is protected from overpressure by a high reliability overpressure protection system at the Land Valve Installation (LVI). This is located at the landfall at Glengad and forms the interface between the onshore and offshore pipelines.
The LVI safety shutdown system comprises the following components:-
- Three pressure transmitters.
- An electronic high integrity logic solver, configured so that when any two of the three (2oo3) transmitters detect a pressure of 99 barg or more the safety shutdown valves are closed.
- Two safety shutdown valves that fail to the closed position. These are configured so that either of the valves can isolate the offshore pipeline from the onshore pipeline.
- Two solenoid valves per isolation valve. These are configured so that either of the two solenoid valves can close the respective safety shutdown valve.
The safety shutdown valves selected for the high integrity shutdown system are two inline 16” diameter axial flow valves each equipped with a spring to close and hydraulic pressure to open actuators. Pressurisation of the actuators is via a manual hand pump. The fail safe condition for both shutdown valves is closed. The safety shutdown valves, the actuators, the electronic logic solver and the three pressure transmitters were supplied as a complete package with independent certification. For further design details of the LVI see Appendix Q4.3
Signals from the three pressure transmitters will be processed through the LVI logic solver and the solenoid valves for each safety shutdown valve will be de-energised which results in depressurising the hydraulic fluid in the actuator. Loss of hydraulic fluid pressure will cause the safety shutdown valves to move to the closed position. Closure of any one of the two safety shutdown valves stops flow into the onshore pipeline. The safety shutdown system will be regularly tested with a full closure test every 12 months and a planned overhaul of the safety shutdown valves within 5 years.
Corrib Onshore Pipeline EIS Q4.6 Reliability of Overpressure Protection Systems
COR-25-SH-0013 4
The total probability of failure on demand (PFD) of the LVI shutdown system has been calculated to be 7.4x10⁻⁴ (0.00074). This has been certified by an independent verification authority in accordance with international standards IEC 61508 and IEC 61511. This is within the recognised industry probability integrity level of 0.0001 to 0.001
1.2 OFFSHORE PIPELINE (THE WELLS ISOLATION SYSTEM)
The subsea gate valves used for isolation, of the Vetco Gray VG 300 series, are very well established in the industry and are used in every key region of the world. The subsea tree valves will be leak tested twice per year in line with the well integrity management system (WIMS). Further details can be found in Appendix Q4.5.
The Wells Isolation System has two sub-systems. These are:
Sub-System 1 This system utilises the command signals from the Gas Terminal via the umbilical to close the subsea valves.
Sub-System 2 This system utilise the release, at the Gas Terminal, of hydraulic pressure in the umbilical and thus resulting in closure of the subsea wellhead valves.
1.2.1 Sub-System 1
This is the first sub-system that is initiated to prevent pressure exceeding the offshore pipeline MAOP. It is initiated if the pressure transmitters at the outlet of the onshore pipeline (i.e. located at the Gas Terminal inlet) rise to 93 barg. This sub-system, otherwise known as the SS3 trip, will prevent the offshore pipeline MAOP being exceeded by closing the master, wing and choke valves for each well. The master and wing valves will close in less than approximately 1 minute.
This sub-system comprises the following components:
Three pressure transmitters at the terminal inlet configured so that when any two of the transmitters detect a pressure of 93 barg or more the subsea trip SS3 is initiated.
High Integrity ESD logic Solver at the Terminal. Master Control Station (MCS) logic solver in the Terminal. Wing valves located on each Subsea Well which fail closed on loss of electrical or hydraulic
power. Master valves located on each Subsea Well which fail close on loss of hydraulic power.
If the pressure at the terminal inlet rises to 93 barg, signals from the pressure transmitters will be processed through the ESD logic solver in the terminal and the Master Control Station (MCS) located in the terminal. The solenoids for each subsea well wing and master valve will be commanded to vent hydraulic fluid pressure at the Subsea Control Modules (SCMs) on each well. Thus, the subsea well wing and master valves will be commanded closed.
Loss of hydraulic pressure will cause the wing and master valves to move to the closed position. Closure of either the Master Valve or the Wing Valve at each wellhead will stop the flow from that well.
Corrib Onshore Pipeline EIS Q4.6 Reliability of Overpressure Protection Systems
COR-25-SH-0013 5
This sub-system is also initiated if the pressure at the LVI pressure transmitters rises to 99 barg, or on closure of either of the LVI shutdown valves.
1.2.2 Sub-System 2
This is the second sub-system that is initiated to prevent pressure exceeding the offshore pipeline MAOP. It is initiated on closure of the LVI safety shutdown valves. Sub-system 2, otherwise known as the SS2 trip, will prevent the offshore pipeline MAOP being exceeded by closing well isolation valves using a different route to local releasing of hydraulic fluid pressure described in Sub-system 1 (thereby reducing the potential for common cause failure). Sub-system 2 will also close well infield line isolation valve (WIVs situated in the subsea manifold), in addition to the surface controlled subsurface safety valve, the master valve and wing valve for each well.
This sub-system comprises the following components:
Three pressure transmitters at the LVI configured so that when any two of the transmitters detect a pressure of 99 barg or more the LVI safety shutdown valves are closed and subsea trip SS2 is initiated.
Limit switches located on each LVI shutdown valve which initiate the subsea shutdown if either valve moves from its fully open position.
High Integrity Logic Solver at the LVI. High Integrity ESD logic Solver at the Gas Terminal. Communication / Distributed Control System from the LVI to the Master Control Station panel Solenoid valves located in the Gas Terminal which release the hydraulic fluid pressure in the
umbilicals which supply hydraulic pressure to the subsea facilities (High pressure and Low pressure hydraulic lines).
Wing valves located on each subsea well which fail closed on loss of electrical or hydraulic power.
Master valves and Surface Controlled Subsurface Safety Valves (SCSSSVs) located on each subsea well which fail closed on loss of hydraulic power.
If the pressure at the LVI pressure transmitters rise to 99 barg the subsea high pressure (HP) and low pressure (LP) umbilical hydraulic lines (that control the subsea valves) are vented (depressurised) at the Gas Terminal. Signals from the LVI pressure transmitters will be processed through the LVI logic solver and the ESD logic solver in the Gas Terminal. Solenoid valves located within the Gas Terminal on each of the A and B LP hydraulic supplies and the A and B HP hydraulic supplies will be commanded to vent hydraulic fluid. The hydraulic pressure in the umbilical at the well will start to depressurise and within 2 hours the wing, master and the surface controlled subsurface safety valve (SCSSSV) will close. At the sub-sea manifold, the well in-field isolation valves (WIV) on each subsea well flowline will also close. However, no account has been taken for these in the reliability calculations, as they are not regularly tested. In total three valves on each well, which are tested at 6-month intervals, will be closed. The closure of any one of the three valves stops flow from the individual well. Should the LVI safety shutdown valve(s) spuriously close, limit switches on the LVI safety shutdown valve(s) will detect each valve moving from its open position and initiate a subsea SS2 trip. Should both circuits of the LVI signal cable fail, (this cable provides the operator with the ability to remotely close the LVI from the Gas Terminal) then the LVI safety shutdown valves will close and also initiate a subsea SS2 trip.

Corrib Onshore Pipeline EIS Q4.6 Reliability of Overpressure Protection Systems
COR-25-SH-0013 6
1.2.3 Analysis
An independent analysis has been performed of the Well Isolation System. The method used a Failure Mode and Effects Analysis (FMEA) to identify the relevant modes of failure and a Fault Tree Analysis (FTA) to calculate the probability of ‘Failure to Isolate One or More Wells’, with the associated consequence to exceed the MAOP.
The analysis has been performed by use of the following analytical techniques:
Failure Mode and Effects Analysis (Bottom-Up Approach)
List all equipments within the Isolation System Determine the failure modes of each equipment Determine what effect each failure mode has on the operation of the Isolation System Assign probabilities to Failure Modes
All the base data used for calculations within the FMEA are from industry standard auditable sources (e.g. OREDA) and the references are provided in the FMEA worksheets.
Fault Tree Analysis (Top-Down Approach)
Establish the ‘TOP’ Event (Failure to Isolate One or More Wells) Determine which failure modes affect the operation of the Isolation System Determine at what level each failure mode impacts on the safe operation of the Isolation
System Use the fault tree logic to calculate the probability of unsafe operation
The calculated probability for ‘Failure to Isolate One or More Wells’ is 4.5 x 10⁻⁴ (0.00045), which is within the recognised industry probability integrity level of 0.0001 to 0.001.
1.3 SUMMARY
The Landfall Valve Installation (LVI) is the overpressure protection system for the onshore pipeline. The Wells Isolation System is the overpressure protection system for the offshore pipeline.
The calculation of the likelihood of failure of a safety protection system at the moment it is demanded to act is known as the Probability of Failure on Demand (PFD). In the industry, the realistic PFD that is attainable for a safety system is a PFD of between 0.0001 to 0.001 which represents a probability of a safety system failing to perform on demand of better than 1 in 1000 occurrences.
Both the offshore pipeline and onshore pipeline over pressurisation protection systems have a PFD which is better than 1 in 1000 occurrences.
SHELL E&P IRELAND LIMITED
CORRIB GAS FIELD DEVELOPMENT PROJECT
Q4.7 – MATERIALS AND CORROSION MANAGEMENT PREMISES
DOCUMENT No: COR 39 SH 0002
Corrib Onshore Pipeline EIS Q4.7 – Materials and Corrosion Management Premises
COR-39-SH-0002 ii
TABLE OF CONTENTS
1 PURPOSE AND SCOPE............................................................................................................ 12 GENERAL FACILITIES AND MATERIALS DESCRIPTION..................................................... 23 DESIGN PREMISES .................................................................................................................. 44 CORROSION AND OTHER MATERIALS THREATS............................................................... 5
4.1 FAILURE MODES .............................................................................................................. 5
4.2 INTERNAL THREATS.......................................................................................................... 6
4.2.1 CO2 and Organic acid corrosion....................................................................... 6
4.2.2 Top of the Line (TOL) Corrosion ...................................................................... 7
4.2.3 Preferential weld corrosion............................................................................... 7
4.2.4 Galvanic corrosion............................................................................................ 7
4.2.5 H2S corrosion.................................................................................................... 8
4.2.6 Microbial induced corrosion.............................................................................. 8
4.2.7 Corrosion by hydrotest water............................................................................ 8
4.2.8 Erosion.............................................................................................................. 9
4.2.9 Mercury embrittlement...................................................................................... 9
4.2.10 Stress Corrosion Cracking (SCC) .................................................................... 9
4.2.11 Stray current corrosion ................................................................................... 10
4.2.12 Overall assessment of internal corrosion ....................................................... 10
4.3 EXTERNAL THREATS ...................................................................................................... 10
4.3.1 External corrosion........................................................................................... 10
4.3.2 Pitting corrosion.............................................................................................. 10
4.3.3 Stress Corrosion Cracking (SCC) .................................................................. 11
4.3.4 Stray current corrosion ................................................................................... 11
4.3.5 Hydrogen Induced Stress Cracking................................................................ 11
4.4 MECHANICAL THREATS .................................................................................................. 12
4.4.1 Fracture .......................................................................................................... 12
4.4.2 Fatigue............................................................................................................ 15
4.4.3 Pressure sheath failure................................................................................... 15
5 CORROSION MITIGATION ..................................................................................................... 165.1 INTERNAL BARRIERS ...................................................................................................... 16
5.2 EXTERNAL BARRIERS ..................................................................................................... 16
6 CORROSION INHIBITION ....................................................................................................... 176.1 CORROSION INHIBITOR SELECTION ................................................................................. 17
6.2 CORROSION INHIBITOR AVAILABILITY .............................................................................. 17
7 PIPELINE CORROSION MONITORING REQUIREMENTS ................................................... 187.1 INTERNAL ...................................................................................................................... 18
Corrib Onshore Pipeline EIS Q4.7 – Materials and Corrosion Management Premises
COR-39-SH-0002 iii
7.1.1 Corrosion monitoring philosophy.................................................................... 18
7.1.2 Field Signature Monitor (FSM) spool.............................................................. 18
7.1.3 FSM Corrosion data handling......................................................................... 18
7.1.4 Onshore corrosion monitoring ........................................................................ 19
7.1.5 Sand monitoring ............................................................................................. 19
7.2 EXTERNAL ..................................................................................................................... 19
7.2.1 Coating condition............................................................................................ 19
7.2.2 Offshore cathodic protection system.............................................................. 19
7.2.3 Onshore cathodic protection system.............................................................. 19
7.3 SAMPLING ..................................................................................................................... 20
8 OTHER PIPELINE REQUIREMENTS...................................................................................... 218.1 PIPELINE PRE-COMMISSIONING & COMMISSIONING .......................................................... 21
8.2 OPERATIONAL PIGGING .................................................................................................. 21
8.3 INTELLIGENT PIGGING .................................................................................................... 21
9 DESIGN RE-ASSESSMENT.................................................................................................... 2210 REFERENCES ......................................................................................................................... 23
LIST OF TABLES
Table 2.1: Corrosion Allowances and Relative Position in the Pipeline Route from the Subsea Manifold................................................................................................................................ 3
Table 4.1: Critical failure modes .......................................................................................................... 5Table 4.2: Sour Service Limits ............................................................................................................. 8Table 4.3: Lower Design Temperatures ............................................................................................ 12Table 4.4: CTOD Values for the Longitudinal Seam Weld............................................................... 13
Corrib Onshore Pipeline EIS Q4.7 – Materials and Corrosion Management Premises
COR-39-SH-0002 1
1 PURPOSE AND SCOPE
This document is intended to describe the materials and corrosion management requirements for the design and installation of the Corrib pipeline. It is a “live” document and will be updated during the project execution phase to reflect any changes that affect materials or corrosion management.
It forms the basis for the corrosion management strategy during the operations phase. It also describes erosion and mechanical degradation threats including fracture.
It covers all elements of the pipeline system from the wellheads to the inlet of the Terminal.
This document covers the requirements of the following deliverables defined in the Shell Discipline Controls & Assurance Framework:
- Materials Selection Report
- Corrosion Inhibition System Design
- MCI Failure Modes and Effects Analysis Report
This document also provides the basis for compliance with Section 9 of I.S. EN 14161, Corrosion Management.
Corrib Onshore Pipeline EIS Q4.7 – Materials and Corrosion Management Premises
COR-39-SH-0002 2
2 GENERAL FACILITIES AND MATERIALS DESCRIPTION
The Corrib reservoir will be produced from an 8 slot subsea manifold via an 83.5km 20” pipeline to the landfall (at Broadhaven Bay), through a Landfall Valve Installation (LVI) and 8.3km onshore pipeline to the Terminal (at Bellanaboy Bridge). There are currently 3 cluster wells P101, P4 and P6 (close to the manifold) and 3 more satellite wells P3, P2 & P5 (1.7km, 2.3km and 2.4km away from the manifold respectively). Well flows will be commingled at the main subsea manifold. There is also a smaller subsea manifold at the P5 satellite well to which P2 is connected.
The in-field flexible jumpers and flowlines (6” & 8”) between the wells and manifolds have a 316L carcass and a Coflon (Polyvinylidene Fluoride) pressure sheath which is not degraded by methanol. The subsea manifold pipework, valves and fittings have been fabricated from 22%Cr duplex stainless steel. The subsea connection hubs are 25%Cr super-duplex stainless steel except for the 16” connection hub for the pig launcher which is AISI8360 overlay clad with corrosion resistant Alloy 625, and the production hub which is F65 overlay clad with Alloy 625. The small bore methanol supply and hydraulic pipework is fabricated from 316L.
The pipeline tie-in spool is fabricated from a small section of 22%Cr duplex stainless steel and 27.1mm X-70 grade carbon steel to DNV OS F-101:2000 (SAWL 485 II FD). The first two bends of the tie-in spool after the 22%Cr duplex stainless steel section have been internally clad with a 3.5mm layer of Alloy 625. The FSM corrosion monitoring spool will be welded into the tie-in spool.
The pipeline (both on- and offshore sections) is X-70 carbon steel to DNV OS F-101 (SAWL 485 II FD). Corrosion mitigation of carbon steel pipeline will be achieved with corrosion inhibitor and a corrosion allowance that varies along the length (minimum of 1mm). The pipeline has not been specified to sour service standards [1]. The pipeline is coated with either a three-layer polypropylene coating, or asphalt enamel and concrete coating, depending on the location in the pipeline route.
The offshore pipeline has an internal coating (girth weld areas excepted) from approximately 5.5km from the Corrib field to the landfall. The Pipeguard P-100 flow coating was applied for preservation purposes during storage and was removed from the first 5.5km prior to installation to avoid the coating blistering during service at elevated temperatures in this section. Testing showed the coating to be suitable at ambient temperature. All onshore linepipe is internally coated with the same system. No benefit is taken for the internal coating with respect to corrosion because of the exposed weld areas.
The LVI comprises a 16” loop with pressure protection and isolation valves with a 4” bypass and associated valves. The 16” isolation valves are carbon steel overlay welded with corrosion resistant Alloy 625, and the 16” pressure protection valves and bypass valves are 22%Cr duplex stainless steel. The 16” loop and 4” bypass pipework will be fabricated with 22%Cr duplex stainless steel. The main 20” pipeline and valve within the LVI are carbon steel overlay welded with corrosion resistant Alloy 625.
The onshore pipeline will be routed under the estuary via a 4.8km long 4.2m maximum diameter tunnel. The tunnel will be backfilled with cementatious grout.
The subsea facilities are controlled by means of a multiplex electro-hydraulic system served by three umbilicals originating at the onshore terminal. At the LVI location, these are combined in a single umbilical to the Corrib field. The umbilical also transports methanol (for hydrate inhibition) and corrosion inhibitor from the Terminal to the subsea facilities. Two spare cores of the umbilical will be used for the disposal of treated produced water from the Terminal to the Corrib field. All umbilical cores are 25%Cr super-duplex stainless steel which is resistant to internal corrosion for the Corrib fluids and operating conditions and to external corrosion by seawater/ground-water. For the umbilical tubes which are exposed to aerated produced water, 25%Cr super-duplex stainless steel is also resistant to crevice corrosion up to 20°C and higher if biocidal control is applied as intended. 316L is not suitable for exposure to aerated produced water and any 316L components in the produced water return system have been replaced with 25%Cr super-duplex stainless steel. The umbilical core
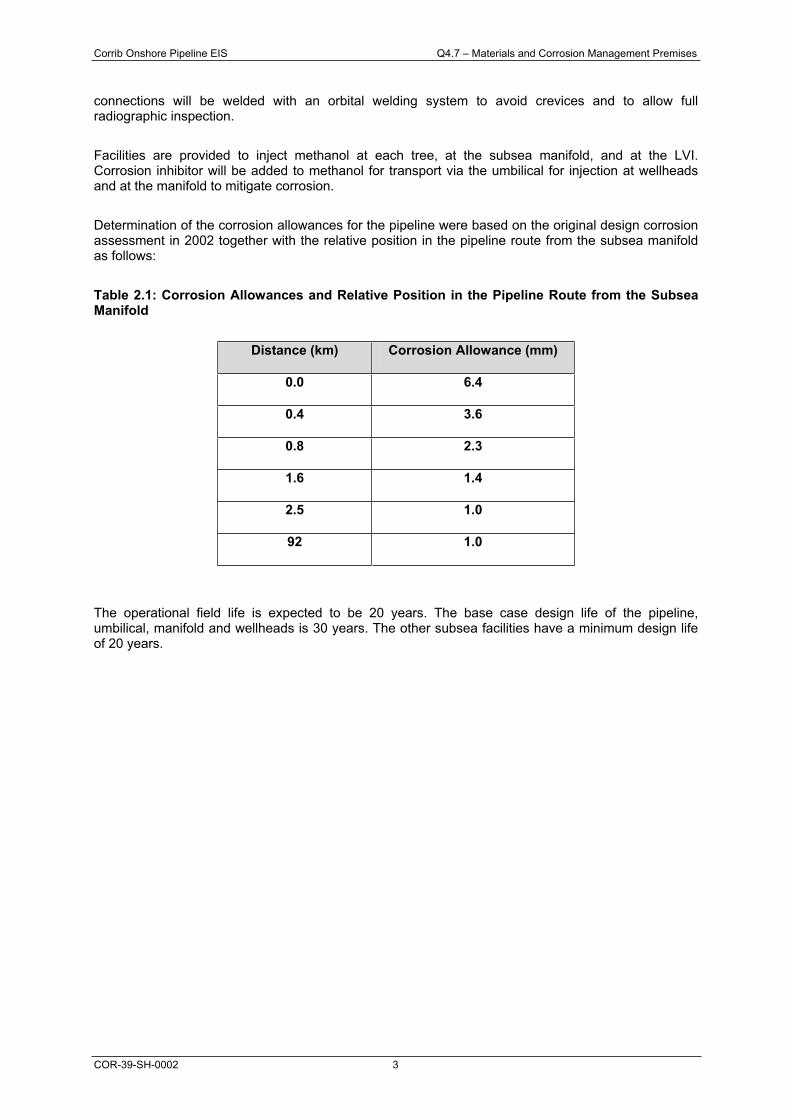
Corrib Onshore Pipeline EIS Q4.7 – Materials and Corrosion Management Premises
COR-39-SH-0002 3
connections will be welded with an orbital welding system to avoid crevices and to allow full radiographic inspection.
Facilities are provided to inject methanol at each tree, at the subsea manifold, and at the LVI. Corrosion inhibitor will be added to methanol for transport via the umbilical for injection at wellheads and at the manifold to mitigate corrosion.
Determination of the corrosion allowances for the pipeline were based on the original design corrosion assessment in 2002 together with the relative position in the pipeline route from the subsea manifold as follows:
Table 2.1: Corrosion Allowances and Relative Position in the Pipeline Route from the Subsea Manifold
Distance (km) Corrosion Allowance (mm)
0.0 6.4
0.4 3.6
0.8 2.3
1.6 1.4
2.5 1.0
92 1.0
The operational field life is expected to be 20 years. The base case design life of the pipeline, umbilical, manifold and wellheads is 30 years. The other subsea facilities have a minimum design life of 20 years.

Corrib Onshore Pipeline EIS Q4.7 – Materials and Corrosion Management Premises
COR-39-SH-0002 4
3 DESIGN PREMISES
The maximum CO2 content from the Corrib reservoir is 0.32%. No H2S has been observed in the test wells and is not expected. The organic acid concentration of the condensed water is expected to be maximum 10 mg/l.
The formation water chemistry analyses of the Corrib reservoir show a relatively high chloride content (197,158 mg/l), an organic acid concentration of 100 mg/l and a low bicarbonate concentration of <5 mg/l.
Production is not expected to vary significantly (Corrib is not a swing producer).
The pressures of the pipeline system are:
Wellhead shut-in: 345 barg
Flowing wellhead (max): 272 barg
Offshore Pipeline design pressure: 345 barg
Offshore MAOP: 150 barg
Onshore Pipeline design pressure: 144 barg
Onshore MAOP: 100 barg
Normal operating pressure at Terminal inlet: 85 barg
The temperatures of the pipeline system are:
Upper design offshore pipeline inlet: 74°C
Flowing wellhead (initial): 61°C
Flowing onshore pipeline inlet: 2 to 10°C
Lower design temperatures are given in Table 4.3
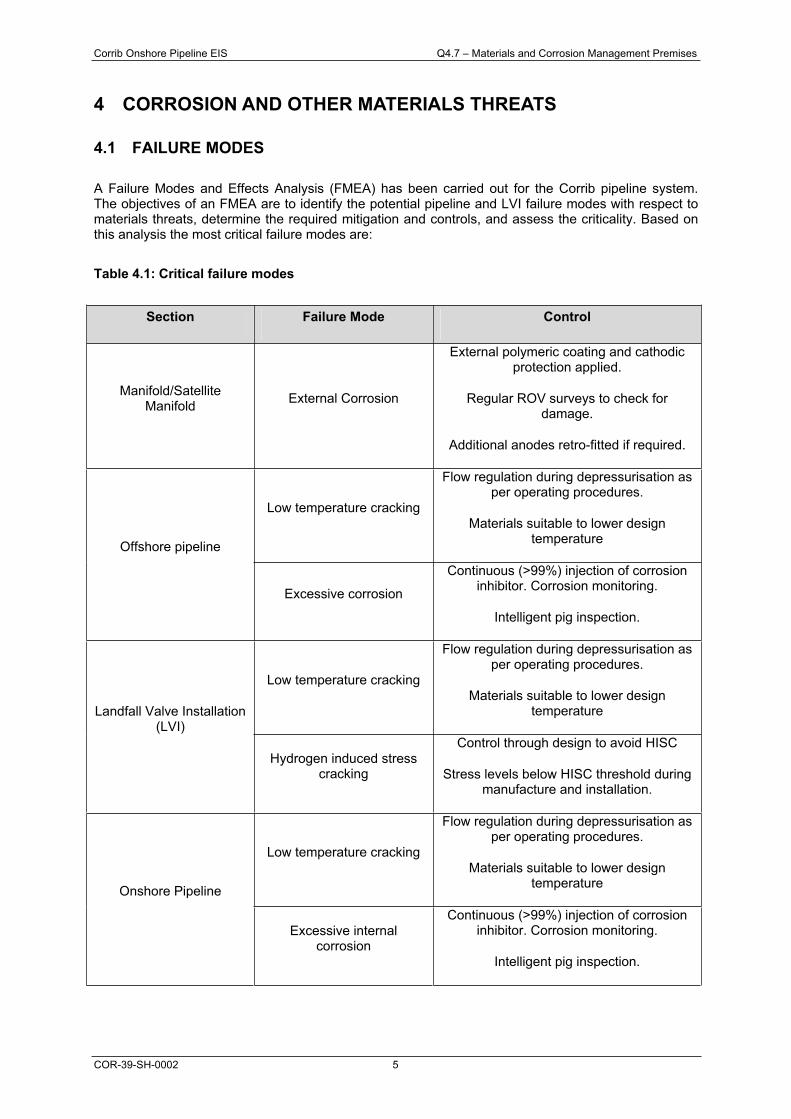
Corrib Onshore Pipeline EIS Q4.7 – Materials and Corrosion Management Premises
COR-39-SH-0002 5
4 CORROSION AND OTHER MATERIALS THREATS
4.1 FAILURE MODES
A Failure Modes and Effects Analysis (FMEA) has been carried out for the Corrib pipeline system. The objectives of an FMEA are to identify the potential pipeline and LVI failure modes with respect to materials threats, determine the required mitigation and controls, and assess the criticality. Based on this analysis the most critical failure modes are:
Table 4.1: Critical failure modes
Section Failure Mode Control
Manifold/SatelliteManifold
External Corrosion
External polymeric coating and cathodic protection applied.
Regular ROV surveys to check for damage.
Additional anodes retro-fitted if required.
Low temperature cracking
Flow regulation during depressurisation as per operating procedures.
Materials suitable to lower design temperature
Offshore pipeline
Excessive corrosion
Continuous (>99%) injection of corrosion inhibitor. Corrosion monitoring.
Intelligent pig inspection.
Low temperature cracking
Flow regulation during depressurisation as per operating procedures.
Materials suitable to lower design temperatureLandfall Valve Installation
(LVI)
Hydrogen induced stress cracking
Control through design to avoid HISC
Stress levels below HISC threshold during manufacture and installation.
Low temperature cracking
Flow regulation during depressurisation as per operating procedures.
Materials suitable to lower design temperature
Onshore Pipeline
Excessive internal corrosion
Continuous (>99%) injection of corrosion inhibitor. Corrosion monitoring.
Intelligent pig inspection.
Corrib Onshore Pipeline EIS Q4.7 – Materials and Corrosion Management Premises
COR-39-SH-0002 6
The relevant corrosion, erosion and mechanical threats and mitigations identified during the FMEA for the Corrib pipeline system are explained in more detail below.
4.2 INTERNAL THREATS
4.2.1 CO2 and Organic acid corrosion The primary corrosion threat to the carbon steel pipeline is CO2 acid corrosion which can occur when carbon dioxide dissolves in water to form carbonic acid. The gas is non-corrosive until it cools below the water dew point at which point it is at its most corrosive. As the temperature and pressure change some water will condense upstream in the well bores and/or flowlines and it continues to condense in the pipeline until the gas reaches ambient temperature at sea bed conditions. Alternatively formation water may be produced from the reservoir in which the CO2 can also dissolve. The corrosivity of the fluids reduces along the pipeline as the temperature decreases and the pH increases due to saturation of ferrous ions.
The presence of organic acids can increase the corrosivity especially in systems with a relatively low CO2 partial pressure. The organic acid content for the condensed water case is low (10 ppm) but increases significantly (100 ppm) should formation water be produced.
The carbon dioxide content of the Corrib gas is relatively low. The corrosion assessment (see Appendix Q4.9) predicts that the maximum uninhibited corrosion rate is 1.3mm/yr at a point near the manifold. After year 3 the corrosion rate will decrease with time as the wellhead pressures decline. The expected flow regime is annular dispersed for the full field life so corrosion can occur at any point around the circumference of the pipe and not just at the bottom of the line (BOL). Should formation water be produced the maximum predicted uninhibited corrosion rate is 9.9mm/yr, but is generally 2.5 to 6 mm/yr. This reflects the greater corrosivity of the higher organic acid content.
The maximum predicted uninhibited corrosion rate for the onshore pipeline is initially 0.12mm/yr for the condensed water case and 0.2mm/yr should formation water be produced. The predicted internal CO2
corrosion rates are described in detail in Appendix Q4.9. It should be noted that if significant formation water is produced the relevant well will be subject to intervention or shut-in.
To mitigate internal CO2 and organic acid corrosion it is common practice to inject corrosion inhibitor which forms a barrier against the corrosive fluids. Another method is to inject glycol or methanol which are miscible with the corrosive water and further reduce the corrosivity. For the Corrib pipeline the threat of carbon dioxide corrosion will be mitigated primarily by injecting corrosion inhibitor but will also benefit from the presence of methanol. The maximum predicted inhibited corrosion rate for the onshore pipeline is <0.05mm/yr and this has been verified by initial corrosion inhibitor testing.
The annular dispersed flow regime for the full field life means that water accumulation at low points in the pipeline is unlikely to occur. There are no significant low points in the offshore pipeline but there will be a low point in the onshore pipeline where it passes through the tunnel. In the unlikely event that pockets of fluid collect in this low point the water soluble corrosion inhibitor and methanol will protect the pipe from corrosion.
Testing has shown that the corrosion rate can be adversely affected by the presence of oxygen in the methanol. The oxygen content in the methanol is maintained at a low level by nitrogen blanketing of the methanol storage tanks and will be reduced to a negligible level (<20 ppb) with application of oxygen scavenger in the Terminal.
For sections of the pipeline system where protection of the carbon steel pipe by the film forming corrosion inhibitor cannot be assured, e.g. due to insufficient length to establish the film or where there is turbulent flow, corrosion resistant materials have been used. This includes the flexible pipelines from the satellite wellheads, the subsea manifold pipework & valves and the LVI pipework & valves. The
Corrib Onshore Pipeline EIS Q4.7 – Materials and Corrosion Management Premises
COR-39-SH-0002 7
section of onshore pipeline and 20” valve within the LVI has also been overlay welded with Alloy 625 because of the potential for turbulent flow and the presence of stagnant conditions during normal operation.
A computational fluid dynamics (CFD) analysis has shown that the tie-in spool from the subsea manifold to the PLEM requires additional protection to the first bend to allow full circumferential protection of the pipe by the corrosion inhibitor. The pipe from the manifold to the first bend is therefore 22%Cr duplex stainless steel and both the first and second bends have been overlay welded with Alloy 625.
4.2.2 Top of the Line (TOL) Corrosion CO2 or organic acid corrosion can occur in pipelines where the flow regime is stratified and condensation occurs at the top of the line. This is particularly acute where the hot gas contacts a relatively cool (uninsulated) area of the pipeline typically at the inlet or at cold spots close to the inlet. The corrosion inhibitor does not protect the top of the line but mitigation is provided by the co-condensing methanol.
The expected flow regime over the full length of the Corrib pipeline is annular dispersed for the 20 year field life which precludes TOL corrosion as a mechanism.
However, TOL corrosion tests carried out at IFE (Institute for Energy Technology, Norway) for simulated Corrib conditions at the pipeline inlet showed that TOL rates were significantly lower in the presence of methanol. TOL corrosion rate without methanol at 60ºC was 0.2mm/yr while with methanol the rates were well below 0.1mm/yr. No pitting or other localised corrosion was observed in any of the tests.
Based on the TOL corrosion testing there is sufficient corrosion allowance at pipeline inlet (6.4mm) to mitigate this mechanism should stratified flow conditions occur. Similarly, should stratified flow occur in the onshore pipeline no TOL corrosion is expected because of the negligible condensation rate and presence of methanol.
4.2.3 Preferential weld corrosion Pipelines in wet gas/condensate service are known to be susceptible to preferential weld CO2
corrosion (PWC) especially when low conductivity fluids such as condensed water are present. Elements such as nickel in the weld can exacerbate PWC. Although avoidance of deliberate nickel additions to welding consumables can reduce the risk of PWC, mitigation is best provided by corrosion inhibition. To ensure that the selected corrosion inhibitor is capable of mitigating PWC, offshore production welds have been included in the corrosion inhibitor test programme. Initial results indicate no significant PWC problem.
4.2.4 Galvanic corrosion Galvanic corrosion can occur as a result of differences in electrochemical potential between metals, such as the interface between the internal CRA clad layer of the tie-in spool and the adjacent carbon steel pipe, or the duplex stainless steel T-piece and the adjacent steel pipe at the LVI. This type of corrosion has not generally been observed in producing oil and gas systems [2]. This is because effective inhibition limits the anodic reaction on the steel and the absence of oxygen prevents a strong cathodic reaction at the CRA surface.
Mitigation at the offshore tie-in spool and T-pieces will be provided by the corrosion allowance, and at the LVI wall thickness checks can be carried out to confirm the absence of this mechanism.
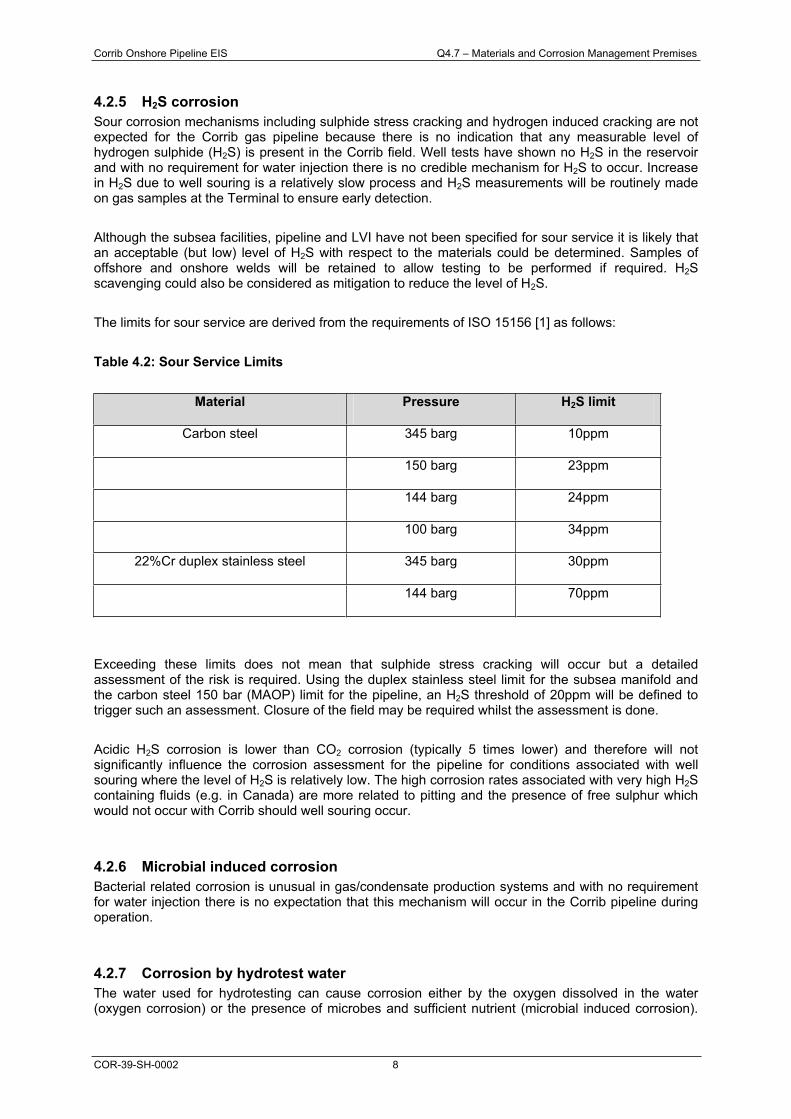
Corrib Onshore Pipeline EIS Q4.7 – Materials and Corrosion Management Premises
COR-39-SH-0002 8
4.2.5 H2S corrosion Sour corrosion mechanisms including sulphide stress cracking and hydrogen induced cracking are not expected for the Corrib gas pipeline because there is no indication that any measurable level of hydrogen sulphide (H2S) is present in the Corrib field. Well tests have shown no H2S in the reservoir and with no requirement for water injection there is no credible mechanism for H2S to occur. Increase in H2S due to well souring is a relatively slow process and H2S measurements will be routinely made on gas samples at the Terminal to ensure early detection.
Although the subsea facilities, pipeline and LVI have not been specified for sour service it is likely that an acceptable (but low) level of H2S with respect to the materials could be determined. Samples of offshore and onshore welds will be retained to allow testing to be performed if required. H2Sscavenging could also be considered as mitigation to reduce the level of H2S.
The limits for sour service are derived from the requirements of ISO 15156 [1] as follows:
Table 4.2: Sour Service Limits
Material Pressure H2S limit
Carbon steel 345 barg 10ppm
150 barg 23ppm
144 barg 24ppm
100 barg 34ppm
22%Cr duplex stainless steel 345 barg 30ppm
144 barg 70ppm
Exceeding these limits does not mean that sulphide stress cracking will occur but a detailed assessment of the risk is required. Using the duplex stainless steel limit for the subsea manifold and the carbon steel 150 bar (MAOP) limit for the pipeline, an H2S threshold of 20ppm will be defined to trigger such an assessment. Closure of the field may be required whilst the assessment is done.
Acidic H2S corrosion is lower than CO2 corrosion (typically 5 times lower) and therefore will not significantly influence the corrosion assessment for the pipeline for conditions associated with well souring where the level of H2S is relatively low. The high corrosion rates associated with very high H2Scontaining fluids (e.g. in Canada) are more related to pitting and the presence of free sulphur which would not occur with Corrib should well souring occur.
4.2.6 Microbial induced corrosion Bacterial related corrosion is unusual in gas/condensate production systems and with no requirement for water injection there is no expectation that this mechanism will occur in the Corrib pipeline during operation.
4.2.7 Corrosion by hydrotest water The water used for hydrotesting can cause corrosion either by the oxygen dissolved in the water (oxygen corrosion) or the presence of microbes and sufficient nutrient (microbial induced corrosion).
Corrib Onshore Pipeline EIS Q4.7 – Materials and Corrosion Management Premises
COR-39-SH-0002 9
Microbial induced corrosion is a particular threat if the hydrotest water is left in the pipeline for extended periods (typically >2 weeks) without treatment.
Following hydrotesting the offshore pipeline was filled and sealed with filtered seawater treated with a cocktail of oxygen scavenger, biocide and corrosion inhibitor. Provided the pipeline remains sealed then oxygen corrosion and microbial corrosion are not expected.
The onshore pipeline and LVI will likely be hydrotested with potable water. The exact procedure is still to be defined but is likely to involve filtering and pH control with sodium bicarbonate to mitigate corrosion. It is unlikely that the onshore pipeline will be left for an extended period with hydrotest water.
4.2.8 Erosion Internal erosion could potentially occur as a result of the presence of contaminants such as sand, liquids or proppant. The Corrib reservoir is a tight formation and is not expected to produce sand. One of the wells (P5) has been fractured and contains a hard ceramic proppant which may be produced back from the well. However, no significant proppant production was observed during clean-up of the well in 2001 and no proppant production was observed during a subsequent well test in 2008. An assessment of erosion by proppant indicated no significant erosion (see Appendix Q4.9).
Should solids production occur likely areas of erosion damage would be at the wellhead choke in the field, the bends in the pipeline spool just downstream of the manifold, and at the T-piece and first bend of the LVI. Should solids production occur monitoring of the performance of the subsea chokes will give an early indication if there is a significant problem in the early years of production. In addition an acoustic monitor is fitted to the subsea manifold which will provide an alert of any significant solids production. If monitoring indicates solids production then the T-piece and bends of the LVI can be subject to wall thickness monitoring to check for erosion damage. Production of solids would result in a well intervention or shut-in of the well.
Furthermore, the flow velocities in the pipeline are well below the threshold values required to cause flow induced erosion-corrosion or liquid droplet induced erosion (typically 20m/s and 38m/s respectively for carbon steel).
4.2.9 Mercury embrittlement Levels of mercury are relatively low and the materials used in the pipeline are not susceptible to this mechanism.
4.2.10 Stress Corrosion Cracking (SCC) There are no credible internal stress corrosion cracking mechanisms for carbon steel with the Corrib production conditions. The stress corrosion cracking mechanism observed in town gas pipelines as reported in the UKOPA database [3] will not occur in the Corrib system. In addition to CO2 this mechanism requires the presence of carbon monoxide and is enhanced by oxygen. Carbon monoxide and oxygen are not present in the Corrib gas.
Chloride stress corrosion cracking of stainless steels can occur in aqueous chloride solutions especially if oxygen is present. For oxygenated systems chloride SCC can occur in stressed components above 60°C for AISI316L stainless steel, 90°C for 22%Cr duplex stainless steel and 120°C for 25%Cr super-duplex stainless steels. For oxygen free conditions these temperatures are higher depending on the chloride content. No chloride SCC is expected for the Corrib production conditions. Alloy 625 is immune to chloride SCC.
Corrib Onshore Pipeline EIS Q4.7 – Materials and Corrosion Management Premises
COR-39-SH-0002 10
4.2.11 Stray current corrosion Stray current corrosion can occur when an isolation joint in the pipeline system fails due to bridging or short-circuiting, typically by internal conductive fluids. This mechanism has been observed in many wet gas pipelines in the Netherlands. Rate of metal loss can be high and in this case is normally internal.
Following a specialist review by an independent consultant an isolation joint was not installed at the beach to isolate the offshore and onshore cathodic protection systems. This is covered in more detail in section 7.2.3 of this document. However, there is an isolation joint at the interface with the Terminal and this will require periodic monitoring for this mechanism.
4.2.12 Overall assessment of internal corrosion The threat from internal corrosion is primarily CO2 and organic acid corrosion but for the onshore section of the pipeline it is relatively benign. For normal operating conditions the maximum predicted corrosion rate is 0.12mm/yr without corrosion inhibition and <0.05mm/yr with corrosion inhibition. This inhibited corrosion rate is slightly higher than the rate that might be expected for a dry gas line, and is significantly less than might be expected for a pipeline producing oil where additional threats such as under-deposit corrosion and microbial induced corrosion can also affect the degradation rate. This assessment has been used in relation to the selection of pipeline failure databases for the QRA (see Appendix Q6.4).
4.3 EXTERNAL THREATS
4.3.1 External corrosion External corrosion of the pipeline system and subsea facilities can occur as a result of the corrosivity of seawater and/or groundwater. For buried sections of the pipeline where anaerobic conditions may exist, microbial action can increase the corrosion rate. External corrosion is potentially most severe where the pipe temperature is highest.
External corrosion of the pipeline system (offshore pipeline, LVI, and onshore pipeline) and the subsea facilities (X-trees, end fittings of flexibles, subsea manifold structure and pipework) is mitigated by high performance coatings and the application of an electrically continuous cathodic protection system.
The design and installation of the tunnel section of the onshore pipeline will ensure mitigation of potential corrosion during service. A thorough inspection of the coating system will be carried out following installation and any damage will be repaired. Once installation is complete the tunnel will be filled with a cementatious grouting compound. The grout typically has shrinkage of 2 to 5% and normally takes over 24 hours to harden. As it shrinks on to the pipe it will not damage the coating and will form a protective layer which should exclude free water and oxygen. The grout also has a pH of 12 which is alkaline and would effectively passivate the steel against corrosion if exposed to water. The grout is conductive which will allow the pipeline cathodic protection system to protect any exposed steel should water penetrate the grout.
4.3.2 Pitting corrosion Stainless steels are susceptible to pitting corrosion at relatively low temperatures in a damp saline environment. AISI 316L stainless steel can suffer pitting at ambient temperatures and 22%Cr duplex stainless steel at temperatures above 20°C. Mitigation can be achieved with an external coating and application of cathodic protection will prevent pitting occurring. All AISI 316L and 22%Cr duplex stainless steel components in the Corrib pipeline system and subsea facilities are protected by external coating and/or cathodic protection if subsea or buried.
Corrib Onshore Pipeline EIS Q4.7 – Materials and Corrosion Management Premises
COR-39-SH-0002 11
4.3.3 Stress Corrosion Cracking (SCC) External stress corrosion cracking of the carbon steel onshore pipeline by high pH (carbonate) or near neutral pH mechanisms is not expected. High pH stress corrosion by carbonate-bicarbonate ions requires disbondment of the coating, cyclic loading and a temperature greater than 40°C. The mechanism has not been observed with 3 layer polypropylene coatings. Near neutral pH stress corrosion requires coating disbondment and cyclic loading. The Corrib pipeline is protected with a robust 3 layer polypropylene coating, there is no significant cyclic loading, and the operating temperature will be below 10°C, which precludes these mechanisms.
External chloride stress corrosion cracking can occur in stainless steels if exposed to seawater or ground water but is dependent on the temperature. Chloride SCC can occur in stressed components above 60°C for AISI316L stainless steel, 90°C for 22%Cr duplex stainless steel and 120°C for 25%Cr super-duplex stainless steels. For the Corrib pipeline system the only possible threat would be to AISI316L stainless steel components in the production system of the subsea manifold. These components are protected by the cathodic protection system which removes this threat.
4.3.4 Stray current corrosion External stray current corrosion of a pipeline can occur either due to interference between the cathodic protection system and another nearby current path in earth provided by a low resistance metallic object such as another pipeline, or from alternating current sources such as overhead high voltage power supply lines (also referred to as AC corrosion).
Mitigation can be achieved by thorough review of underground facilities in the vicinity of the onshore pipeline to identify possible sources of stray current and to accommodate these in the cathodic protection system design and installation. There are no overhead high voltage power lines in the vicinity of the Corrib pipeline.
Interference with the cathodic protection system by induced current from the umbilical is negligible because of the low voltage (1kV) and screening of the power cables.
4.3.5 Hydrogen Induced Stress Cracking Duplex stainless steels are vulnerable to failure by hydrogen induced stress cracking (HISC) caused by hydrogen uptake when the duplex stainless steel is exposed directly to the cathodic protection and subject to high strain. Mitigation can be provided by following the DNV F-112 guideline [4] to avoid HISC, and the risk can be reduced by applying a high performance coating.
All the duplex stainless steel components of the manifolds and LVI have been assessed against DNV F-112. As a result some minor modifications (grinding of the weld caps) were required for the P5 manifold pipework. For the LVI the weld caps of the duplex components will be provided with a nickel hydrogen barrier to reduce the risk further. Procedures have been/will be implemented to ensure high stresses are not created during fabrication or installation, such as imposed loads at the flexible/manifold connections.
A similar hydrogen embrittlement mechanism can occur at the interface between Alloy 625 cladding and a high strength steel substrate if subject to high stress and exposed to cathodic protection. This mechanism can be mitigated through design of the component, avoidance of PWHT following cladding, and control of the welding procedure. Application of a coating can reduce the risk but often susceptible clad components such as hubs are left bare or the coating is damaged during installation. The only component in the Corrib pipeline system at risk to this mechanism is the hub for the pig launcher connection. Review of the welding procedure indicated that the risk of this mechanism is negligible.
Corrib Onshore Pipeline EIS Q4.7 – Materials and Corrosion Management Premises
COR-39-SH-0002 12
4.4 MECHANICAL THREATS
4.4.1 Fracture
4.4.1.1 Basis for Fracture Control Plan
All components of the pipeline system have been designed and fabricated in accordance with I.S. EN 14161 and I.S. 328 to resist brittle or ductile fracture in all operating scenarios.
Under start-up or blowdown conditions it is possible that sections of the pipeline system will experience low temperatures due to the Joule-Thomson cooling effect. The most likely low temperature scenarios are opening up cold wells to a depressurised pipeline, equalisation of a pressurised offshore pipeline with a depressurised onshore pipeline, or blow-down of the pipeline system.
The following lower design temperatures apply:
Table 4.3: Lower Design Temperatures
Flexible pipelines* -20°C
Manifold -30°C
Tie-in spool -10°C
PLEM valve 0°C
Offshore pipeline 0°C
LVI -26°C
First 1.15 km of onshore pipeline -20°C
Remaining length of onshore pipeline -10°C
* New flexible for P2 to be rated to -50°C
Operating procedures will be developed to ensure that these lower design temperature limits are not exceeded for all credible low temperature scenarios. Should pressure equalization of the onshore pipeline be required, operational procedures will ensure that adiabatic cooling of the pipeline will be limited such that the lowest temperature in the pipeline at the LVI will be -10oC.
Assessments have been carried out to determine the resistance of the pipe to crack initiation, the critical defect length and hole size with respect to leak before break criterion, and to confirm resistance of the pipeline steel to crack propagation. These form the basis of the fracture control plan and input to the QRA and are summarised below.
4.4.1.2 Fracture Initiation This assessment determined resistance of the pipe to fracture initiation from a planar defect. The calculation method relates the three main variables affecting defect tolerance which are defect size, stress and toughness (CTOD value). If two of these variables are known, a safe level for the third can be calculated for avoidance of failure through crack initiation and plastic collapse. The assessment used the fracture mechanics Level 2 approach in BS 7910 [5].
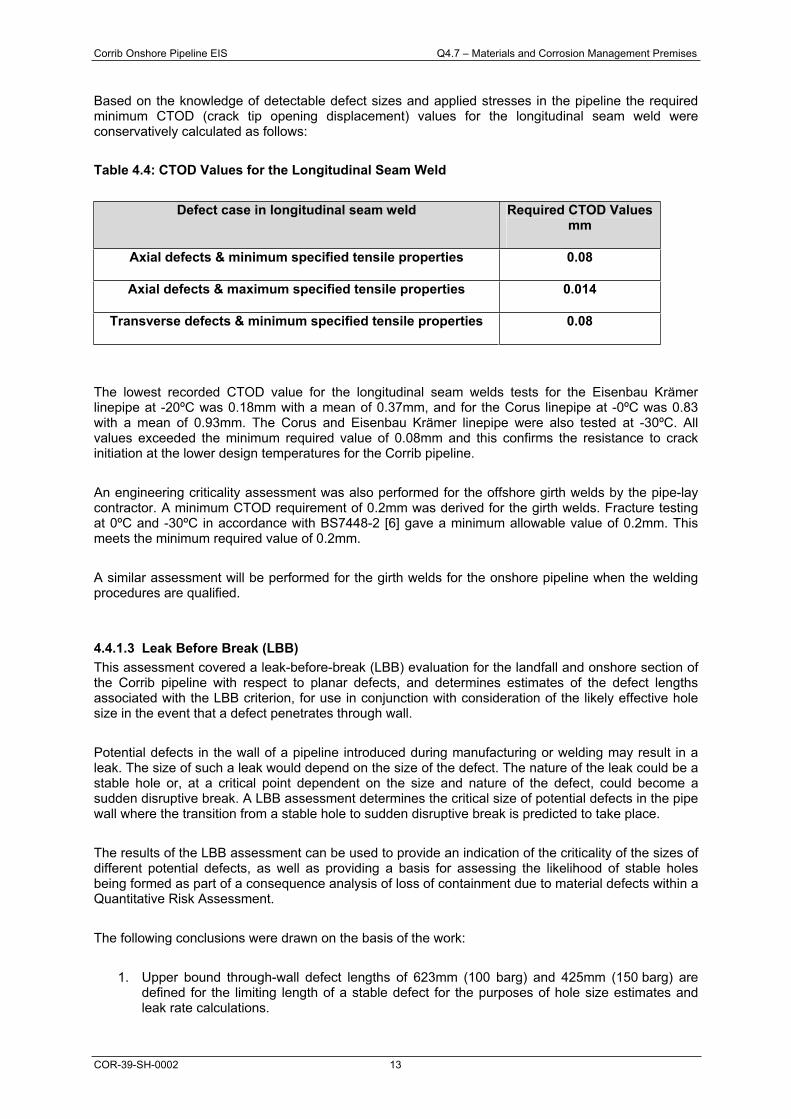
Corrib Onshore Pipeline EIS Q4.7 – Materials and Corrosion Management Premises
COR-39-SH-0002 13
Based on the knowledge of detectable defect sizes and applied stresses in the pipeline the required minimum CTOD (crack tip opening displacement) values for the longitudinal seam weld were conservatively calculated as follows:
Table 4.4: CTOD Values for the Longitudinal Seam Weld
Defect case in longitudinal seam weld Required CTOD Values mm
Axial defects & minimum specified tensile properties 0.08
Axial defects & maximum specified tensile properties 0.014
Transverse defects & minimum specified tensile properties 0.08
The lowest recorded CTOD value for the longitudinal seam welds tests for the Eisenbau Krämer linepipe at -20ºC was 0.18mm with a mean of 0.37mm, and for the Corus linepipe at -0ºC was 0.83 with a mean of 0.93mm. The Corus and Eisenbau Krämer linepipe were also tested at -30ºC. All values exceeded the minimum required value of 0.08mm and this confirms the resistance to crack initiation at the lower design temperatures for the Corrib pipeline.
An engineering criticality assessment was also performed for the offshore girth welds by the pipe-lay contractor. A minimum CTOD requirement of 0.2mm was derived for the girth welds. Fracture testing at 0ºC and -30ºC in accordance with BS7448-2 [6] gave a minimum allowable value of 0.2mm. This meets the minimum required value of 0.2mm.
A similar assessment will be performed for the girth welds for the onshore pipeline when the welding procedures are qualified.
4.4.1.3 Leak Before Break (LBB) This assessment covered a leak-before-break (LBB) evaluation for the landfall and onshore section of the Corrib pipeline with respect to planar defects, and determines estimates of the defect lengths associated with the LBB criterion, for use in conjunction with consideration of the likely effective hole size in the event that a defect penetrates through wall.
Potential defects in the wall of a pipeline introduced during manufacturing or welding may result in a leak. The size of such a leak would depend on the size of the defect. The nature of the leak could be a stable hole or, at a critical point dependent on the size and nature of the defect, could become a sudden disruptive break. A LBB assessment determines the critical size of potential defects in the pipe wall where the transition from a stable hole to sudden disruptive break is predicted to take place.
The results of the LBB assessment can be used to provide an indication of the criticality of the sizes of different potential defects, as well as providing a basis for assessing the likelihood of stable holes being formed as part of a consequence analysis of loss of containment due to material defects within a Quantitative Risk Assessment.
The following conclusions were drawn on the basis of the work:
1. Upper bound through-wall defect lengths of 623mm (100 barg) and 425mm (150 barg) are defined for the limiting length of a stable defect for the purposes of hole size estimates and leak rate calculations.
Corrib Onshore Pipeline EIS Q4.7 – Materials and Corrosion Management Premises
COR-39-SH-0002 14
2. For the purposes of integrity assessment with respect to planar defects, lower bound limiting through wall defect lengths of 196mm (100 barg) and 147mm (150 barg) are defined for the assessment of LBB response.
3. Surface breaking defect analysis has been undertaken to define an envelope of allowable defect dimensions (length and depth) for simplified screening assessment purposes and to understand the general defect tolerance of the pipeline materials.
4. An estimate of the crack opening area has been made for a range of defect lengths, assuming a leak-type failure mode. Of the cases considered the upper bound crack opening area is estimated to be 1410mm2 for 100 barg MAOP and 327mm2 for 150 barg MAOP.
5. Insufficient data have been found in the open literature from which to estimate the crack opening area in the event of a burst-type failure mode.
6. These defect sizes are less conservative but consistent with the assessment carried out by PIE (see Appendix Q6.4).
The results summarised above would indicate that substantial defects would need to be present within the pipe wall for a related loss of containment to become a disruptive break rather than a stable leak through a hole.
4.4.1.4 Running Fracture This assessment compared the material properties of the onshore section of the Corrib pipeline with the code requirements for running brittle or running ductile fracture.
Running brittle fracture describes the propagation of a crack initiated from a flaw in the pipe steel that then runs in a brittle fracture mode extremely rapidly leading to pipeline failure. The initial failure would most likely be prompted by a combination of low temperature and high pressure condition.
Running ductile fracture describes the propagation of a crack initiated from a flaw in the pipe steel that then runs in a ductile fracture mode at a constant speed corresponding to a balance between the local (decompression) pressure level and the steel fracture resistance. If the metal fracture resistance is adequate no steady state fracture propagation can be reached and the fracture will arrest.
It was assessed that running brittle fracture will not occur since, in accordance with I.S. 328 (which exceeds the requirement of I.S. EN 14161), both the Corus linepipe and the Eisenbau Krämer linepipe meet the minimum Drop Weight Tear Test shear area requirement of 75% shear area at 0 C.
It was assessed that running ductile fracture will not occur since, in accordance with I.S. 328 (which exceeds the requirement of I.S. EN 14161) and I.S. EN 10208-2, the minimum required Charpy impact energy is 46 Joule average and 35 Joule minimum for line pipe with a wall thickness up to 25mm and a design factor of 0.72. The Corrib 27.1 mm nominal wall thickness pipe has a design wall thickness of 25.1 mm and a measured Charpy impact energy of average 236 Joule and minimum 145 Joule at -20 C for the Corus linepipe, and average 250 Joule and minimum 171 Joule for the Eisenbau Krämer linepipe at -40 C to -50 C. No criterion is given for a design factor of 0.3, however, taking the 0.72 design factor as a conservative basis the requirements of I.S. 328 and I.S. EN 10208-2 are also easily fulfilled.
Therefore, it was concluded that the Corrib linepipe steel satisfies the code requirements of I.S. EN 14161 and I.S. 328, and a running fracture will not occur in the Corrib pipeline.
4.4.1.5 Effect of cooling at a gas release The possible effect of a drop in temperature by adiabatic cooling (Joule-Thomson effect) caused by rapid release of gas through a small hole has been considered. It has been postulated that this could cause sufficient cooling that the pipe material makes a transition from ductile to brittle regime increasing risk of crack propagation ultimately to full-bore failure.
Corrib Onshore Pipeline EIS Q4.7 – Materials and Corrosion Management Premises
COR-39-SH-0002 15
Assuming a hole size of 10mm initial calculations have shown that a temperature drop of -20oC from the initial fluid temperature in the pipe to the temperature of the gas exiting the hole, bounds all of the simulated blow-down releases for the Corrib pipeline. The effects of this temperature drop only affect the hole close to the outer pipe wall and the temperature of the pipe wall will have recovered to the internal gas temperature within approximately 50mm from the hole perimeter. Ongoing modelling work based on computational fluid dynamics will provide a more accurate, less conservative estimate of this temperature drop.
The typical gas temperature in the onshore pipeline will be 6oC which means a temperature drop at a hole perimeter in these circumstances to -14oC (lowest value). During blow-down or pressure equalization operational procedures will be applied to ensure that adiabatic cooling of the pipeline will be limited such that the lowest value at the LVI will be -10oC. This means a worst case temperature at this location in these circumstances of -30oC, although it is expected that the additional modelling work will predict a higher temperature than this.
Testing has shown that the pipeline steel has good resistance to crack initiation and propagation at low temperature. In the highly unlikely event that crack initiation would occur at a hole, the adjacent steel has the capability to arrest the crack especially as it extends into the higher ductility region associated with the warmer areas of the pipe. Furthermore such an event has never been experienced in practice and is thus generally regarded as hypothetical. It is concluded that failure of the pipe by this mechanism is a non-credible scenario.
4.4.2 Fatigue The likely operating mode of the pipeline and the normal operating pressures make it unlikely that the pipeline will accumulate any significant amount of fatigue damage through stress fluctuations over its service life. The number of significant pressure fluctuations will be monitored on an annual basis from pressure records in the DCS (distributed control system).
Fatigue failure of pipework and small-bore fittings at the LVI is also a threat. This has been assessed on an item-by-item basis using Industry guidelines, and the necessary supports and modifications will be implemented when the LVI is constructed.
4.4.3 Pressure sheath failure The PVDF (Polyvinylidene Fluoride) pressure sheath material of the flexible pipelines can pull out from the end fitting due to leaching of the plasticizer during service. In accordance with current industry practice to avoid this type of failure, the PVDF in the pipe at the end fittings has been subject to a deplasticizing operation prior to assembly. The end fittings and flexible pipe have been designed and manufactured for the full design temperature range.
Corrib Onshore Pipeline EIS Q4.7 – Materials and Corrosion Management Premises
COR-39-SH-0002 16
5 CORROSION MITIGATION
5.1 INTERNAL BARRIERS
To mitigate internal corrosion of the pipeline the primary barrier is corrosion inhibitor delivered continuously in the methanol to the injection points in the subsea wellheads and manifold via the umbilical. The methanol also provides a degree of corrosion protection. Corrosion resistant materials have been selected for all areas where protection by corrosion inhibitor cannot be assured.
As a secondary barrier the carbon steel pipeline has been provided with a corrosion allowance which varies along the length. Should this corrosion allowance be consumed, a corrosion damage assessment will be carried out to confirm the continued technical integrity of the pipeline. A procedure for corrosion damage assessment has been developed using the DNV RP F-101 methodology (see Appendix Q4.8). Corrective actions for sections of corroded pipeline will be included in the Pipeline Integrity Management Scheme (PIMS - see Appendix Q5.2).
5.2 EXTERNAL BARRIERS
To mitigate external corrosion of the pipeline the primary barrier is a robust coating of either, a combination of asphalt enamel and concrete weight coating, or a 3 layer polypropylene coating. The field joints use a standard shrink sleeve system. For the onshore pipeline an additional epoxy primer will be used under the shrink sleeve.
As a secondary barrier to external corrosion should the coating be damaged, the pipeline is protected by a cathodic protection system. The offshore pipeline is protected by sacrificial aluminium anodes. The LVI and onshore pipeline are protected by an impressed current system. A cathodic potential of –850mV versus Ag/AgCl2 reference electrode is required to ensure protection of carbon steel for aerobic conditions and –950mV for anaerobic conditions.
Assessment of external corrosion damage and corrective actions will be covered by the same procedures as above.
Corrib Onshore Pipeline EIS Q4.7 – Materials and Corrosion Management Premises
COR-39-SH-0002 17
6 CORROSION INHIBITION
Corrosion inhibition is the primary internal barrier for the carbon steel pipeline. A robust and effective corrosion inhibitor and application regime is essential in order to meet the pipeline design life and maximise life cycle value.
6.1 CORROSION INHIBITOR SELECTION The selected corrosion inhibitor will be carried by the methanol and needs to be fully compatible.
Enterprise Ireland originally ranked a number of different products from vendors but following a Shell review, a new qualification criteria matrix was developed to capture issues not considered previously, including aromatic accumulation in the regenerated methanol, presence of formation water, and presence of oxygen scavenger.
Corrosion inhibitor qualification work will address functional performance (ability to inhibit corrosion) at the specific operating conditions of the Corrib production system, and compatibility with all aspects of the production system including the onshore produced water treatment process. Qualification work is ongoing and a suitable inhibitor has been identified. Testing will be completed by Q3 2010.
6.2 CORROSION INHIBITOR AVAILABILITY A corrosion inhibitor availability of 99% is required to ensure that the design life of the pipeline is met. A spare pump has been provided at the Terminal to ensure that this availability target is achievable.
The specified corrosion inhibitor availability of 99% allows a cumulative inhibitor downtime of 4 days per year. Additional qualification work is underway to determine the persistency of the chosen inhibitor to assess how long it will be able to protect the pipeline after an interruption in corrosion inhibitor application. Extended periods with low inhibitor levels could lead to inhibitor breakdown and potential for higher corrosion rates, especially at the offshore pipeline inlet. This will be reflected in the guidelines for the inhibitor application that will be included in the Corrib pipeline operating manual which will be available prior to commissioning. This will clearly state what action to take if corrosion inhibitor is not available at the required level.
The Production Chemist will define the corrosion inhibitor injection rates based on the corrosion inhibitor test results. The corrosion inhibitor will be applied continuously from the beginning of production to ensure good filming of the inhibitor in the pipeline during start-up.
Corrib Onshore Pipeline EIS Q4.7 – Materials and Corrosion Management Premises
COR-39-SH-0002 18
7 PIPELINE CORROSION MONITORING REQUIREMENTS
It has been shown that corrosion threats can be successfully mitigated. Corrosion monitoring is also required to verify that these mitigations are effective.
7.1 INTERNAL
7.1.1 Corrosion monitoring philosophy As previously discussed the effective application of corrosion inhibitor is essential to reduce and manage corrosion of a carbon steel pipeline. To monitor the effectiveness of this application a comprehensive corrosion monitoring system is required. The aim of this monitoring system is two-fold:
1. To flag the breakdown of the inhibitor application in the pipeline; and
2. To provide corrosion rate data.
The primary means of corrosion monitoring is a subsea FSM spool welded into the pipeline tie-in spool at the Corrib field. This will be supplemented by additional corrosion monitoring, chemical sampling and wall thickness measurements at the onshore Terminal and LVI, as part of a coordinated approach to corrosion management.
A high confidence in the corrosion monitoring data will allow more flexibility in determining requirements for intelligent pigging.
7.1.2 Field Signature Monitor (FSM) spool The deepwater FSM is powered with a hard-wired link from the subsea control module (SSCM), which is powered from the umbilical electrical supply.
The FSM will detect sudden changes in corrosivity due to breakdown of the corrosion inhibitor application, by providing corrosion rate data around the circumference of the pipe over a length of circa 1 metre. The sensitivity of the system can be determined by setting the time between measurements, in accordance with operational requirements. This will be set initially to one set of measurements per hour.
The FSM will be located in the longest section of the 20” pipeline tie-in spool. This location has been chosen because it is sufficiently downstream of the inhibitor injection point to have steady state flow conditions, and it is at the warm end of the pipeline and is therefore likely to experience a higher corrosion rate than the rest of the pipeline.
The required heat transfer coefficient (U) value for the FSM is 70 W/m2K. This matches the maximum U value for the first 28 km of the pipeline at the Corrib end. Therefore the conditions at the FSM will replicate those in the pipeline.
7.1.3 FSM Corrosion data handling Once installed and commissioned, the FSM will have analogue and digital output. The analogue output will consist of spool temperature, maximum corrosion rate, average corrosion rate, and accumulated metal loss. The digital output will consist of the individual FSM pin-pair corrosion measurements and associated data.
Corrib Onshore Pipeline EIS Q4.7 – Materials and Corrosion Management Premises
COR-39-SH-0002 19
A direct link will be installed from the MCS (Master Control Station) to the Plant Instrumentation (PI) system to allow remote real time interrogation. The digital data will be downloaded each month and sent to the FSM contractor for analysis and reporting.
The Terminal Control Room will advise the asset corrosion engineer of any corrosion rate alarms. The corrosion rate alarms will initially be set at 0.2mm/yr (H) and 0.4mm/yr (HH) and will be reviewed if instrument noise causes erroneous alarm events. Each of these alarms will have an individual Tag number.
7.1.4 Onshore corrosion monitoring An ultrasonic “fleximat” which allows continuous monitoring of the wall thickness around the circumference of the pipe will be installed on the 20” pipeline upstream of the pigging tee at the Terminal. In addition an electrical resistance probe will be installed in the 20” pipe downstream of the pigging tee before the slugcatcher. The conditions at these points with respect to pressure, temperature, flow rate and acidity will be identical to those in the onshore pipeline and will therefore give a representative indication of the corrosivity of the fluids in the onshore pipeline.
Additional wall thickness measurements on the above ground section of 20” pipeline at the Terminal will be defined and included in the PIMS.
7.1.5 Sand monitoring A ‘Clamp-on’ acoustic sand-monitoring device has been mounted on the subsea manifold. It will monitor gross flow from all wells and detect any solids production. The device will provide a 4-20mA signal which will be calibrated and captured in the PI system. An alarm setting will be defined during commissioning of the pipeline system.
7.2 EXTERNAL
7.2.1 Coating condition The integrity of offshore coating systems will be monitored for the non-buried sections of the pipeline by regular ROV (remote operated vehicle) surveys as defined in the PIMS (see Appendix Q5.2). For buried sections of the offshore line and for the onshore pipeline any coating breakdown will be detected through the cathodic protection monitoring surveys.
7.2.2 Offshore cathodic protection system Monitoring of the cathodic protection of the offshore pipeline can be achieved for the non-buried sections by ROV inspection of anode consumption, stabbing of the anodes to measure potential, and measurement of potential at any exposed sections (manifold and PLEM), although inspection which disturbs the carbonaceous deposits created by cathodic protection will be avoided where possible. Potential surveys (e.g. trailing wire) will be carried out for both buried and non-buried sections to assess the performance of the cathodic protection system and to identify any anomalies. An offshore cathodic protection inspection and maintenance plan will be defined in the PIMS.
7.2.3 Onshore cathodic protection system The onshore impressed current system will be monitored through checks on the transformer/rectifier up-time and output, standard test posts and coupon polarisation probes, close interval potential surveys (CIPS) and direct voltage current gradient (DCVG) surveys. The cathodic protection design for the section of onshore pipeline in the tunnel will include cathodic protection monitoring facilities.
Corrib Onshore Pipeline EIS Q4.7 – Materials and Corrosion Management Premises
COR-39-SH-0002 20
Particular attention is required for the interface between the offshore and onshore pipelines to ensure that there is no current drain from the offshore pipeline anodes to onshore. Following a detailed assessment it was concluded that the installation of an isolation joint between the offshore and onshore pipeline was not necessary, but potential monitoring coupons/probes will be installed close to the LVI to allow potentials to be accurately measured. This satisfies the recommendation of the Advantica Independent Safety Review (see Appendix Q3.1). An isolation spool is fitted between the onshore pipeline and the Terminal facilities and this will be subject to monitoring to assure isolation and absence of any degradation.
An onshore cathodic protection inspection and maintenance plan will be defined in PIMS.
7.3 SAMPLING Facilities have been provided at the onshore Terminal to permit regular sampling of the residual inhibitor concentrations. These samples should be taken on a frequent basis during the first 30 days of production and at monthly intervals thereafter. The feasibility of this sampling is dependent on the actual water cut and will be determined by the Asset Production Chemist. The derivation of the field partitioning of corrosion inhibitor during the initial phase of operation will provide useful information concerning the dosage rate. Ferrous ion, bicarbonate, chloride concentrations and pH is normally determined on a monthly basis. Monitoring of CO2 and H2S will be done on regular basis. The actual frequency of this sampling will be defined by the Asset Production Chemist and subsequently included in the PIMS.
Corrib Onshore Pipeline EIS Q4.7 – Materials and Corrosion Management Premises
COR-39-SH-0002 21
8 OTHER PIPELINE REQUIREMENTS
8.1 PIPELINE PRE-COMMISSIONING & COMMISSIONING To minimise the possibility of debris remaining after construction, the pipeline will be cleaned prior to commissioning by successively pushing several cleaning pigs with steel brushes through the pipeline.
It is likely that the offshore and onshore pipelines will be commissioned separately.
8.2 OPERATIONAL PIGGING The requirement for running cleaning pigs through pipelines to remove deposits such as wax, corrosion products, scale or sand is dependent on the likelihood of accumulation of such deposits at the bottom of the pipeline that can cause localised shielding of the corrosion inhibitor and possible CO2
corrosion.
Pipelines operated at velocities above ~1.5m/s have a low likelihood of suffering from sand and debris accumulation because the sand and debris stay in suspension. The mixture velocities for the 20” pipeline are predicted to remain above 4m/s and therefore the accumulation of deposits including proppant is unlikely. Wax and scale formation are not expected in the Corrib fluids. Sand and proppant production is not expected, but will be monitored.
There is no requirement to run a pig through the pipeline to distribute the corrosion inhibitor because it will be well dispersed by the flow.
Based on these premises operational pigging is not expected to be required for corrosion control reasons during the current field life of the pipeline.
A subsea temporary pig launcher has been fabricated and can be connected to the subsea manifold in case operational pigging becomes necessary for any reason. The Terminal has a pig receiver.
8.3 INTELLIGENT PIGGING The Corrib pipeline will be inspected with an intelligent pig during commissioning (onshore pipeline) and at subsequent intervals as determined by Risk Based Assessment as defined within the PIMS (see Appendix Q5.2). The intelligent pig will likely be a combination of a magnetic flux leakage module (MFL) and a high resolution geometry (XGP) module with a shallow internal corrosion (SIC) detection unit. This type of intelligent pig system has been run in the Ormen Lange 30”x35mm pipelines in Norway. The XGP/SIC pig has been run in the Gannet-Fulmar pipeline in the U.K.

Corrib Onshore Pipeline EIS Q4.7 – Materials and Corrosion Management Premises
COR-39-SH-0002 22
9 DESIGN RE-ASSESSMENT In addition to the periodic pipeline integrity assessments a formal re-assessment of the design premises with respect to the effect of actual operating conditions on corrosion management will be conducted after three to six months operation and again if significant formation water occurs. This assessment will confirm whether there are any significant divergences between design and actual data in terms of fluid compositions, corrosion inhibitor performance, corrosion monitoring data, and process conditions.
Corrib Onshore Pipeline EIS Q4.7 – Materials and Corrosion Management Premises
COR-39-SH-0002 23
10 REFERENCES
1. ISO 15156 Petroleum and natural gas industries - Materials for use in H2S containing environments in oil and gas production.
2. ISO/FDIS 21457 Petroleum, petrochemical and natural gas industries - Materials selection and corrosion control for oil and gas production systems.
3. UKOPA Pipeline Fault Database – Pipeline Product Loss Incidents 1962 – 2004. April 2005.
4. DNV RP F-112: Design of duplex stainless steel subsea equipment exposed to cathodic protection.
5. BS 7910 Guide to methods for assessing the acceptability of flaws in metallic structures, 2007.
6. BS 7448-2 Fracture mechanics toughness tests Part 2, 2007.
GS.10.50886UNRESTRICTED
Q4.8 - Corrib onshore pipeline - assessment of locally corroded pipe wall area
Corrib onshore pipeline - assessment of locally corroded pipe wall area
by
R.W.J. Koers M. Church
GS.10.50886UNRESTRICTED
UNRESTRICTED
This document is made available subject to the condition that the recipient will neither use nor disclose the contents except asagreed in writing with the copyright owner. Copyright is vested in Shell Global Solutions International B.V., The Hague.
© Shell Global Solutions International B.V., 2010. All rights reserved.
Neither the whole nor any part of this document may be reproduced or distributed in any form or by any means (electronic, mechanical, reprographic, recording or otherwise) without the prior written consent of the copyright owner.
Shell Global Solutions is a trading style used by a network of technology companies of the Shell Group.
GS.10.50886 1 UNRESTRICTED
Summary The recommended practice DNV RP F101 for the assessment of corroded pipelines has been used to generate damage assessment lines (graphs of the length versus depth of corrosion that would lead to failure at the Maximum Allowable Operating Pressures (MAOP)) for the evaluation of the potential for failure of local thinned area of pipe wall due to corrosion.
The results show that there is a significant margin of safety with respect to thinning of the pipe wall due to corrosion. This is due to the relatively low maximum allowable operating pressures, 150 barg upstream of the LVI and 100 barg downstream, and relatively large wall thickness.
The output from this study also provides input to support the selection of corrosion related failure frequencies within the Quantitative Risk Assessment
Amsterdam, May 2010

GS.10.50886 2 UNRESTRICTED
Table of contents
Summary 11. Introduction 32. Objective 33. Design conditions and operating conditions 34. Material properties 45. Assessment of corroded areas 45.1 Approach 45.1.1 Construction failure line 45.1.2 Construction safe working line 55.2 Results 5
6. Discussion 76.1 Conservatism of the assessment 76.2 Explanation of the damage assessment diagrams 8
7. Conclusions 88. References 8
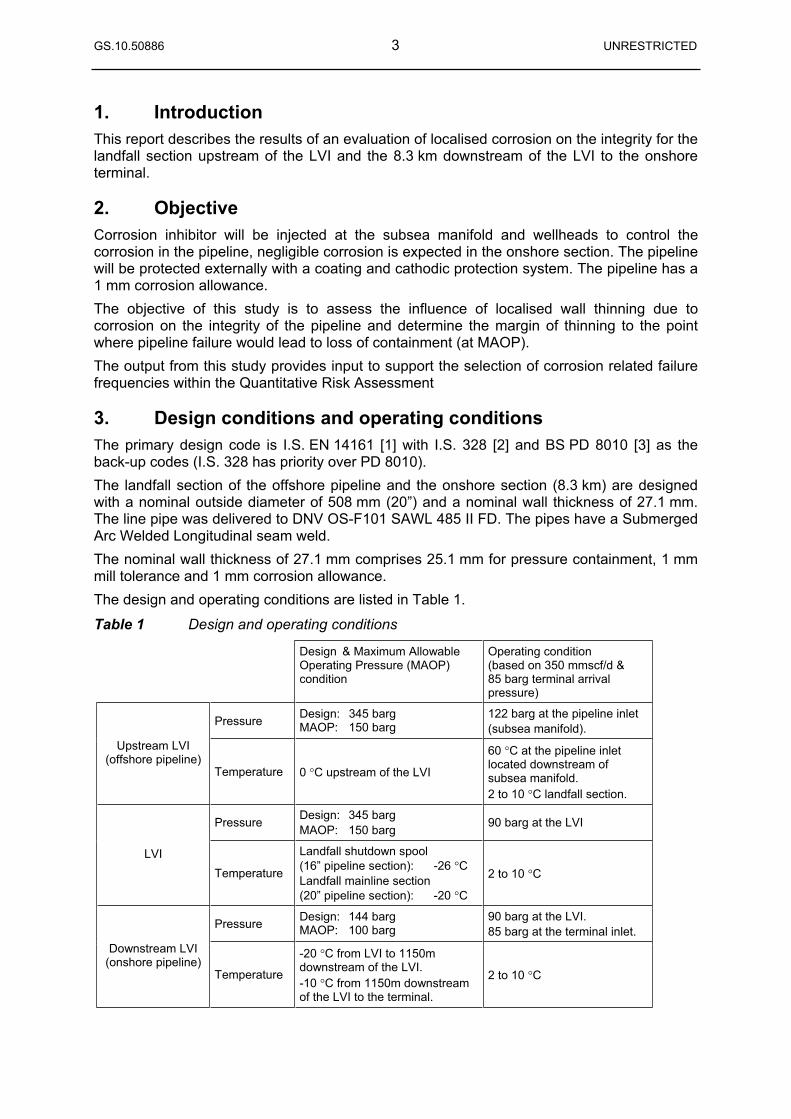
GS.10.50886 3 UNRESTRICTED
1. Introduction This report describes the results of an evaluation of localised corrosion on the integrity for the landfall section upstream of the LVI and the 8.3 km downstream of the LVI to the onshore terminal.
2. Objective Corrosion inhibitor will be injected at the subsea manifold and wellheads to control the corrosion in the pipeline, negligible corrosion is expected in the onshore section. The pipeline will be protected externally with a coating and cathodic protection system. The pipeline has a 1 mm corrosion allowance.
The objective of this study is to assess the influence of localised wall thinning due to corrosion on the integrity of the pipeline and determine the margin of thinning to the point where pipeline failure would lead to loss of containment (at MAOP).
The output from this study provides input to support the selection of corrosion related failure frequencies within the Quantitative Risk Assessment
3. Design conditions and operating conditions The primary design code is I.S. EN 14161 [1] with I.S. 328 [2] and BS PD 8010 [3] as the back-up codes (I.S. 328 has priority over PD 8010).
The landfall section of the offshore pipeline and the onshore section (8.3 km) are designed with a nominal outside diameter of 508 mm (20”) and a nominal wall thickness of 27.1 mm. The line pipe was delivered to DNV OS-F101 SAWL 485 II FD. The pipes have a Submerged Arc Welded Longitudinal seam weld.
The nominal wall thickness of 27.1 mm comprises 25.1 mm for pressure containment, 1 mm mill tolerance and 1 mm corrosion allowance.
The design and operating conditions are listed in Table 1.
Table 1 Design and operating conditions
Design & Maximum Allowable Operating Pressure (MAOP) condition
Operating condition (based on 350 mmscf/d & 85 barg terminal arrival pressure)
PressureDesign: 345 barg MAOP: 150 barg
122 barg at the pipeline inlet (subsea manifold).
Upstream LVI (offshore pipeline)
Temperature 0 C upstream of the LVI
60 C at the pipeline inlet located downstream of subsea manifold. 2 to 10 C landfall section.
PressureDesign: 345 barg MAOP: 150 barg
90 barg at the LVI
LVI
Temperature
Landfall shutdown spool (16” pipeline section): -26 CLandfall mainline section (20” pipeline section): -20 C
2 to 10 C
PressureDesign: 144 barg MAOP: 100 barg
90 barg at the LVI. 85 barg at the terminal inlet.
Downstream LVI (onshore pipeline)
Temperature
-20 C from LVI to 1150m downstream of the LVI. -10 C from 1150m downstream of the LVI to the terminal.
2 to 10 C

GS.10.50886 4 UNRESTRICTED
4. Material properties The pipes for the pipeline were purchased in two batches. The major part of the line pipe was fabricated in 2002 by the Corus 42” mill in Hartlepool. The 27.1 mm line pipe is fabricated using Dillinger Hutte (DH) plate. An additional 1150 m of pipes was fabricated in 2009 by Eisenbau Krämer. To distinguish between the two batches these are referred to as ‘2002 line pipe’ and ‘2009 line pipe’ in this report.
The line pipe specified minimum yield strength is 485 MPa (605 MPa maximum) and the specified minimum tensile strength is 570 MPa (760 MPa maximum).
5. Assessment of corroded areas The maximum allowable size of a local area of wall thinning due to corrosion is calculated on the basis of recommended practice DNV-RP-F101 [4] for the assessment of corroded pipelines.
5.1 Approach
DNV-RP-F101 gives a procedure to determine the safe working pressure ( for a pipe containing a Local Thinned Area (LTA) e.g. due to corrosion. The procedure is used to construct an assessment diagram to assess the significance of a local thinned area. The method to construct the damage assessment diagram is given below. First the failure line will be constructed and secondly a safe working line will be constructed.
5.1.1 Construction failure line
The operating pressure ( can be written as follows:
= Operating factor
= Outer diameter pipe (mm) = Nominal wall thickness pipe (mm)
= Specified Minimum Yield Strength (MPa)
Note:When the operating pressure is equal to the design pressure the factor is equal to the pipeline design factor.
The failure pressure ( of a pipe containing an LTA is given by:
= Outer diameter pipe (mm) = Nominal wall thickness pipe (mm) = Axial length of the LTA (mm)
= Specified Minimum Tensile Strength (MPa)
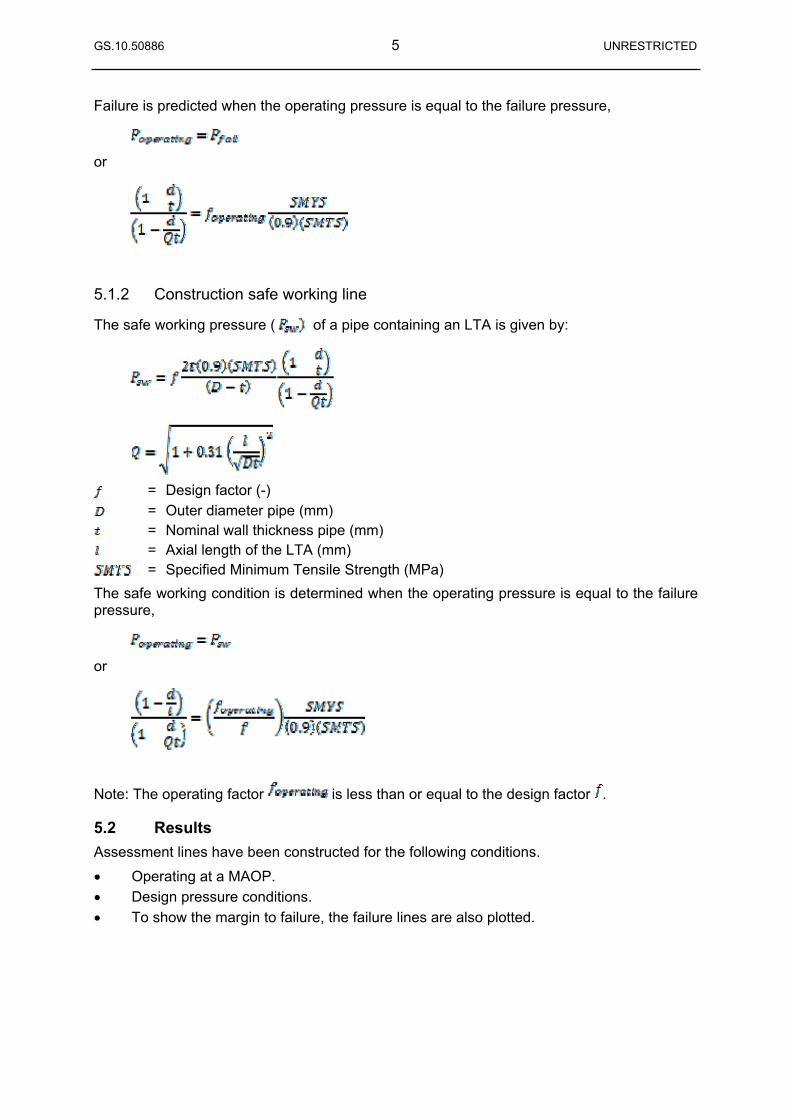
GS.10.50886 5 UNRESTRICTED
Failure is predicted when the operating pressure is equal to the failure pressure,
or
5.1.2 Construction safe working line
The safe working pressure ( of a pipe containing an LTA is given by:
= Design factor (-)
= Outer diameter pipe (mm) = Nominal wall thickness pipe (mm) = Axial length of the LTA (mm)
= Specified Minimum Tensile Strength (MPa)
The safe working condition is determined when the operating pressure is equal to the failure pressure,
or
Note: The operating factor is less than or equal to the design factor .
5.2 Results Assessment lines have been constructed for the following conditions.
Operating at a MAOP.
Design pressure conditions.
To show the margin to failure, the failure lines are also plotted.
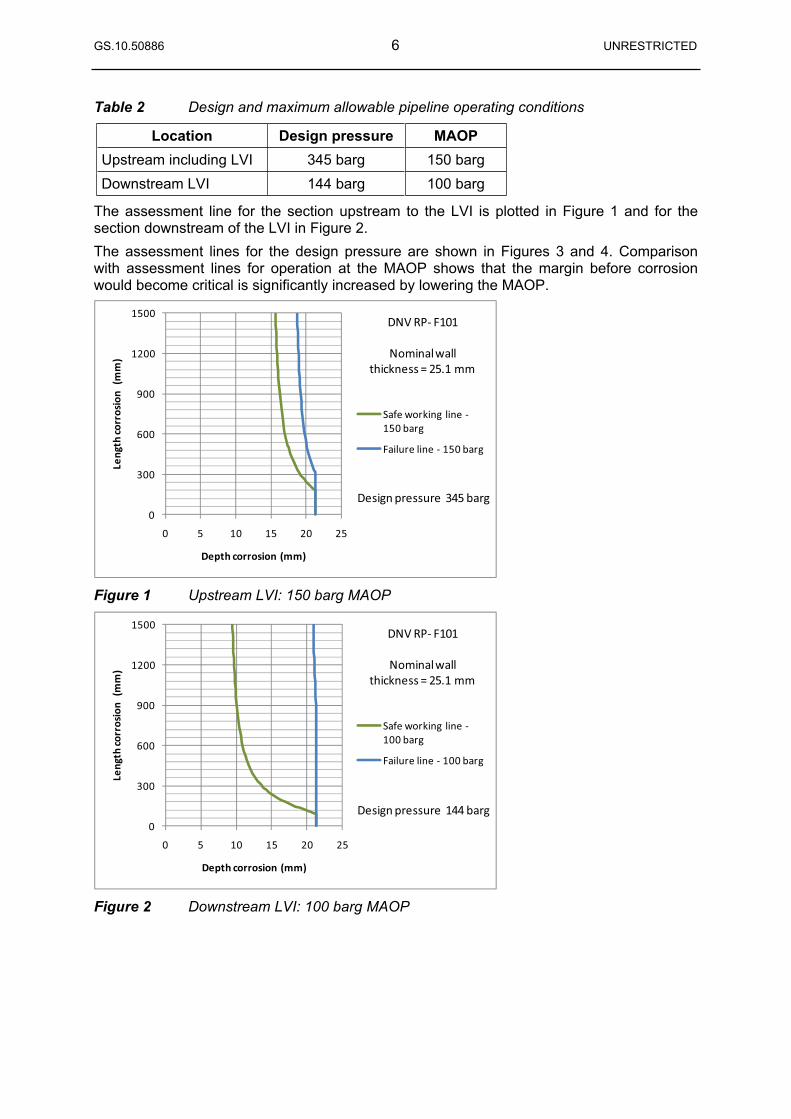
GS.10.50886 6 UNRESTRICTED
Table 2 Design and maximum allowable pipeline operating conditions
Location Design pressure MAOP Upstream including LVI 345 barg 150 barg
Downstream LVI 144 barg 100 barg
The assessment line for the section upstream to the LVI is plotted in Figure 1 and for the section downstream of the LVI in Figure 2.
The assessment lines for the design pressure are shown in Figures 3 and 4. Comparison with assessment lines for operation at the MAOP shows that the margin before corrosion would become critical is significantly increased by lowering the MAOP.
0
300
600
900
1200
1500
0 5 10 15 20 25
Length
corrosion
(mm)
Depth corrosion (mm)
Safe working line150 barg
Failure line 150 barg
DNVRP F101
Nominalwallthickness = 25.1 mm
Designpressure 345 barg
Figure 1 Upstream LVI: 150 barg MAOP
0
300
600
900
1200
1500
0 5 10 15 20 25
Length
corrosion
(mm)
Depth corrosion (mm)
Safe working line100 barg
Failure line 100 barg
DNVRP F101
Nominalwallthickness = 25.1 mm
Designpressure 144 barg
Figure 2 Downstream LVI: 100 barg MAOP
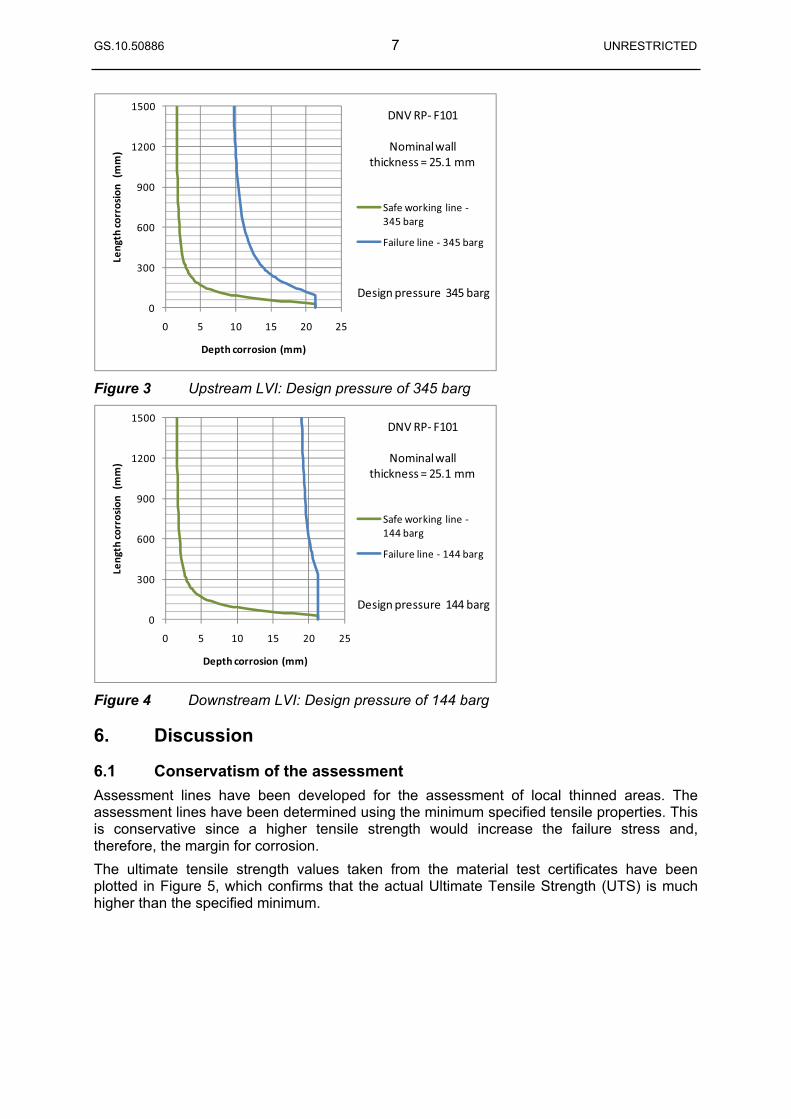
GS.10.50886 7 UNRESTRICTED
0
300
600
900
1200
1500
0 5 10 15 20 25
Length
corrosion
(mm)
Depth corrosion (mm)
Safe working line345 barg
Failure line 345 barg
DNVRP F101
Nominalwallthickness = 25.1 mm
Designpressure 345 barg
Figure 3 Upstream LVI: Design pressure of 345 barg
0
300
600
900
1200
1500
0 5 10 15 20 25
Length
corrosion
(mm)
Depth corrosion (mm)
Safe working line144 barg
Failure line 144 barg
DNVRP F101
Nominalwallthickness = 25.1 mm
Designpressure 144 barg
Figure 4 Downstream LVI: Design pressure of 144 barg
6. Discussion
6.1 Conservatism of the assessment Assessment lines have been developed for the assessment of local thinned areas. The assessment lines have been determined using the minimum specified tensile properties. This is conservative since a higher tensile strength would increase the failure stress and, therefore, the margin for corrosion.
The ultimate tensile strength values taken from the material test certificates have been plotted in Figure 5, which confirms that the actual Ultimate Tensile Strength (UTS) is much higher than the specified minimum.
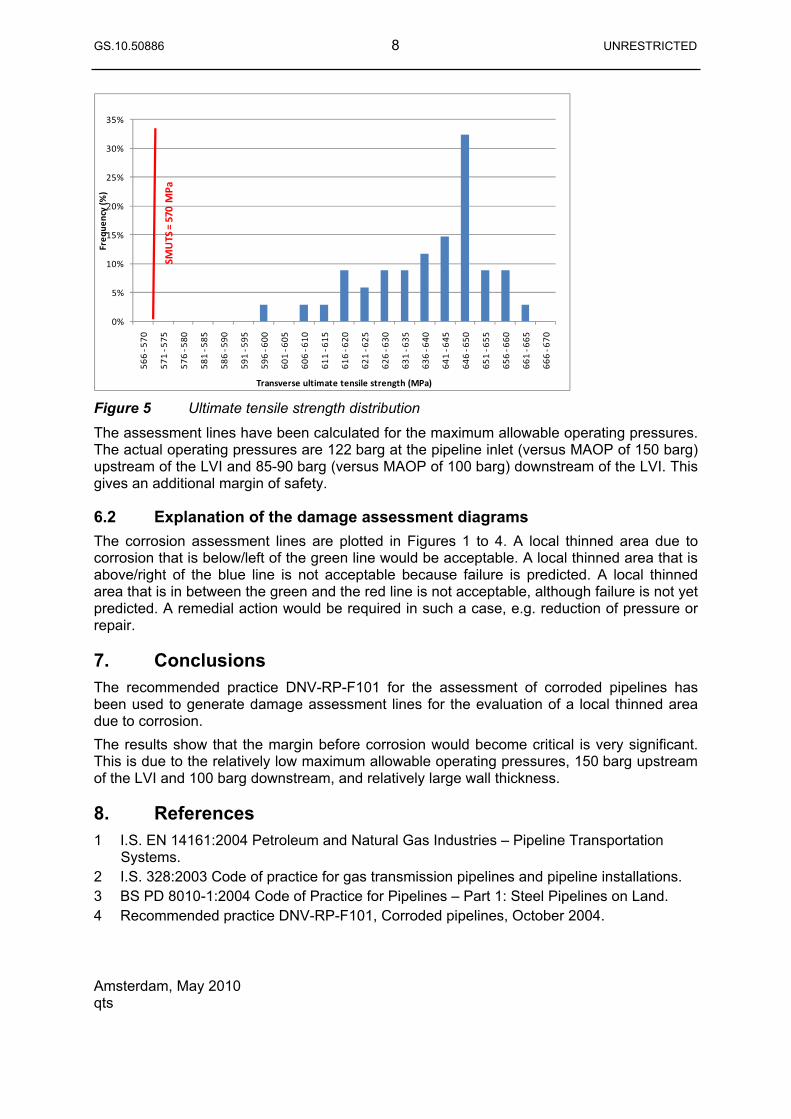
GS.10.50886 8 UNRESTRICTED
0%
5%
10%
15%
20%
25%
30%
35%
566
570
571
575
576
580
581
585
586
590
591
595
596
600
601
605
606
610
611
615
616
620
621
625
626
630
631
635
636
640
641
645
646
650
651
655
656
660
661
665
666
670
Freq
uency(%
)
Transverse ultimate tensile strength (MPa)
SMUTS
=570MPa
Figure 5 Ultimate tensile strength distribution
The assessment lines have been calculated for the maximum allowable operating pressures. The actual operating pressures are 122 barg at the pipeline inlet (versus MAOP of 150 barg) upstream of the LVI and 85-90 barg (versus MAOP of 100 barg) downstream of the LVI. This gives an additional margin of safety.
6.2 Explanation of the damage assessment diagrams The corrosion assessment lines are plotted in Figures 1 to 4. A local thinned area due to corrosion that is below/left of the green line would be acceptable. A local thinned area that is above/right of the blue line is not acceptable because failure is predicted. A local thinned area that is in between the green and the red line is not acceptable, although failure is not yet predicted. A remedial action would be required in such a case, e.g. reduction of pressure or repair.
7. Conclusions The recommended practice DNV-RP-F101 for the assessment of corroded pipelines has been used to generate damage assessment lines for the evaluation of a local thinned area due to corrosion.
The results show that the margin before corrosion would become critical is very significant. This is due to the relatively low maximum allowable operating pressures, 150 barg upstream of the LVI and 100 barg downstream, and relatively large wall thickness.
8. References 1 I.S. EN 14161:2004 Petroleum and Natural Gas Industries – Pipeline Transportation
Systems. 2 I.S. 328:2003 Code of practice for gas transmission pipelines and pipeline installations. 3 BS PD 8010-1:2004 Code of Practice for Pipelines – Part 1: Steel Pipelines on Land. 4 Recommended practice DNV-RP-F101, Corroded pipelines, October 2004.
Amsterdam, May 2010 qts
SHELL E&P IRELAND LIMITED
CORRIB GAS FIELD DEVELOPMENT PROJECT
Q4.9 Assessment of Wet Gas Operation, Internal Corrosion and Erosion
DOCUMENT No: COR 39 SH 0011
Corrib Onshore Pipeline EIS Q4.9 Assessment of Wet Gas Operation, Internal Corrosion and Erosion
COR-39-SH-0011 ii
TABLE OF CONTENTS
1 PURPOSE AND SCOPE ................................................................................................................. 12 FUNDAMENTALS OF WET GAS OPERATION............................................................................. 1
2.1 MECHANISMS................................................................................................................... 1
2.2 CORROSION MITIGATION .................................................................................................. 1
2.3 WET GAS EXPERIENCE .................................................................................................... 1
3 CORROSION ASSESSMENT ......................................................................................................... 43.1 KEY ASSUMPTIONS .......................................................................................................... 4
3.2 PRODUCTION PROFILE ..................................................................................................... 4
3.3 DESIGN LIFE.................................................................................................................... 5
3.4 HYDROCOR INPUT DATA ............................................................................................... 6
4 CALCULATED CORROSION RATES ............................................................................................ 74.1 OFFSHORE PIPELINE BASE CASE...................................................................................... 7
4.2 OFFSHORE PIPELINE SENSITIVITY CASES.......................................................................... 9
4.2.1 Pipeline Inlet Temperature ................................................................................ 9
4.2.2 Formation Water ............................................................................................... 9
4.2.3 Lower Inhibited Corrosion Rates..................................................................... 10
4.3 ONSHORE PIPELINE ....................................................................................................... 10
4.4 CORROSION ALLOWANCE ............................................................................................... 11
5 EROSION ASSESSMENT............................................................................................................. 125.1 METHOD........................................................................................................................ 12
5.2 PREDICTIONS................................................................................................................. 12
5.3 DISCUSSION .................................................................................................................. 13
6 CONCLUSIONS............................................................................................................................. 147 REFERENCES............................................................................................................................... 15
LIST OF FIGURES
Figure 2.1: Comparison of predicted corrosion rate with 85% inhibitor efficiency versus field inspection data for inhibited wet gas pipelines ......................................................................................................... 3
Figure 4.1: Accumulated uninhibited CO2 Corrosion (mm) for the Corrib Pipeline for 20 year field life: Bottom of the Line (BOL) and Top of the Line (TOL) ......................................................................7
Corrib Onshore Pipeline EIS Q4.9 Assessment of Wet Gas Operation, Internal Corrosion and Erosion
COR-39-SH-0011 iii
LIST OF TABLES
Table 2.1: Data for operating conditions and corrosion rates (CR) for inhibited wet gas pipelines (1998)................................................................................................................................................................. 2
Table 3.1: Production Profiles for pipeline inlet conditions...................................................................... 5
Table 4.1: Maximum CO2 Corrosion rate (mm/yr) for Corrib Offshore Pipeline: Bottom of the Line (BOL) and Top of the Line (TOL) for 0%, 95% and 99% corrosion inhibitor availabilities ...................... 7
Table 4.2: Corrib Pipeline Corrosion Allowance...................................................................................... 8
Table 4.3: Maximum CO2 Corrosion rate (mm/yr) for Corrib Offshore Pipeline: (BOL) with 60ºC pipeline inlet temperature...................................................................................................................................... 9
Table 4.4: Maximum CO2 Corrosion rate (mm/yr) for Corrib Offshore Pipeline with Formation Water... 9
Table 5.1: Erosion predictions for LVI & onshore pipeline for 2.5 kg/day proppant .............................. 12
ATTACHMENTS
Q4.9A OVERVIEW OF SHELL WET GAS PIPELINES 3 pages
Q4.9B CO2 CORROSION PROFILE AT 75ºC 1 page
Q4.9C CO2 CORROSION PROFILE AT 60ºC 1 page
Q4.9D CO2 CORROSION PROFILE WITH FORMATION WATER AT 60ºC 1 page
Q4.9E ELEVATION PROFILE OF CORRIB PIPELINE 1 page
Corrib Onshore Pipeline EIS Q4.9 Assessment of Wet Gas Operation, Internal Corrosion and Erosion
COR-39-SH-0011 1
1 PURPOSE AND SCOPE This document provides an assessment of wet gas operation and the related internal corrosion and erosion rates for the offshore and onshore sections of the Corrib pipeline from the subsea manifold to the Terminal. This assessment has been undertaken with the most recent flow assurance data related to the lower maximum allowable operating pressures and therefore the predicted corrosion rates differ from previous versions of this document. The corrosion assessment is based on a field life of 20 years.
2 FUNDAMENTALS OF WET GAS OPERATION
2.1 MECHANISMS
The integrity of a carbon steel pipeline with respect to corrosion requires a thorough assessment of the corrosivity of the medium transported and the implementation of an effective corrosion management system. This involves identifying all possible degradation threats and defining mitigation, monitoring and control measures to manage the risk during operation. The main internal corrosion risks identified in the assessment of the Corrib pipeline system are carbon dioxide (CO2) corrosion and organic acid corrosion associated with unprocessed (wet) gas (see Appendix Q4.7).
CO2 corrosion can occur when carbon dioxide dissolves in water to form carbonic acid which is corrosive to steel. Water will be present in the pipeline either through condensation from the gas or it may be produced as formation water from the reservoir. The higher the content of CO2, the greater is the corrosivity of the water. It should be noted that the CO2 content of the Corrib gas is relatively low at 0.3%. Other key factors that increase CO2 corrosivity are increases in pressure, temperature, flow rate or acidity.
The acidity (pH) is an important factor with respect to CO2 corrosion. Modelling, testing and experience has shown that CO2 corrosion increases the tendency for saturation of iron carbonate in condensed water. This results in a corresponding decrease in acidity and a significant decrease in corrosivity along the pipeline from offshore to onshore. There is also a significant temperature drop along the pipeline further decreasing the corrosivity in the onshore section of the pipeline.
Organic acids such as acetic acid can be present in the produced fluids potentially increasing corrosivity. The organic acid content of the Corrib gas has been found to relatively low (maximum 10ppm) although 100ppm is expected should formation water be produced.
2.2 CORROSION MITIGATION
In order to mitigate internal CO2 and organic acid corrosion of steel it is common practice to inject corrosion inhibitor which forms a barrier against the corrosive liquids. Another method is to inject glycol or methanol which are miscible with the corrosive water and further reduce the corrosivity. For the Corrib pipeline the risk of CO2 and organic corrosion will be mitigated by injecting both corrosion inhibitor and methanol (which is also used to prevent formation of hydrates in the pipeline). To ensure that sufficient corrosion mitigation is achieved for the pipeline, a corrosion inhibitor availability capability of >99% has been designed for the Corrib system.
2.3 WET GAS EXPERIENCE
The current approach taken by Shell to the design and operation of carbon steel pipelines in wet gas service was defined in the late 90’s following an extensive review of operating experience of wet gas pipelines [1]. The methodology ensures that key factors are taken into account during design and that corrosion control is properly applied during operation. It adopts the concept of inhibitor availability based on inhibited corrosion rate rather than inhibitor efficiency as previously applied by the industry.
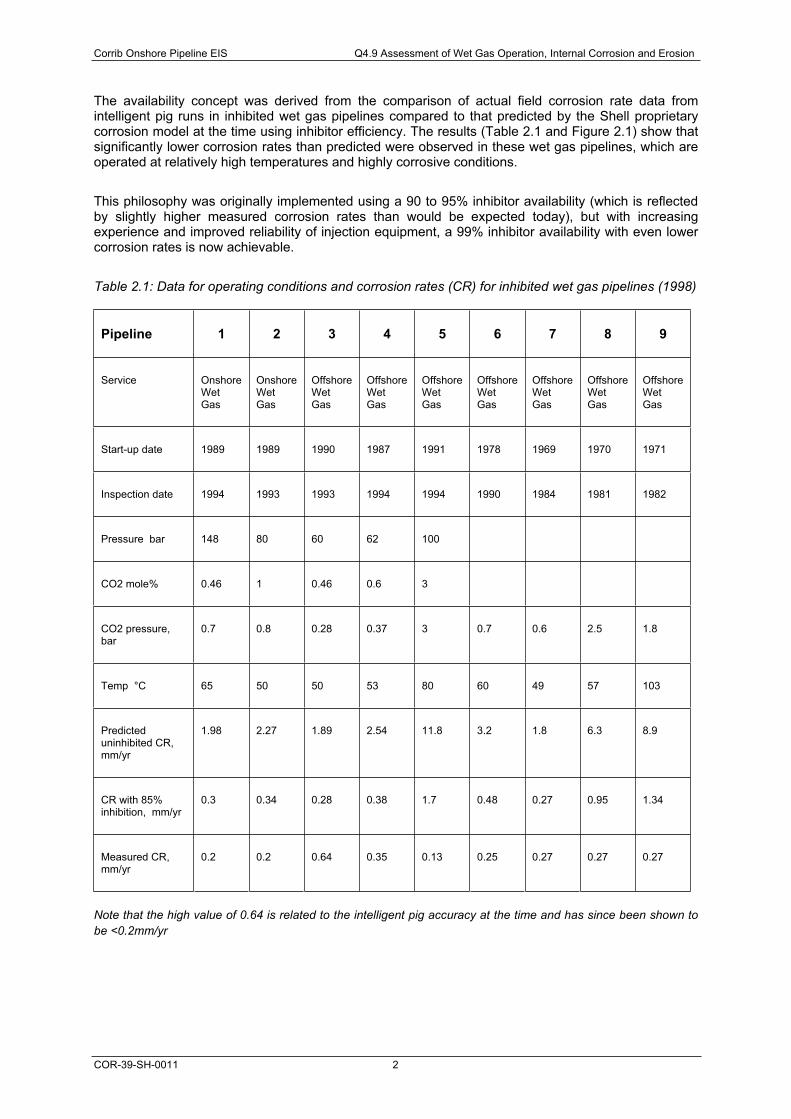
Corrib Onshore Pipeline EIS Q4.9 Assessment of Wet Gas Operation, Internal Corrosion and Erosion
COR-39-SH-0011 2
The availability concept was derived from the comparison of actual field corrosion rate data from intelligent pig runs in inhibited wet gas pipelines compared to that predicted by the Shell proprietary corrosion model at the time using inhibitor efficiency. The results (Table 2.1 and Figure 2.1) show that significantly lower corrosion rates than predicted were observed in these wet gas pipelines, which are operated at relatively high temperatures and highly corrosive conditions.
This philosophy was originally implemented using a 90 to 95% inhibitor availability (which is reflected by slightly higher measured corrosion rates than would be expected today), but with increasing experience and improved reliability of injection equipment, a 99% inhibitor availability with even lower corrosion rates is now achievable.
Table 2.1: Data for operating conditions and corrosion rates (CR) for inhibited wet gas pipelines (1998)
Pipeline 1 2 3 4 5 6 7 8 9
Service Onshore WetGas
OnshoreWetGas
OffshoreWetGas
OffshoreWetGas
OffshoreWetGas
OffshoreWetGas
OffshoreWetGas
OffshoreWetGas
OffshoreWetGas
Start-up date 1989 1989 1990 1987 1991 1978 1969 1970 1971
Inspection date 1994 1993 1993 1994 1994 1990 1984 1981 1982
Pressure bar 148 80 60 62 100
CO2 mole% 0.46 1 0.46 0.6 3
CO2 pressure, bar
0.7 0.8 0.28 0.37 3 0.7 0.6 2.5 1.8
Temp °C 65 50 50 53 80 60 49 57 103
Predicteduninhibited CR, mm/yr
1.98 2.27 1.89 2.54 11.8 3.2 1.8 6.3 8.9
CR with 85% inhibition, mm/yr
0.3 0.34 0.28 0.38 1.7 0.48 0.27 0.95 1.34
Measured CR, mm/yr
0.2 0.2 0.64 0.35 0.13 0.25 0.27 0.27 0.27
Note that the high value of 0.64 is related to the intelligent pig accuracy at the time and has since been shown to be <0.2mm/yr

Corrib Onshore Pipeline EIS Q4.9 Assessment of Wet Gas Operation, Internal Corrosion and Erosion
COR-39-SH-0011 3
Figure 2.1: Comparison of predicted corrosion rate with 85% inhibitor efficiency versus field inspection data for inhibited wet gas pipelines
A more recent overview of wet gas pipelines operated in the Shell Group is given in Attachment Q4.9A. This shows extensive experience of successful operation of wet gas pipelines. In many cases the performance of the inhibited pipeline systems with respect to corrosion has been verified by internal intelligent pig inspection or external ultrasonic examination. No failures of wet gas pipelines have been experienced with these pipelines, and the observed low corrosion rates demonstrate both the validity of the corrosion modelling and the methodology adopted for the operation of wet gas pipelines. The total Shell experience with operation of wet gas pipelines in Europe without a loss of containment incident amounts to 40,384 km years, which provides a high degree of confidence in Shell’s capability with this type of operation.
It should also be recognised that the Corrib onshore pipeline operating conditions are inherently less corrosive than many of the pipelines in the overview due to the low temperature and lower acidity. In addition the inhibitor availability is designed for >99% compared to 95% that has been used in the past, and mitigation will be enhanced by the complementary inhibitive effect of methanol.
Corrib Onshore Pipeline EIS Q4.9 Assessment of Wet Gas Operation, Internal Corrosion and Erosion
COR-39-SH-0011 4
3 CORROSION ASSESSMENT
The corrosion assessment for the Corrib pipeline has used the Shell HYDROCOR (version 6.00) corrosion modelling software which has been enhanced over many years of development [2-6] from the original De Waard-Milliams relationship for CO2 corrosion [2] which is used as the basis for industry standards. For the Corrib conditions with relatively low water throughput the model tends to over-predict the corrosion by as much as 25%.
The production profiles used in the assessment have been derived from the most recent flow assurance calculations undertaken by the Shell process discipline Technical Authority related to the lower maximum operating pressure, and a 20-year production scenario.
3.1 KEY ASSUMPTIONS
The following are the key assumptions used in the corrosion assessment:
1. Water rate = Water Gas Ratio (WGR) × Gas Rate. The water that condenses in the sub-sea equipment prior to the pipeline inlet is included in the aqueous phase input.
2. The peak methanol injection rate required is 2.2 m3/h (or 53 m3/d). This occurs in year 3. The minimum rate is 0.5 m3/h. This analysis has assumed the peak methanol injection rate for all years. The actual amount of methanol will vary from this amount depending on operational analyses. The methanol will be injected at the wellheads and will mix with any water.
3. Aqueous rate = Water rate + Methanol rate.
4. Condensate flow = Condensate Gas Ratio (CGR) × Gas Rate.
5. The highest expected pipeline inlet temperature is 75oC. This is the assumption used as the base case. The pipeline inlet temperature has also been modelled at 60oC as a less conservative sensitivity case.
6. It is assumed there will be no oxygen in the methanol as a result of removal in the Terminal.
3.2 PRODUCTION PROFILE
The production profile from the latest flow assurance review is given in Table 3.1 below.
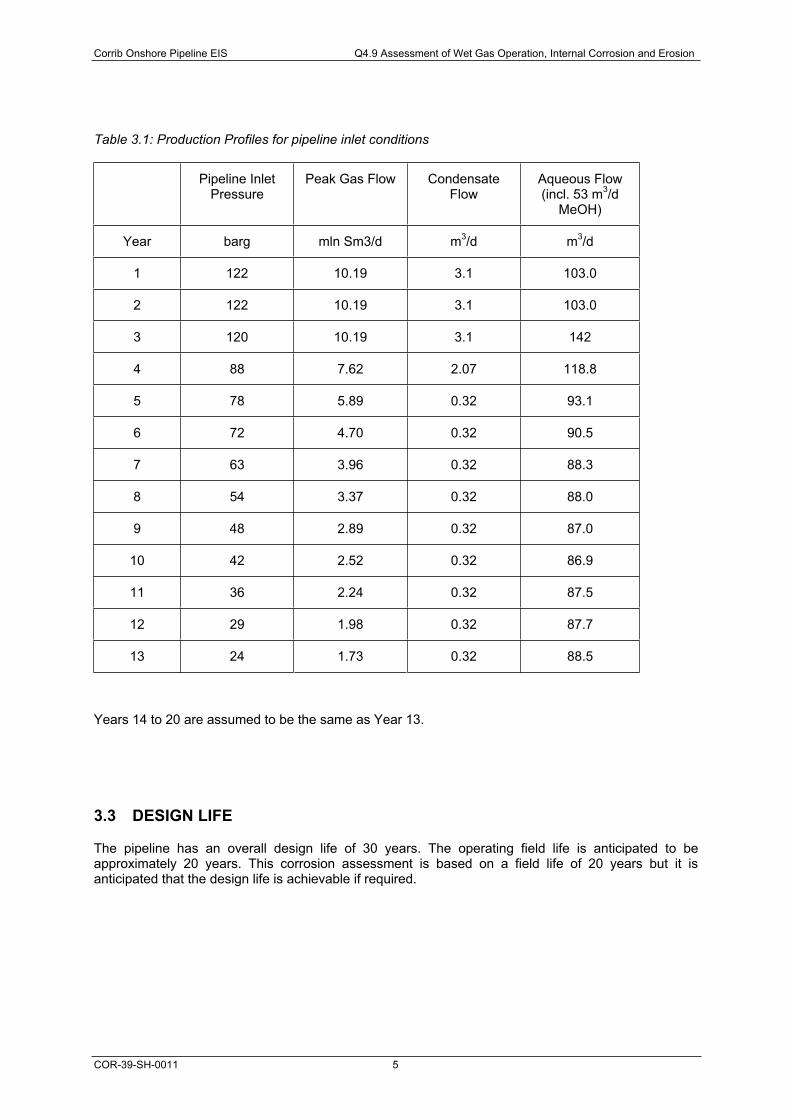
Corrib Onshore Pipeline EIS Q4.9 Assessment of Wet Gas Operation, Internal Corrosion and Erosion
COR-39-SH-0011 5
Table 3.1: Production Profiles for pipeline inlet conditions
Pipeline Inlet Pressure
Peak Gas Flow Condensate Flow
Aqueous Flow (incl. 53 m3/d
MeOH)
Year barg mln Sm3/d m3/d m3/d
1 122 10.19 3.1 103.0
2 122 10.19 3.1 103.0
3 120 10.19 3.1 142
4 88 7.62 2.07 118.8
5 78 5.89 0.32 93.1
6 72 4.70 0.32 90.5
7 63 3.96 0.32 88.3
8 54 3.37 0.32 88.0
9 48 2.89 0.32 87.0
10 42 2.52 0.32 86.9
11 36 2.24 0.32 87.5
12 29 1.98 0.32 87.7
13 24 1.73 0.32 88.5
Years 14 to 20 are assumed to be the same as Year 13.
3.3 DESIGN LIFE
The pipeline has an overall design life of 30 years. The operating field life is anticipated to be approximately 20 years. This corrosion assessment is based on a field life of 20 years but it is anticipated that the design life is achievable if required.
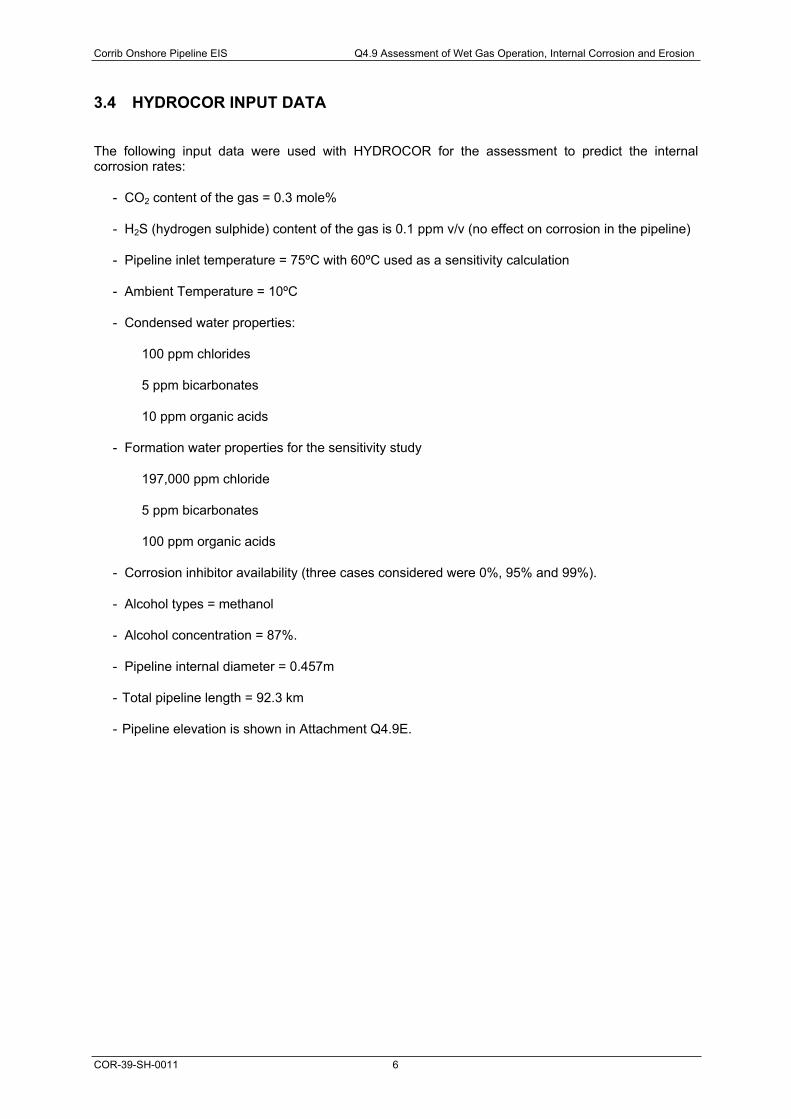
Corrib Onshore Pipeline EIS Q4.9 Assessment of Wet Gas Operation, Internal Corrosion and Erosion
COR-39-SH-0011 6
3.4 HYDROCOR INPUT DATA
The following input data were used with HYDROCOR for the assessment to predict the internal corrosion rates:
- CO2 content of the gas = 0.3 mole%
- H2S (hydrogen sulphide) content of the gas is 0.1 ppm v/v (no effect on corrosion in the pipeline)
- Pipeline inlet temperature = 75ºC with 60ºC used as a sensitivity calculation
- Ambient Temperature = 10ºC
- Condensed water properties:
100 ppm chlorides
5 ppm bicarbonates
10 ppm organic acids
- Formation water properties for the sensitivity study
197,000 ppm chloride
5 ppm bicarbonates
100 ppm organic acids
- Corrosion inhibitor availability (three cases considered were 0%, 95% and 99%).
- Alcohol types = methanol
- Alcohol concentration = 87%.
- Pipeline internal diameter = 0.457m
- Total pipeline length = 92.3 km
- Pipeline elevation is shown in Attachment Q4.9E.
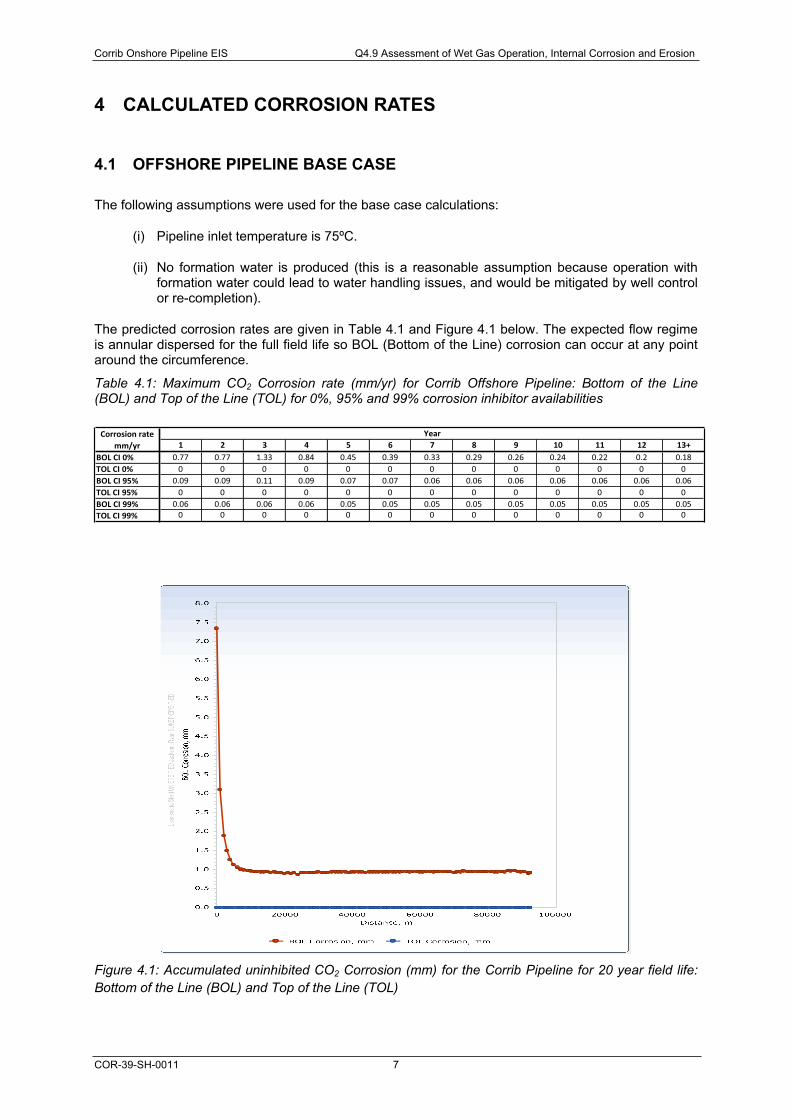
Corrib Onshore Pipeline EIS Q4.9 Assessment of Wet Gas Operation, Internal Corrosion and Erosion
COR-39-SH-0011 7
4 CALCULATED CORROSION RATES
4.1 OFFSHORE PIPELINE BASE CASE
The following assumptions were used for the base case calculations:
(i) Pipeline inlet temperature is 75ºC.
(ii) No formation water is produced (this is a reasonable assumption because operation with formation water could lead to water handling issues, and would be mitigated by well control or re-completion).
The predicted corrosion rates are given in Table 4.1 and Figure 4.1 below. The expected flow regime is annular dispersed for the full field life so BOL (Bottom of the Line) corrosion can occur at any point around the circumference.
Table 4.1: Maximum CO2 Corrosion rate (mm/yr) for Corrib Offshore Pipeline: Bottom of the Line (BOL) and Top of the Line (TOL) for 0%, 95% and 99% corrosion inhibitor availabilities
1 2 3 4 5 6 7 8 9 10 11 12 13+BOL CI 0% 0.77 0.77 1.33 0.84 0.45 0.39 0.33 0.29 0.26 0.24 0.22 0.2 0.18TOL CI 0% 0 0 0 0 0 0 0 0 0 0 0 0 0BOL CI 95% 0.09 0.09 0.11 0.09 0.07 0.07 0.06 0.06 0.06 0.06 0.06 0.06 0.06TOL CI 95% 0 0 0 0 0 0 0 0 0 0 0 0 0BOL CI 99% 0.06 0.06 0.06 0.06 0.05 0.05 0.05 0.05 0.05 0.05 0.05 0.05 0.05TOL CI 99% 0 0 0 0 0 0 0 0 0 0 0 0 0
Corrosion ratemm/yr
Year
Figure 4.1: Accumulated uninhibited CO2 Corrosion (mm) for the Corrib Pipeline for 20 year field life: Bottom of the Line (BOL) and Top of the Line (TOL)

Corrib Onshore Pipeline EIS Q4.9 Assessment of Wet Gas Operation, Internal Corrosion and Erosion
COR-39-SH-0011 8
Typical output screens are given in Attachments Q4.9B – Q4.9D. It can be seen that the predicted corrosion rates decrease with:
(i) decreasing fluid temperature along the pipeline away from Corrib towards the Terminal
(ii) decreasing production in later years.
The maximum uninhibited corrosion rate of the offshore pipeline occurs in year 3 and is approximately 1.3 mm/yr. The increase in corrosion rate in year 3 is related to the higher liquid loading. The cumulative uninhibited wall loss over 20 years is approximately 7.5 mm. The location of the maximum corrosion will be within the first 400 metres from the pipeline inlet where additional wall thickness in the design provides a greater corrosion allowance (refer Table 4.2). However, this corrosion allowance will not be exceeded because the pipeline will be operated with corrosion inhibitor. Similarly, the corrosion allowance around 2.5km is insufficient for the uninhibited corrosion rate at this point but will not be exceeded because of the corrosion inhibition.
Table 4.2: Corrib Pipeline Corrosion Allowance
Distance from Corrib (km)
Corrosion Allowance (mm)
0.0 6.4
0.4 3.6
0.8 2.3
1.6 1.4
2.5 1.0
93.0 1.0
The application of corrosion inhibitor results in a significant reduction in corrosion rate to <0.1 mm/year at the pipeline inlet assuming 99% inhibitor availability (Table 4.1). The maximum cumulative inhibitedcorrosion over the 20-year field life at the pipeline inlet reduces to approximately 1 mm, which is well within the design corrosion allowance at this location. The predicted cumulative inhibited corrosion for the remainder of the pipeline is also within the given corrosion allowances for the 20 year field life.
The calculated flow regime for the Corrib pipeline is annular dispersed for the full field life. This means that top of the line (TOL) corrosion is not expected because significant condensation will not occur and the full circumference is protected by corrosion inhibitor. In the unlikely event of stratified flow conditions occurring in the pipeline the corrosion rate would be low because of the effect of co-condensing methanol and low condensation rates. Any TOL corrosion would only occur close to the manifold.
TOL corrosion tests carried out at IFE (Institute for Energy Technology, Norway) for simulated Corrib conditions confirmed that TOL rates were significantly lower in the presence of methanol. TOL corrosion rate without methanol at 60ºC was 0.2 mm/yr while with methanol the rates were well below 0.1 mm/yr. No pitting or other localised corrosion was observed in any of the tests.
In order to ensure that the pipeline is suitable for the 20 year field life, and possibly longer, the required corrosion inhibitor availability for the Corrib pipeline has been set to 99% for the base case.
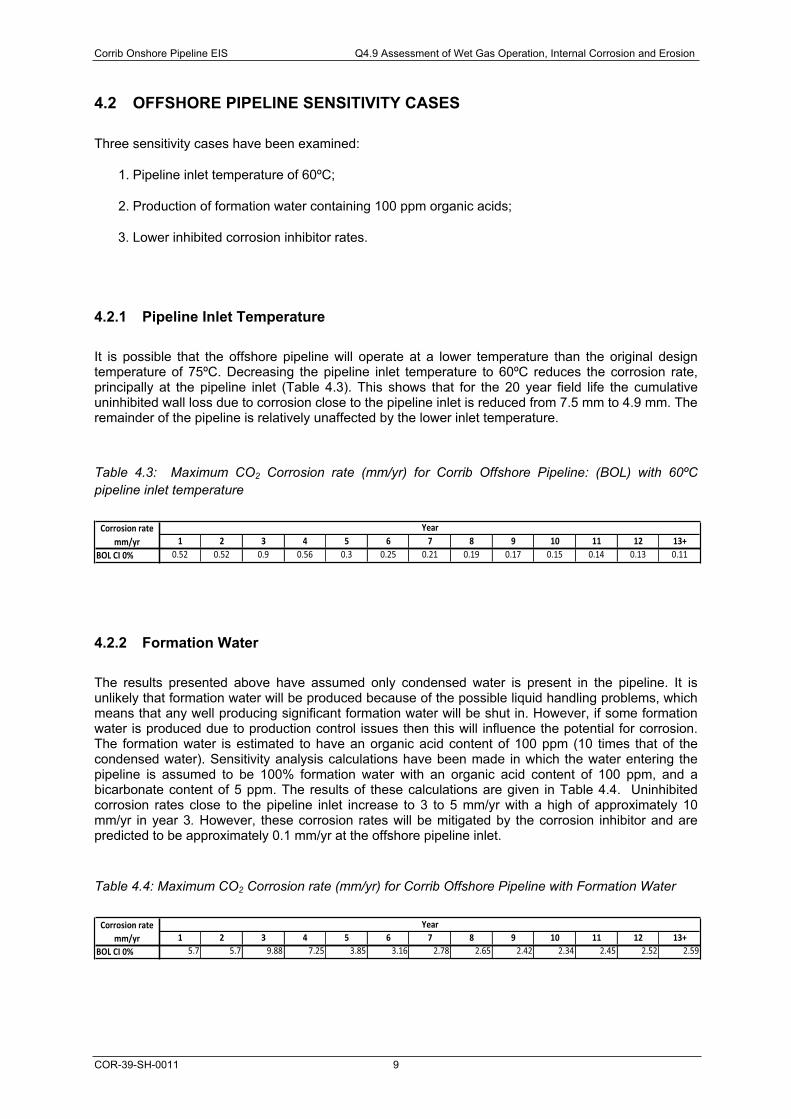
Corrib Onshore Pipeline EIS Q4.9 Assessment of Wet Gas Operation, Internal Corrosion and Erosion
COR-39-SH-0011 9
4.2 OFFSHORE PIPELINE SENSITIVITY CASES
Three sensitivity cases have been examined:
1. Pipeline inlet temperature of 60ºC;
2. Production of formation water containing 100 ppm organic acids;
3. Lower inhibited corrosion inhibitor rates.
4.2.1 Pipeline Inlet Temperature
It is possible that the offshore pipeline will operate at a lower temperature than the original design temperature of 75ºC. Decreasing the pipeline inlet temperature to 60ºC reduces the corrosion rate, principally at the pipeline inlet (Table 4.3). This shows that for the 20 year field life the cumulative uninhibited wall loss due to corrosion close to the pipeline inlet is reduced from 7.5 mm to 4.9 mm. The remainder of the pipeline is relatively unaffected by the lower inlet temperature.
Table 4.3: Maximum CO2 Corrosion rate (mm/yr) for Corrib Offshore Pipeline: (BOL) with 60ºC pipeline inlet temperature
1 2 3 4 5 6 7 8 9 10 11 12 13+BOL CI 0% 0.52 0.52 0.9 0.56 0.3 0.25 0.21 0.19 0.17 0.15 0.14 0.13 0.11
Corrosion ratemm/yr
Year
4.2.2 Formation Water
The results presented above have assumed only condensed water is present in the pipeline. It is unlikely that formation water will be produced because of the possible liquid handling problems, which means that any well producing significant formation water will be shut in. However, if some formation water is produced due to production control issues then this will influence the potential for corrosion. The formation water is estimated to have an organic acid content of 100 ppm (10 times that of the condensed water). Sensitivity analysis calculations have been made in which the water entering the pipeline is assumed to be 100% formation water with an organic acid content of 100 ppm, and a bicarbonate content of 5 ppm. The results of these calculations are given in Table 4.4. Uninhibited corrosion rates close to the pipeline inlet increase to 3 to 5 mm/yr with a high of approximately 10 mm/yr in year 3. However, these corrosion rates will be mitigated by the corrosion inhibitor and are predicted to be approximately 0.1 mm/yr at the offshore pipeline inlet.
Table 4.4: Maximum CO2 Corrosion rate (mm/yr) for Corrib Offshore Pipeline with Formation Water
1 2 3 4 5 6 7 8 9 10 11 12 13+BOL CI 0% 5.7 5.7 9.88 7.25 3.85 3.16 2.78 2.65 2.42 2.34 2.45 2.52 2.59
Corrosion ratemm/yr
Year
Corrib Onshore Pipeline EIS Q4.9 Assessment of Wet Gas Operation, Internal Corrosion and Erosion
COR-39-SH-0011 10
4.2.3 Lower Inhibited Corrosion Rates
The corrosion calculations have assumed a standard inhibited corrosion rate of 0.1 mm/year and the overall corrosion rate has been derived from the following relationship:
CR = (0.1 x f) + (CRu x (1-f)) where:
CR = Overall corrosion rate
f = Availability of corrosion inhibitor as a fraction
CRu = Predicted uninhibited corrosion rate
Current laboratory testing of the corrosion inhibitor to determine the required dose rate to achieve the inhibited corrosion rate indicates that a lower inhibited corrosion rate of 0.02 - 0.04 mm/yr is possible. This would extend the effective service life with respect to corrosion assuming 99% corrosion inhibitor availability and taking into account the inhibitive effect of methanol.
4.3 ONSHORE PIPELINE
The corrosion assessment for the Corrib pipeline shows that corrosion rates in the onshore section will be an order of magnitude lower. This is related to three factors:
(i) Ambient temperature (10ºC)
(ii) Higher pH
(iii) Higher dissolved Fe2+/3+ ion content.
The output from the HYDROCOR corrosion modelling indicates that the uninhibited corrosion rates assuming condensed water are initially 0.12 mm/yr at the BOL position declining to 0.02 mm/yr in later life. The predicted corrosion rate at the TOL position should stratified conditions occur is zero mm/yr. The predicted inhibited corrosion rate is <0.05mm/yr with an accumulated corrosion over 20 years of 0.6mm.
The uninhibited corrosion rates assuming formation water production (which will be limited by well control) are approximately 0.2 mm/yr at the BOL position (declining in later life) and zero mm/yr at the TOL position should stratified conditions occur. The predicted inhibited corrosion rate is <0.05mm/yr.
Initial results from the inhibitor selection programme indicate uninhibited corrosion rates at 10ºC of 0.006 to 0.02 mm/yr in condensed water and 0.007 to 0.04 mm/yr in formation water.
Inhibited corrosion rates will therefore be below 0.05 mm/yr and the 1 mm corrosion allowance will be more than sufficient to mitigate the internal corrosion threat to the onshore pipeline for the anticipated operating field life of 20 years.
In summary, very limited corrosion is expected in the onshore line and this is confirmed by the current ongoing corrosion inhibitor test programme.
Corrib Onshore Pipeline EIS Q4.9 Assessment of Wet Gas Operation, Internal Corrosion and Erosion
COR-39-SH-0011 11
4.4 CORROSION ALLOWANCE
On the basis of current Shell corrosion rate calculations and ongoing corrosion inhibitor testing, the 1 mm corrosion allowance is considered to be sufficient for the design life.
Shell does not use the generic fixed value corrosion allowance approach as practised by other operators because a specific assessment using the highly developed Shell CO2 corrosion prediction modelling coupled with a detailed flow assurance analysis is preferred. The corrosion allowance can then be tailored to the application. This is in accordance with the design considerations outlined in the EFC publication [7] on this subject:
“When evaluating a system's corrosivity, carbon steel is normally the first choice material. Based on the estimated corrosion rate (mm/year) for the system, the required corrosion allowance (mm) can be defined by summing the corrosion rate for the specified design lifetime. The corrosion allowance for topside equipment is often 0, 1.5, 3.0, 4.5 or 6 mm.”
The predicted inhibited corrosion rate of <0.05 mm/yr supports the selection of a 1 mm corrosion allowance to mitigate the internal corrosion threat to the onshore pipeline for the anticipated operating field life of 20 years. The ongoing corrosion inhibitor testing indicates much lower corrosion rates than 0.05 mm/yr for the onshore pipeline conditions. Taken together with corrosion monitoring and assessment during service this should allow further operation to meet the design life of 30 years if required. Benefit could also be taken for any gradual decrease in operating pressure over the years because less wall thickness would be required for pressure containment. However, this would also be influenced by any future tie-ins to the Corrib system.
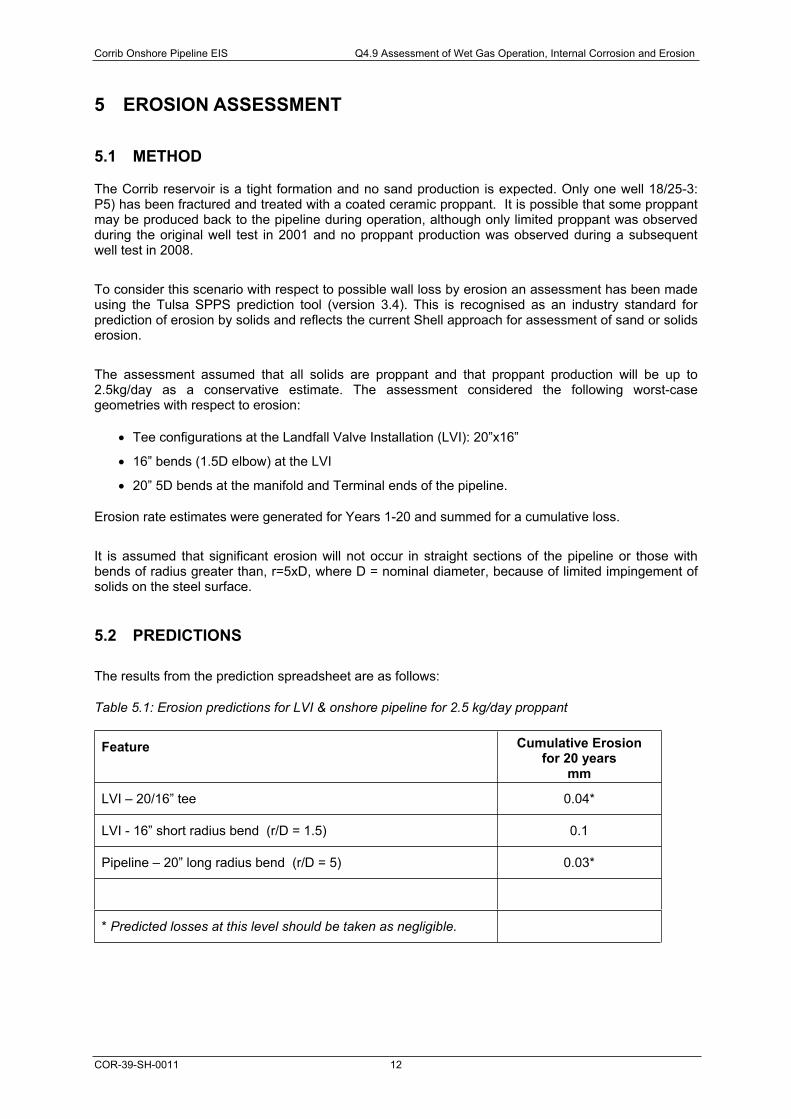
Corrib Onshore Pipeline EIS Q4.9 Assessment of Wet Gas Operation, Internal Corrosion and Erosion
COR-39-SH-0011 12
5 EROSION ASSESSMENT
5.1 METHOD
The Corrib reservoir is a tight formation and no sand production is expected. Only one well 18/25-3: P5) has been fractured and treated with a coated ceramic proppant. It is possible that some proppant may be produced back to the pipeline during operation, although only limited proppant was observed during the original well test in 2001 and no proppant production was observed during a subsequent well test in 2008.
To consider this scenario with respect to possible wall loss by erosion an assessment has been made using the Tulsa SPPS prediction tool (version 3.4). This is recognised as an industry standard for prediction of erosion by solids and reflects the current Shell approach for assessment of sand or solids erosion.
The assessment assumed that all solids are proppant and that proppant production will be up to 2.5kg/day as a conservative estimate. The assessment considered the following worst-case geometries with respect to erosion:
Tee configurations at the Landfall Valve Installation (LVI): 20”x16”
16” bends (1.5D elbow) at the LVI
20” 5D bends at the manifold and Terminal ends of the pipeline.
Erosion rate estimates were generated for Years 1-20 and summed for a cumulative loss.
It is assumed that significant erosion will not occur in straight sections of the pipeline or those with bends of radius greater than, r=5xD, where D = nominal diameter, because of limited impingement of solids on the steel surface.
5.2 PREDICTIONS
The results from the prediction spreadsheet are as follows:
Table 5.1: Erosion predictions for LVI & onshore pipeline for 2.5 kg/day proppant
Feature Cumulative Erosion for 20 years
mm
LVI – 20/16” tee 0.04*
LVI - 16” short radius bend (r/D = 1.5) 0.1
Pipeline – 20” long radius bend (r/D = 5) 0.03*
* Predicted losses at this level should be taken as negligible.
Corrib Onshore Pipeline EIS Q4.9 Assessment of Wet Gas Operation, Internal Corrosion and Erosion
COR-39-SH-0011 13
5.3 DISCUSSION
The prediction method should not be taken as providing an exact forecast but gives a reasonable indication of the erosion that may occur if proppant was produced over the full 20 year period. However, there is a finite amount of proppant in the well and the back-production, should it occur, will likely decrease with time. There is an acoustic monitoring probe installed on the subsea manifold and any indication of significant solids production would likely result in a well intervention or closing-in of the well.
The corrosion allowance needs to provide for losses from both corrosion and erosion. As discussed above the amount of corrosion allowance likely to be consumed by corrosion will depend on the effectiveness of the corrosion inhibitor. The carbon steel onshore pipeline corrosion rate can conservatively be assumed not to exceed the uninhibited rate that is predicted to be less than 0.05 mm/yr.
As the erosion rate predicted for the long radius bends of the pipeline is negligible, the combined losses due to corrosion and erosion in the onshore pipeline are therefore unlikely to exceed the 1mm corrosion allowance over the 20 year service life. This assumes that there are no significant synergistic effects, which is realistic because the corrosion rate here is governed by temperature rather than by protective scale formation.
However, the erosion rate will be greater in the smaller diameter pipework at the LVI, but the predicted worst case mean values are within the tolerances of the corrosion resistant materials selected for the LVI pipework. It can be concluded that erosion of the LVI is not expected to be significant and can be monitored by ultrasonic wall thickness measurements to provide additional assurance.
Corrib Onshore Pipeline EIS Q4.9 Assessment of Wet Gas Operation, Internal Corrosion and Erosion
COR-39-SH-0011 14
6 CONCLUSIONS
The assessment indicates that the expected corrosion and erosion rates in both the offshore and onshore sections of the Corrib pipeline are within the design corrosion allowances for a service life of 20 years provided corrosion mitigation with corrosion inhibitor and methanol is correctly applied. This assessment is supported by the extensive and successful Shell experience with operating wet gas pipelines.
The assessment predicts very low corrosion rates for the onshore section of the pipeline and this has been verified by the ongoing corrosion inhibitor test programme. Should corrosion occur it is more likely in the offshore pipeline close to the subsea manifold.

Corrib Onshore Pipeline EIS Q4.9 Assessment of Wet Gas Operation, Internal Corrosion and Erosion
COR-39-SH-0011 15
7 REFERENCES
1. S. Kapusta, B. Pots & R. Connell, NACE Corrosion/99, Paper 045.
2. C. de Waard & D.E Milliams, Corrosion, Vol 31, 5, (1975), p177.
3. C. de Waard, U. Lotz & D.E. Milliams, NACE Corrosion/91, Paper 577.
4. C. de Waard, U. Lotz & A. Dugstad, NACE Corrosion/95, Paper 128.
5. B. Pots, NACE Corrosion/95, Paper 132.
6. B. Pots & E. Hendriksen, NACE Corrosion/2000, Paper 031.
7. European Federation of Corrosion (EFC) Publication 23: CO2 Corrosion Control in Oil and Gas Production - Design Considerations.
ATTACHMENT Q4.9A
OVERVIEW OF SHELL WET GAS PIPELINES

A1
This list comprises an overview of wet gas pipelines that are operated primarily by Shell. There are a small number of pipelines included for which Shell is a partner. The list has been updated from 2003 to reflect new developments and is intended for internal use to demonstrate the validity of the Shell wet gas corrosion management philosophy and methodology.
The identity of the pipelines has been kept anonymous to respect individual Operating Company confidentiality. Pipelines with the identifier A, B, C, D & L are European pipelines and the remainder are global pipelines including the Americas, Middle East, and Asia. The list of European pipelines is comprehensive and is believed to include all Shell operated wet gas pipelines. The global list is less complete but represents a high proportion (>80%) of Shell operated wet gas pipelines. Note that pipelines where the mitigation is gas dehydration and inhibitor indicates that there is significant liquid carry-over which requires inhibiting.
The total Shell experience with operation of wet gas pipelines in Europe without a loss of containment incident amounts to 40,384 km years.

A2
Operating Temperature
pH2S
°C bar mbar mm/yA01 30 - - 0.2 Operating Inhibition 37 0.8 0.1 2A02 70 0.1302 - 9.5 Operating Inhibition 11 2 0.1 3A03 60 0.504 - 6.1 Operating Inhibition 26 3.6 0.1 3A04 70 - - 20.7 Operating Uninhibited 24 0.2 0.2 5A05 50 0.444 - 0.6 Operating Inhibition 18 7.0 0.2 4A06 50 - - 10.5 Operating Inhibition 16 1.3 0.1 -A07 70 0.651 - 6.9 Operating Inhibition 10 0.6 0.1 5A08 70 0.651 - 0.2 Operating Inhibition 10 0.6 0.1 4A09 65 - - 2.8 Operating Inhibition 20 1.0 0.1 4A10 70 0.00255 - 4.4 Operating Inhibition 36 2.0 0.1 8A11 100 - - 1.7 Operating Inhibition 23 3.8 0.1 3A12 50 0.45 - 9.3 Operating Inhibition 25 1.0 0.1 4A13 50 0.44 - 6.8 Operating Inhibition 24 1.2 0.2 9A14 70 0.638 - 6.8 Operating Inhibition 20 1.0 0.1 5A15 70 - - 3.6 Operating Inhibition 11 1.4 0.1 5A16 55 - - 22.1 Operating Inhibition 35 - 0.2 5A17 70 0.2 0 3.9 Operating Inhibition - 2.9 0.1 -A18 65 0.29 - 5.0 Operating Inhibition 21 2.9 0.1 7A19 85 0.693 - 5.8 Operating Inhibition 7 0.8 0.1 4A20 70 0.2 0 - Operating Inhibition 14 2.9 0.1 -A21 55 0.341 - 7.9 Not Operating Inhibition 30 2.5 0.1 2A22 70 0.0715 - 11.2 Operating Inhibition 11 1.0 0.1 5A23 50 - - 5.2 Operating Uninhibited 25 0.2 0.2 5A24 50 - - 2.2 Not Operating Preserved w/ N2 23 <0.05 <0.05 4A25 50 - - 0.9 Not Operating Preserved w/ N2 24 <0.05 <0.05 6A26 50 - - 2.3 Not Operating Preserved w/ N2 23 <0.05 <0.05 5A27 50 - - 2.8 Not Operating Preserved w/ N2 21 <0.05 <0.05 3A28 50 - - 74.2 Operating Preserved w/ N2 23 <0.05 <0.05 5A29 50 - - 2.6 Operating Uninhibited 25 0.2 0.2 1A30 50 - - 2.3 Operating Uninhibited 23 - 0.2 2A31 50 0.2016 - 6.1 Operating Inhibition 27 0.6 0.1 3A32 50 0.0836 - 2.4 Operating Inhibition 29 0.2 0.1 1A33 50 0.0968 - 3.1 Operating Inhibition 28 0.1 0.1 5A34 50 0.028 - 2.4 Operating Inhibition 28 0.1 0.1 5A35 50 - - 0.1 Operating Uninhibited 22 0.2 0.2 10A36 50 - - 0.1 Not Operating Preserved w/ N2 35 <0.05 <0.05 2A37 50 0.0168 - 2.1 Operating Uninhibited 20 0.2 0.2 6A38 50 0.0662 - 3.4 Operating Uninhibited 20 0.2 0.2 5A39 50 - - 3.4 Operating Uninhibited 14 0.2 0.2 4A40 50 - - 3.4 Operating Uninhibited 22 0.2 0.2 3A41 50 - - 6.8 Operating Uninhibited 20 0.2 0.2 6A42 70 0.0396 - 1.8 Operating Inhibition 37 0.6 0.1 4A43 50 0.0168 - 9.9 Operating Uninhibited 35 0.2 0.2 5A44 50 - - 6.5 Operating Uninhibited 22 0.2 0.2 6A45 50 0.01134 - 3.1 Operating Uninhibited 21 0.2 0.2 4A46 50 0.015 - 3.1 Operating Uninhibited 14 0.2 0.2 3A47 50 0.0143 - 6.3 Operating Uninhibited 21 0.2 0.2 5A48 50 0.0143 - 2.1 Operating Uninhibited 21 0.2 0.2 5A49 50 0.0192 - 3.8 Operating Uninhibited 21 0.2 0.2 2A50 50 0.0496 - 3.8 Operating Uninhibited 41 0.2 0.2 4A51 50 - - 2.2 Operating Uninhibited 41 0.2 0.2 5A52 30 0.0525 - 2.3 Operating Inhibition 37 0.75 0.1 1A53 50 0.0288 - 2.9 Operating Inhibition 31 0.7 0.1 4A54 30 0.048 - 2.6 Operating Inhibition 35 0.8 0.1 1B01 70 0.406 - 5.5 Operating Inhibition 18 3.9 0.2 -B02 70 0.406 - 5.0 Operating Inhibition 18 3.9 0.5 -B03 70 0.406 - 2.0 Operating Inhibition 18 3.9 0.27 -B04 60 0.476 - 102.6 Operating Glycol 6 3.1 0.15 -B05 104 3 - 23.0 Proposal Inhibition - 12 - -B06 125 2.55 - 3.8 Operating Inhibition 4 16.4 0.2 -B07 95 3.234 - 11.9 Operating Inhibition 7 17 0.2 -B08 95 2.52 - 34.0 Operating Inhibition 2 15 0.2 -
C01 68 0.4509 0 242.4 OperatingGlycol + pH Control +
Inhibition3 2.6 0.1 0
D01 50 0.7273 0 14.6 Operating Inhibition 4 17.3 0.2 -D02 30 0.1573 0 9.4 Operating Inhibition 28 2.08 0.2 4D03 40 0.23 0 17.0 Operating Inhibition 7 9.64 0.1 -D04 50 3.0495 0 19.6 Operating Inhibition 1 8.84 0.0001 -D05 50 0.589 0 0.1 Operating Inhibition 1 2.92 0.0001 -D06 27.2 0.07091 0 24.4 Operating Inhibition 19 1.56 0.1 3D07 33.7 0.07758 0 15.3 Operating Inhibition 15 2.52 0.3 1D08 49.3 0.50819 0 18.0 Operating Glycol + Inhibition 4 3.55 0.2 -D09 41.5 0.46814 0 81.5 Operating Glycol + Inhibition 7 10.9 0.3 -D10 27.2 0.36262 0 73.0 Operating Glycol + Inhibition 20 2.72 0.3 2D11 11.2 0.64428 0 36.6 Operating Glycol + Inhibition 12 0.61 0.1 -D12 29.1 0.08318 0 8.9 Operating Inhibition 12 2.3 0.4 1D13 11.7 0.10216 0 12.2 Operating Inhibition 16 2.57 0.3 2D14 50 0.2193 0 55.7 Operating Glycol + Inhibition 43 1.92 0.3 2D15 10.7 0.00561 0 0.6 Operating Uninhibited 39 0.53 0.1 -D16 13.8 0.00583 0 3.5 Operating Uninhibited 39 0.81 0.1 -D17 15 0.00605 0 2.0 Operating Uninhibited 39 0.64 0.1 -D18 14.2 0.00385 0 8.0 Operating Uninhibited 37 0.74 0.1 -D19 15 0.00638 0 3.0 Operating Uninhibited 28 0.3 0.1 -D20 14.3 0.00693 0 4.8 Operating Uninhibited 23 0.44 0.1 -D21 11.9 0.00627 0 2.5 Operating Uninhibited 23 0.28 0.1 -D22 14.6 0.85424 0 108.0 Operating Dehydration 24 7.83 0.01 3D23 30 0.06797 0 11.0 Operating Glycol + Inhibition 10 1.84 0.2 -
Assessed Corrosion
rate
Number of InspectionsIdentifier Status
Uninhibited corrosion Rate
Corrosion control(actual or proposed)
Length (Km)
pCO2 Years in Service
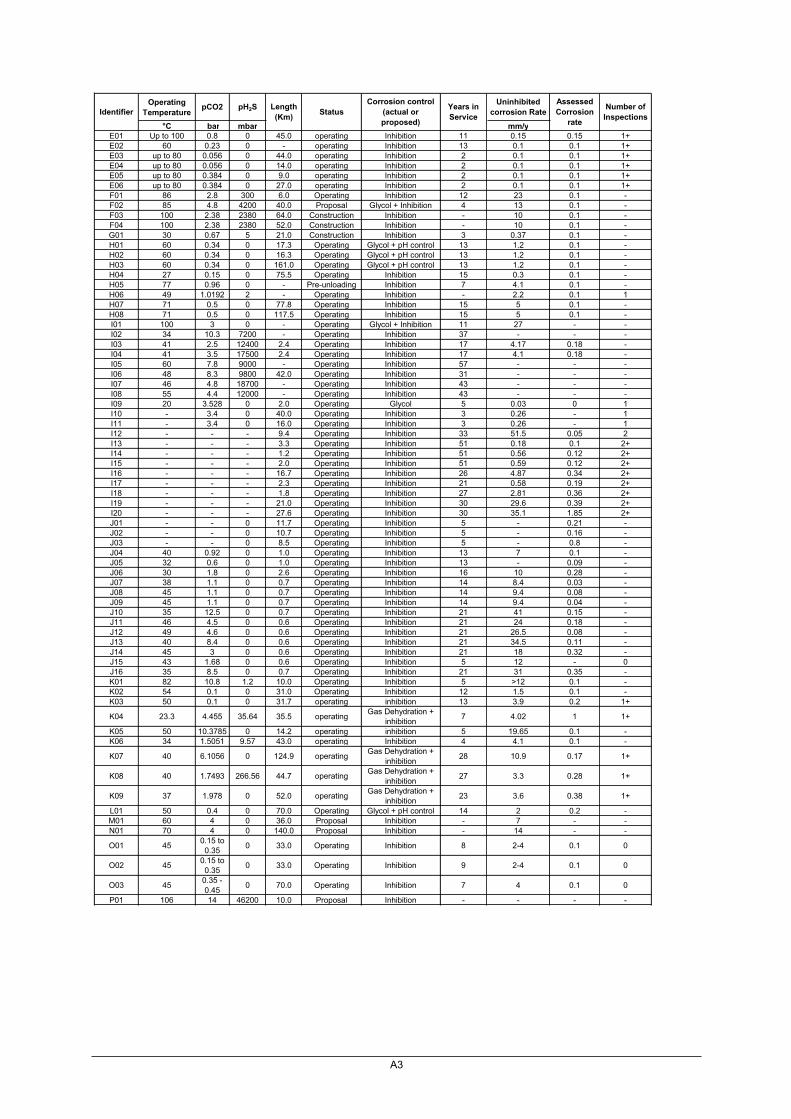
A3
Operating Temperature
pH2S
°C bar mbar mm/yE01 Up to 100 0.8 0 45.0 operating Inhibition 11 0.15 0.15 1+E02 60 0.23 0 - operating Inhibition 13 0.1 0.1 1+E03 up to 80 0.056 0 44.0 operating Inhibition 2 0.1 0.1 1+E04 up to 80 0.056 0 14.0 operating Inhibition 2 0.1 0.1 1+E05 up to 80 0.384 0 9.0 operating Inhibition 2 0.1 0.1 1+E06 up to 80 0.384 0 27.0 operating Inhibition 2 0.1 0.1 1+F01 86 2.8 300 6.0 Operating Inhibition 12 23 0.1 -F02 85 4.8 4200 40.0 Proposal Glycol + Inhibition 4 13 0.1 -F03 100 2.38 2380 64.0 Construction Inhibition - 10 0.1 -F04 100 2.38 2380 52.0 Construction Inhibition - 10 0.1 -G01 30 0.67 5 21.0 Construction Inhibition 3 0.37 0.1 -H01 60 0.34 0 17.3 Operating Glycol + pH control 13 1.2 0.1 -H02 60 0.34 0 16.3 Operating Glycol + pH control 13 1.2 0.1 -H03 60 0.34 0 161.0 Operating Glycol + pH control 13 1.2 0.1 -H04 27 0.15 0 75.5 Operating Inhibition 15 0.3 0.1 -H05 77 0.96 0 - Pre-unloading Inhibition 7 4.1 0.1 -H06 49 1.0192 2 - Operating Inhibition - 2.2 0.1 1H07 71 0.5 0 77.8 Operating Inhibition 15 5 0.1 -H08 71 0.5 0 117.5 Operating Inhibition 15 5 0.1 -I01 100 3 0 - Operating Glycol + Inhibition 11 27 - -I02 34 10.3 7200 - Operating Inhibition 37 - - -I03 41 2.5 12400 2.4 Operating Inhibition 17 4.17 0.18 -I04 41 3.5 17500 2.4 Operating Inhibition 17 4.1 0.18 -I05 60 7.8 9000 - Operating Inhibition 57 - - -I06 48 8.3 9800 42.0 Operating Inhibition 31 - - -I07 46 4.8 18700 - Operating Inhibition 43 - - -I08 55 4.4 12000 - Operating Inhibition 43 - - -I09 20 3.528 0 2.0 Operating Glycol 5 0.03 0 1I10 - 3.4 0 40.0 Operating Inhibition 3 0.26 - 1I11 - 3.4 0 16.0 Operating Inhibition 3 0.26 - 1I12 - - - 9.4 Operating Inhibition 33 51.5 0.05 2I13 - - - 3.3 Operating Inhibition 51 0.18 0.1 2+I14 - - - 1.2 Operating Inhibition 51 0.56 0.12 2+I15 - - - 2.0 Operating Inhibition 51 0.59 0.12 2+I16 - - - 16.7 Operating Inhibition 26 4.87 0.34 2+I17 - - - 2.3 Operating Inhibition 21 0.58 0.19 2+I18 - - - 1.8 Operating Inhibition 27 2.81 0.36 2+I19 - - - 21.0 Operating Inhibition 30 29.6 0.39 2+I20 - - - 27.6 Operating Inhibition 30 35.1 1.85 2+J01 - - 0 11.7 Operating Inhibition 5 - 0.21 -J02 - - 0 10.7 Operating Inhibition 5 - 0.16 -J03 - - 0 8.5 Operating Inhibition 5 - 0.8 -J04 40 0.92 0 1.0 Operating Inhibition 13 7 0.1 -J05 32 0.6 0 1.0 Operating Inhibition 13 - 0.09 -J06 30 1.8 0 2.6 Operating Inhibition 16 10 0.28 -J07 38 1.1 0 0.7 Operating Inhibition 14 8.4 0.03 -J08 45 1.1 0 0.7 Operating Inhibition 14 9.4 0.08 -J09 45 1.1 0 0.7 Operating Inhibition 14 9.4 0.04 -J10 35 12.5 0 0.7 Operating Inhibition 21 41 0.15 -J11 46 4.5 0 0.6 Operating Inhibition 21 24 0.18 -J12 49 4.6 0 0.6 Operating Inhibition 21 26.5 0.08 -J13 40 8.4 0 0.6 Operating Inhibition 21 34.5 0.11 -J14 45 3 0 0.6 Operating Inhibition 21 18 0.32 -J15 43 1.68 0 0.6 Operating Inhibition 5 12 - 0J16 35 8.5 0 0.7 Operating Inhibition 21 31 0.35 -K01 82 10.8 1.2 10.0 Operating Inhibition 5 >12 0.1 -K02 54 0.1 0 31.0 Operating Inhibition 12 1.5 0.1 -K03 50 0.1 0 31.7 operating inhibition 13 3.9 0.2 1+
K04 23.3 4.455 35.64 35.5 operatingGas Dehydration +
inhibition7 4.02 1 1+
K05 50 10.3785 0 14.2 operating inhibition 5 19.65 0.1 -K06 34 1.5051 9.57 43.0 operating Inhibition 4 4.1 0.1 -
K07 40 6.1056 0 124.9 operatingGas Dehydration +
inhibition28 10.9 0.17 1+
K08 40 1.7493 266.56 44.7 operatingGas Dehydration +
inhibition27 3.3 0.28 1+
K09 37 1.978 0 52.0 operatingGas Dehydration +
inhibition23 3.6 0.38 1+
L01 50 0.4 0 70.0 Operating Glycol + pH control 14 2 0.2 -M01 60 4 0 36.0 Proposal Inhibition - 7 - -N01 70 4 0 140.0 Proposal Inhibition - 14 - -
O01 450.15 to 0.35
0 33.0 Operating Inhibition 8 2-4 0.1 0
O02 450.15 to 0.35
0 33.0 Operating Inhibition 9 2-4 0.1 0
O03 450.35 - 0.45
0 70.0 Operating Inhibition 7 4 0.1 0
P01 106 14 46200 10.0 Proposal Inhibition - - - -
Assessed Corrosion
rate
Number of InspectionsIdentifier Status
Uninhibited corrosion Rate
Corrosion control(actual or proposed)
Length (Km)
pCO2 Years in Service

ATTACHMENT Q4.9B
HYDROCOR OUTPUT FOR YEAR 1: CO2 CORROSION PROFILE (mm/yr)
FOR CORRIB PIPELINE BOTTOM OF THE LINE (BOL)
AND TOP OF THE LINE (TOL) AT 75ºC
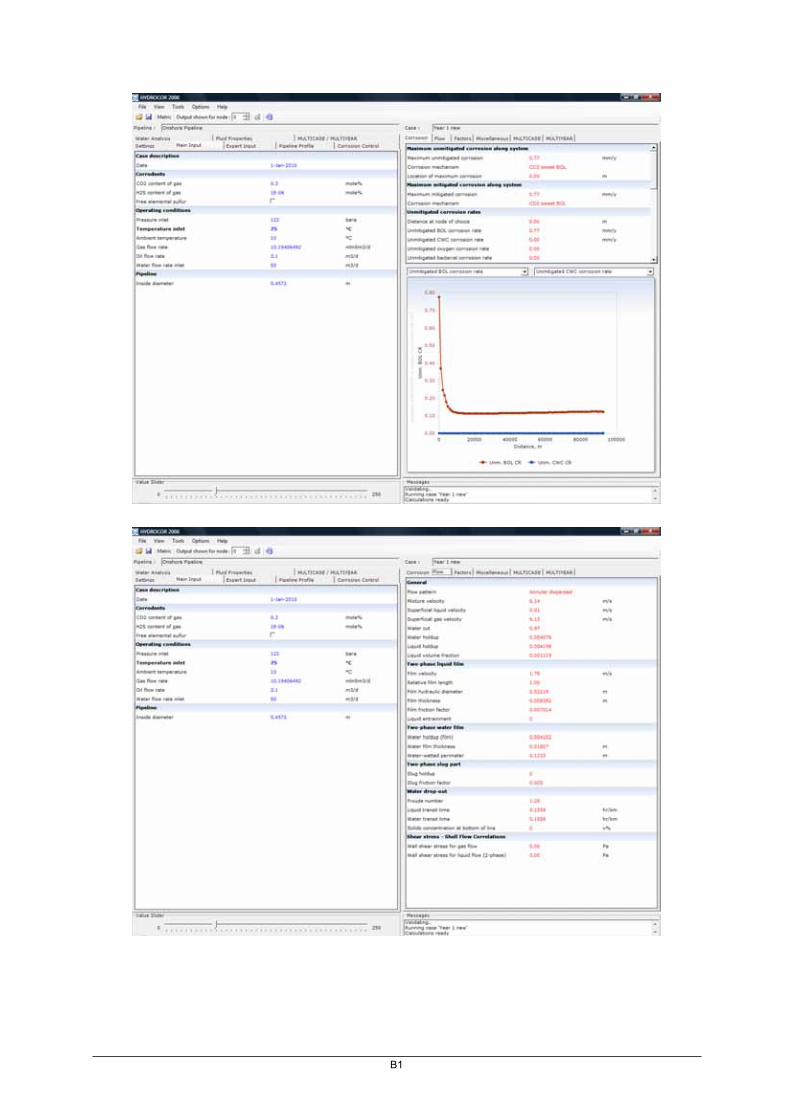
B1

ATTACHMENT Q4.9C
HYDROCOR OUTPUT: CO2 CORROSION PROFILE (mm/yr)
FOR CORRIB PIPELINE BOTTOM OF THE LINE (BOL)
AND TOP OF THE LINE (TOL) AT 60ºC
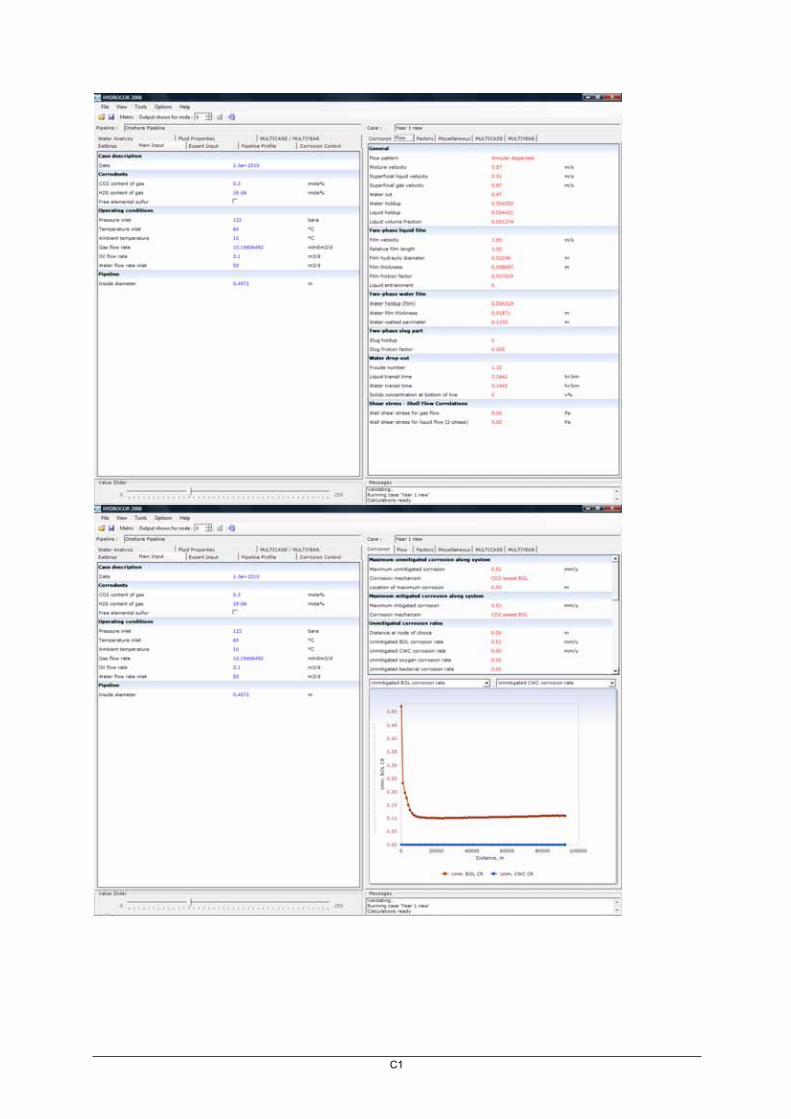
C1
ATTACHMENT Q4.9D
HYDROCOR OUTPUT: CO2 CORROSION PROFILE (mm/yr)
FOR CORRIB PIPELINE BOTTOM OF THE LINE (BOL) AND TOP OF THE LINE (TOL)
WITH FORMATION WATER AT 60ºC
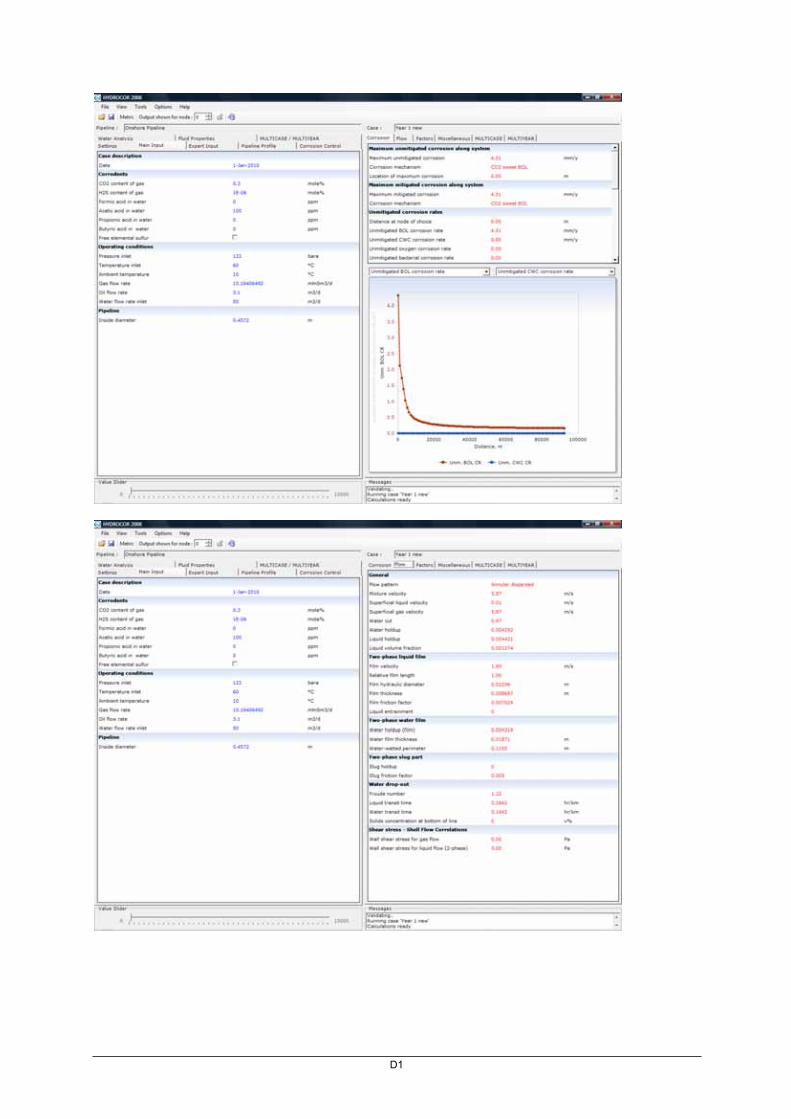
D1
ATTACHMENT Q4.9E
ELEVATION PROFILE OF CORRIB PIPELINE
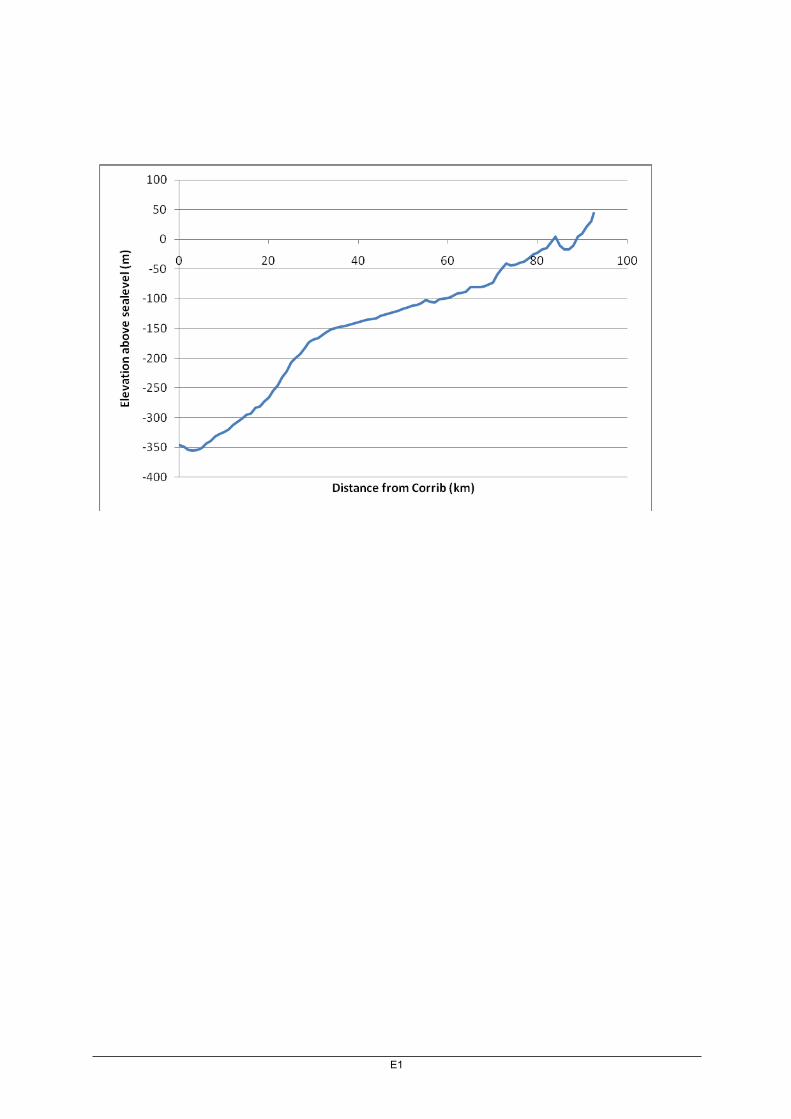
E1
GS.10.50885UNRESTRICTED
Q4.10 - Corrib onshore pipeline - denting and puncturing evaluation
Corrib onshore pipeline - denting and puncturing evaluation
by
R.W.J. Koers M. Church
GS.10.50885UNRESTRICTED
UNRESTRICTED
This document is made available subject to the condition that the recipient will neither use nor disclose the contents except asagreed in writing with the copyright owner. Copyright is vested in Shell Global Solutions International B.V., The Hague.
© Shell Global Solutions International B.V., 2010. All rights reserved.
Neither the whole nor any part of this document may be reproduced or distributed in any form or by any means (electronic, mechanical, reprographic, recording or otherwise) without the prior written consent of the copyright owner.
Shell Global Solutions is a trading style used by a network of technology companies of the Shell Group.
GS.10.50885 1 UNRESTRICTED
Summary The objective of the technical studies covered by this report is to evaluate the potential for mechanical damage of the Corrib onshore pipeline by third party activities (which may include those of contractors working near the pipeline on SEPIL’s behalf) that may lead to loss of containment.
This report describes the results of an evaluation of the effect of third party mechanical damage on the integrity for the landfall section upstream of the LVI and the 8.3 km downstream of the LVI to the onshore terminal.
The potential for damage leading to loss of containment has been correlated with the puncture and denting resistance for the Corrib pipeline (note that the higher the pressure in the pipeline the more energy is needed to dent the pipe wall). It is concluded that:
In order to puncture the pipe an excavator in excess of 65 tonnes weight would be required (the estimated energy required would be equivalent to that of an excavator of 150 tonnes weight), this is due to the large wall thickness of the pipeline. Puncturing by a smaller excavator is highly unlikely, puncturing by a plough would not occur.
Denting or gouging of the pipeline that may not immediately lead to loss of containment but may result in subsequent failure should the pressure in the pipeline increase (so-called burst pressure) would require an excavator in excess of 65 tonnes to produce a dent gouge that would fail at a burst pressure less than Maximum Allowable Operating Pressures (MAOP).
The output of this evaluation and conclusions drawn provide input to the Quantitative Risk Assessment, QRA, in order that a potential frequency, or range of frequencies, of third party damage leading to loss of containment, can be applied that is specifically relevant to the Corrib pipeline. The output of the dent and gouge analysis also provides input to development of an operational phase procedure for follow-up action to be taken in the event that the pipeline should ever suffer such damage.
Amsterdam, May 2010

GS.10.50885 2 UNRESTRICTED
Table of contents
Summary 11. Introduction 32. Objective 33. Design conditions and operating conditions 34. Material properties 45. Punctures, dents and gouges (third party interference) 45.1 Damage capacity of excavators 45.2 Pipeline resistance to mechanical damage 65.2.1 Resistance to denting 65.2.2 Resistance to puncture 75.3 Possible damage due to an excavator 115.3.1 Denting 115.3.2 Puncturing 125.4 Burst strength pipe dented pipe 135.4.1 Burst strength pipe containing a plain dent 135.4.2 Burst strength pipe containing a dent with a gouge 155.4.3 Results burst strength predictions 17
6. Mitigation of mechanical damage 187. Conclusions 188. References 20
GS.10.50885 3 UNRESTRICTED
1. Introduction This report describes the results of an evaluation of the effect of potential third party mechanical damage on the integrity for the landfall section upstream of the LVI and the 8.3 km downstream of the LVI to the onshore terminal.
2. Objective The objective of the technical studies covered by this report is to evaluate the potential for mechanical damage of the Corrib onshore pipeline by third party activities (which may include those of contractors working near the pipeline on SEPIL’s behalf) that may lead to loss of containment.
This report describes the results of an evaluation of the effect of third party mechanical damage on the integrity for the landfall section upstream of the LVI and the 8.3 km downstream of the LVI to the onshore terminal. The potential for damage takes account of:
Immediate puncture leading to loss of containment.
Denting or gouging that may not immediately lead to loss of containment but may result in subsequent failure should the pressure in the pipeline increase (so-called burst pressure).
Note that although activities around the pipeline such as construction using mechanical excavators or a farmer using a plough are a possible threat, operational phase controls, for example through the application of a Permit to Work (for construction activities), and ongoing surveillance of the pipeline right of way will be established to counter this threat.
3. Design conditions and operating conditions The primary design code is I.S. EN 14161 [11] with I.S. 328 [12] and BS PD 8010-1 [13] as the back-up codes (I.S. 328 has priority over PD 8010).
The landfall section of the offshore pipeline and the onshore section (8.3 km) are designed with a nominal outside diameter of 508 mm (20”) and a nominal wall thickness of 27.1 mm. The line pipe was delivered to DNV OS-F101 SAWL 485 II FD. The pipes have a Submerged Arc Welded Longitudinal seam weld.
The nominal wall thickness of 27.1 mm comprises 25.1 mm for pressure containment, 1 mm mill tolerance and 1 mm corrosion allowance.
The design and operating conditions are listed in Table 1.
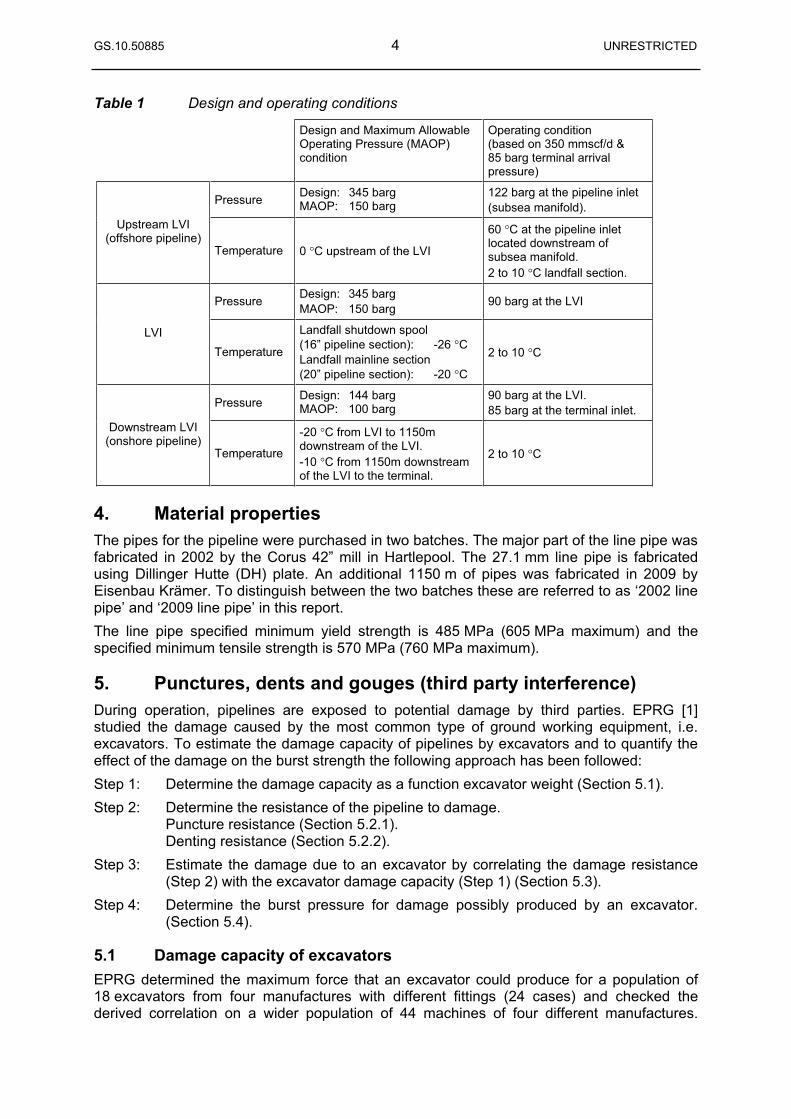
GS.10.50885 4 UNRESTRICTED
Table 1 Design and operating conditions
Design and Maximum Allowable Operating Pressure (MAOP) condition
Operating condition (based on 350 mmscf/d & 85 barg terminal arrival pressure)
PressureDesign: 345 barg MAOP: 150 barg
122 barg at the pipeline inlet (subsea manifold).
Upstream LVI (offshore pipeline)
Temperature 0 C upstream of the LVI
60 C at the pipeline inlet located downstream of subsea manifold. 2 to 10 C landfall section.
PressureDesign: 345 barg MAOP: 150 barg
90 barg at the LVI
LVI
Temperature
Landfall shutdown spool (16” pipeline section): -26 CLandfall mainline section (20” pipeline section): -20 C
2 to 10 C
PressureDesign: 144 barg MAOP: 100 barg
90 barg at the LVI. 85 barg at the terminal inlet.
Downstream LVI (onshore pipeline)
Temperature
-20 C from LVI to 1150m downstream of the LVI. -10 C from 1150m downstream of the LVI to the terminal.
2 to 10 C
4. Material properties The pipes for the pipeline were purchased in two batches. The major part of the line pipe was fabricated in 2002 by the Corus 42” mill in Hartlepool. The 27.1 mm line pipe is fabricated using Dillinger Hutte (DH) plate. An additional 1150 m of pipes was fabricated in 2009 by Eisenbau Krämer. To distinguish between the two batches these are referred to as ‘2002 line pipe’ and ‘2009 line pipe’ in this report.
The line pipe specified minimum yield strength is 485 MPa (605 MPa maximum) and the specified minimum tensile strength is 570 MPa (760 MPa maximum).
5. Punctures, dents and gouges (third party interference) During operation, pipelines are exposed to potential damage by third parties. EPRG [1] studied the damage caused by the most common type of ground working equipment, i.e. excavators. To estimate the damage capacity of pipelines by excavators and to quantify the effect of the damage on the burst strength the following approach has been followed:
Step 1: Determine the damage capacity as a function excavator weight (Section 5.1).
Step 2: Determine the resistance of the pipeline to damage. Puncture resistance (Section 5.2.1). Denting resistance (Section 5.2.2).
Step 3: Estimate the damage due to an excavator by correlating the damage resistance (Step 2) with the excavator damage capacity (Step 1) (Section 5.3).
Step 4: Determine the burst pressure for damage possibly produced by an excavator. (Section 5.4).
5.1 Damage capacity of excavators EPRG determined the maximum force that an excavator could produce for a population of 18 excavators from four manufactures with different fittings (24 cases) and checked the derived correlation on a wider population of 44 machines of four different manufactures.
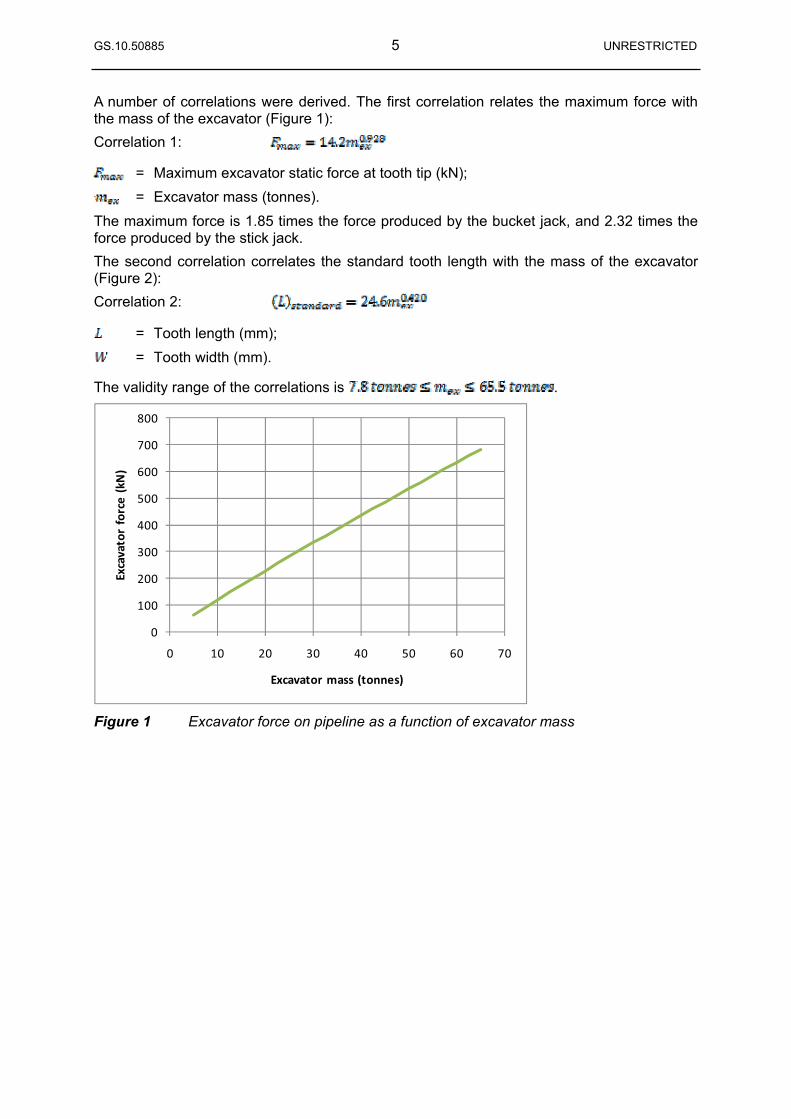
GS.10.50885 5 UNRESTRICTED
A number of correlations were derived. The first correlation relates the maximum force with the mass of the excavator (Figure 1):
Correlation 1:
= Maximum excavator static force at tooth tip (kN);
= Excavator mass (tonnes).
The maximum force is 1.85 times the force produced by the bucket jack, and 2.32 times the force produced by the stick jack.
The second correlation correlates the standard tooth length with the mass of the excavator (Figure 2):
Correlation 2:
= Tooth length (mm);
= Tooth width (mm).
The validity range of the correlations is .
0
100
200
300
400
500
600
700
800
0 10 20 30 40 50 60 70
Excavatorforce(kN)
Excavator mass (tonnes)
Figure 1 Excavator force on pipeline as a function of excavator mass
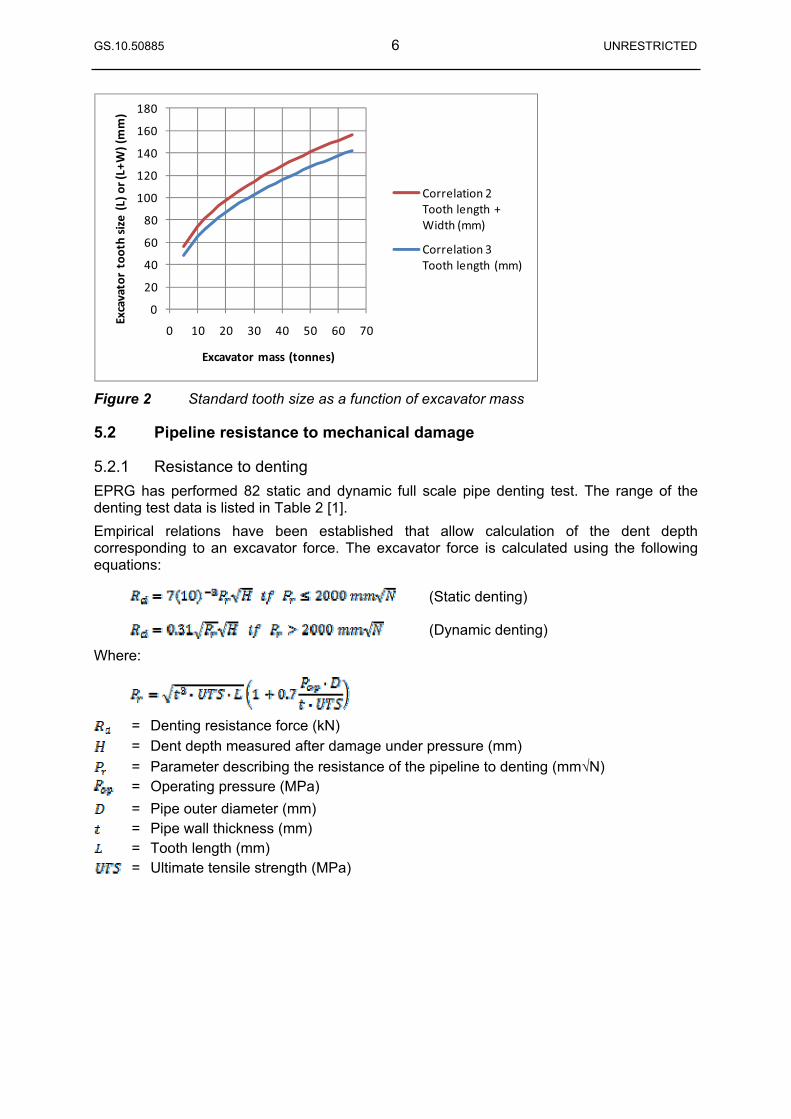
GS.10.50885 6 UNRESTRICTED
0
20
40
60
80
100
120
140
160
180
0 10 20 30 40 50 60 70
Excavatortoothsize
(L)o
r(L+W)(mm)
Excavator mass (tonnes)
Correlation 2Tooth length +Width (mm)
Correlation 3Tooth length (mm)
Figure 2 Standard tooth size as a function of excavator mass
5.2 Pipeline resistance to mechanical damage
5.2.1 Resistance to denting
EPRG has performed 82 static and dynamic full scale pipe denting test. The range of the denting test data is listed in Table 2 [1].
Empirical relations have been established that allow calculation of the dent depth corresponding to an excavator force. The excavator force is calculated using the following equations:
(Static denting)
(Dynamic denting)
Where:
= Denting resistance force (kN)
= Dent depth measured after damage under pressure (mm)
= Parameter describing the resistance of the pipeline to denting (mm N) = Operating pressure (MPa)
= Pipe outer diameter (mm) = Pipe wall thickness (mm) = Tooth length (mm)
= Ultimate tensile strength (MPa)

GS.10.50885 7 UNRESTRICTED
Table 2 Range of values tested for the static and dynamic resistance to denting [1]
Parameter Range of values Pipe outside diameter (mm) 168.3-1220
Pipe thickness (mm) 3.2-18.6
Hoop stress level 0-72 % SMYS
Ultimate tensile strength (MPa) 413-665 MPa
Based on these equations the denting resistance as a function of tooth length and dent depth for the Corrib line pipe dimensions is plotted in Figure 3 for the minimum operating pressure of 85 bar. A higher pressure would increase the resistance to denting. The interpretation of Figure 3 is as follows. An excavator with a tooth length of 80 mm requires a force equal to 282 kN to produce a dent with depth of 5 % of the outer diameter.
0
50
100
150
200
250
300
350
400
0 20 40 60 80 100
Pipe
resistance
tode
nting(kN)
Excavator tooth length(mm)
7% dent
5 % dent
3 % dent
Figure 3 Pipe resistance to denting as a function of the excavator tooth length (85 barg)
5.2.2 Resistance to puncture
The resistance of line pipe against puncture has been a topic of several studies. The different models have been evaluated against experimental data. The range of values tested for static and dynamic puncturing are summarised in Table 3.
Table 3 Range of values tested for the static and dynamic resistance to puncturing
Parameter Range of values Pipe outside diameter (mm) 168.3-914,4
Pipe thickness (mm) 3.2-12.5
Hoop stress level 0-86 % SMYS
Ultimate tensile strength (MPa) 402-728 MPa
Tooth half perimeter (length + width) (mm) 15-75
In Reference [5] different puncture resistance models have been compared against experimental data from EPRG and Battelle, and a new model has been proposed. For this report the verification has been extended with the model presented in [6, 7] and using additional experimental data from the University of Western Australia [7]. The test data is

GS.10.50885 8 UNRESTRICTED
limited to relatively thin pipe walls. This is because pipelines with a wall thickness up to around 12.5 mm are most vulnerable to puncturing.
Puncture model 1 (Spiekhout 1987), [2]:
Puncture model 2 (Spiekhout 1995), [3]:
Puncture model 3 (Corbin and Vogt), [4]:
Puncture model 4 (Driver and Zimmerman), [5]:
Puncture model 5 (EPRG - mean), [1]:
Puncture model 6 (EPRG – lower bound), [1] :
Puncture model 7 (Brooker), [6]:
= Puncture resistance force (kN) = Pipe outside diameter (mm)
= Pipe wall thickness (mm) = Tooth length (mm) = Tooth width (mm) = Material yield stress (0.5% strain) (MPa)
= Material ultimate tensile strength (MPa) = 4.8 for quasi-static loads
4.0 for dynamic loads
The different puncture models have been verified against in total 55 experiments from Battelle, EPRG and the University of Western Australia. The results are plotted in Figures 4 to 10 and summarised in Table 4. The ratio of the measured puncture load and the predicted puncture load is used to describe the scatter for each model. A value larger than 1.0 means that the puncture load is predicted to be conservative. All models have a mean value larger than 1.0. The least scatter is obtained for model number 7 and therefore this has been used to estimate the puncturing resistance for the Corrib pipeline.
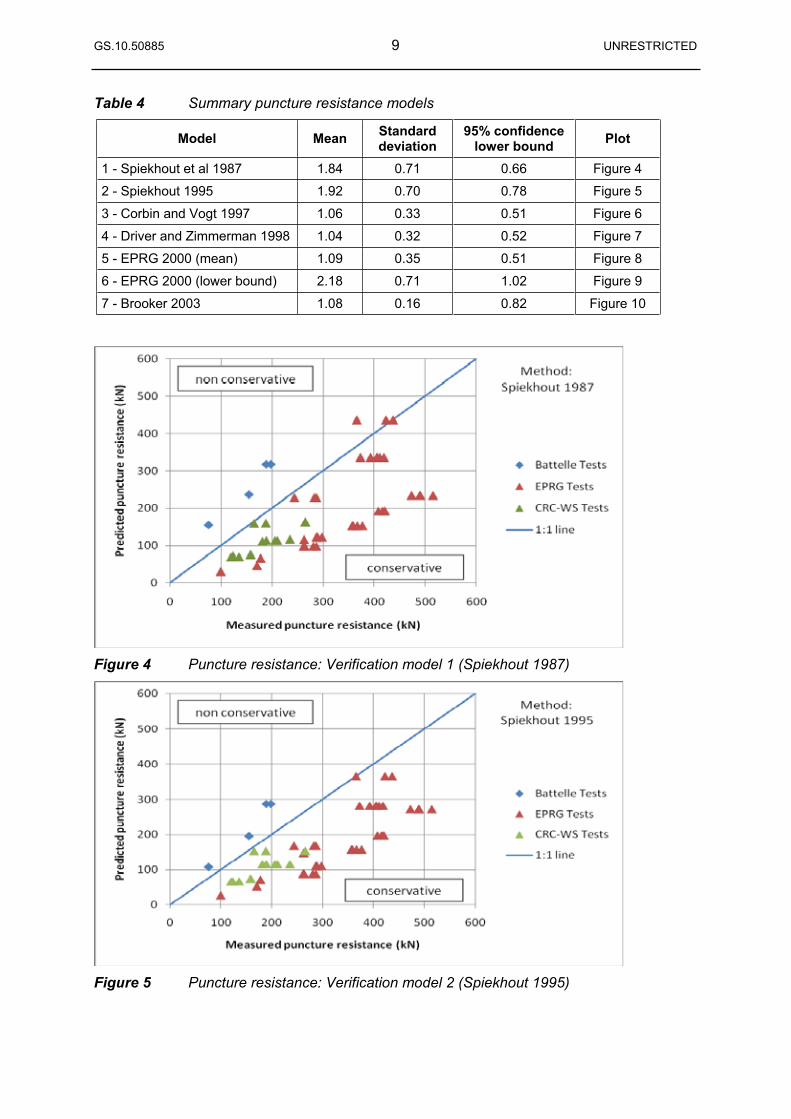
GS.10.50885 9 UNRESTRICTED
Table 4 Summary puncture resistance models
Model Mean Standard deviation
95% confidence lower bound Plot
1 - Spiekhout et al 1987 1.84 0.71 0.66 Figure 4
2 - Spiekhout 1995 1.92 0.70 0.78 Figure 5
3 - Corbin and Vogt 1997 1.06 0.33 0.51 Figure 6
4 - Driver and Zimmerman 1998 1.04 0.32 0.52 Figure 7
5 - EPRG 2000 (mean) 1.09 0.35 0.51 Figure 8
6 - EPRG 2000 (lower bound) 2.18 0.71 1.02 Figure 9
7 - Brooker 2003 1.08 0.16 0.82 Figure 10
Figure 4 Puncture resistance: Verification model 1 (Spiekhout 1987)
Figure 5 Puncture resistance: Verification model 2 (Spiekhout 1995)
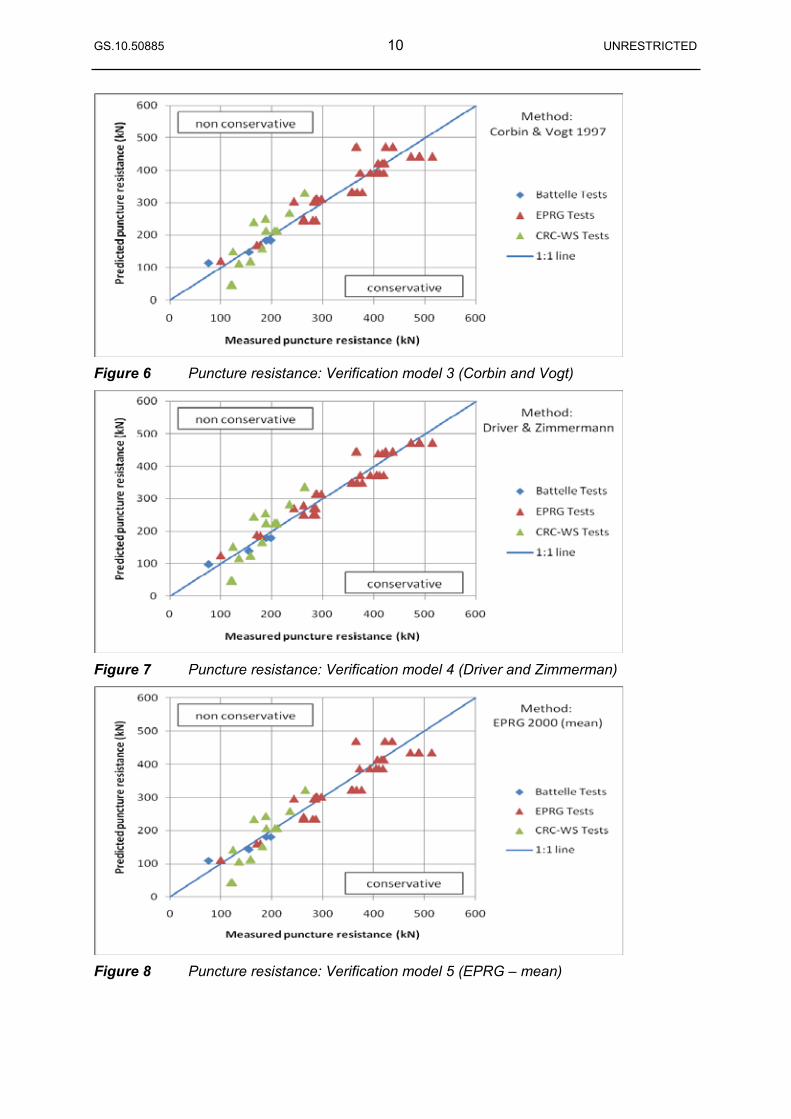
GS.10.50885 10 UNRESTRICTED
Figure 6 Puncture resistance: Verification model 3 (Corbin and Vogt)
Figure 7 Puncture resistance: Verification model 4 (Driver and Zimmerman)
Figure 8 Puncture resistance: Verification model 5 (EPRG – mean)
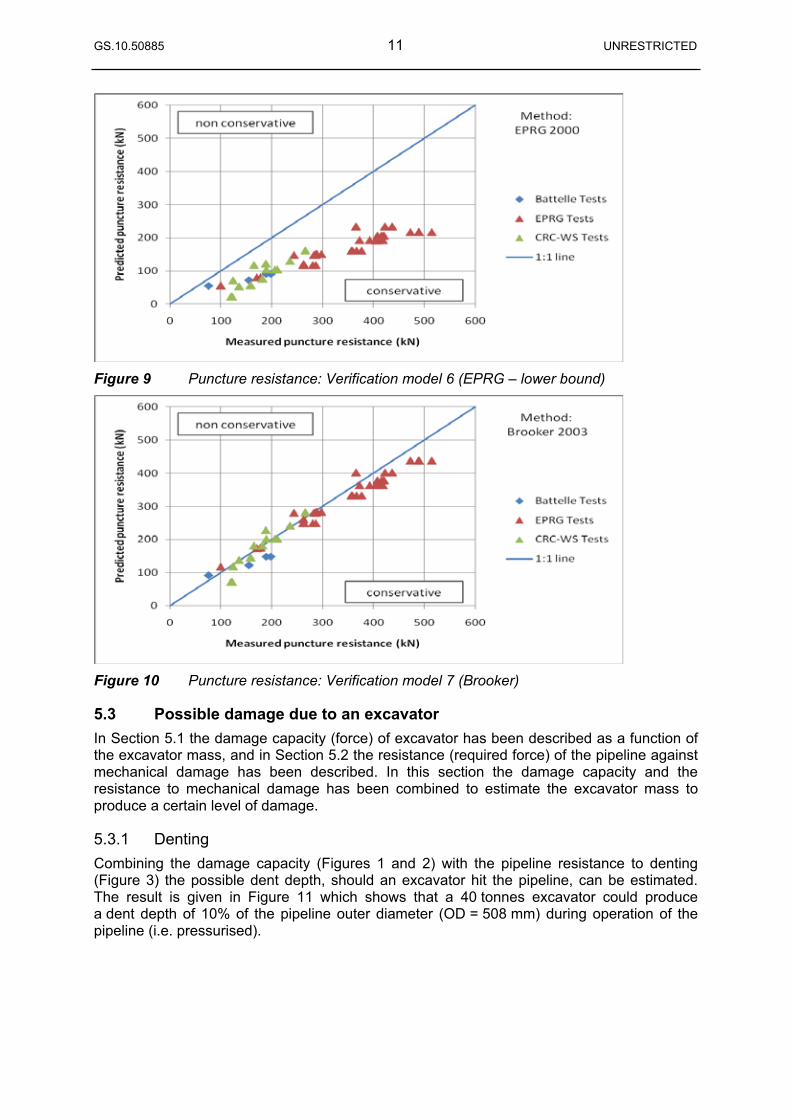
GS.10.50885 11 UNRESTRICTED
Figure 9 Puncture resistance: Verification model 6 (EPRG – lower bound)
Figure 10 Puncture resistance: Verification model 7 (Brooker)
5.3 Possible damage due to an excavator In Section 5.1 the damage capacity (force) of excavator has been described as a function of the excavator mass, and in Section 5.2 the resistance (required force) of the pipeline against mechanical damage has been described. In this section the damage capacity and the resistance to mechanical damage has been combined to estimate the excavator mass to produce a certain level of damage.
5.3.1 Denting
Combining the damage capacity (Figures 1 and 2) with the pipeline resistance to denting (Figure 3) the possible dent depth, should an excavator hit the pipeline, can be estimated. The result is given in Figure 11 which shows that a 40 tonnes excavator could produce a dent depth of 10% of the pipeline outer diameter (OD = 508 mm) during operation of the pipeline (i.e. pressurised).
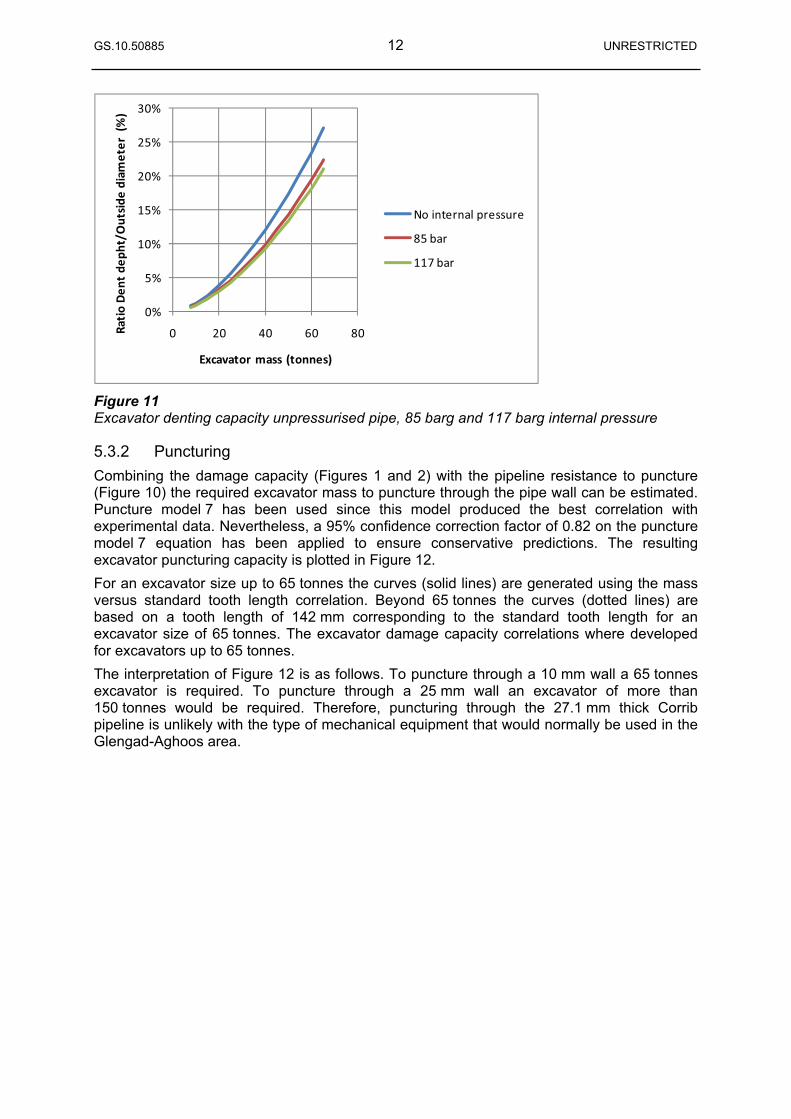
GS.10.50885 12 UNRESTRICTED
0%
5%
10%
15%
20%
25%
30%
0 20 40 60 80RatioDen
tde
pht/Outside
diam
eter
(%)
Excavator mass (tonnes)
No internal pressure
85 bar
117 bar
Figure 11 Excavator denting capacity unpressurised pipe, 85 barg and 117 barg internal pressure
5.3.2 Puncturing
Combining the damage capacity (Figures 1 and 2) with the pipeline resistance to puncture (Figure 10) the required excavator mass to puncture through the pipe wall can be estimated. Puncture model 7 has been used since this model produced the best correlation with experimental data. Nevertheless, a 95% confidence correction factor of 0.82 on the puncture model 7 equation has been applied to ensure conservative predictions. The resulting excavator puncturing capacity is plotted in Figure 12.
For an excavator size up to 65 tonnes the curves (solid lines) are generated using the mass versus standard tooth length correlation. Beyond 65 tonnes the curves (dotted lines) are based on a tooth length of 142 mm corresponding to the standard tooth length for an excavator size of 65 tonnes. The excavator damage capacity correlations where developed for excavators up to 65 tonnes.
The interpretation of Figure 12 is as follows. To puncture through a 10 mm wall a 65 tonnes excavator is required. To puncture through a 25 mm wall an excavator of more than 150 tonnes would be required. Therefore, puncturing through the 27.1 mm thick Corrib pipeline is unlikely with the type of mechanical equipment that would normally be used in the Glengad-Aghoos area.
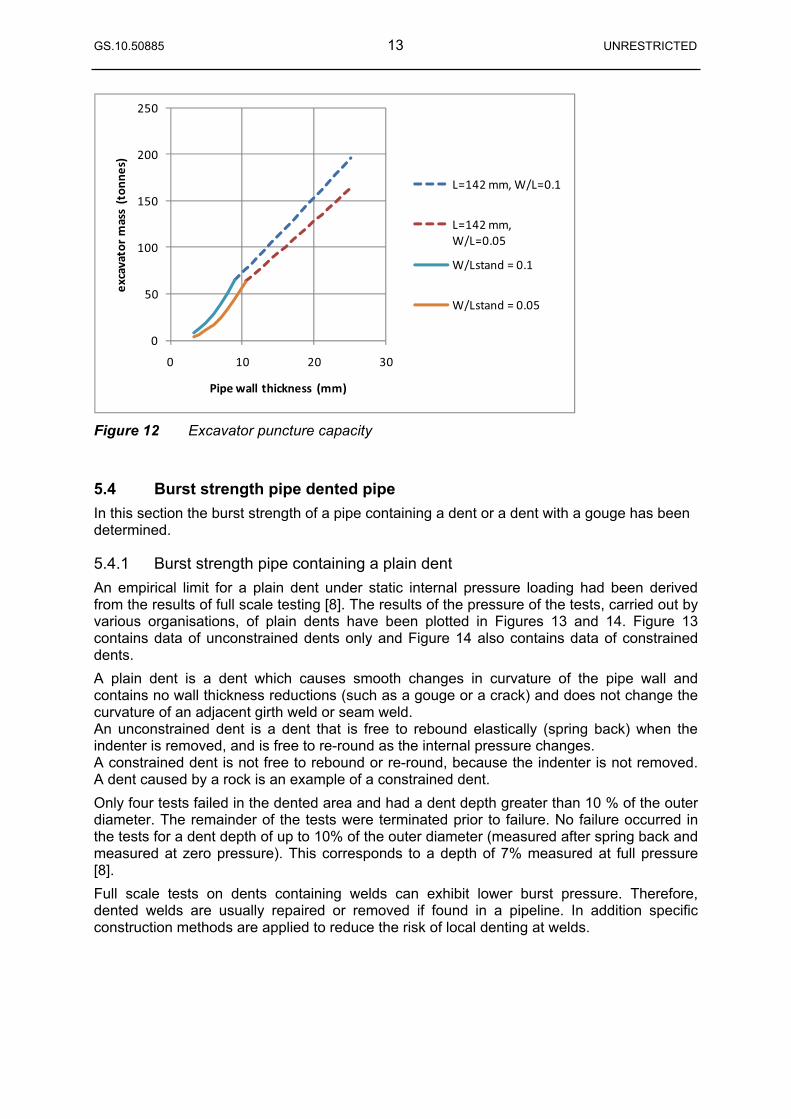
GS.10.50885 13 UNRESTRICTED
0
50
100
150
200
250
0 10 20 30
excavatormass(ton
nes)
Pipe wall thickness (mm)
L=142mm, W/L=0.1
L=142mm,W/L=0.05
W/Lstand = 0.1
W/Lstand = 0.05
Figure 12 Excavator puncture capacity
5.4 Burst strength pipe dented pipe In this section the burst strength of a pipe containing a dent or a dent with a gouge has been determined.
5.4.1 Burst strength pipe containing a plain dent
An empirical limit for a plain dent under static internal pressure loading had been derived from the results of full scale testing [8]. The results of the pressure of the tests, carried out by various organisations, of plain dents have been plotted in Figures 13 and 14. Figure 13 contains data of unconstrained dents only and Figure 14 also contains data of constrained dents.
A plain dent is a dent which causes smooth changes in curvature of the pipe wall and contains no wall thickness reductions (such as a gouge or a crack) and does not change the curvature of an adjacent girth weld or seam weld. An unconstrained dent is a dent that is free to rebound elastically (spring back) when the indenter is removed, and is free to re-round as the internal pressure changes. A constrained dent is not free to rebound or re-round, because the indenter is not removed. A dent caused by a rock is an example of a constrained dent.
Only four tests failed in the dented area and had a dent depth greater than 10 % of the outer diameter. The remainder of the tests were terminated prior to failure. No failure occurred in the tests for a dent depth of up to 10% of the outer diameter (measured after spring back and measured at zero pressure). This corresponds to a depth of 7% measured at full pressure [8].
Full scale tests on dents containing welds can exhibit lower burst pressure. Therefore, dented welds are usually repaired or removed if found in a pipeline. In addition specific construction methods are applied to reduce the risk of local denting at welds.
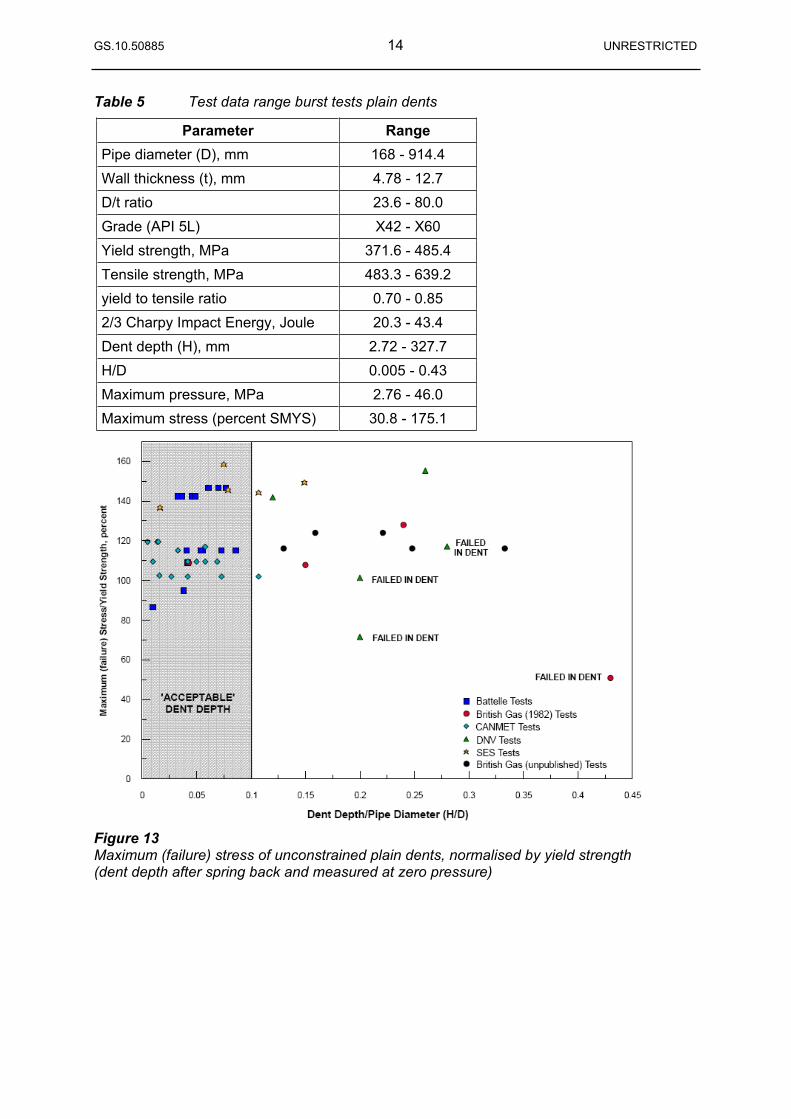
GS.10.50885 14 UNRESTRICTED
Table 5 Test data range burst tests plain dents
Parameter Range Pipe diameter (D), mm 168 - 914.4
Wall thickness (t), mm 4.78 - 12.7
D/t ratio 23.6 - 80.0
Grade (API 5L) X42 - X60
Yield strength, MPa 371.6 - 485.4
Tensile strength, MPa 483.3 - 639.2
yield to tensile ratio 0.70 - 0.85
2/3 Charpy Impact Energy, Joule 20.3 - 43.4
Dent depth (H), mm 2.72 - 327.7
H/D 0.005 - 0.43
Maximum pressure, MPa 2.76 - 46.0
Maximum stress (percent SMYS) 30.8 - 175.1
Figure 13 Maximum (failure) stress of unconstrained plain dents, normalised by yield strength (dent depth after spring back and measured at zero pressure)
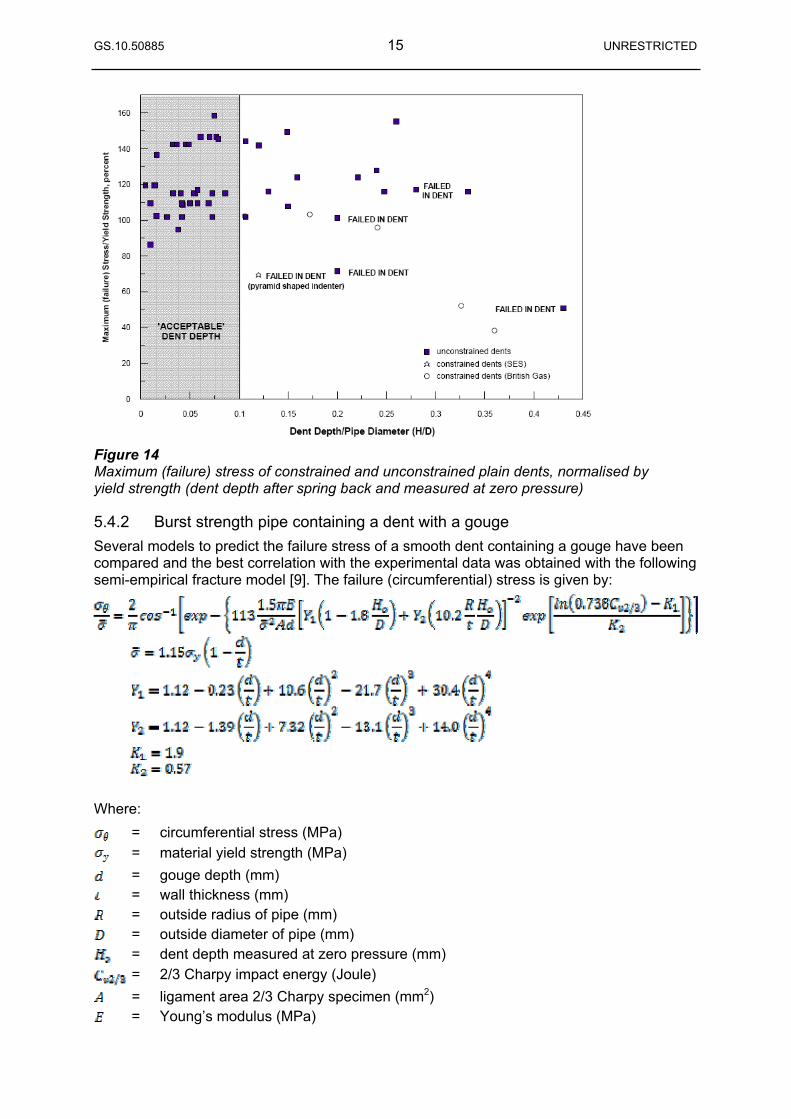
GS.10.50885 15 UNRESTRICTED
Figure 14 Maximum (failure) stress of constrained and unconstrained plain dents, normalised by yield strength (dent depth after spring back and measured at zero pressure)
5.4.2 Burst strength pipe containing a dent with a gouge
Several models to predict the failure stress of a smooth dent containing a gouge have been compared and the best correlation with the experimental data was obtained with the following semi-empirical fracture model [9]. The failure (circumferential) stress is given by:
Where:
= circumferential stress (MPa)
= material yield strength (MPa)
= gouge depth (mm) = wall thickness (mm) = outside radius of pipe (mm) = outside diameter of pipe (mm) = dent depth measured at zero pressure (mm)
= 2/3 Charpy impact energy (Joule)
= ligament area 2/3 Charpy specimen (mm2) = Young’s modulus (MPa)
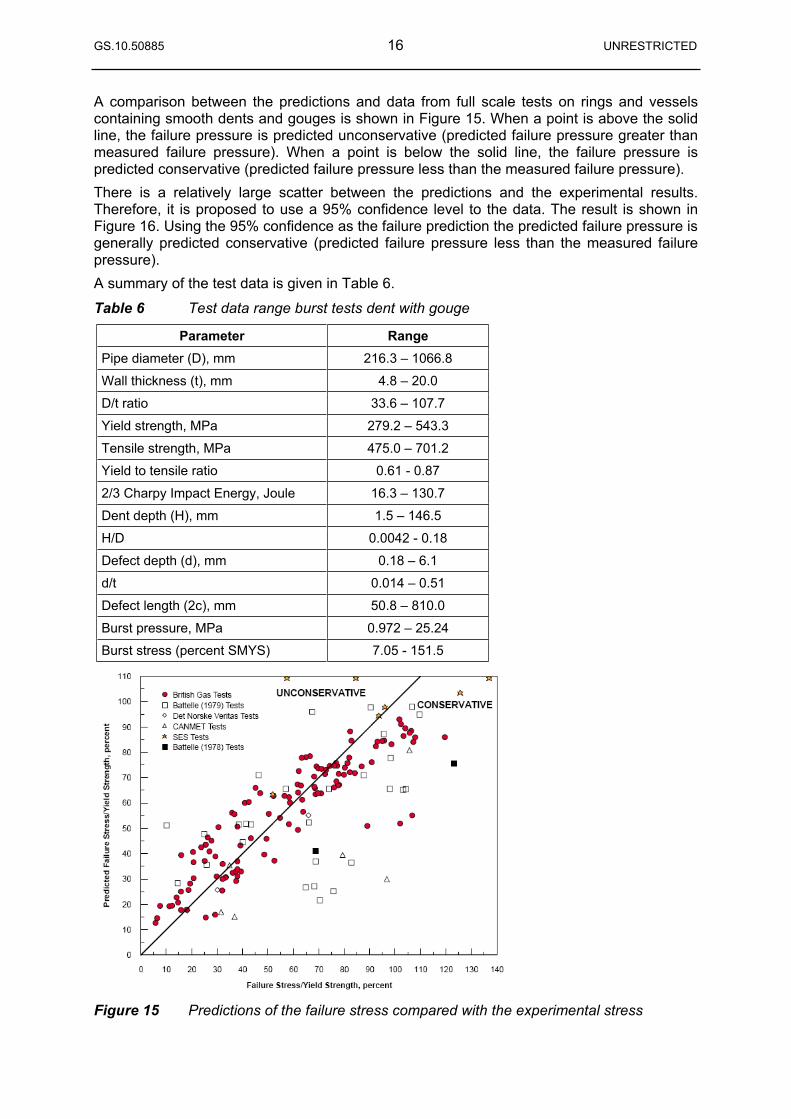
GS.10.50885 16 UNRESTRICTED
A comparison between the predictions and data from full scale tests on rings and vessels containing smooth dents and gouges is shown in Figure 15. When a point is above the solid line, the failure pressure is predicted unconservative (predicted failure pressure greater than measured failure pressure). When a point is below the solid line, the failure pressure is predicted conservative (predicted failure pressure less than the measured failure pressure).
There is a relatively large scatter between the predictions and the experimental results. Therefore, it is proposed to use a 95% confidence level to the data. The result is shown in Figure 16. Using the 95% confidence as the failure prediction the predicted failure pressure is generally predicted conservative (predicted failure pressure less than the measured failure pressure).
A summary of the test data is given in Table 6.
Table 6 Test data range burst tests dent with gouge
Parameter Range Pipe diameter (D), mm 216.3 – 1066.8
Wall thickness (t), mm 4.8 – 20.0
D/t ratio 33.6 – 107.7
Yield strength, MPa 279.2 – 543.3
Tensile strength, MPa 475.0 – 701.2
Yield to tensile ratio 0.61 - 0.87
2/3 Charpy Impact Energy, Joule 16.3 – 130.7
Dent depth (H), mm 1.5 – 146.5
H/D 0.0042 - 0.18
Defect depth (d), mm 0.18 – 6.1
d/t 0.014 – 0.51
Defect length (2c), mm 50.8 – 810.0
Burst pressure, MPa 0.972 – 25.24
Burst stress (percent SMYS) 7.05 - 151.5
Figure 15 Predictions of the failure stress compared with the experimental stress
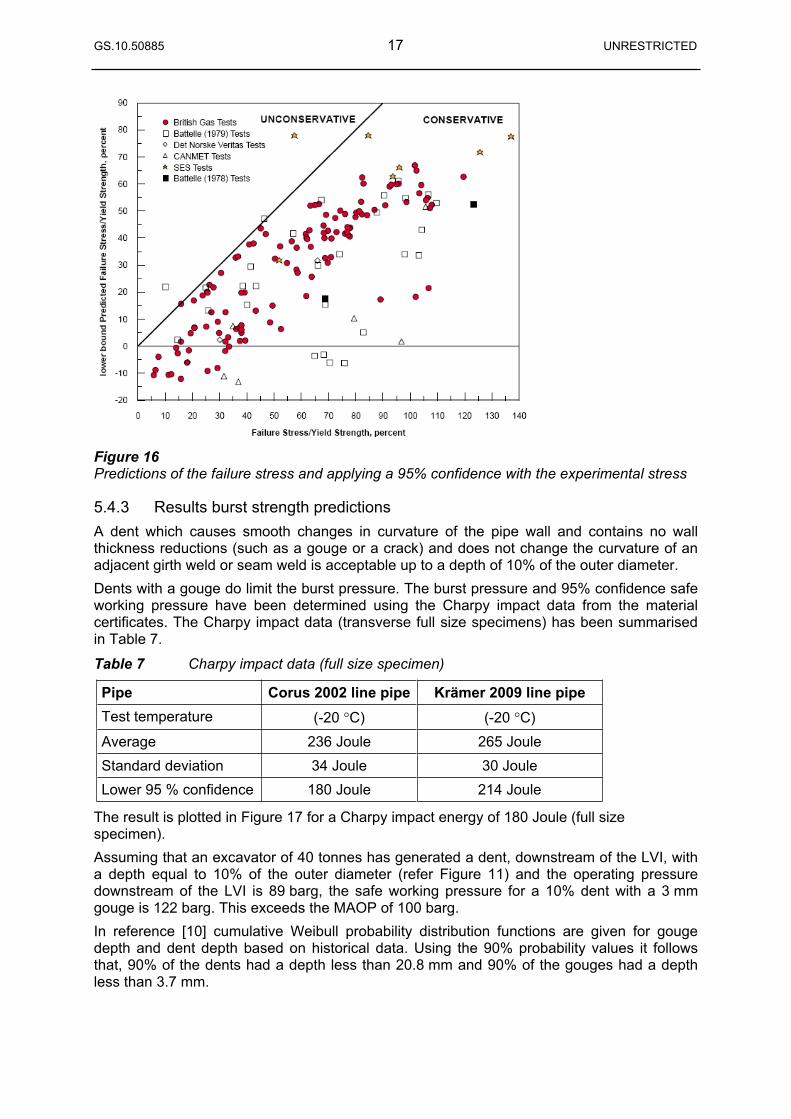
GS.10.50885 17 UNRESTRICTED
Figure 16 Predictions of the failure stress and applying a 95% confidence with the experimental stress
5.4.3 Results burst strength predictions
A dent which causes smooth changes in curvature of the pipe wall and contains no wall thickness reductions (such as a gouge or a crack) and does not change the curvature of an adjacent girth weld or seam weld is acceptable up to a depth of 10% of the outer diameter.
Dents with a gouge do limit the burst pressure. The burst pressure and 95% confidence safe working pressure have been determined using the Charpy impact data from the material certificates. The Charpy impact data (transverse full size specimens) has been summarised in Table 7.
Table 7 Charpy impact data (full size specimen)
Pipe Corus 2002 line pipe Krämer 2009 line pipe Test temperature (-20 C) (-20 C)
Average 236 Joule 265 Joule
Standard deviation 34 Joule 30 Joule
Lower 95 % confidence 180 Joule 214 Joule
The result is plotted in Figure 17 for a Charpy impact energy of 180 Joule (full size specimen).
Assuming that an excavator of 40 tonnes has generated a dent, downstream of the LVI, with a depth equal to 10% of the outer diameter (refer Figure 11) and the operating pressure downstream of the LVI is 89 barg, the safe working pressure for a 10% dent with a 3 mm gouge is 122 barg. This exceeds the MAOP of 100 barg.
In reference [10] cumulative Weibull probability distribution functions are given for gouge depth and dent depth based on historical data. Using the 90% probability values it follows that, 90% of the dents had a depth less than 20.8 mm and 90% of the gouges had a depth less than 3.7 mm.
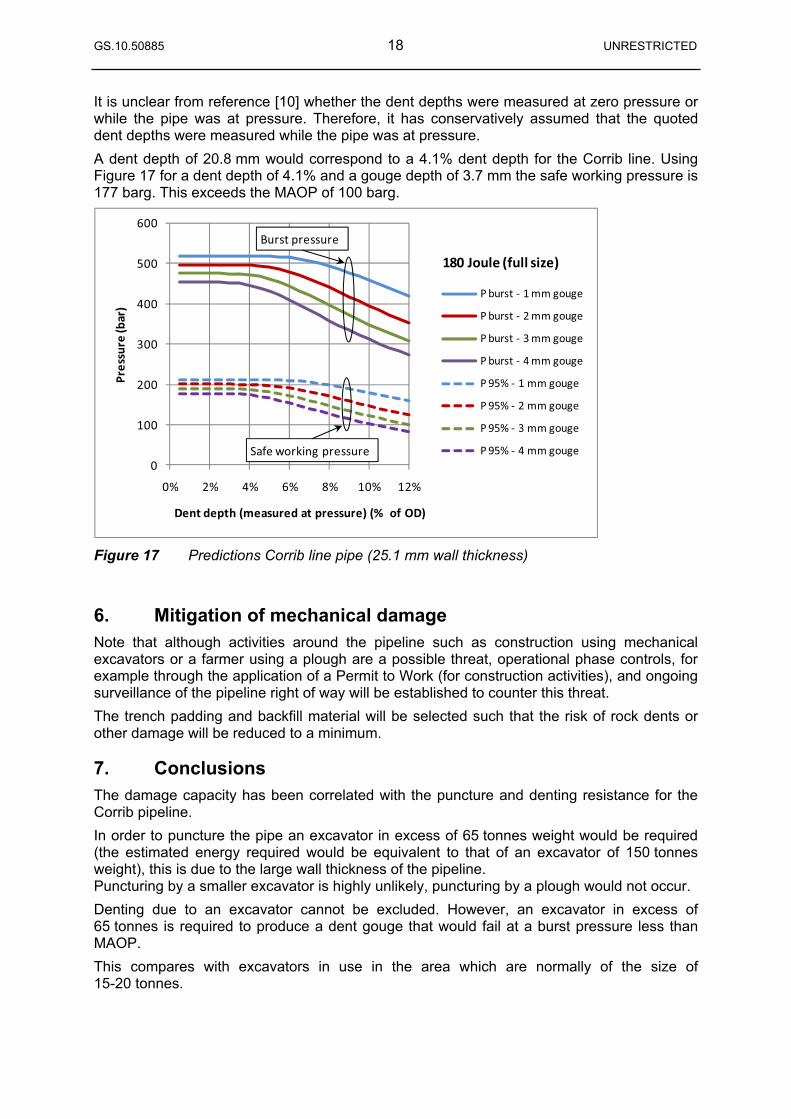
GS.10.50885 18 UNRESTRICTED
It is unclear from reference [10] whether the dent depths were measured at zero pressure or while the pipe was at pressure. Therefore, it has conservatively assumed that the quoted dent depths were measured while the pipe was at pressure.
A dent depth of 20.8 mm would correspond to a 4.1% dent depth for the Corrib line. Using Figure 17 for a dent depth of 4.1% and a gouge depth of 3.7 mm the safe working pressure is 177 barg. This exceeds the MAOP of 100 barg.
0
100
200
300
400
500
600
0% 2% 4% 6% 8% 10% 12%
Pressure
(bar)
Dent depth (measured at pressure) (% of OD)
Pburst 1mm gouge
Pburst 2mm gouge
Pburst 3mm gouge
Pburst 4mm gouge
P95% 1 mm gouge
P95% 2 mm gouge
P95% 3 mm gouge
P95% 4 mm gouge
180 Joule (full size)
Safe working pressure
Burst pressure
Figure 17 Predictions Corrib line pipe (25.1 mm wall thickness)
6. Mitigation of mechanical damage Note that although activities around the pipeline such as construction using mechanical excavators or a farmer using a plough are a possible threat, operational phase controls, for example through the application of a Permit to Work (for construction activities), and ongoing surveillance of the pipeline right of way will be established to counter this threat.
The trench padding and backfill material will be selected such that the risk of rock dents or other damage will be reduced to a minimum.
7. Conclusions The damage capacity has been correlated with the puncture and denting resistance for the Corrib pipeline.
In order to puncture the pipe an excavator in excess of 65 tonnes weight would be required (the estimated energy required would be equivalent to that of an excavator of 150 tonnes weight), this is due to the large wall thickness of the pipeline. Puncturing by a smaller excavator is highly unlikely, puncturing by a plough would not occur.
Denting due to an excavator cannot be excluded. However, an excavator in excess of 65 tonnes is required to produce a dent gouge that would fail at a burst pressure less than MAOP.
This compares with excavators in use in the area which are normally of the size of 15-20 tonnes.

GS.10.50885 19 UNRESTRICTED
Figure 18 Example of a 20 tonnes excavator (weight 20,600 kg) (www.newholland.com)
Figure 19 Example 63 tonnes excavator (weight 63,200 kg) (www.newholland.com)
GS.10.50885 20 UNRESTRICTED
8. References 1 P. Roovers et al, EPRG Methods for assessing the tolerance and resistance of pipelines
to external damage, Pipeline Technology, Proceeding of the 3rd International Pipeline Technology Conference, Brugge Belgium, May 21-24, 2000, Volume II, Editor: R. Denys.
2 Spiekhout, J., Gresnigt, A.M. and Kusters, G.M.A., The behaviour of a steel cylinder under the influence of a local load in the elastic elasto-plastic area, Proceedings International Symposium Shell and Spatial Structures: Computational Aspects, July 1986, Leuven, Belgium, Springer-Verlag, Berling Germany, pp. 329-336.
3 Spiekhout, J, A new design philosophy for gas transmission pipelines – Designing for gouge resistance and puncture resistance, Proceedings 2nd International Conference on Pipeline Technology, Vol. I, Sept. 11-14, Ostend, pp.315-328.
4 Corbin, P. And Vogt, G., Future trends in pipelines, Proceedings Banff/97 Pipeline workshop: Managing pipeline integrity – Planning for the future, Banff Alberta.
5 Robert G. Driver and Thomas J.E. Zimmerman, A limit states approach to the design of pipelines for mechanical damage, 17th International conference of offshore mechanics and arctic engineering, 1998, OMAE98-1017.
6 Daniel C. Brooker, Numerical modelling of pipeline puncture under excavator loading. Part II: Parametric study, International Journal of Pressure Vessels and Piping, Vol. 80, 2003, pp.727-735.
7 Daniel C. Brooker, Experimental puncture loads for external interference of pipelines by excavator equipment, International Journal of Pressure Vessels and Piping, Vol. 82, 2005, pp. 825-832.
8 Cosham, A, Hopkins, P, The effect of dents in pipelines – Guidance in the pipeline defect assessment manual, Proceedings ICPVT-10, July 7-10, 2003, Vienna, Austria.
9 Andrew Cosham and Phil Hopkins, The pipeline defect assessment manual, IPC02-27067 Proceedings of IPC 2002: International Pipeline Conference, 29 September – 3 October, 2002; Calgary, Alberta, Canada.
10 Report PIE/07/R0176, Issue 1.0 February 2008, J. Haswell and C. Lyons, Failure frequency predictions due to 3rd party interference for Corrib pipeline.
11 I.S. EN 14161:2004 Petroleum and Natural Gas Industries – Pipeline Transportation Systems.
12 I.S. 328:2003 Code of practice for gas transmission pipelines and pipeline installations. 13 BS PD 8010-1:2004 Code of Practice for Pipelines – Part 1: Steel Pipelines on Land.
Amsterdam, May 2010qts