Embed Size (px)
Citation preview
Page 1 Pilot-testing Performance-based Incentives for Agricultural Pollution Control
PILOT-TESTING PERFORMANCE-BASED INCENTIVES FOR AGRICULTURAL POLLUTION CONTROL
From the Performance-based Environmental Policies for Agriculture (PEPA) Initiative A project
of Winrock International
Date of Report: December 14, 2010 Reporting period: August 15, 2006 – June 30, 2010
Page 2 Pilot-testing Performance-based Incentives for Agricultural Pollution Control
1. Abstract
Current programs for controlling nonpoint source (NPS) pollution in the United States consist in large part of cost-sharing best management practices and compensating farmers for idling selected tracks of working land. While important tools, they do not often encourage farmers to utilize the most cost-effective actions or inspire new and innovative solutions to reduce NPS pollution from their farming operations. This project used performance-based incentives to provide participating farmers with the flexibility to implement the most cost-effective actions, specific to their farm and fields, for nonpoint source pollution reduction in Iowa and Vermont. The project addressed the issues of phosphorus, nitrogen, and sediment loss, with a more in-depth focus on phosphorus. In Eastern Iowa, we found that an average reduction of 0.88 lbs P per acre per year can be achieved for an average cost to the farmer of $-0.61 per pound of P reduction, suggesting that untapped win-win solutions exist. The performance-based incentive payment of $10 per pound of P reduced results in a gain to farmers of $10.61 per pound P loss reduced. In Vermont, an average reduction 0.26 lbs P per acre per year can be achieved for a cost to the farmer of $4.86. A $25 incentive payment to the Vermont participants result in an average profit of $20.14 per pound of P reduced. The most important lessons learned from these results include: (1) The cost-effectiveness of various actions to reduce P loss and erosion vary greatly from farm-to-farm
and field-to-field, with no one action showing consistent advantages. (2) Providing flexibility to achieve pollution reductions from the farm allows for new ideas and producer
innovation. (3) Incorporating the farmers’ knowledge of their land and skills as problem-solvers is crucial for
arriving at least-cost solutions and motivating producer participation. (4) Tweaks and small changes to field operations and/or nutrient management can result in small cost-
savings. Efforts to capture these savings are often overlooked until the addition of the performance-based incentive payment is factored in to the farmers’ decision-making.
(5) Incentive payment levels should be set according to local calculations, budget constraints, and the extent of pollution reduction desired.
The watersheds in which this farmer-led approach to performance-based incentives were implemented continue to meet and work together, even after the project funding has ended. This, as well as the individual stories from the farmers, are a testament to the motivation and enthusiasm that can be developed by helping farmers take ownership of local water quality issues and provide them with flexibility and incentives to find the most cost-effective solutions. 2. Introduction
This project was part of an initiative called Performance-based Environmental Policies for Agriculture (PEPA). The primary goal of the PEPA initiative is to improve the cost-effectiveness of agricultural pollution control efforts without burdening farm viability. Our focus for doing this is through the development and use of performance-based incentives to farmers. Although people hold varying concepts of what the term “performance-based” means, especially in the context of agricultural pollution control, for our work performance-based incentives:
are payments for achieving specific environmental performance targets, often measured at the farm level;
allow farmers to achieve specified environmental performance targets in any way they choose; incentivize farmers to choose the most cost-effective actions to meet the performance targets;
Page 3 Pilot-testing Performance-based Incentives for Agricultural Pollution Control
provide additional income to farmers for reducing costs for NPS pollution control; and may provide a cleaner environment and greater accountability for taxpayers.
The PEPA initiative is comprised of several projects. The National Facilitation project focuses on education and outreach nationally, as well as helping create recommendations at the watershed-level. This project, Pilot-testing, was implementing recommendations previously created with watershed stakeholders in Iowa and Vermont by providing actual incentive payments to participating farmers through this NRCS Conservation Innovation Grant. A third project is focused on extension and education activities in the Chesapeake Bay watershed. There is a very close and highly synergistic relationship between these projects. The National Facilitation project benefits greatly from the Pilot-testing project by having concrete, on-the-ground examples to use in our outreach work. These examples are the best way to convey the sometimes obscure concept of performance-based incentives to audiences that have only thought about agricultural pollution control in terms of practice-based programs. The Pilot-testing project benefited from the national exposure that is created through the National Facilitation project’s education and outreach activities. 3. Background
Agriculture remains the leading contributor to nonpoint source (NPS) pollution in the U.S. (USEPA 2008). One of the most important reasons that the level of NPS pollution from agriculture continues to exceed acceptable levels is because clear financial signals to farmers, from markets or policy, of society’s expectations are lacking (Ribaudo et al. 1999). The development of specific performance measures and incentive mechanisms is a way to provide clear signals to producers (Hausker 1999). Performance-based approaches differ from practice- or design-based approaches, which focus on production practices and farm infrastructure, by linking production decisions more closely to environmental outcomes through appropriately designed incentive mechanisms. Performance-based incentives have the potential to 1) increase farmer flexibility, 2) induce conservation innovations, and 3) increase the cost-effectiveness of agricultural pollution control spending (Lynch 1994; Ribaudo et al. 1999; Horan and Shortle 2001; Shortle et al. 2001). A recent analysis by the Economic Research Service estimates that performance-based conservation programs can generate more than two times the environmental quality per dollar spent compared to practice-based programs (Weinberg and Claassen 2006). 4. Focal region and approaches
With funding from USDA Conservation Innovation Grants, performance-based incentives were pilot-tested in 6 watersheds in the Upper Mississippi River Basin and the Lake Champlain Basin. Incentive payments to EQIP-eligible producers are based on the achievement of farm-level environmental performance targets that have been created by working groups of farmers, agency staff, and scientists in each state. Two distinct approaches to the use of performance-based incentives were implemented in this project. In Approach I, a specific payment level was offered to participating farmers for meeting specified environmental performance targets. This approach uses just one performance measure, estimated phosphorus (P) loss per farm per year (as predicted by the state’s Phosphorus Index (P Index)) and works closely with each participating producer to identify the most appropriate and cost-effective specific actions for each farm and field. Any action that costs the farmer less than the resulting incentive payment
Page 4 Pilot-testing Performance-based Incentives for Agricultural Pollution Control
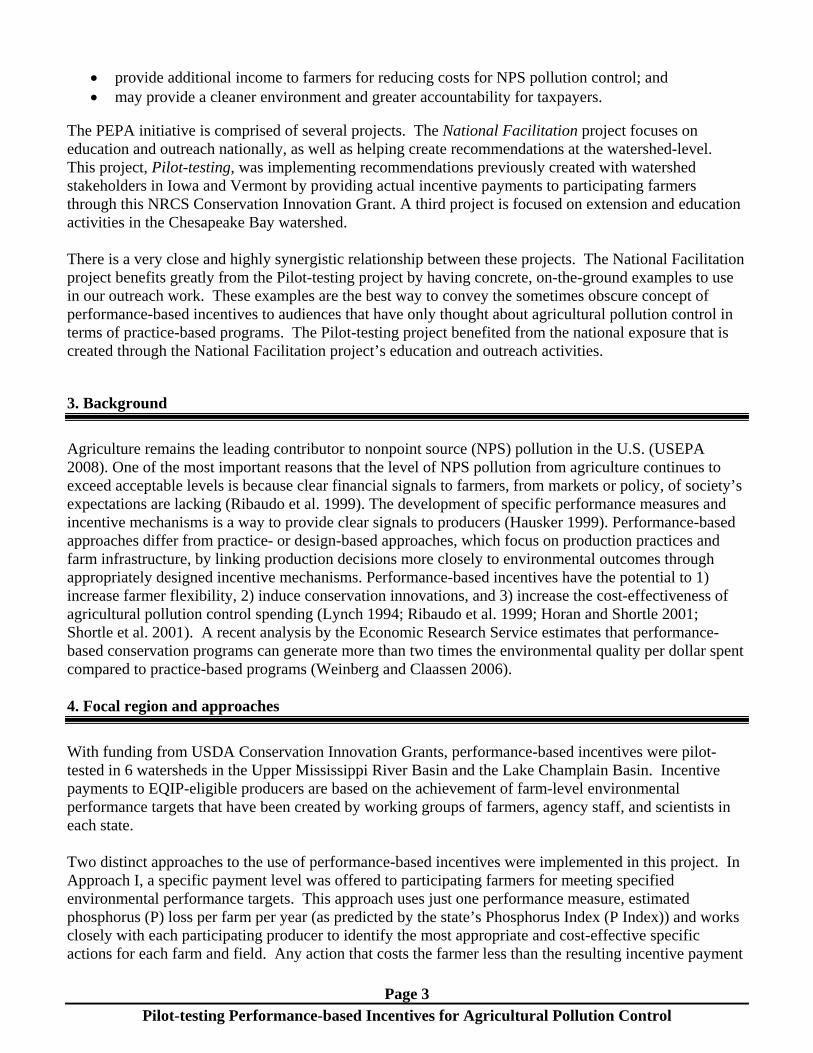
is a good business decision for the producer. Working with producers to identify the most cost-effective solutions allowed the project to determine the extent of pollution reduction that might be expected at various incentive payment levels. This approach attempts to incorporate environmental planning into farm business decision-making and was being pilot-tested in the North Fork Headwaters watershed in Iowa and the Missisquoi River watershed in Vermont, which includes the Hungerford Brook and Rock River watersheds. Approach II uses farmer-led watershed councils to make group decisions on program rules and payment levels. The councils are led by farmers and facilitated by Extension staff. Incentive payments were made to reduce P, nitrogen (N), and sediment loss from participating farms. Incentive money, made available through non-federal grants from Iowa Farm Bureau, Iowa Corn Growers Association, and the Iowa Watershed Improvement Review Board, was placed in an account for use by each watershed council. Each farmer selected from an array of performance targets, as well as common sense practices, listed in a simple menu. Specific payments were calculated based on a combination of actions and outcomes. Approach II was pilot-tested in Iowa’s Coldwater-Palmer, Lime Creek, and Hewitt Creek watersheds.
Figure 1: Map of focal watersheds in Vermont Figure 2: Map of focal watersheds in Iowa 5.
Summary of Accomplishments
There were significant accomplishments resulting from this Pilot-testing project, but they differed markedly from Approach I to Approach II. The results from Approach I show that performance-based incentives have the potential to make a significant impact on water quality improvement in focal
Page 5 Pilot-testing Performance-based Incentives for Agricultural Pollution Control
watersheds in a more cost-effective manner, relative to practice-based programs. The most important outcomes from Approach II include the enthusiasm, ownership, and lasting participation of the farmers who have become the watershed councils. If project participants in the Upper North Fork Headwaters were to implement all of the actions identified on their farms that cost less than the incentive payment of $10/lb P loss reduced, the average reduction in P loss would be 0.88 lbs/acre/year across the entirety of participating farms. Further, if all farmers in the watershed were willing and able to participate in a performance-based incentives program and had an average reduction of 0.88 lbs/acre/year, the resulting level of P reduction would be more than 4 times the P reduction called for the TMDL for that watershed. If project participants in the Missisquoi watershed implemented all of the profitable actions, the average P loss reduction would be 0.26 lbs/acre/year. And if the program was adopted by every farmer in the Missisquoi it would meet over 40% of the agricultural load reduction responsibility for that watershed. More details on these noteworthy results can be found in Section 7 of this report. Besides the potential of the project to reduce P, N, and sediment loss from the farm, the initiative has also stimulated new, innovative management practices. In Iowa, farmers planted rye and oats as a winter cover crop in the fall to reduce soil erosion and increase nutrient uptake. By planting at the right time in the fall the winter freeze terminated the growth, therefore the field did not require chemical burn-down in the spring. This reduced field traffic in the spring and the eliminated the need to apply chemicals, which subsequently reduces NPS pollution. In Vermont, farmers experimented with manure injection as a way to reduce P loss on corn and hay fields. Participants, especially grass-based dairy farmers, are excited about the potential for manure injection to reduce P runoff, while at the same time increasing yields. This program induces innovation because payments are made based on the outcome and not for any specific management practice. As such, farmers have the opportunity to be creative and adopt management alternatives to reduce nonpoint source pollution in any way they choose. 6. Accomplishments by phases
The accomplishments and activities of this project can be broken into five primary phases (or components, as the phases were not all sequential). In phase I, project staff focused on addressing implementation issues, assembling the Iowa and Vermont Implementation Teams, convening the National Advisory Team, developing both a website and brochure for outreach material, and recruiting interested producers in focal watersheds. Phase II concentrated on working with individual farms to identify management changes of interest to the farmers, calculating estimated nutrient and soil loss reductions, and estimating the costs for those changes. Phase III included developing the details of the incentive program and the farmer sign-up and participation process. Phase IV included all of the education and outreach work within the watersheds and at regional and national conferences.
Phase 1: Project Start-up Address administrative issues The proposed workplan and budgets were adjusted to reflect the reduced award amount. Our proposal reflected a workplan and budget designed for an award of $802,000. However, the award was made for $500,000. Therefore, a significant amount of adjustment and re-allocation was required. Subcontracts were executed with Iowa State University and University of Vermont to reflect the re-
Page 6 Pilot-testing Performance-based Incentives for Agricultural Pollution Control
allocated budget. Assemble Iowa (IA) and Vermont (VT) Implementation teams and a National Advisory team In each state, a team was assembled that consists of representatives of the relevant state and federal agencies, as well as researchers and farmers. The reason for these teams was to ensure that our work was done effectively and fits well with other on-going efforts for agricultural pollution control. Individual email list-serves were created for each of the teams to disseminate information and facilitate communication with team members. A PEPA National Advisory Team (NAT) was organized to provide a high-level, technical sounding board for the PEPA projects. The NAT is comprised of 10 leading scholars on issues related to agricultural pollution control; their disciplines include economics, agronomy, and soil science, but the core knowledge base is concentrated in economics and policy. Many of the NAT members have been leading scholars on topics related to performance-based incentives. The NAT also includes a couple of watershed-level members who are instrumental in implementing this project. Partner meetings Kick-off meetings were held in Vermont and Iowa to bring partners together for planning. In Vermont, the project team met with the VT implementation team and other relevant partners to discuss action items for project implementation. In Iowa, partner meetings were held quarterly with stakeholders to discuss project process and necessary next steps. Outreach materials Several outreach materials have been prepared for this project. We have created a set of web pages to convey information on the concept of performance-based incentives and the two sibling projects. The website is www.flexincentives.com. In addition to the website, a tri-fold brochure that explains the concept and briefly describes each project has been widely distributed at conferences and formal meetings. The brochure can be downloaded off the project website. Watershed outreach and recruiting producers APPROACH I – Selecting candidate watersheds for project implementation was an important outreach activity. A letter was sent on September 6th 2006 to Vermont NRCS District Conservationists (DC), explaining the project and asking them to nominate candidate watersheds. Based on DC responses and recommendations from the VT implementation team, the Hungerford Brook and Rock River watersheds in Northern Vermont were chosen. In Iowa, the North Fork Maquoketa watershed was selected as the most appropriate candidate watershed. North Fork Maquoketa was chosen because there is significant impairment of waterways that could be attributed to livestock production. This watershed also has a TMDL for P, which provided a benchmark to measure project impact. After the focal watersheds were selected, meetings were held with farmers in each watershed to explain the project, answer questions, and collect names of farmers interested in participating. The meeting in Vermont was held on February 6th, 2007 at the My T-Fine Restaurant in Swanton. There were a total of 25 participants in the meeting, 15 of which were farmers and the remaining 10 were local agency personnel and project staff. In Iowa, a meeting was held in July ’07 to explain the details of the program to farmers in the North Fork Maquoketa. APPROACH II – For the Iowa watersheds in Approach II, invitation letters were sent to residents in Coldwater-palmer, Lime Creek and Hewitt Creek watersheds to enroll in the performance-based incentives project. It emphasized that participation in the project was voluntary and funding for
Page 7 Pilot-testing Performance-based Incentives for Agricultural Pollution Control
watershed incentives depended on active involvement. The three watersheds in Approach II were chosen mainly because impaired waterways existed and, for Hewitt Creek, livestock was considered a significant source of pollution. Decision on first year of implementation APPROACH I – It was decided that the first year of incentive payments for Approach I would be scheduled for the 2008 crop year. This decision was made for several reasons. First, many farm management decisions for crop year 2007 (spring 2007) had already been made in fall 2006. Many farmers had spread manure in the fall, plowed fields, and purchased seed and fertilizer. Second, many farmers were missing important information to complete the P Index. Farmers needed to collect soil samples, manure pit samples, and calculate erosion rates to finalize their P Index. Finally, the details of the incentive program needed to be finalized in the first year before we decided on a payment level. Thus, we decided to break the project into two stages. In the first stage, farmers were paid an honorarium of $400 for sharing farm documents, time being interviewed, participation in meetings and helping us figure out the specific details of the program. We had a total of 12 farmers in Vermont and 13 farmers in the North Fork Maquoketa watershed in Iowa sign up for the first stage of the project. In the second stage, farmers sign up to receive payments for specific changes in their management practices that reduced P lost from the farm. This phase was started in the 2008 crop year. APPROACH II – Payments for meeting specific performance targets for P, N, and sediment loss reduction were made to farmers in the Approach II watersheds for the 2007 crop year. Determine EQIP-eligibility of all participating producers As we moved toward collaboration with specific farms, we checked their status for EQIP eligibility with the local NRCS offices. Only one producer was found to be ineligible; their participation in this project was discontinued.
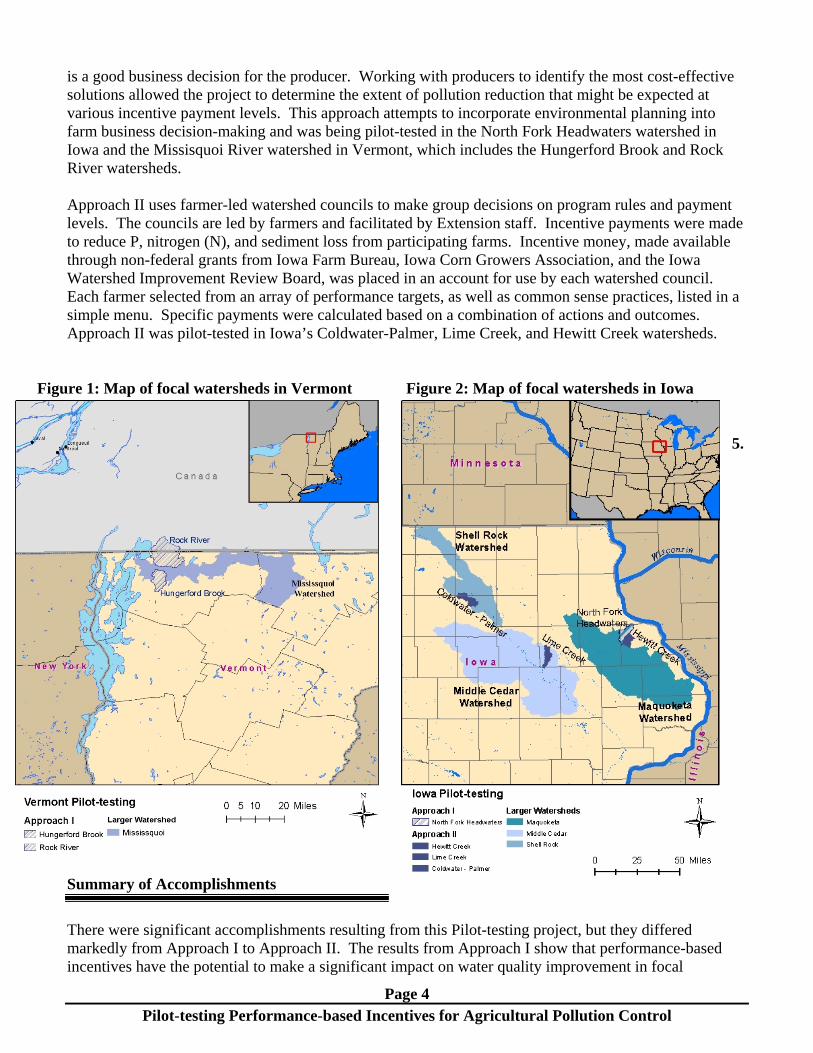
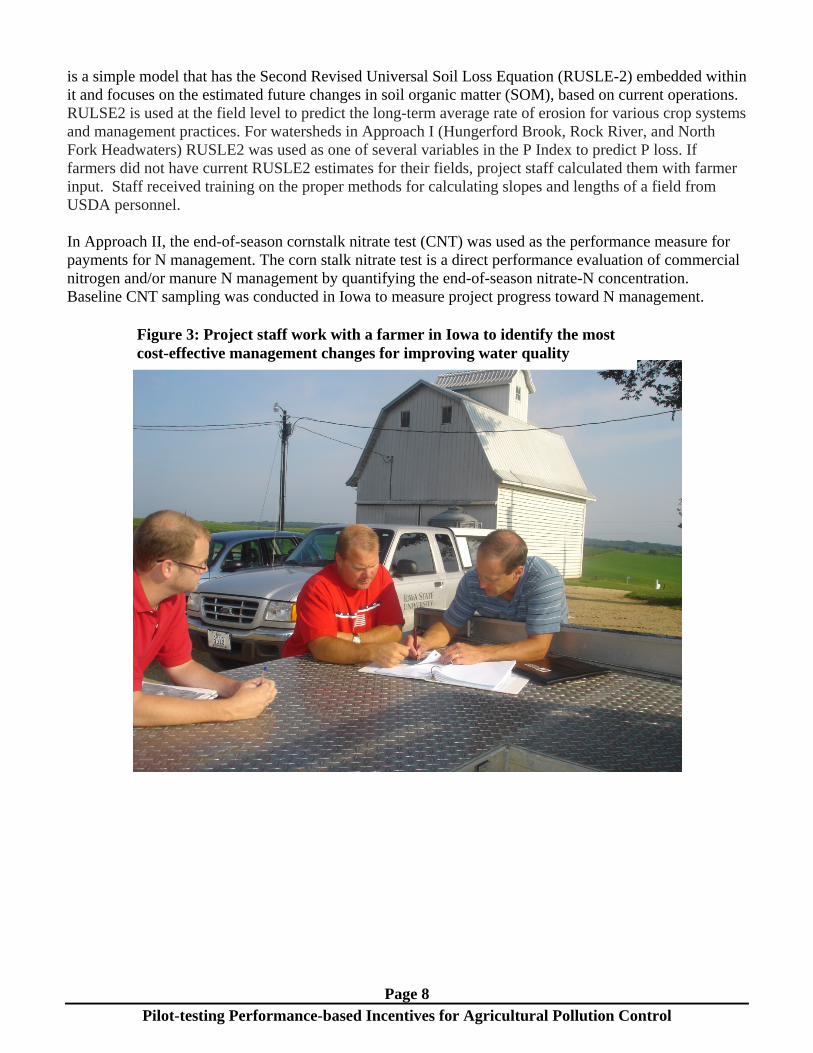
Phase 2: Farm-level Analyses Calculating phosphorus and sediment loss and gauging nitrogen management The first step in both Approach I and Approach II was to estimate the baseline nutrient and sediment loss from the farm. Because the payment level is based on the performance score it was very important to calculate the baseline as accurately as possible. For this reason, we visited each farm and updated our database with the current management practices. For P, payments were made for improvement in the farm’s P Index. The P Index is a tool used to estimate the potential for phosphorus runoff based on soil and field characteristics and on management practices. The P Index has been refined over the years and is the best tool available to predict P loss from the field. Currently, USDA - Natural Resources Conservation Service uses the P Index in their 590 Nutrient Management Practice Standard to address P management. For those farms that did not have a complete P Index, we created one, with the farmer’s input. In some cases it was necessary to gather data needed to complete the P Index (e.g. RUSL2 –estimated erosion rate). After the P Indexes were updated or created for each farm we interviewed them to identify possible farm-specific management changes to reduce P loss (Figure 3). The performance measure used for reducing sediment loss is the Soil Conditioning Index (SCI). The SCI
Page 8 Pilot-testing Performance-based Incentives for Agricultural Pollution Control
is a simple model that has the Second Revised Universal Soil Loss Equation (RUSLE-2) embedded within it and focuses on the estimated future changes in soil organic matter (SOM), based on current operations. RULSE2 is used at the field level to predict the long-term average rate of erosion for various crop systems and management practices. For watersheds in Approach I (Hungerford Brook, Rock River, and North Fork Headwaters) RUSLE2 was used as one of several variables in the P Index to predict P loss. If farmers did not have current RUSLE2 estimates for their fields, project staff calculated them with farmer input. Staff received training on the proper methods for calculating slopes and lengths of a field from USDA personnel. In Approach II, the end-of-season cornstalk nitrate test (CNT) was used as the performance measure for payments for N management. The corn stalk nitrate test is a direct performance evaluation of commercial nitrogen and/or manure N management by quantifying the end-of-season nitrate-N concentration. Baseline CNT sampling was conducted in Iowa to measure project progress toward N management.
Figure 3: Project staff work with a farmer in Iowa to identify the most cost-effective management changes for improving water quality
Page 9 Pilot-testing Performance-based Incentives for Agricultural Pollution Control
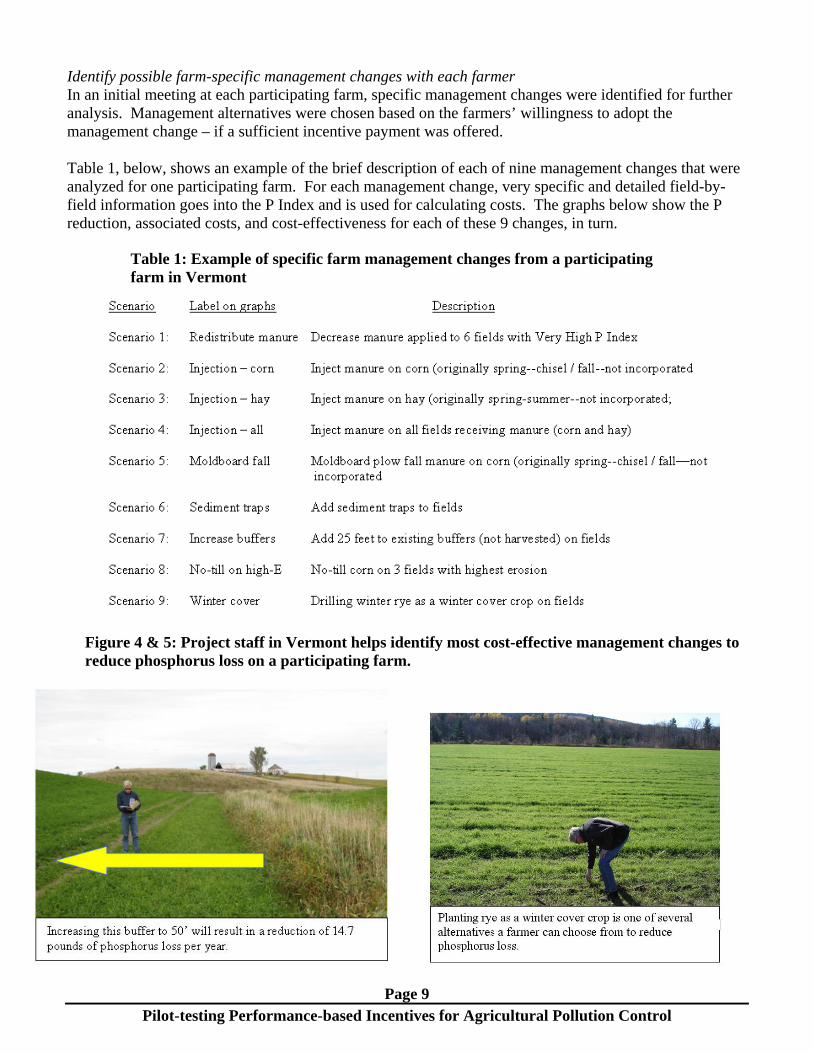
Identify possible farm-specific management changes with each farmer In an initial meeting at each participating farm, specific management changes were identified for further analysis. Management alternatives were chosen based on the farmers’ willingness to adopt the management change – if a sufficient incentive payment was offered.
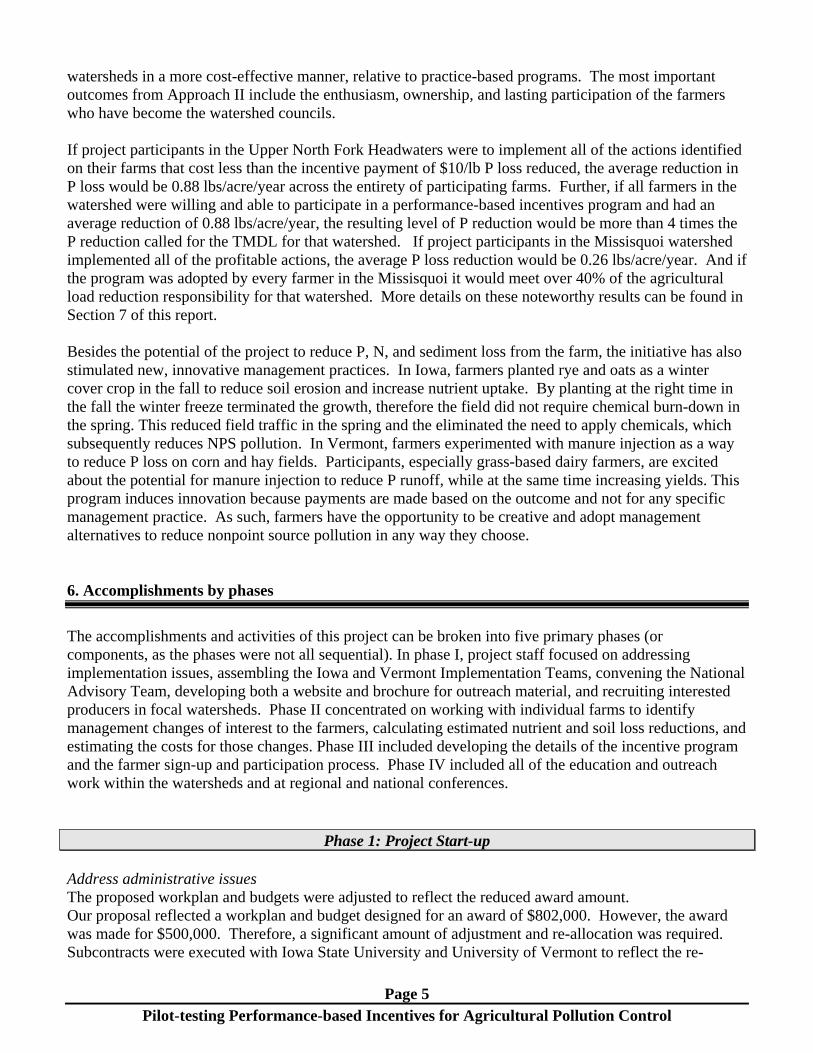
Table 1, below, shows an example of the brief description of each of nine management changes that were analyzed for one participating farm. For each management change, very specific and detailed field-by-field information goes into the P Index and is used for calculating costs. The graphs below show the P reduction, associated costs, and cost-effectiveness for each of these 9 changes, in turn.
Figure 4 & 5: Project staff in Vermont helps identify most cost-effective management changes to reduce phosphorus loss on a participating farm.
Table 1: Example of specific farm management changes from a participating farm in Vermont
Page 10 Pilot-testing Performance-based Incentives for Agricultural Pollution Control
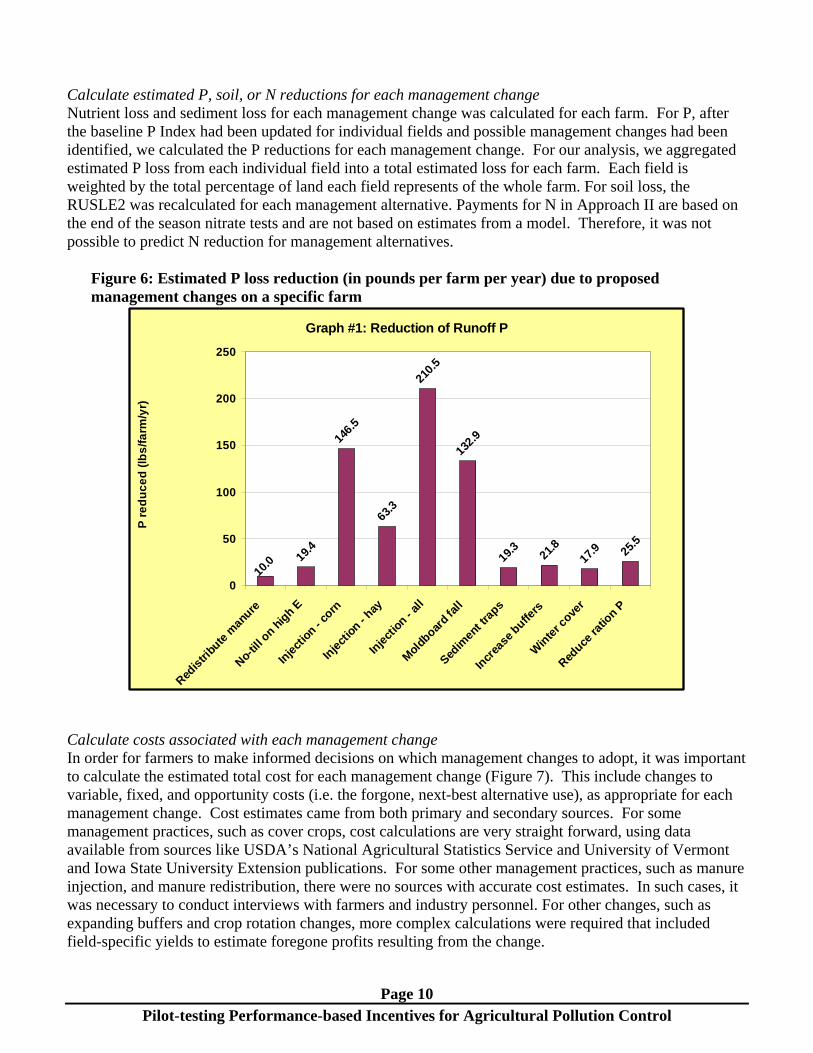
Calculate estimated P, soil, or N reductions for each management change Nutrient loss and sediment loss for each management change was calculated for each farm. For P, after the baseline P Index had been updated for individual fields and possible management changes had been identified, we calculated the P reductions for each management change. For our analysis, we aggregated estimated P loss from each individual field into a total estimated loss for each farm. Each field is weighted by the total percentage of land each field represents of the whole farm. For soil loss, the RUSLE2 was recalculated for each management alternative. Payments for N in Approach II are based on the end of the season nitrate tests and are not based on estimates from a model. Therefore, it was not possible to predict N reduction for management alternatives.
Figure 6: Estimated P loss reduction (in pounds per farm per year) due to proposed management changes on a specific farm
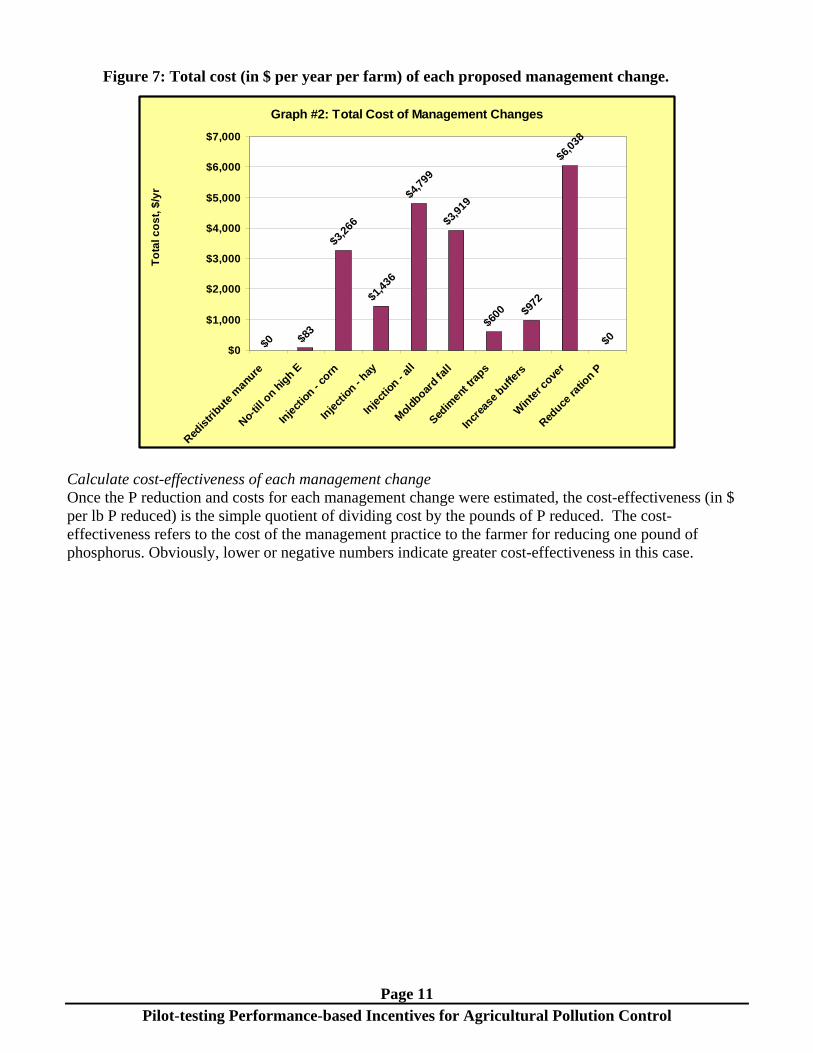
Calculate costs associated with each management change In order for farmers to make informed decisions on which management changes to adopt, it was important to calculate the estimated total cost for each management change (Figure 7). This include changes to variable, fixed, and opportunity costs (i.e. the forgone, next-best alternative use), as appropriate for each management change. Cost estimates came from both primary and secondary sources. For some management practices, such as cover crops, cost calculations are very straight forward, using data available from sources like USDA’s National Agricultural Statistics Service and University of Vermont and Iowa State University Extension publications. For some other management practices, such as manure injection, and manure redistribution, there were no sources with accurate cost estimates. In such cases, it was necessary to conduct interviews with farmers and industry personnel. For other changes, such as expanding buffers and crop rotation changes, more complex calculations were required that included field-specific yields to estimate foregone profits resulting from the change.
Graph #1: Reduction of Runoff P
19.4
146.
5
63.3
210.
5
132.
9
19.3
21.8
17.9 25
.5
10.0
0
50
100
150
200
250
Redis
tribu
te m
anure
No-til
l on
high E
Inje
ctio
n - co
rn
Inje
ctio
n - hay
Inje
ctio
n - al
l
Mol
dboar
d fa
ll
Sedim
ent t
raps
Incr
ease
buffe
rs
Win
ter c
over
Reduce
ratio
n P
P r
ed
uc
ed
(lb
s/f
arm
/yr)
Page 11 Pilot-testing Performance-based Incentives for Agricultural Pollution Control
Figure 7: Total cost (in $ per year per farm) of each proposed management change.
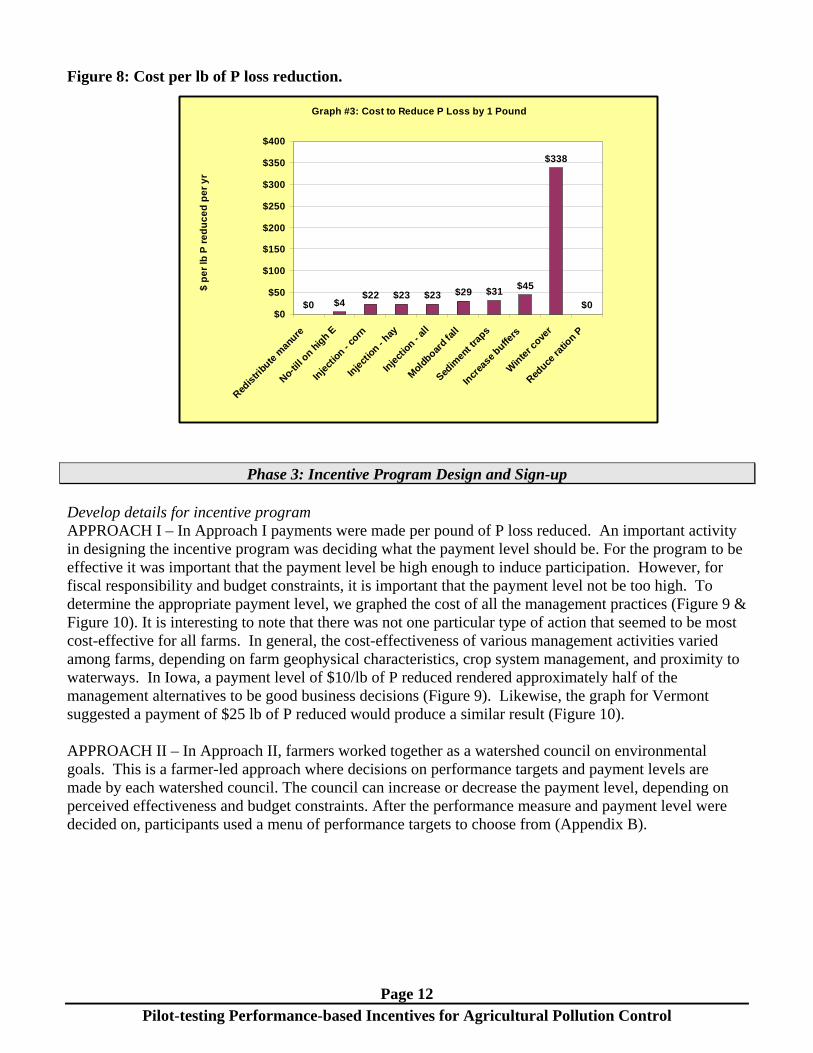
Calculate cost-effectiveness of each management change Once the P reduction and costs for each management change were estimated, the cost-effectiveness (in $ per lb P reduced) is the simple quotient of dividing cost by the pounds of P reduced. The cost-effectiveness refers to the cost of the management practice to the farmer for reducing one pound of phosphorus. Obviously, lower or negative numbers indicate greater cost-effectiveness in this case.
Graph #2: Total Cost of Management Changes
$83
$3,2
66
$1,4
36
$4,7
99
$3,9
19
$600 $9
72
$6,0
38
$0$0$0
$1,000
$2,000
$3,000
$4,000
$5,000
$6,000
$7,000
Redis
tribu
te m
anure
No-til
l on
high E
Inje
ctio
n - co
rn
Inje
ctio
n - hay
Inje
ctio
n - al
l
Mol
dboar
d fa
ll
Sedim
ent t
raps
Incr
ease
buffe
rs
Win
ter c
over
Reduce
ratio
n P
To
tal c
os
t, $
/yr
Page 12 Pilot-testing Performance-based Incentives for Agricultural Pollution Control
Figure 8: Cost per lb of P loss reduction.
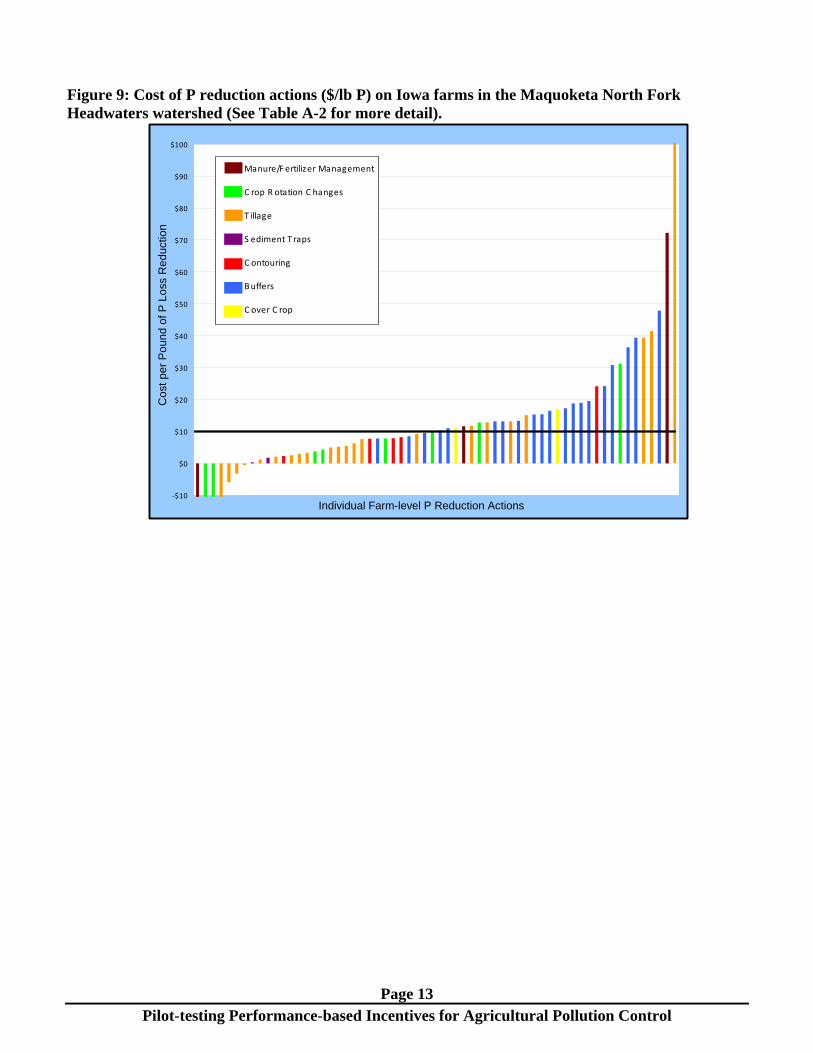
Phase 3: Incentive Program Design and Sign-up Develop details for incentive program APPROACH I – In Approach I payments were made per pound of P loss reduced. An important activity in designing the incentive program was deciding what the payment level should be. For the program to be effective it was important that the payment level be high enough to induce participation. However, for fiscal responsibility and budget constraints, it is important that the payment level not be too high. To determine the appropriate payment level, we graphed the cost of all the management practices (Figure 9 & Figure 10). It is interesting to note that there was not one particular type of action that seemed to be most cost-effective for all farms. In general, the cost-effectiveness of various management activities varied among farms, depending on farm geophysical characteristics, crop system management, and proximity to waterways. In Iowa, a payment level of $10/lb of P reduced rendered approximately half of the management alternatives to be good business decisions (Figure 9). Likewise, the graph for Vermont suggested a payment of $25 lb of P reduced would produce a similar result (Figure 10). APPROACH II – In Approach II, farmers worked together as a watershed council on environmental goals. This is a farmer-led approach where decisions on performance targets and payment levels are made by each watershed council. The council can increase or decrease the payment level, depending on perceived effectiveness and budget constraints. After the performance measure and payment level were decided on, participants used a menu of performance targets to choose from (Appendix B).
Graph #3: Cost to Reduce P Loss by 1 Pound
$0 $4$22 $23 $23 $29 $31
$45
$338
$0$0
$50
$100
$150
$200
$250
$300
$350
$400
Redis
tribu
te m
anure
No-til
l on
high E
Inje
ctio
n - co
rn
Inje
ctio
n - hay
Inje
ctio
n - al
l
Mol
dboar
d fa
ll
Sedim
ent t
raps
Incr
ease
buffe
rs
Win
ter c
over
Reduce
ratio
n P
$ p
er
lb P
re
du
ce
d p
er
yr
Page 13 Pilot-testing Performance-based Incentives for Agricultural Pollution Control
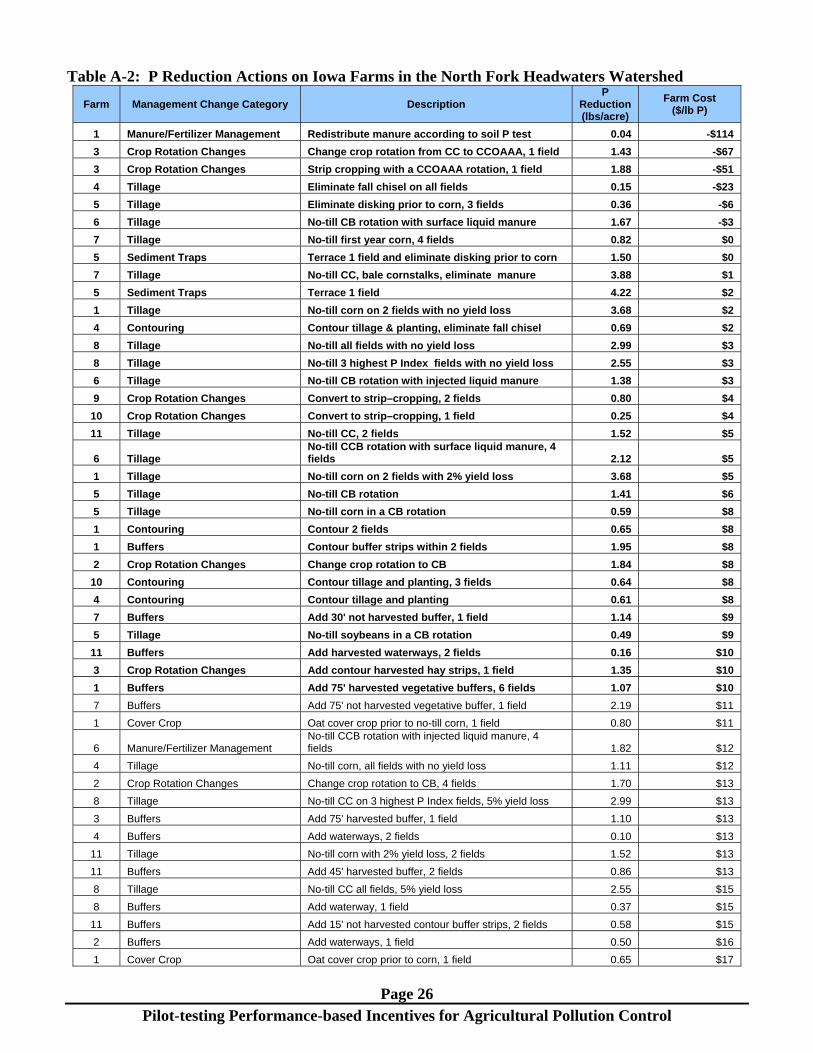
Figure 9: Cost of P reduction actions ($/lb P) on Iowa farms in the Maquoketa North Fork Headwaters watershed (See Table A-2 for more detail).
‐$10
$0
$10
$20
$30
$40
$50
$60
$70
$80
$90
$100
Individual Farm-level P Reduction Actions
Cos
t pe
r P
ound
of
P L
oss
Red
uctio
nManure/F ertilizer Management
C rop R otation C hanges
T illage
S ediment T raps
C ontouring
Buffers
C over C rop
Page 14 Pilot-testing Performance-based Incentives for Agricultural Pollution Control
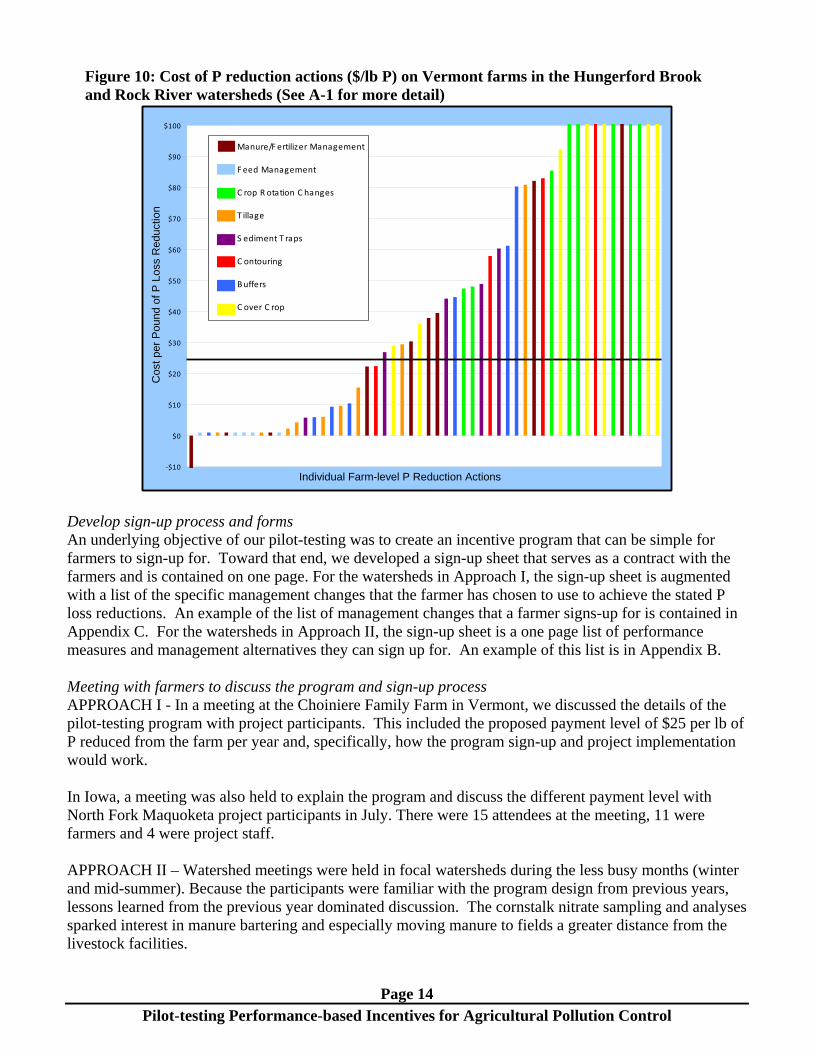
Figure 10: Cost of P reduction actions ($/lb P) on Vermont farms in the Hungerford Brook and Rock River watersheds (See A-1 for more detail)
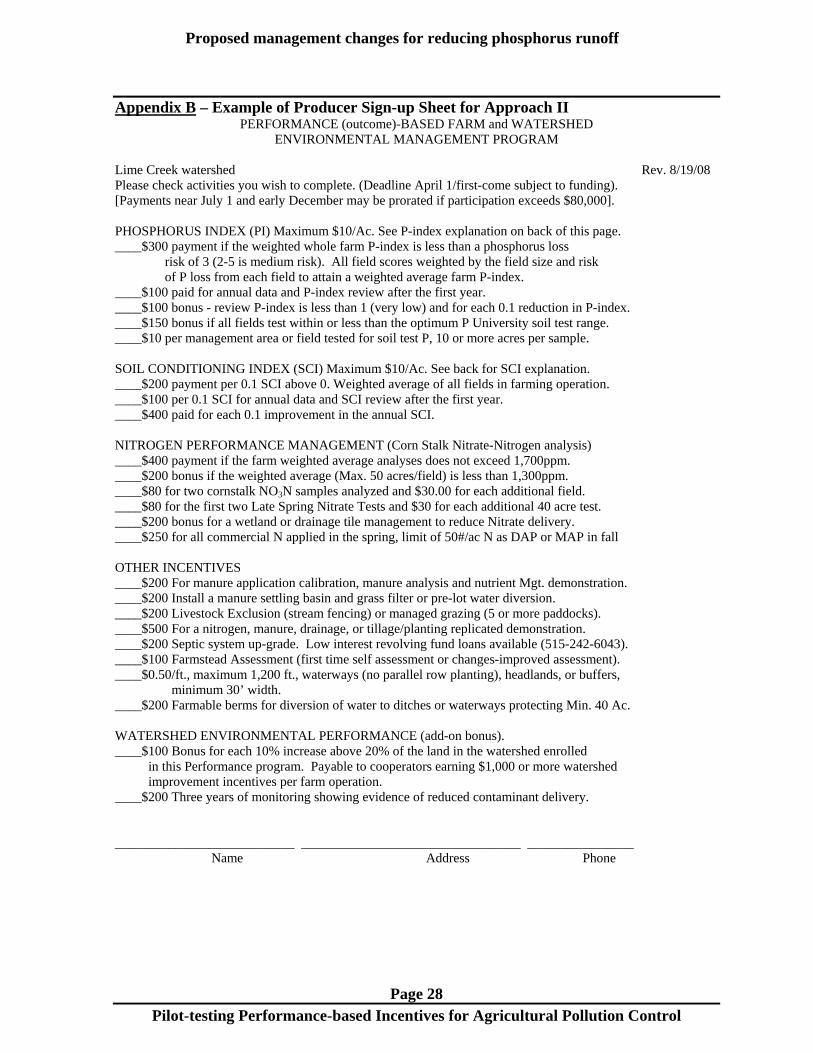
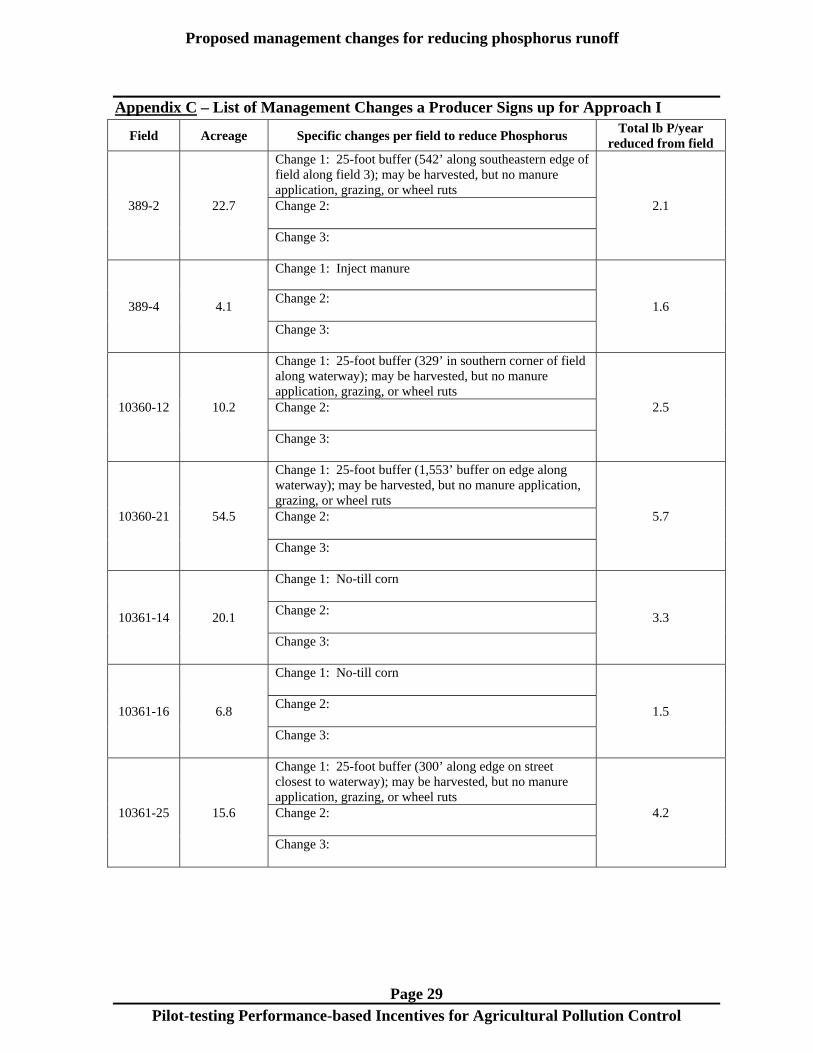
Develop sign-up process and forms An underlying objective of our pilot-testing was to create an incentive program that can be simple for farmers to sign-up for. Toward that end, we developed a sign-up sheet that serves as a contract with the farmers and is contained on one page. For the watersheds in Approach I, the sign-up sheet is augmented with a list of the specific management changes that the farmer has chosen to use to achieve the stated P loss reductions. An example of the list of management changes that a farmer signs-up for is contained in Appendix C. For the watersheds in Approach II, the sign-up sheet is a one page list of performance measures and management alternatives they can sign up for. An example of this list is in Appendix B.
Meeting with farmers to discuss the program and sign-up process APPROACH I - In a meeting at the Choiniere Family Farm in Vermont, we discussed the details of the pilot-testing program with project participants. This included the proposed payment level of $25 per lb of P reduced from the farm per year and, specifically, how the program sign-up and project implementation would work. In Iowa, a meeting was also held to explain the program and discuss the different payment level with North Fork Maquoketa project participants in July. There were 15 attendees at the meeting, 11 were farmers and 4 were project staff. APPROACH II – Watershed meetings were held in focal watersheds during the less busy months (winter and mid-summer). Because the participants were familiar with the program design from previous years, lessons learned from the previous year dominated discussion. The cornstalk nitrate sampling and analyses sparked interest in manure bartering and especially moving manure to fields a greater distance from the livestock facilities.
‐$10
$0
$10
$20
$30
$40
$50
$60
$70
$80
$90
$100
Individual Farm-level P Reduction Actions
Cos
t pe
r P
ound
of
P L
oss
Red
uctio
nManure/F ertilizer Management
F eed Management
C rop R otation C hanges
T illage
S ediment T raps
C ontouring
Buffers
C over C rop
Page 15 Pilot-testing Performance-based Incentives for Agricultural Pollution Control
Sign-up farmers for performance-based incentives program APPROACH I - Because a set of changes implemented on any given farm may not have P reductions that are additive, especially if more than one change is implemented on any given field, our project staff then calculates the cumulative P loss reductions, associated costs, payments, and profits for the set of changes identified in the step described above. The results are sent to the farmer prior to signing up. In consultation with project staff, the farmer then chooses the management activities s/he is willing to adopt. Finally, a letter and sign up form is sent to the farmer for him/her to sign and return to us. Some of the farmers who volunteered to participate had been taking actions for improved water quality for many years, there were not many actions remaining for them that would cost them less than the resulting incentive payment. It did not seem appropriate to exclude those top land stewards from participation. As such, a stewardship payment, based on the average level of P loss per acre, was also added for those farmers that had an average across their farm of low to medium phosphorus loss. The stewardship payment was implemented for both Approach I and II watersheds. APPROACH II – The sign up process for farmers in watersheds of Approach II was different than Approach I. Instead of meeting individually with farmers to select management alternatives, farmers in Approach II met with project staff individually during the watershed meeting to choose from a list of management alternatives (Appendix B). For farmers in Iowa’s North Fork Headwaters, a payment was added for completing 3 End-of-Season-Corn-Stalk-Nitrate Tests. If the average of the 3 tests is below 2,000 ppm, the farmer also receives an incentive payment. In Iowa’s Coldwater-Palmer, Lime Creek, and Hewitt Creek watersheds, farmers select from an array of performance targets, as well as common sense practices, listed in a simple one-page menu.
Phase 4: Education and Outreach To the greatest extent practicable, this project pursued opportunities to inform others about the approach and the results. This has taken place with farmers, agency staff, researchers, and interested stakeholders. Farmer meetings Project staff held meetings in focal watersheds to recruit initial participants, follow-up with 2008 project participants and recruit new participants for the 2009 crop year. Farmer meetings in Vermont were held at a local restaurant in Swanton and at one of the participating farms. In all four of the Iowa watersheds farmer meetings were held on a regular basis, often once per month during the non-busy seasons for the producers. Implementation Team meetings Project progress and results were presented to the VT and IA Implementation Teams. The team members played an important role, ensuring that our work is done effectively and fits well with other on-going efforts for agricultural pollution control. Meetings in Vermont were held at the NRCS State office in Colchester. In Iowa, Implementation Team meetings were held at the NRCS office in Des Moines.
Page 16 Pilot-testing Performance-based Incentives for Agricultural Pollution Control
Other venues for project outreach The project was also presented at several regional and national ag-water quality events. These are briefly listed below. This outreach was greatly enhanced by the existence of the PEPA National Facilitation project.
o 2007 National Water Conference o 2007 Southern Region Water Quality Conference o 2007 Iowa Water Conference o 2008 Soil and Water Conservation Society Annual Conference
Including 2nd place in the CIG showcase poster competition o 2008 Missisquoi Bay Water Quality Meeting o 2009 Soil and Water Conservation Society Annual Conference
Symposium on performance-based incentives o 2010 Managing Agricultural Landscapes II workshop
7. Results
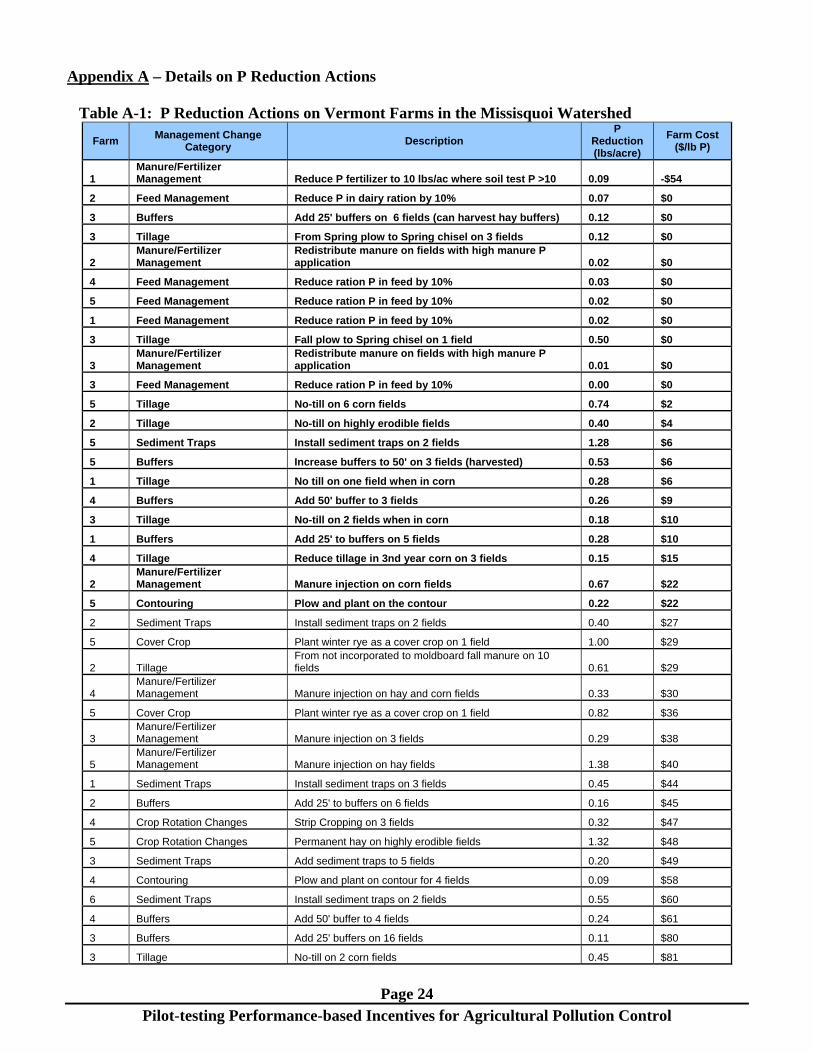
Approach I The incentive payment level used for Approach I in each watershed was determined by analyzing the cost-effectiveness of numerous options for reducing P loss on each participating farm. Our calculations showed that initial P reductions were, on average, much less costly to the producers in Iowa than to the producers in Vermont. Incentive payments were set at $25/lb P loss reduced for Vermont and $10 for Iowa. These payment levels are indicated as darkened horizontal lines in Figures 9 and 10, respectively. As mentioned above, any actions that cost less than the amount of the payment would be good business decisions for a farmer to do (i.e. the farm would increase profits by taking such actions). It should be noted, however, that farmers do not base their decisions solely on profitability; in practice not all “profitable” actions will be taken and that some actions taken were not the most profitable. Choices are also based on farmer preferences and varying levels of risk aversion. Vermont The Hungerford Brook and Rock River watersheds are both part of the larger Missisquoi River watershed in Northwestern Vermont. This is a very high priority area for P reduction into Lake Champlain. Twenty farms in this watershed participated in the project. Fifty-four field-specific P reduction actions were assessed across these farms. As can be seen in Figure 10 above, approximately 40% of the specific farm actions (22 of 54) to reduce P loss were estimated to be “profitable” at a $25 per pound incentive payment level. Approximately 20% of actions are estimated to have a zero or negative cost to the farmer. Table A-1 of Appendix A lists the basic descriptions of all 54 actions and their estimated results. An extremely important finding is that most cost-effective actions vary greatly from field to field and from farm to farm. As can be seen in the table, the most cost-effective actions include a variety of different practices. For the Vermont farms, the most cost-effective actions include changing fertilization, reducing P in the dairy feed ration, distributing manure differently across the farm, and changing tillage practices. Cover cropping, which is actively being promoted in this watershed, was not shown to be as cost-effective with results ranging from $29 to $842 per lb P loss reduced. The effectiveness of vegetative field buffers varies greatly based on the soil test P and slope (similar to cover crops), but the opportunity cost can be greatly reduced by allowing forage from buffers to be harvested. The average result of just the profitable actions (i.e. those having a cost of $25 per pound P loss reduced or less) is an estimated reduction of P loss 0.26 pounds per acre per year (Table 2). The average cost to the farmer for implementing these actions is estimated to be $4.86 per pound P loss reduced, resulting in
Page 17 Pilot-testing Performance-based Incentives for Agricultural Pollution Control
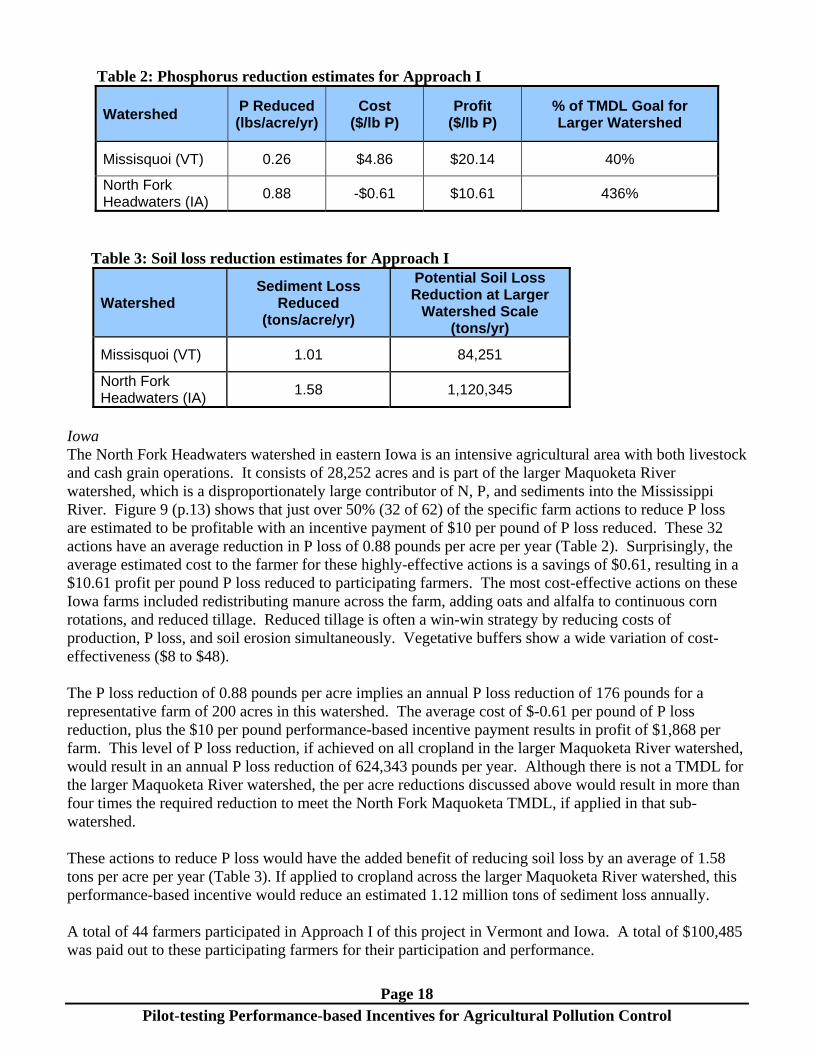
an average “profit” to the farm of $20.14 per pound. Applying these results to a representative 200-acre farm in the area, would result in an annual estimated P loss reduction of 52 pounds per farm per year. This reduction in annual P loss from the farm would have a cost to the farmer of $253 per year. However, with the incentive payment of $25 per pound of P loss reduced, this representative farm would have a resulting profit of $1,047. The larger Missisquoi River watershed is estimated to be the largest contributor of agricultural P loads to Lake Champlain. The Lake Champlain Phosphorus TMDL requires a reduction of 27.2 tons of P per year from agricultural land in the Missisquoi River watershed. To put the farm-level results discussed above into a watershed perspective, if all of the cropland in the Missisquoi River watershed were to reduce P loss by 0.26 pounds per acre, the estimated reduction in P loads to Lake Champlain could be over 11.02 tons per year.1 This represents more than 40% of the agricultural load reduction responsibility for this watershed. Because a significant amount of P loss from agricultural land is adsorbed to soil particles (i.e. particulate, as opposed to soluble P), actions to reduce P loss also often result in reduced sediment loss. Table 3 shows the profitable actions to reduce P loss would result in an average reduction in sediment loss of 1.01 tons per acre per year. By applying these results to all agricultural land in the Missisquoi River watershed, the total reduction in sediment loss is estimated to be 84,251 tons per year. It is important to note that the reduced sediment loss, in this case, is an ancillary benefit from the efforts to reduce P loss and that reduced sediment loss has inherent benefits for crop productivity and subsequent farm profits.
1 The relationship between P loss reductions and resulting load reductions in the receiving water body depends on many factors, such as geomorphic condition, which are beyond the scope of this project.
Page 18 Pilot-testing Performance-based Incentives for Agricultural Pollution Control
Table 2: Phosphorus reduction estimates for Approach I
Watershed P Reduced (lbs/acre/yr)
Cost ($/lb P)
Profit ($/lb P)
% of TMDL Goal for Larger Watershed
Missisquoi (VT) 0.26 $4.86 $20.14 40%
North Fork Headwaters (IA)
0.88 -$0.61 $10.61 436%
Table 3: Soil loss reduction estimates for Approach I
Watershed Sediment Loss
Reduced (tons/acre/yr)
Potential Soil Loss Reduction at Larger
Watershed Scale (tons/yr)
Missisquoi (VT) 1.01 84,251
North Fork Headwaters (IA)
1.58 1,120,345
Iowa The North Fork Headwaters watershed in eastern Iowa is an intensive agricultural area with both livestock and cash grain operations. It consists of 28,252 acres and is part of the larger Maquoketa River watershed, which is a disproportionately large contributor of N, P, and sediments into the Mississippi River. Figure 9 (p.13) shows that just over 50% (32 of 62) of the specific farm actions to reduce P loss are estimated to be profitable with an incentive payment of $10 per pound of P loss reduced. These 32 actions have an average reduction in P loss of 0.88 pounds per acre per year (Table 2). Surprisingly, the average estimated cost to the farmer for these highly-effective actions is a savings of $0.61, resulting in a $10.61 profit per pound P loss reduced to participating farmers. The most cost-effective actions on these Iowa farms included redistributing manure across the farm, adding oats and alfalfa to continuous corn rotations, and reduced tillage. Reduced tillage is often a win-win strategy by reducing costs of production, P loss, and soil erosion simultaneously. Vegetative buffers show a wide variation of cost-effectiveness ($8 to $48). The P loss reduction of 0.88 pounds per acre implies an annual P loss reduction of 176 pounds for a representative farm of 200 acres in this watershed. The average cost of $-0.61 per pound of P loss reduction, plus the $10 per pound performance-based incentive payment results in profit of $1,868 per farm. This level of P loss reduction, if achieved on all cropland in the larger Maquoketa River watershed, would result in an annual P loss reduction of 624,343 pounds per year. Although there is not a TMDL for the larger Maquoketa River watershed, the per acre reductions discussed above would result in more than four times the required reduction to meet the North Fork Maquoketa TMDL, if applied in that sub-watershed. These actions to reduce P loss would have the added benefit of reducing soil loss by an average of 1.58 tons per acre per year (Table 3). If applied to cropland across the larger Maquoketa River watershed, this performance-based incentive would reduce an estimated 1.12 million tons of sediment loss annually. A total of 44 farmers participated in Approach I of this project in Vermont and Iowa. A total of $100,485 was paid out to these participating farmers for their participation and performance.
Page 19 Pilot-testing Performance-based Incentives for Agricultural Pollution Control
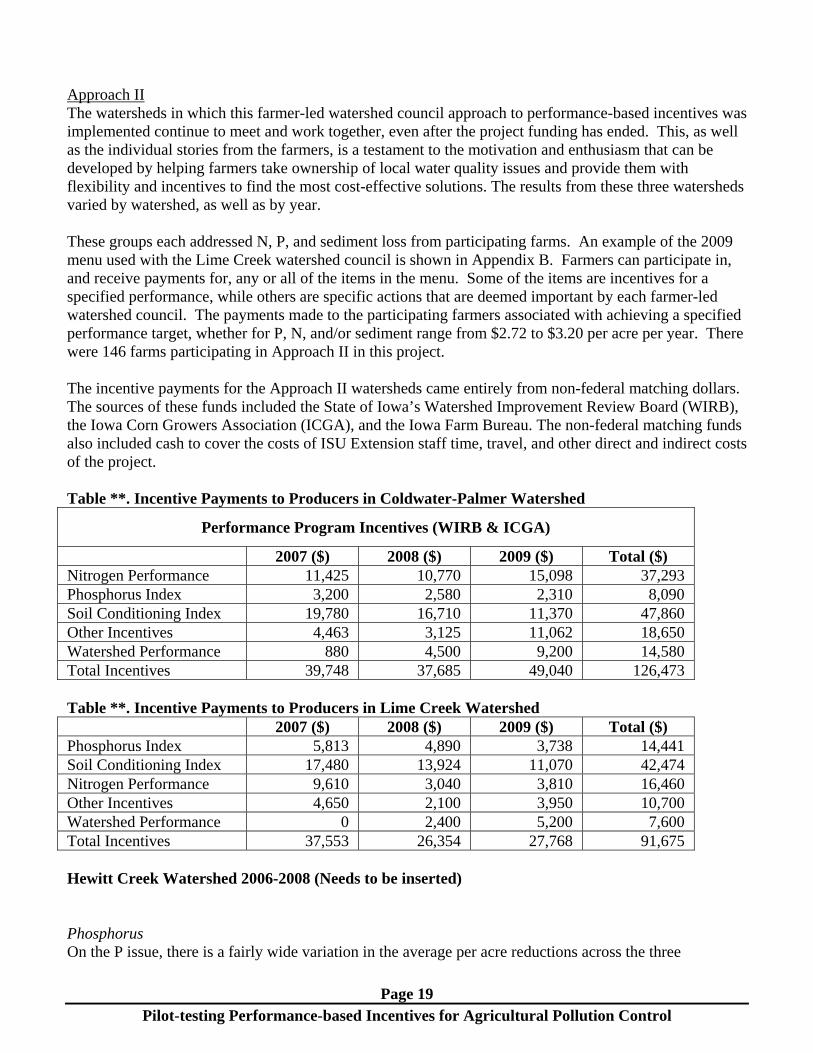
Approach II The watersheds in which this farmer-led watershed council approach to performance-based incentives was implemented continue to meet and work together, even after the project funding has ended. This, as well as the individual stories from the farmers, is a testament to the motivation and enthusiasm that can be developed by helping farmers take ownership of local water quality issues and provide them with flexibility and incentives to find the most cost-effective solutions. The results from these three watersheds varied by watershed, as well as by year. These groups each addressed N, P, and sediment loss from participating farms. An example of the 2009 menu used with the Lime Creek watershed council is shown in Appendix B. Farmers can participate in, and receive payments for, any or all of the items in the menu. Some of the items are incentives for a specified performance, while others are specific actions that are deemed important by each farmer-led watershed council. The payments made to the participating farmers associated with achieving a specified performance target, whether for P, N, and/or sediment range from $2.72 to $3.20 per acre per year. There were 146 farms participating in Approach II in this project. The incentive payments for the Approach II watersheds came entirely from non-federal matching dollars. The sources of these funds included the State of Iowa’s Watershed Improvement Review Board (WIRB), the Iowa Corn Growers Association (ICGA), and the Iowa Farm Bureau. The non-federal matching funds also included cash to cover the costs of ISU Extension staff time, travel, and other direct and indirect costs of the project. Table **. Incentive Payments to Producers in Coldwater-Palmer Watershed
Performance Program Incentives (WIRB & ICGA)
2007 ($) 2008 ($) 2009 ($) Total ($) Nitrogen Performance 11,425 10,770 15,098 37,293 Phosphorus Index 3,200 2,580 2,310 8,090 Soil Conditioning Index 19,780 16,710 11,370 47,860 Other Incentives 4,463 3,125 11,062 18,650 Watershed Performance 880 4,500 9,200 14,580 Total Incentives 39,748 37,685 49,040 126,473 Table **. Incentive Payments to Producers in Lime Creek Watershed
2007 ($) 2008 ($) 2009 ($) Total ($) Phosphorus Index 5,813 4,890 3,738 14,441 Soil Conditioning Index 17,480 13,924 11,070 42,474 Nitrogen Performance 9,610 3,040 3,810 16,460 Other Incentives 4,650 2,100 3,950 10,700 Watershed Performance 0 2,400 5,200 7,600 Total Incentives 37,553 26,354 27,768 91,675 Hewitt Creek Watershed 2006-2008 (Needs to be inserted) Phosphorus On the P issue, there is a fairly wide variation in the average per acre reductions across the three
Page 20 Pilot-testing Performance-based Incentives for Agricultural Pollution Control
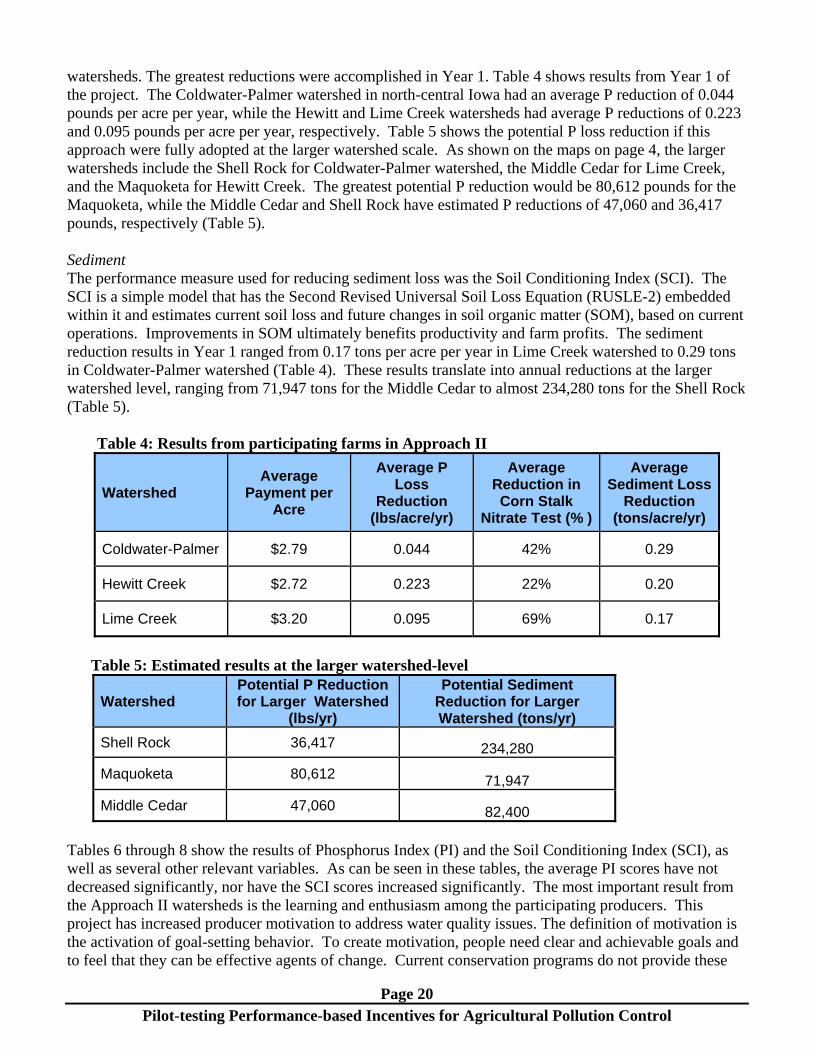
watersheds. The greatest reductions were accomplished in Year 1. Table 4 shows results from Year 1 of the project. The Coldwater-Palmer watershed in north-central Iowa had an average P reduction of 0.044 pounds per acre per year, while the Hewitt and Lime Creek watersheds had average P reductions of 0.223 and 0.095 pounds per acre per year, respectively. Table 5 shows the potential P loss reduction if this approach were fully adopted at the larger watershed scale. As shown on the maps on page 4, the larger watersheds include the Shell Rock for Coldwater-Palmer watershed, the Middle Cedar for Lime Creek, and the Maquoketa for Hewitt Creek. The greatest potential P reduction would be 80,612 pounds for the Maquoketa, while the Middle Cedar and Shell Rock have estimated P reductions of 47,060 and 36,417 pounds, respectively (Table 5). Sediment The performance measure used for reducing sediment loss was the Soil Conditioning Index (SCI). The SCI is a simple model that has the Second Revised Universal Soil Loss Equation (RUSLE-2) embedded within it and estimates current soil loss and future changes in soil organic matter (SOM), based on current operations. Improvements in SOM ultimately benefits productivity and farm profits. The sediment reduction results in Year 1 ranged from 0.17 tons per acre per year in Lime Creek watershed to 0.29 tons in Coldwater-Palmer watershed (Table 4). These results translate into annual reductions at the larger watershed level, ranging from 71,947 tons for the Middle Cedar to almost 234,280 tons for the Shell Rock (Table 5).
Table 4: Results from participating farms in Approach II
Watershed Average
Payment per Acre
Average P Loss
Reduction (lbs/acre/yr)
Average Reduction in Corn Stalk
Nitrate Test (% )
Average Sediment Loss
Reduction (tons/acre/yr)
Coldwater-Palmer $2.79 0.044 42% 0.29
Hewitt Creek $2.72 0.223 22% 0.20
Lime Creek $3.20 0.095 69% 0.17
Table 5: Estimated results at the larger watershed-level
Watershed Potential P Reduction for Larger Watershed
(lbs/yr)
Potential Sediment Reduction for Larger Watershed (tons/yr)
Shell Rock 36,417 234,280
Maquoketa 80,612 71,947
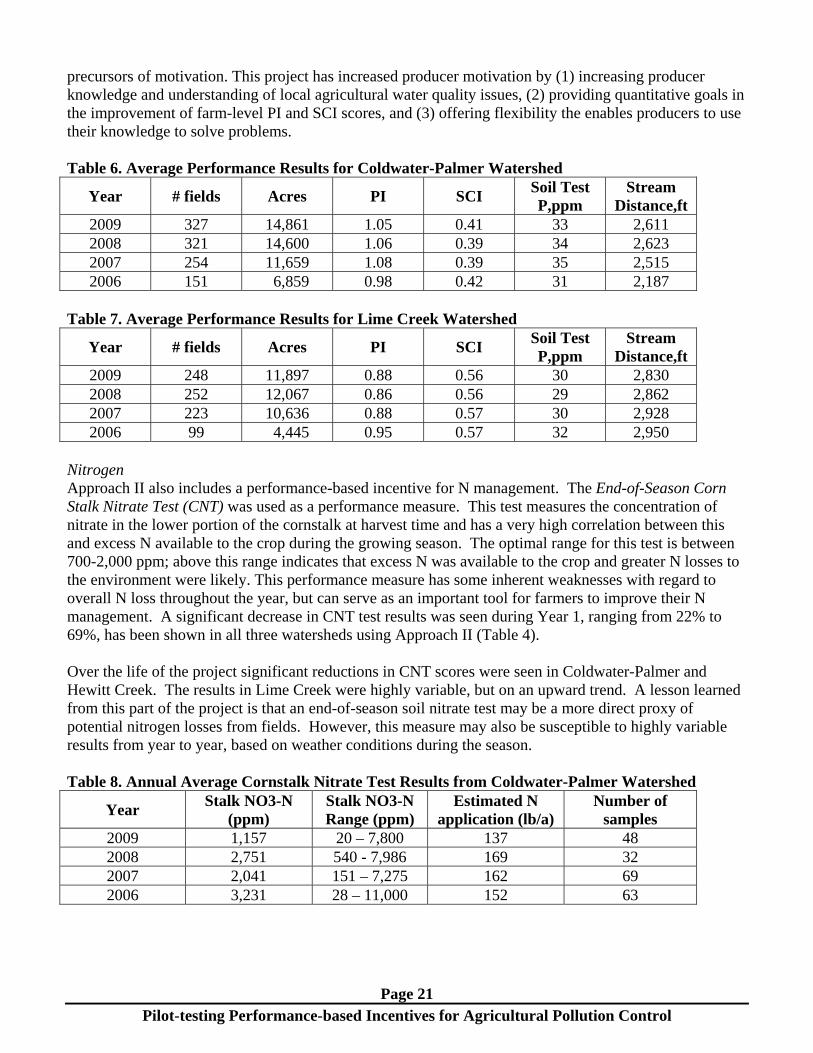
Middle Cedar 47,060 82,400 Tables 6 through 8 show the results of Phosphorus Index (PI) and the Soil Conditioning Index (SCI), as well as several other relevant variables. As can be seen in these tables, the average PI scores have not decreased significantly, nor have the SCI scores increased significantly. The most important result from the Approach II watersheds is the learning and enthusiasm among the participating producers. This project has increased producer motivation to address water quality issues. The definition of motivation is the activation of goal-setting behavior. To create motivation, people need clear and achievable goals and to feel that they can be effective agents of change. Current conservation programs do not provide these
Page 21 Pilot-testing Performance-based Incentives for Agricultural Pollution Control
precursors of motivation. This project has increased producer motivation by (1) increasing producer knowledge and understanding of local agricultural water quality issues, (2) providing quantitative goals in the improvement of farm-level PI and SCI scores, and (3) offering flexibility the enables producers to use their knowledge to solve problems. Table 6. Average Performance Results for Coldwater-Palmer Watershed
Year # fields Acres PI SCI Soil Test P,ppm
Stream Distance,ft
2009 327 14,861 1.05 0.41 33 2,611 2008 321 14,600 1.06 0.39 34 2,623 2007 254 11,659 1.08 0.39 35 2,515 2006 151 6,859 0.98 0.42 31 2,187
Table 7. Average Performance Results for Lime Creek Watershed
Year # fields Acres PI SCI Soil Test P,ppm
Stream Distance,ft
2009 248 11,897 0.88 0.56 30 2,830 2008 252 12,067 0.86 0.56 29 2,862 2007 223 10,636 0.88 0.57 30 2,928 2006 99 4,445 0.95 0.57 32 2,950
Nitrogen Approach II also includes a performance-based incentive for N management. The End-of-Season Corn Stalk Nitrate Test (CNT) was used as a performance measure. This test measures the concentration of nitrate in the lower portion of the cornstalk at harvest time and has a very high correlation between this and excess N available to the crop during the growing season. The optimal range for this test is between 700-2,000 ppm; above this range indicates that excess N was available to the crop and greater N losses to the environment were likely. This performance measure has some inherent weaknesses with regard to overall N loss throughout the year, but can serve as an important tool for farmers to improve their N management. A significant decrease in CNT test results was seen during Year 1, ranging from 22% to 69%, has been shown in all three watersheds using Approach II (Table 4). Over the life of the project significant reductions in CNT scores were seen in Coldwater-Palmer and Hewitt Creek. The results in Lime Creek were highly variable, but on an upward trend. A lesson learned from this part of the project is that an end-of-season soil nitrate test may be a more direct proxy of potential nitrogen losses from fields. However, this measure may also be susceptible to highly variable results from year to year, based on weather conditions during the season. Table 8. Annual Average Cornstalk Nitrate Test Results from Coldwater-Palmer Watershed
Year Stalk NO3-N
(ppm) Stalk NO3-N Range (ppm)
Estimated N application (lb/a)
Number of samples
2009 1,157 20 – 7,800 137 48 2008 2,751 540 - 7,986 169 32 2007 2,041 151 – 7,275 162 69 2006 3,231 28 – 11,000 152 63
Page 22 Pilot-testing Performance-based Incentives for Agricultural Pollution Control
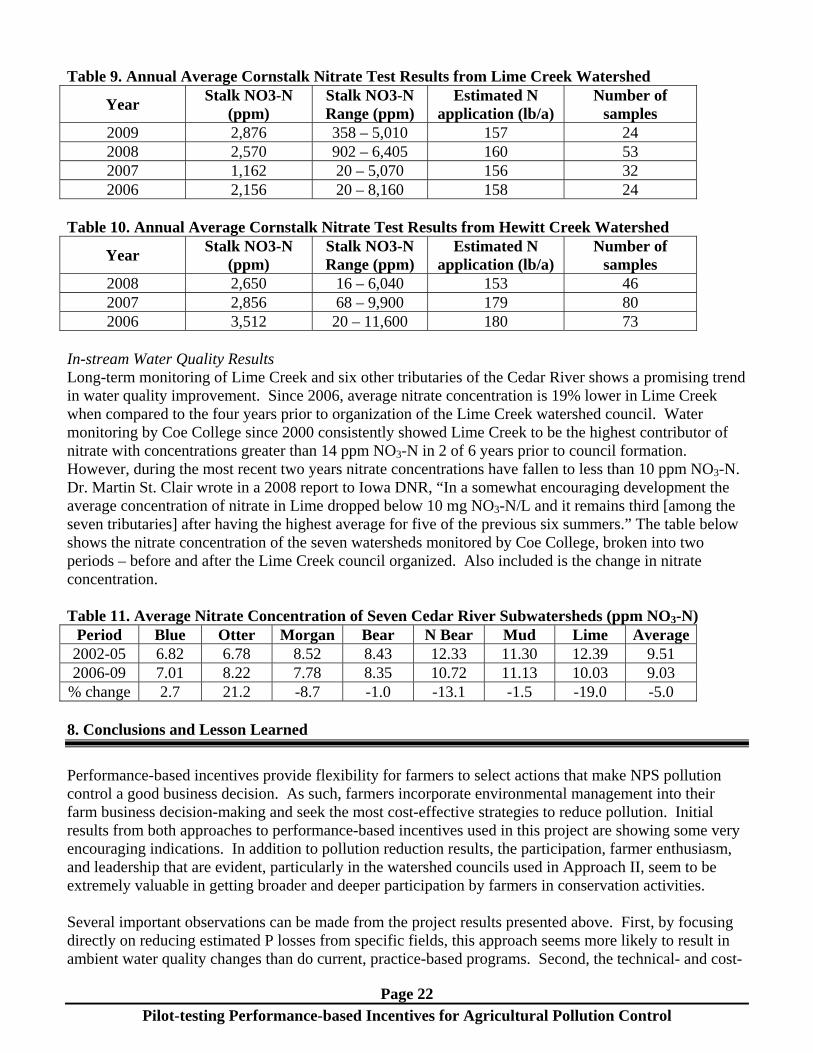
Table 9. Annual Average Cornstalk Nitrate Test Results from Lime Creek Watershed
Year Stalk NO3-N
(ppm) Stalk NO3-N Range (ppm)
Estimated N application (lb/a)
Number of samples
2009 2,876 358 – 5,010 157 24 2008 2,570 902 – 6,405 160 53 2007 1,162 20 – 5,070 156 32 2006 2,156 20 – 8,160 158 24
Table 10. Annual Average Cornstalk Nitrate Test Results from Hewitt Creek Watershed
Year Stalk NO3-N
(ppm) Stalk NO3-N Range (ppm)
Estimated N application (lb/a)
Number of samples
2008 2,650 16 – 6,040 153 46 2007 2,856 68 – 9,900 179 80 2006 3,512 20 – 11,600 180 73
In-stream Water Quality Results Long-term monitoring of Lime Creek and six other tributaries of the Cedar River shows a promising trend in water quality improvement. Since 2006, average nitrate concentration is 19% lower in Lime Creek when compared to the four years prior to organization of the Lime Creek watershed council. Water monitoring by Coe College since 2000 consistently showed Lime Creek to be the highest contributor of nitrate with concentrations greater than 14 ppm NO3-N in 2 of 6 years prior to council formation. However, during the most recent two years nitrate concentrations have fallen to less than 10 ppm NO3-N. Dr. Martin St. Clair wrote in a 2008 report to Iowa DNR, “In a somewhat encouraging development the average concentration of nitrate in Lime dropped below 10 mg NO3-N/L and it remains third [among the seven tributaries] after having the highest average for five of the previous six summers.” The table below shows the nitrate concentration of the seven watersheds monitored by Coe College, broken into two periods – before and after the Lime Creek council organized. Also included is the change in nitrate concentration. Table 11. Average Nitrate Concentration of Seven Cedar River Subwatersheds (ppm NO3-N)
Period Blue Otter Morgan Bear N Bear Mud Lime Average2002-05 6.82 6.78 8.52 8.43 12.33 11.30 12.39 9.51 2006-09 7.01 8.22 7.78 8.35 10.72 11.13 10.03 9.03
% change 2.7 21.2 -8.7 -1.0 -13.1 -1.5 -19.0 -5.0 8. Conclusions and Lesson Learned
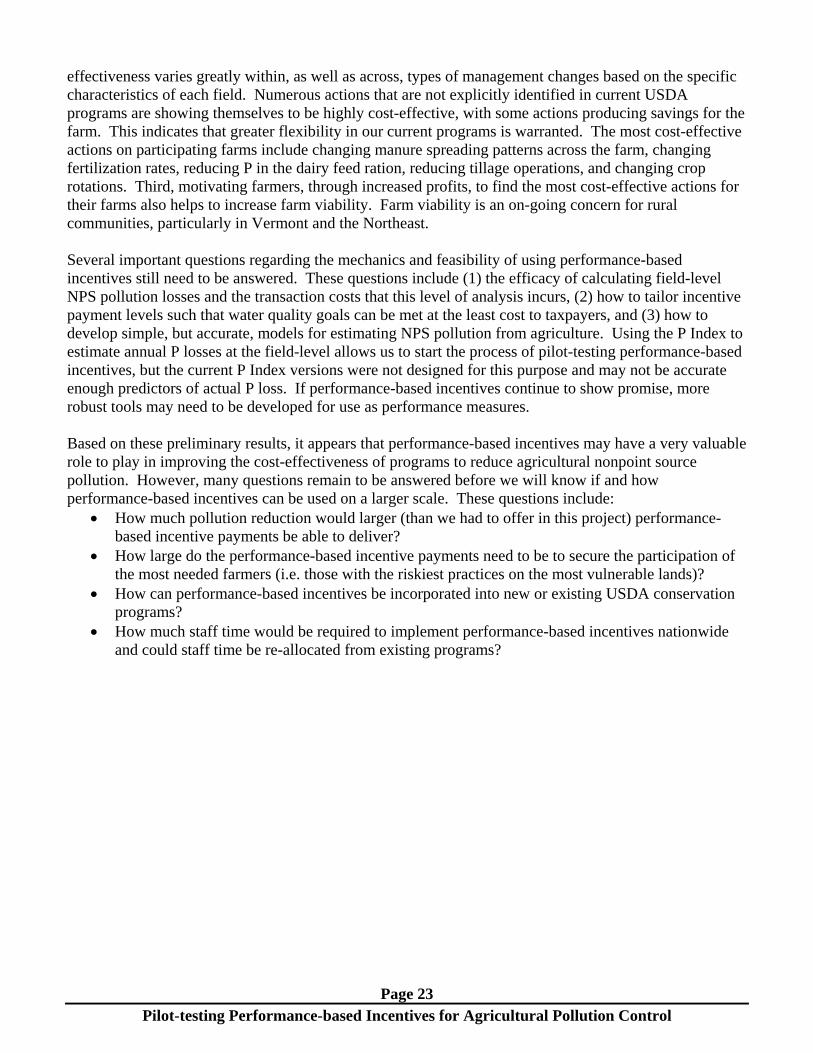
Performance-based incentives provide flexibility for farmers to select actions that make NPS pollution control a good business decision. As such, farmers incorporate environmental management into their farm business decision-making and seek the most cost-effective strategies to reduce pollution. Initial results from both approaches to performance-based incentives used in this project are showing some very encouraging indications. In addition to pollution reduction results, the participation, farmer enthusiasm, and leadership that are evident, particularly in the watershed councils used in Approach II, seem to be extremely valuable in getting broader and deeper participation by farmers in conservation activities. Several important observations can be made from the project results presented above. First, by focusing directly on reducing estimated P losses from specific fields, this approach seems more likely to result in ambient water quality changes than do current, practice-based programs. Second, the technical- and cost-
Page 23 Pilot-testing Performance-based Incentives for Agricultural Pollution Control
effectiveness varies greatly within, as well as across, types of management changes based on the specific characteristics of each field. Numerous actions that are not explicitly identified in current USDA programs are showing themselves to be highly cost-effective, with some actions producing savings for the farm. This indicates that greater flexibility in our current programs is warranted. The most cost-effective actions on participating farms include changing manure spreading patterns across the farm, changing fertilization rates, reducing P in the dairy feed ration, reducing tillage operations, and changing crop rotations. Third, motivating farmers, through increased profits, to find the most cost-effective actions for their farms also helps to increase farm viability. Farm viability is an on-going concern for rural communities, particularly in Vermont and the Northeast. Several important questions regarding the mechanics and feasibility of using performance-based incentives still need to be answered. These questions include (1) the efficacy of calculating field-level NPS pollution losses and the transaction costs that this level of analysis incurs, (2) how to tailor incentive payment levels such that water quality goals can be met at the least cost to taxpayers, and (3) how to develop simple, but accurate, models for estimating NPS pollution from agriculture. Using the P Index to estimate annual P losses at the field-level allows us to start the process of pilot-testing performance-based incentives, but the current P Index versions were not designed for this purpose and may not be accurate enough predictors of actual P loss. If performance-based incentives continue to show promise, more robust tools may need to be developed for use as performance measures. Based on these preliminary results, it appears that performance-based incentives may have a very valuable role to play in improving the cost-effectiveness of programs to reduce agricultural nonpoint source pollution. However, many questions remain to be answered before we will know if and how performance-based incentives can be used on a larger scale. These questions include:
How much pollution reduction would larger (than we had to offer in this project) performance-based incentive payments be able to deliver?
How large do the performance-based incentive payments need to be to secure the participation of the most needed farmers (i.e. those with the riskiest practices on the most vulnerable lands)?
How can performance-based incentives be incorporated into new or existing USDA conservation programs?
How much staff time would be required to implement performance-based incentives nationwide and could staff time be re-allocated from existing programs?
Page 24 Pilot-testing Performance-based Incentives for Agricultural Pollution Control
Appendix A – Details on P Reduction Actions
Table A-1: P Reduction Actions on Vermont Farms in the Missisquoi Watershed
Farm Management Change
Category Description
P Reduction (lbs/acre)
Farm Cost ($/lb P)
1 Manure/Fertilizer Management Reduce P fertilizer to 10 lbs/ac where soil test P >10 0.09 -$54
2 Feed Management Reduce P in dairy ration by 10% 0.07 $0
3 Buffers Add 25' buffers on 6 fields (can harvest hay buffers) 0.12 $0
3 Tillage From Spring plow to Spring chisel on 3 fields 0.12 $0
2 Manure/Fertilizer Management
Redistribute manure on fields with high manure P application 0.02 $0
4 Feed Management Reduce ration P in feed by 10% 0.03 $0
5 Feed Management Reduce ration P in feed by 10% 0.02 $0
1 Feed Management Reduce ration P in feed by 10% 0.02 $0
3 Tillage Fall plow to Spring chisel on 1 field 0.50 $0
3 Manure/Fertilizer Management
Redistribute manure on fields with high manure P application 0.01 $0
3 Feed Management Reduce ration P in feed by 10% 0.00 $0
5 Tillage No-till on 6 corn fields 0.74 $2
2 Tillage No-till on highly erodible fields 0.40 $4
5 Sediment Traps Install sediment traps on 2 fields 1.28 $6
5 Buffers Increase buffers to 50' on 3 fields (harvested) 0.53 $6
1 Tillage No till on one field when in corn 0.28 $6
4 Buffers Add 50' buffer to 3 fields 0.26 $9
3 Tillage No-till on 2 fields when in corn 0.18 $10
1 Buffers Add 25' to buffers on 5 fields 0.28 $10
4 Tillage Reduce tillage in 3nd year corn on 3 fields 0.15 $15
2 Manure/Fertilizer Management Manure injection on corn fields 0.67 $22
5 Contouring Plow and plant on the contour 0.22 $22
2 Sediment Traps Install sediment traps on 2 fields 0.40 $27
5 Cover Crop Plant winter rye as a cover crop on 1 field 1.00 $29
2 Tillage From not incorporated to moldboard fall manure on 10 fields 0.61 $29
4 Manure/Fertilizer Management Manure injection on hay and corn fields 0.33 $30
5 Cover Crop Plant winter rye as a cover crop on 1 field 0.82 $36
3 Manure/Fertilizer Management Manure injection on 3 fields 0.29 $38
5 Manure/Fertilizer Management Manure injection on hay fields 1.38 $40
1 Sediment Traps Install sediment traps on 3 fields 0.45 $44
2 Buffers Add 25' to buffers on 6 fields 0.16 $45
4 Crop Rotation Changes Strip Cropping on 3 fields 0.32 $47
5 Crop Rotation Changes Permanent hay on highly erodible fields 1.32 $48
3 Sediment Traps Add sediment traps to 5 fields 0.20 $49
4 Contouring Plow and plant on contour for 4 fields 0.09 $58
6 Sediment Traps Install sediment traps on 2 fields 0.55 $60
4 Buffers Add 50' buffer to 4 fields 0.24 $61
3 Buffers Add 25' buffers on 16 fields 0.11 $80
3 Tillage No-till on 2 corn fields 0.45 $81
Page 25 Pilot-testing Performance-based Incentives for Agricultural Pollution Control
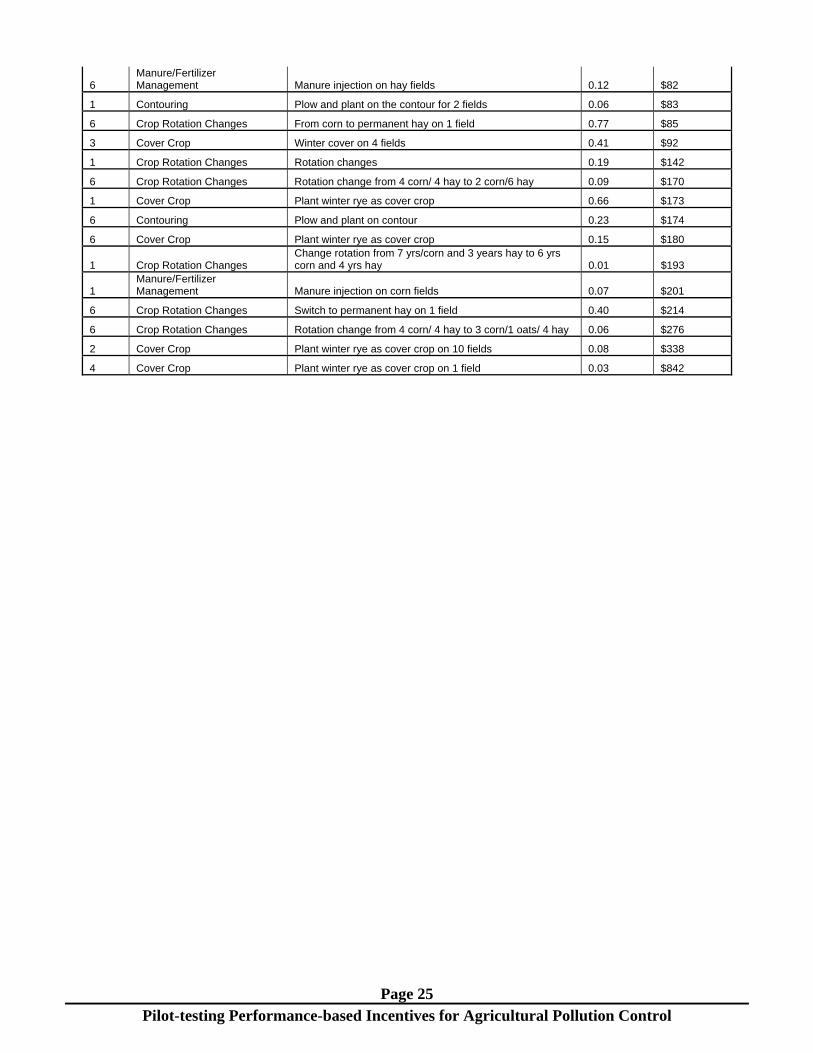
6 Manure/Fertilizer Management Manure injection on hay fields 0.12 $82
1 Contouring Plow and plant on the contour for 2 fields 0.06 $83
6 Crop Rotation Changes From corn to permanent hay on 1 field 0.77 $85
3 Cover Crop Winter cover on 4 fields 0.41 $92
1 Crop Rotation Changes Rotation changes 0.19 $142
6 Crop Rotation Changes Rotation change from 4 corn/ 4 hay to 2 corn/6 hay 0.09 $170
1 Cover Crop Plant winter rye as cover crop 0.66 $173
6 Contouring Plow and plant on contour 0.23 $174
6 Cover Crop Plant winter rye as cover crop 0.15 $180
1 Crop Rotation Changes Change rotation from 7 yrs/corn and 3 years hay to 6 yrs corn and 4 yrs hay 0.01 $193
1 Manure/Fertilizer Management Manure injection on corn fields 0.07 $201
6 Crop Rotation Changes Switch to permanent hay on 1 field 0.40 $214
6 Crop Rotation Changes Rotation change from 4 corn/ 4 hay to 3 corn/1 oats/ 4 hay 0.06 $276
2 Cover Crop Plant winter rye as cover crop on 10 fields 0.08 $338
4 Cover Crop Plant winter rye as cover crop on 1 field 0.03 $842
Page 26 Pilot-testing Performance-based Incentives for Agricultural Pollution Control
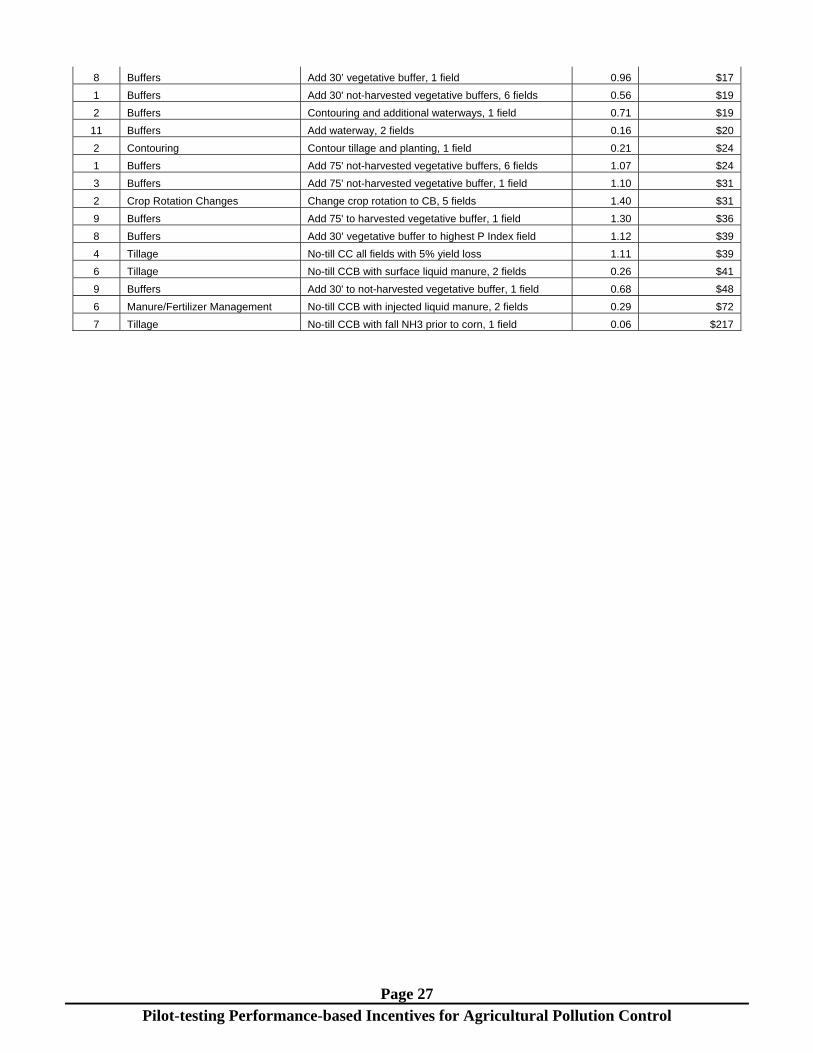
Table A-2: P Reduction Actions on Iowa Farms in the North Fork Headwaters Watershed
Farm Management Change Category Description P
Reduction (lbs/acre)
Farm Cost ($/lb P)
1 Manure/Fertilizer Management Redistribute manure according to soil P test 0.04 -$114
3 Crop Rotation Changes Change crop rotation from CC to CCOAAA, 1 field 1.43 -$67
3 Crop Rotation Changes Strip cropping with a CCOAAA rotation, 1 field 1.88 -$51
4 Tillage Eliminate fall chisel on all fields 0.15 -$23
5 Tillage Eliminate disking prior to corn, 3 fields 0.36 -$6
6 Tillage No-till CB rotation with surface liquid manure 1.67 -$3
7 Tillage No-till first year corn, 4 fields 0.82 $0
5 Sediment Traps Terrace 1 field and eliminate disking prior to corn 1.50 $0
7 Tillage No-till CC, bale cornstalks, eliminate manure 3.88 $1
5 Sediment Traps Terrace 1 field 4.22 $2
1 Tillage No-till corn on 2 fields with no yield loss 3.68 $2
4 Contouring Contour tillage & planting, eliminate fall chisel 0.69 $2
8 Tillage No-till all fields with no yield loss 2.99 $3
8 Tillage No-till 3 highest P Index fields with no yield loss 2.55 $3
6 Tillage No-till CB rotation with injected liquid manure 1.38 $3
9 Crop Rotation Changes Convert to strip–cropping, 2 fields 0.80 $4
10 Crop Rotation Changes Convert to strip–cropping, 1 field 0.25 $4
11 Tillage No-till CC, 2 fields 1.52 $5
6 Tillage No-till CCB rotation with surface liquid manure, 4 fields 2.12 $5
1 Tillage No-till corn on 2 fields with 2% yield loss 3.68 $5
5 Tillage No-till CB rotation 1.41 $6
5 Tillage No-till corn in a CB rotation 0.59 $8
1 Contouring Contour 2 fields 0.65 $8
1 Buffers Contour buffer strips within 2 fields 1.95 $8
2 Crop Rotation Changes Change crop rotation to CB 1.84 $8
10 Contouring Contour tillage and planting, 3 fields 0.64 $8
4 Contouring Contour tillage and planting 0.61 $8
7 Buffers Add 30' not harvested buffer, 1 field 1.14 $9
5 Tillage No-till soybeans in a CB rotation 0.49 $9
11 Buffers Add harvested waterways, 2 fields 0.16 $10
3 Crop Rotation Changes Add contour harvested hay strips, 1 field 1.35 $10
1 Buffers Add 75' harvested vegetative buffers, 6 fields 1.07 $10
7 Buffers Add 75' not harvested vegetative buffer, 1 field 2.19 $11
1 Cover Crop Oat cover crop prior to no-till corn, 1 field 0.80 $11
6 Manure/Fertilizer Management No-till CCB rotation with injected liquid manure, 4 fields 1.82 $12
4 Tillage No-till corn, all fields with no yield loss 1.11 $12
2 Crop Rotation Changes Change crop rotation to CB, 4 fields 1.70 $13
8 Tillage No-till CC on 3 highest P Index fields, 5% yield loss 2.99 $13
3 Buffers Add 75' harvested buffer, 1 field 1.10 $13
4 Buffers Add waterways, 2 fields 0.10 $13
11 Tillage No-till corn with 2% yield loss, 2 fields 1.52 $13
11 Buffers Add 45' harvested buffer, 2 fields 0.86 $13
8 Tillage No-till CC all fields, 5% yield loss 2.55 $15
8 Buffers Add waterway, 1 field 0.37 $15
11 Buffers Add 15' not harvested contour buffer strips, 2 fields 0.58 $15
2 Buffers Add waterways, 1 field 0.50 $16
1 Cover Crop Oat cover crop prior to corn, 1 field 0.65 $17
Page 27 Pilot-testing Performance-based Incentives for Agricultural Pollution Control
8 Buffers Add 30’ vegetative buffer, 1 field 0.96 $17
1 Buffers Add 30' not-harvested vegetative buffers, 6 fields 0.56 $19
2 Buffers Contouring and additional waterways, 1 field 0.71 $19
11 Buffers Add waterway, 2 fields 0.16 $20
2 Contouring Contour tillage and planting, 1 field 0.21 $24
1 Buffers Add 75' not-harvested vegetative buffers, 6 fields 1.07 $24
3 Buffers Add 75' not-harvested vegetative buffer, 1 field 1.10 $31
2 Crop Rotation Changes Change crop rotation to CB, 5 fields 1.40 $31
9 Buffers Add 75' to harvested vegetative buffer, 1 field 1.30 $36
8 Buffers Add 30’ vegetative buffer to highest P Index field 1.12 $39
4 Tillage No-till CC all fields with 5% yield loss 1.11 $39
6 Tillage No-till CCB with surface liquid manure, 2 fields 0.26 $41
9 Buffers Add 30' to not-harvested vegetative buffer, 1 field 0.68 $48
6 Manure/Fertilizer Management No-till CCB with injected liquid manure, 2 fields 0.29 $72
7 Tillage No-till CCB with fall NH3 prior to corn, 1 field 0.06 $217
Proposed management changes for reducing phosphorus runoff
Page 28 Pilot-testing Performance-based Incentives for Agricultural Pollution Control
Appendix B – Example of Producer Sign-up Sheet for Approach II PERFORMANCE (outcome)-BASED FARM and WATERSHED
ENVIRONMENTAL MANAGEMENT PROGRAM Lime Creek watershed Rev. 8/19/08 Please check activities you wish to complete. (Deadline April 1/first-come subject to funding). [Payments near July 1 and early December may be prorated if participation exceeds $80,000]. PHOSPHORUS INDEX (PI) Maximum $10/Ac. See P-index explanation on back of this page. ____$300 payment if the weighted whole farm P-index is less than a phosphorus loss risk of 3 (2-5 is medium risk). All field scores weighted by the field size and risk of P loss from each field to attain a weighted average farm P-index. ____$100 paid for annual data and P-index review after the first year. ____$100 bonus - review P-index is less than 1 (very low) and for each 0.1 reduction in P-index. ____$150 bonus if all fields test within or less than the optimum P University soil test range. ____$10 per management area or field tested for soil test P, 10 or more acres per sample. SOIL CONDITIONING INDEX (SCI) Maximum $10/Ac. See back for SCI explanation. ____$200 payment per 0.1 SCI above 0. Weighted average of all fields in farming operation. ____$100 per 0.1 SCI for annual data and SCI review after the first year. ____$400 paid for each 0.1 improvement in the annual SCI. NITROGEN PERFORMANCE MANAGEMENT (Corn Stalk Nitrate-Nitrogen analysis) ____$400 payment if the farm weighted average analyses does not exceed 1,700ppm. ____$200 bonus if the weighted average (Max. 50 acres/field) is less than 1,300ppm. ____$80 for two cornstalk NO3N samples analyzed and $30.00 for each additional field. ____$80 for the first two Late Spring Nitrate Tests and $30 for each additional 40 acre test. ____$200 bonus for a wetland or drainage tile management to reduce Nitrate delivery. ____$250 for all commercial N applied in the spring, limit of 50#/ac N as DAP or MAP in fall OTHER INCENTIVES ____$200 For manure application calibration, manure analysis and nutrient Mgt. demonstration. ____$200 Install a manure settling basin and grass filter or pre-lot water diversion. ____$200 Livestock Exclusion (stream fencing) or managed grazing (5 or more paddocks). ____$500 For a nitrogen, manure, drainage, or tillage/planting replicated demonstration. ____$200 Septic system up-grade. Low interest revolving fund loans available (515-242-6043). ____$100 Farmstead Assessment (first time self assessment or changes-improved assessment). ____$0.50/ft., maximum 1,200 ft., waterways (no parallel row planting), headlands, or buffers, minimum 30’ width. ____$200 Farmable berms for diversion of water to ditches or waterways protecting Min. 40 Ac. WATERSHED ENVIRONMENTAL PERFORMANCE (add-on bonus). ____$100 Bonus for each 10% increase above 20% of the land in the watershed enrolled in this Performance program. Payable to cooperators earning $1,000 or more watershed improvement incentives per farm operation. ____$200 Three years of monitoring showing evidence of reduced contaminant delivery. ___________________________ _________________________________ ________________ Name Address Phone
Proposed management changes for reducing phosphorus runoff
Page 29 Pilot-testing Performance-based Incentives for Agricultural Pollution Control
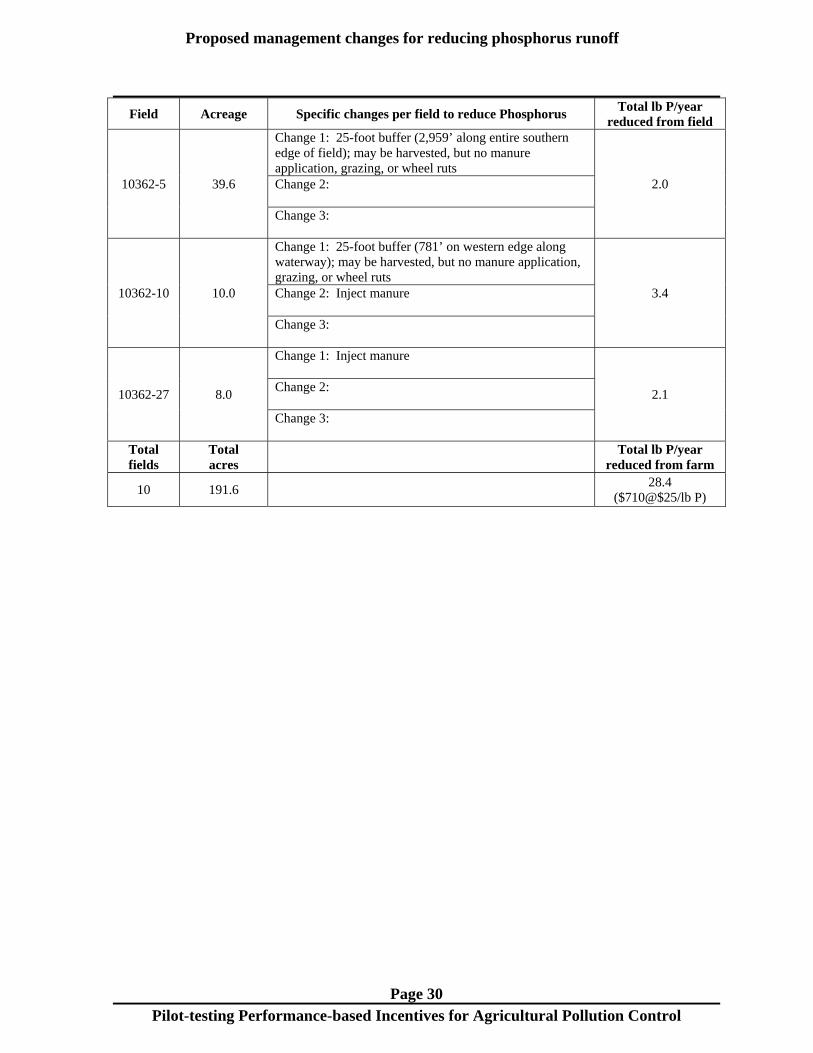
Appendix C – List of Management Changes a Producer Signs up for Approach I
Field Acreage Specific changes per field to reduce Phosphorus Total lb P/year
reduced from field
389-2 22.7
Change 1: 25-foot buffer (542’ along southeastern edge of field along field 3); may be harvested, but no manure application, grazing, or wheel ruts
2.1 Change 2: Change 3:
389-4 4.1
Change 1: Inject manure
1.6 Change 2: Change 3:
10360-12 10.2
Change 1: 25-foot buffer (329’ in southern corner of field along waterway); may be harvested, but no manure application, grazing, or wheel ruts
2.5 Change 2: Change 3:
10360-21 54.5
Change 1: 25-foot buffer (1,553’ buffer on edge along waterway); may be harvested, but no manure application, grazing, or wheel ruts
5.7 Change 2: Change 3:
10361-14 20.1
Change 1: No-till corn
3.3 Change 2: Change 3:
10361-16 6.8
Change 1: No-till corn
1.5 Change 2: Change 3:
10361-25 15.6
Change 1: 25-foot buffer (300’ along edge on street closest to waterway); may be harvested, but no manure application, grazing, or wheel ruts
4.2 Change 2: Change 3:
Proposed management changes for reducing phosphorus runoff
Page 30 Pilot-testing Performance-based Incentives for Agricultural Pollution Control
Field Acreage Specific changes per field to reduce Phosphorus Total lb P/year
reduced from field
10362-5 39.6
Change 1: 25-foot buffer (2,959’ along entire southern edge of field); may be harvested, but no manure application, grazing, or wheel ruts
2.0 Change 2: Change 3:
10362-10 10.0
Change 1: 25-foot buffer (781’ on western edge along waterway); may be harvested, but no manure application, grazing, or wheel ruts
3.4 Change 2: Inject manure Change 3:
10362-27 8.0
Change 1: Inject manure
2.1 Change 2: Change 3:
Total fields
Total acres
Total lb P/year reduced from farm
10 191.6 28.4
($710@$25/lb P)