Embed Size (px)
Citation preview
Pillar 3 disclosuresMacquarie Bank September 2016
MACQUARIE BANK LIMITED ACN 008 583 542

Macquarie Bank Limited Pillar 3 Disclosures September 2016 macquarie.com
This page has been left blank intentionally.
Macquarie Bank Limited ABN 46 008 583 542
No.1 Martin Place Telephone (61 2) 8232 3333 Money Market 8232 3600 Facsimile 8232 4227 Sydney NSW 2000 Facsimile (61 2) 8232 7780 Foreign Exchange 8232 3666 Facsimile 8232 3019 GPO Box 4294 Telex 122246 Metals and Mining 8232 3444 Facsimile 8232 3590 Sydney NSW 1164 Internet http://www.macquarie.com.au Futures 9231 1028 Telex 72263 DX 10287 SSE Debt Markets 8232 3815 Facsimile 8232 4414 SWIFT MACQAU2S
ASX Release
MACQUARIE BANK RELEASES SEPTEMBER PILLAR 3 DISCLOSURE DOCUMENT 18 November 2016 - The Macquarie Bank Limited September 2016 Pillar 3 disclosure document was
released today on the Macquarie website www.macquarie.com. These disclosures have been
prepared in accordance with the Australian Prudential Regulation Authority (APRA) requirements of
Prudential Standard APS 330 Capital Adequacy: Public Disclosure of Prudential Information.
Contacts:
Karen Khadi, Macquarie Group Investor Relations +612 8232 3548
Lisa Jamieson, Macquarie Group Media Relations +612 8232 6016

Macquarie Bank Limited Pillar 3 Disclosures September 2016 macquarie.com
This page has been left blank intentionally.
Contents
1
Introduction 2 1.0 Overview 3 2.0 Risk Management Governance and Framework 5 3.0 Capital Structure 7 4.0 Capital Adequacy 9 5.0 Credit Risk Measurement 14 6.0 Calculation of Credit Risk Exposures 27 7.0 Provisioning 33 8.0 Credit Risk Mitigation 41 9.0 Securitisation 44 10.0 Credit Valuation Adjustment 57
11.0 Exposures to Central Counterparties 58
12.0 Market Risk 60 13.0 Equity Risk 65 14.0 Operational Risk 68 15.0 Leverage ratio disclosures 69 16.0 Liquidity coverage ratio disclosures 71 Disclaimer 73 Appendices 74
Macquarie Bank Limited Pillar 3 Disclosures September 2016 macquarie.com
Introduction
2
Macquarie Bank Limited (MBL) is an Authorised Deposit-taking Institution (ADI) regulated by the Australian Prudential Regulation Authority (APRA). MBL is accredited under the Foundation Internal Ratings Based Approach (FIRB) for credit risk, the Advanced Measurement Approach (AMA) for operational risk, the Internal Model Approach (IMA) for market risk and the internal model approach for interest rate risk in the banking book. These advanced approaches place a higher reliance on a bank’s internal capital measures and therefore require a more sophisticated level of risk management and risk measurement practices.
On 1 January 2013, reforms to the Basel II capital adequacy framework came into effect (the Basel III framework). These reforms are designed to strengthen global capital rules with the goal of promoting a more resilient banking sector. The objective of the reforms is to improve the banking sector’s ability to absorb shocks arising from financial stress, whatever the source, thus reducing the risk of spillover from the financial sector to the real economy.
The reforms include;
– Raising the quality, consistency and transparency of the capital base – section 3 (including changes to equity risk, see section 13)
– Introducing a capital requirement to cover Credit Valuation Adjustments (CVA) – section 10 – Introducing an Asset Value Correlation (AVC) loading on exposures to certain financial institutions – section 4 – Requiring capital to be held against exposures to central clearing houses – section 11
APRA has implemented the Basel III framework, and in some areas has gone further by introducing stricter requirements (APRA superequivalence). This report details MBL’s disclosures as required by APRA Prudential Standard 330: Public Disclosure (APS 330) as at 30 September 2016 together with the 31 March 2016 comparatives where appropriate.
This report also describes Macquarie’s risk management policies and risk management framework and the measures adopted to monitor and report within this framework. Detailed in this report are the major components of capital structure, the key risk exposures and the associated capital requirements. The key risk exposures are credit risk (including securitisation exposures, credit valuation adjustment, and exposures to central counterparties), market risk, and operational risk. Each of these risks are individually discussed in later sections of this report where the individual risk components, measurement techniques and management practices are detailed.
The current Macquarie Bank Group capital, liquidity coverage and leverage ratios and relevant comparatives are set out in the table below.
Capital, Liquidity and Leverage Ratios
As at 30 September
2016
As at 31 March
2016
Level 2 Macquarie Bank Group Common Equity Tier 1 capital ratio1 10.4% 10.7%
Level 2 Macquarie Bank Group Total Tier 1 capital ratio1 11.5% 11.8%
Level 2 Macquarie Bank Group Total capital ratio1 13.7% 14.1%
Level 2 Macquarie Bank Group Leverage ratio 5.6 % 5.5%
Level 2 Macquarie Bank Group Liquidity coverage ratio1,2,3 169% 173%
1 The Macquarie Bank Group capital and liquidity ratios are well above the regulatory minimum capital ratios required by APRA, and
the Board imposed internal minimum capital requirement. 2 For liquidity coverage ratio, Level 2 Macquarie Bank Group includes Special Purpose Vehicles (SPVs), which are deconsolidated for
Capital adequacy purposes. 3 The LCR at September 2016 is calculated as the simple average of the July, August and September month end LCR results.
1.0 Overview
3
1.0 Overview
1.1 Scope of Application
MBL, as an approved ADI, is required to comply with the disclosure requirements of APS 330 on a Level 2 basis, as described below.
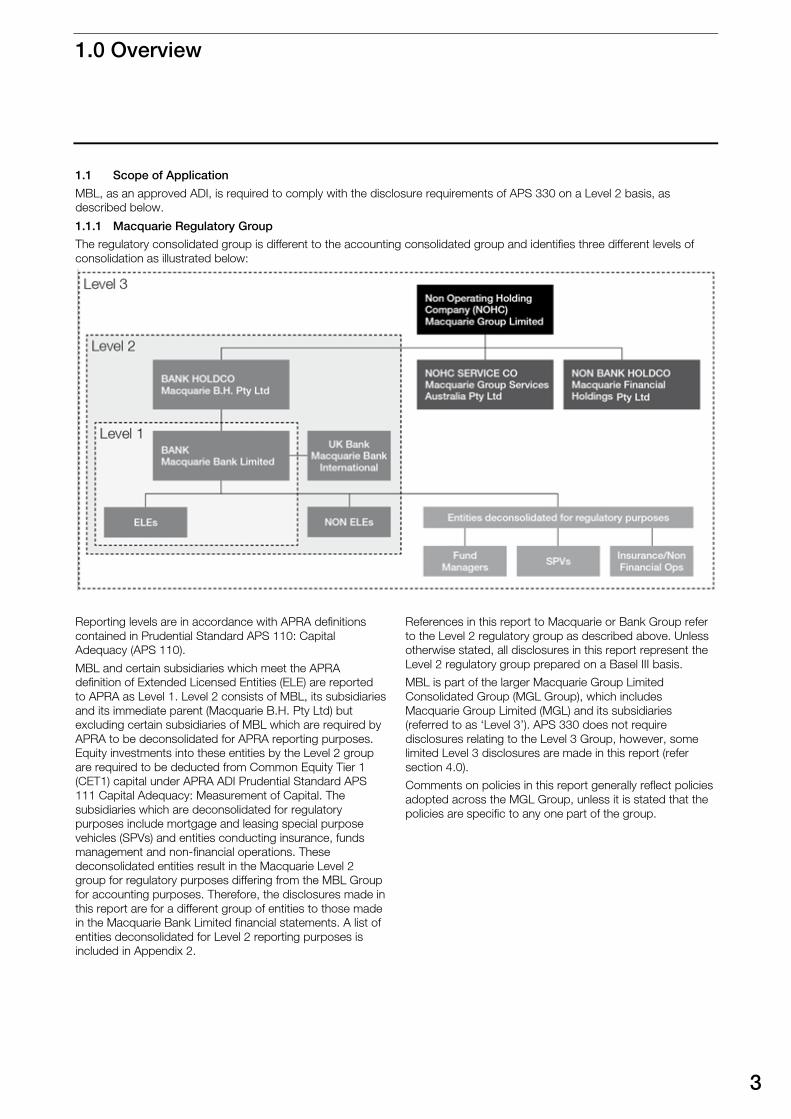
1.1.1 Macquarie Regulatory Group
The regulatory consolidated group is different to the accounting consolidated group and identifies three different levels of consolidation as illustrated below:
Reporting levels are in accordance with APRA definitions contained in Prudential Standard APS 110: Capital Adequacy (APS 110).
MBL and certain subsidiaries which meet the APRA definition of Extended Licensed Entities (ELE) are reported to APRA as Level 1. Level 2 consists of MBL, its subsidiaries and its immediate parent (Macquarie B.H. Pty Ltd) but excluding certain subsidiaries of MBL which are required by APRA to be deconsolidated for APRA reporting purposes. Equity investments into these entities by the Level 2 group are required to be deducted from Common Equity Tier 1 (CET1) capital under APRA ADI Prudential Standard APS 111 Capital Adequacy: Measurement of Capital. The subsidiaries which are deconsolidated for regulatory purposes include mortgage and leasing special purpose vehicles (SPVs) and entities conducting insurance, funds management and non-financial operations. These deconsolidated entities result in the Macquarie Level 2 group for regulatory purposes differing from the MBL Group for accounting purposes. Therefore, the disclosures made in this report are for a different group of entities to those made in the Macquarie Bank Limited financial statements. A list of entities deconsolidated for Level 2 reporting purposes is included in Appendix 2.
References in this report to Macquarie or Bank Group refer to the Level 2 regulatory group as described above. Unless otherwise stated, all disclosures in this report represent the Level 2 regulatory group prepared on a Basel III basis.
MBL is part of the larger Macquarie Group Limited Consolidated Group (MGL Group), which includes Macquarie Group Limited (MGL) and its subsidiaries (referred to as ‘Level 3’). APS 330 does not require disclosures relating to the Level 3 Group, however, some limited Level 3 disclosures are made in this report (refer section 4.0).
Comments on policies in this report generally reflect policies adopted across the MGL Group, unless it is stated that the policies are specific to any one part of the group.
Macquarie Bank Limited Pillar 3 Disclosures September 2016 macquarie.com
1.0 Overview continued
4
1.2 Frequency
The qualitative disclosures in this report are required to be updated on an annual basis and more frequently if significant changes to policies are made. This report has been updated as at 30 September 2016 and policies disclosed within are effective at this time. The capital adequacy and summarised credit risk exposure quantitative disclosures are published on a quarterly basis. All other quantitative disclosures are published semi-annually in conjunction with Macquarie’s half year (30 September) and annual (31 March) reporting cycles.
1.3 Report Conventions
The disclosures in this report are not required to be audited by an external auditor. However, the disclosures have been prepared on a basis consistent with information submitted to APRA. Under the revised APS 310 Audit and Related Matters, the information submitted to APRA is required to be either audited or reviewed by an external auditor at Macquarie’s year end, being 31 March.
Averages have been prepared in this report for certain disclosures as required by APS 330.
All numbers in this report are in Australian Dollars and have been rounded to the nearest million, unless otherwise stated.
Where necessary comparative information has been restated to conform with changes in presentation in the current period.
The Appendices include a Glossary of Terms used throughout this document.
1.4 Overview of the Basel III Regulatory Capital Framework
Basel III is designed to raise the resilience of the banking sector by strengthening the regulatory capital framework, building on the three pillars of the Basel II framework. The framework seeks to increase the sensitivity to risk in the capital calculations and to ensure that this is aligned with an ADI’s internal processes for assessing risk. Consequently, there are a number of different approaches to risk calculation that allows use of internal models to calculate regulatory capital. A bank may be accredited to use the advanced approaches when it can demonstrate the integrity and sophistication of its risk management framework. It must also ensure that its internal estimates of risk are fully integrated into corporate governance functions as well as internal calculations of capital. Further to this, the most advanced approaches are available if a bank has sufficient depth and history of default data to enable it to generate its own Probability of Default (PD) estimates based on its own loss experience.
The requirements of Basel III are contained within three broad sections or ‘Pillars’.
1.4.1 Pillar 1
The first section of the Basel III framework covers the rules by which Risk Weighted Assets (RWA) and capital adequacy must be calculated.
Macquarie has been approved by APRA to apply the FIRB approach for credit risk capital calculation. This approach utilises the PD and internal rating assigned to the obligor. The exposure is weighted using this internal PD and a Loss Given Default (LGD) value set by APRA. Credit Conversion Factors are applied to off balance sheet exposures based on the nature of the exposure.
Operational risk is calculated using the AMA.
Market risk and interest rate risk in the banking book is calculated using the internal model approach.
1.4.2 Pillar 2
Pillar 2 (the Supervisory Review Process) of the Basel III framework requires ADIs to make their own assessments of capital adequacy in light of their risk profile and to have a strategy in place for maintaining their capital levels. Macquarie’s Internal Capital Adequacy Assessment Process (ICAAP) addresses its requirements under Pillar 2.
The ICAAP is part of Macquarie’s overall risk management framework; its key features include:
– Comprehensive risk assessment process; – Internal assessment of capital adequacy using
Macquarie’s economic capital model (refer section 4.1); – Risk appetite setting (refer section 4.2); – Capital management plans designed to ensure the
appropriate level and mix of capital given Macquarie’s risk profile; and
– Regular reporting of capital adequacy and monitoring of risk profile against risk appetite.
Macquarie’s ICAAP is subject to Board and senior management oversight and internal control review.
1.4.3 Pillar 3
These disclosures have been formulated in response to the requirements of Pillar 3 of the Basel III Framework. APRA has laid down the minimum standards for market disclosure in its APS 330.
This report includes a breakdown of both on and off-balance sheet exposures, and RWA. The report consists of sections covering:
– Risk Management Governance and Framework – Capital Management – Credit Risk Measurement – Securitisation – Credit Valuation Adjustment – Exposures to Central Counterparties – Market Risk – Equity Risk – Operational Risk – Leverage ratio, and – Liquidity coverage ratio
2.0 Risk Management Governance and Framework
5
2.1 Risk Governance at Macquarie
The primary role of the Board is to promote Macquarie’s long-term health and prosperity. Macquarie's robust risk management framework supports the Board in its role and the oversight of the framework is a key priority.
Macquarie recognises that a sound risk culture is a fundamental requirement of an effective risk management framework. The long-held foundations of Macquarie’s risk culture are the principles of What We Stand For – Opportunity, Accountability and Integrity. Staff are made aware that these principles are expected to form the basis of all day-to-day behaviours and actions.
Board Committees, Management Committees and ultimately individuals support the Board in its oversight; for further detail refer to Macquarie’s Corporate Governance Statement available at macquarie.com/leadership-corporate-governance
2.2 Macquarie’s Risk Management Framework Macquarie’s risk management framework consists of its systems, structures, policies and processes. Under the framework staff are responsible for identifying, measuring, evaluating, monitoring, reporting and managing material risks.
The acceptance of risk is an integral part of Macquarie’s business. The main risks faced by Macquarie are credit, market, equity, operational, liquidity, conduct, regulatory, compliance, reputation, legal, tax and insurance risks.
Strong independent prudential management has been a key to Macquarie’s success and stability over many years. The assumption of risk is made within a calculated and controlled framework that assigns clear risk roles and responsibilities represented by ‘three lines of defence’.
The first line of defence is at the business level, where primary responsibility for risk management lies. Part of the role of all business managers throughout Macquarie is to ensure they manage risks appropriately. The risk management function forms the second line of defence and independently assesses all material risks. The third line, which includes Internal Audit, independently reviews and challenges the Group’s risk management controls, processes and systems.
Macquarie Bank Limited Pillar 3 Disclosures September 2016 macquarie.com
2.0 Risk Management Governance and Framework continued
6
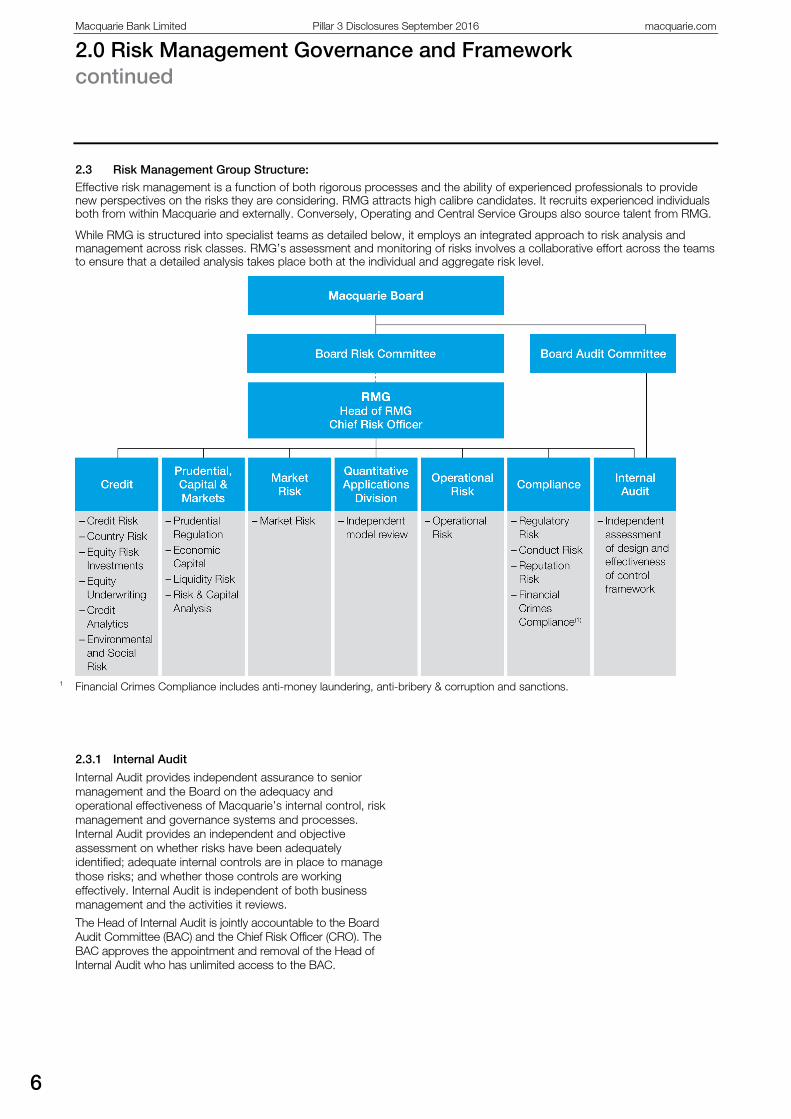
2.3 Risk Management Group Structure:
Effective risk management is a function of both rigorous processes and the ability of experienced professionals to provide new perspectives on the risks they are considering. RMG attracts high calibre candidates. It recruits experienced individuals both from within Macquarie and externally. Conversely, Operating and Central Service Groups also source talent from RMG.
While RMG is structured into specialist teams as detailed below, it employs an integrated approach to risk analysis and management across risk classes. RMG’s assessment and monitoring of risks involves a collaborative effort across the teams to ensure that a detailed analysis takes place both at the individual and aggregate risk level.
1 Financial Crimes Compliance includes anti-money laundering, anti-bribery & corruption and sanctions.
2.3.1 Internal Audit
Internal Audit provides independent assurance to senior management and the Board on the adequacy and operational effectiveness of Macquarie’s internal control, risk management and governance systems and processes. Internal Audit provides an independent and objective assessment on whether risks have been adequately identified; adequate internal controls are in place to manage those risks; and whether those controls are working effectively. Internal Audit is independent of both business management and the activities it reviews.
The Head of Internal Audit is jointly accountable to the Board Audit Committee (BAC) and the Chief Risk Officer (CRO). The BAC approves the appointment and removal of the Head of Internal Audit who has unlimited access to the BAC.
3.0 Capital Structure
7
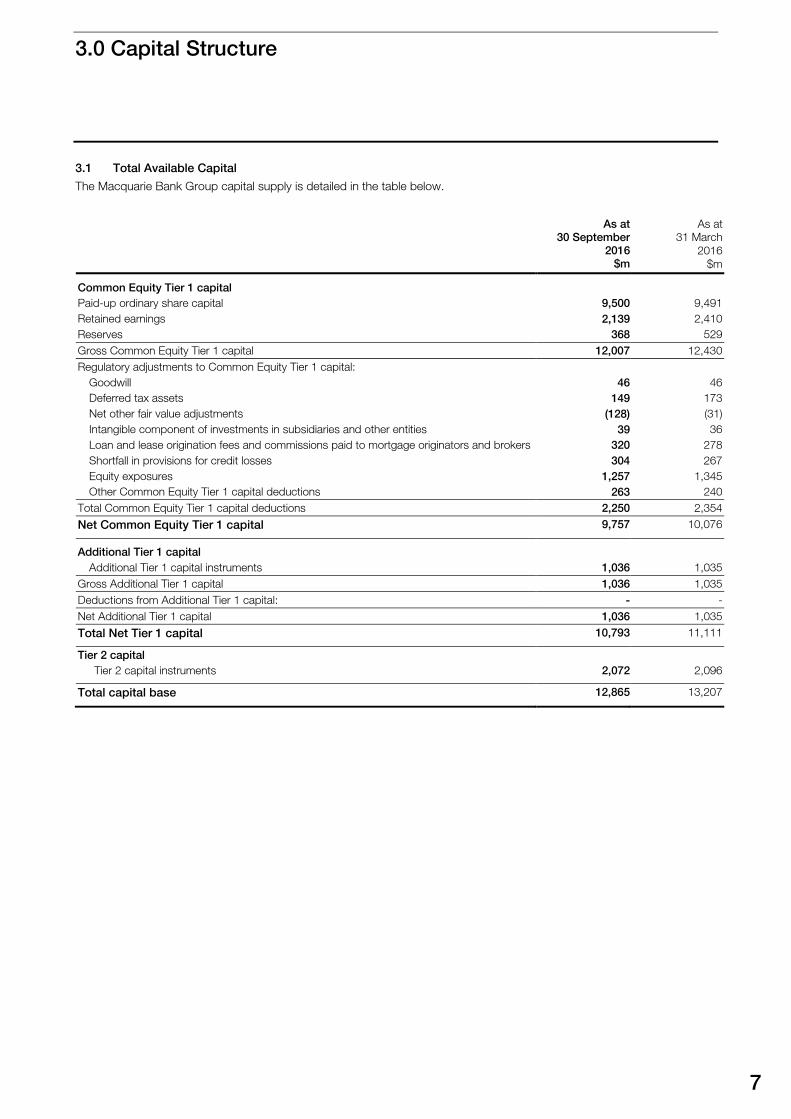
3.1 Total Available Capital
The Macquarie Bank Group capital supply is detailed in the table below.
As at 30 September
2016 $m
As at 31 March
2016 $m
Common Equity Tier 1 capital Paid-up ordinary share capital 9,500 9,491 Retained earnings 2,139 2,410 Reserves 368 529 Gross Common Equity Tier 1 capital 12,007 12,430 Regulatory adjustments to Common Equity Tier 1 capital:
Goodwill 46 46 Deferred tax assets 149 173 Net other fair value adjustments (128) (31) Intangible component of investments in subsidiaries and other entities 39 36 Loan and lease origination fees and commissions paid to mortgage originators and brokers 320 278 Shortfall in provisions for credit losses 304 267 Equity exposures 1,257 1,345 Other Common Equity Tier 1 capital deductions 263 240
Total Common Equity Tier 1 capital deductions 2,250 2,354
Net Common Equity Tier 1 capital 9,757 10,076
Additional Tier 1 capital Additional Tier 1 capital instruments 1,036 1,035
Gross Additional Tier 1 capital 1,036 1,035 Deductions from Additional Tier 1 capital: - - Net Additional Tier 1 capital 1,036 1,035
Total Net Tier 1 capital 10,793 11,111
Tier 2 capital Tier 2 capital instruments 2,072 2,096
Total capital base 12,865 13,207
Macquarie Bank Limited Pillar 3 Disclosures September 2016 macquarie.com
3.0 Capital Structure continued
8
3.2 Common Equity Tier 1 Capital
Common Equity Tier 1 capital is defined in paragraphs 18 to 26 of APS 111. Additional Tier 1 capital is defined in paragraphs 27 to 29 of APS111.
Macquarie’s Common Equity Tier 1 capital consists of ordinary share capital, retained earnings, and certain reserves. The main component of reserves included in Common Equity Tier 1 capital is the foreign currency translation reserve.
Macquarie’s additional Tier 1 capital, consists of Macquarie Income Securities (MIS), Bank Capital Notes (BCN) and Exchangeable Capital Securities (ECS). Macquarie Income Preferred Securities (MIPS) were fully redeemed by Macquarie Bank Group on 22 June 2015.
MIS are a perpetual instrument with no conversion rights. MIS were listed for trading on the Australian Stock Exchange (now known as the Australian Securities Exchange) in 1999. MIS distributions are paid quarterly at a floating rate of BBSW plus 1.7% per annum and payment is subject to certain conditions including profitability of the Bank. MIS are included under the Basel III transitional rules. The Basel III transitional rules allows recognition of all transitional Additional Tier 1 capital instruments at reporting date up to a threshold* under APS111.
*The transitional AT1 instrument threshold is calculated based on the base value and is amortised by 10% at 1 Jan each year starting from 1 January 2013. The base value is the balance of all transitional AT1 instruments as at 1 January 2013.
ECS were issued by MBL acting through its London Branch (Issuer), in March 2012 and are quoted on the Singapore Stock Exchange. Subject to certain conditions, the ECS will be exchanged for a variable number of fully paid MGL ordinary shares on 20 June 2017 (or earlier in certain circumstances). The ECS pay interest of 10.25% per annum, paid semi-annually, with the rate to be reset on 20 June 2017 (and each fifth anniversary thereafter) if the ECS remain outstanding after this time. The interest payments are subject to payment tests, including the discretion of the Issuer. APRA has confirmed that the ECS will be 100% eligible hybrid capital until its first call date on 20 June 2017.
BCN were issued by MBL in October 2014 and are quoted on the Australian Stock Exchange. These instruments are non-cumulative and unsecured and may be redeemed at face value on 24 March 2020, 24 September 2020 and 24 March 2021 (subject to certain conditions being satisfied) or earlier in specified circumstances. The BCN pay discretionary, semi-annual floating rate cash distributions equal to 6 month BBSW plus 330bps margin, adjusting for franking credits, paid semi annually.
3.3 Tier 2 Capital
Tier 2 capital is defined in paragraphs 30 to 33 of APS 111.
Macquarie’s Tier 2 capital consists of a portion of certain credit loss reserves plus subordinated debt instruments. A portion of subordinated debt is included under Basel III transitional rules which require the value recognised to amortise by 10% each year until no part of the instruments are included after 10 years.
MBL has issued cumulative convertible subordinated debt amounting to US$750m in June 2015 which is Basel III compliant and not subject to the transitional rules referred to above. This is reported at the value of liability at the period end date.
3.4 Restrictions on capital
Various restrictions or costs exist on the transfer of capital within the Macquarie accounting consolidated Group. For example:
– Licensed entities such as Australian Financial Services Licensed (AFSL) entities are required to maintain minimum capital requirements to comply with their licence. Macquarie seeks to maintain a sufficient level of capital within these entities to ensure compliance with these regulations;
– Where retained earnings are transferred from related entities, tax costs may be payable on repatriation which may reduce the actual amount of available capital;
– As an ADI, Macquarie is subject to the prudential limits imposed by APS 222 Associations with Related Entities;
– RMG also manage and monitor internal limits on exposures to related entities which, combined with APRA’s prudential limits, seeks to minimise contagion risk.
4.0 Capital Adequacy
9
4.1 Capital Management
Macquarie’s capital management strategy is to maximise shareholder value through optimising the level and use of capital resources, whilst also providing the flexibility to take advantage of opportunities as they may arise.
The capital management objectives are to:
– continue to support Macquarie’s credit rating; – ensure sufficient capital resources to support
Macquarie’s business and operational requirements; – maintain sufficient capital to exceed externally imposed
capital requirements; and – safeguard Macquarie’s ability to continue as a
going concern.
Macquarie has developed an economic capital model that is used to quantify MGL’s aggregate level of risk. The economic capital framework complements the management of specific risk types such as equity, credit, market and operational risk by providing an aggregate view of MGL’s risk profile.
The economic capital model is used to support business decision-making and has three main applications:
– capital adequacy assessment; – risk appetite setting; and – risk-adjusted performance measurement.
Capital adequacy is assessed for both MGL and the Bank Group. In each case, capital adequacy is assessed on a regulatory basis and on an economic basis, with capital requirements assessed as follows:
Economic capital adequacy means an internal assessment of capital adequacy, designed to ensure Macquarie has sufficient capital to absorb potential losses and provide creditors with the required degree of protection.
Potential losses are quantified using the Economic Capital Adequacy Model (ECAM). These potential losses are compared to the capital resources available to absorb loss, consisting of book equity and eligible hybrid equity. Earnings are also available to absorb losses, however, only a fraction of potential earnings is recognised as a buffer against losses.
APRA has approved Macquarie’s ECAM for use in calculating the regulatory capital requirement of the Non-Bank Group. The ECAM is based on similar principles and models as the Basel III regulatory capital framework for banks, as shown in the table which appears on the following page with both calculating capital at a one year, 99.9% confidence level. This 99.9% confidence level is broadly consistent with the acceptable probability of default implied by Macquarie’s credit ratings.
Entity Economic Regulatory
MBL Internal model, covering exposures of the Bank Group
Capital to cover RWA and regulatory deductions, according to APRA’s Bank prudential standards
MGL Internal model, covering all exposures of the Group
Bank regulatory capital requirement plus economic capital requirement of the Non-Bank Group
Macquarie Bank Limited Pillar 3 Disclosures September 2016 macquarie.com
4.0 Capital Adequacy continued
10
Risk Basel III ECAM
Credit Capital requirement determined by Basel III formula, with some parameters specified by the regulator (e.g. LGD)
Capital requirement determined by Basel III formula, with internal estimates of key parameters
Equity Deduction from Common Equity Tier 1 Extension of Basel III credit model to cover equity exposures. Capital requirement between 36% and 82% of face value; average 49%
Market 3 times 10 day 99% Value at Risk (VaR) plus 3 times 10 day 99% Stressed Value at Risk (SVaR), plus a specific risk charge
Scenario-based approach
Operational Basel III Advanced Measurement Approach Basel III Advanced Measurement Approach
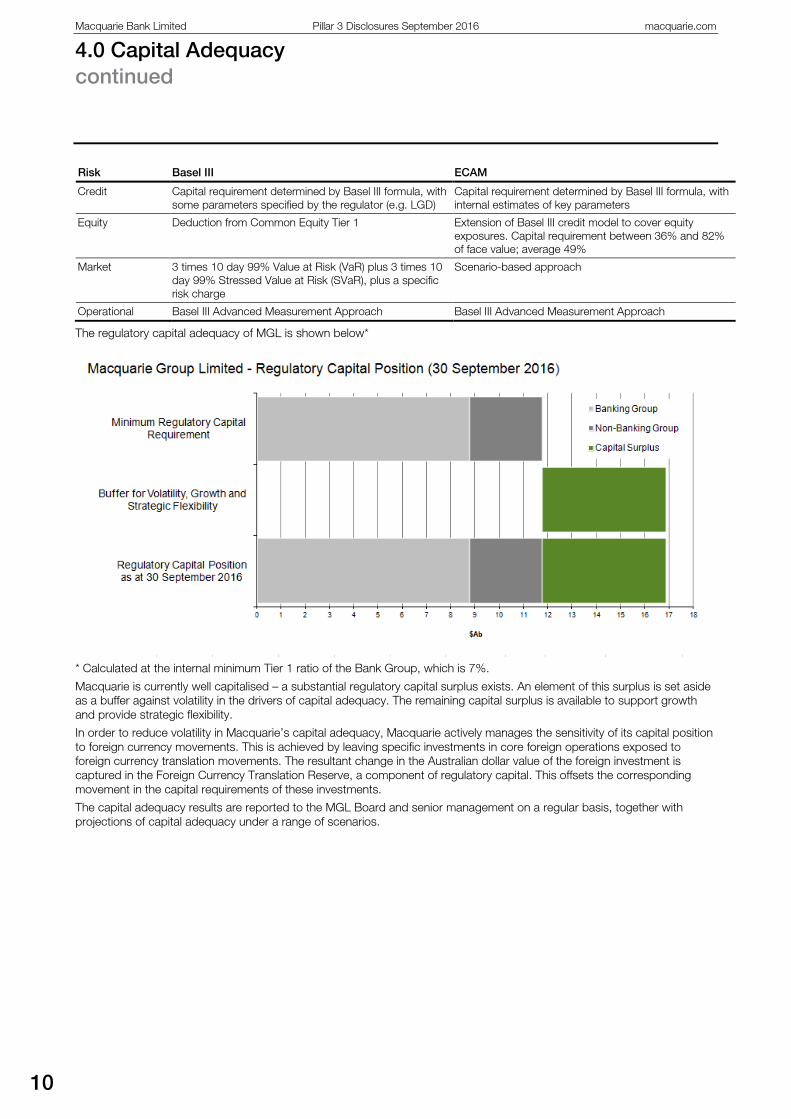
The regulatory capital adequacy of MGL is shown below*
* Calculated at the internal minimum Tier 1 ratio of the Bank Group, which is 7%.
Macquarie is currently well capitalised – a substantial regulatory capital surplus exists. An element of this surplus is set aside as a buffer against volatility in the drivers of capital adequacy. The remaining capital surplus is available to support growth and provide strategic flexibility.
In order to reduce volatility in Macquarie’s capital adequacy, Macquarie actively manages the sensitivity of its capital position to foreign currency movements. This is achieved by leaving specific investments in core foreign operations exposed to foreign currency translation movements. The resultant change in the Australian dollar value of the foreign investment is captured in the Foreign Currency Translation Reserve, a component of regulatory capital. This offsets the corresponding movement in the capital requirements of these investments.
The capital adequacy results are reported to the MGL Board and senior management on a regular basis, together with projections of capital adequacy under a range of scenarios.
11
4.2 Risk Appetite Setting
The Board reviews and endorses Macquarie's risk appetite as part of the annual corporate strategy review process. Risk appetite is the nature and amount of risk the Group is willing to accept as outlined in the Board-approved Risk Appetite Statement (RAS). The RAS sets out the degree of risk Macquarie is willing to take overall and for each material risk type. It also conveys the process for ensuring that risk limits (tolerances) are set at an appropriate level, monitored and reviewed.
The principles of the RAS are implemented primarily through the following four mechanisms:
4.2.1 New product and business approval process
All new businesses and significant changes to existing products or processes are subject to a rigorous and interactive approval process that adheres to the principles stated in the RAS. This results in constructive dialogue on risk matters between RMG and the relevant business.
This formal process is designed so that the proposed transaction or operation can be managed properly and does not create unknown or unwanted risks for Macquarie. All relevant risks (e.g. conduct, regulatory, compliance, reputation, credit, market, equity, operational, liquidity, legal, tax and insurance) are reviewed to ensure they are identified and addressed prior to implementation. These risks are also monitored on an ongoing basis. The approvals of RMG, Finance Division, Taxation Division, Legal and Governance and other relevant stakeholders within Macquarie are obtained. RMG also checks that all necessary internal approvals are obtained prior to commencement.
For all material transactions, independent input from RMG on the risk and return of the transaction is included in the approval document submitted to Senior Management.
The Operational Risk function within RMG oversees the New Product and Business Approval process.
RMG Internal Audit performs an audit of the operations of any significant new businesses based on an assessment of the associated risk faced by Macquarie. The audit typically takes place within six to twelve months of an acquisition or launch and includes confirmation that operations are in line with the new product approval document.
4.2.2 Limits
In many cases, limits translate risk appetite principles into hard constraints on individual businesses.
These consist of specific risk limits given to various businesses and products or industry sectors as well as the Global Risk Limit that constrains Macquarie’s aggregate level of risk.
Macquarie sets the Global Risk Limit with reference not only to capital but also to earnings so that in a prolonged, severe downturn Macquarie’s earnings and surplus capital cover losses and market confidence in Macquarie is maintained.
Under Macquarie’s ‘no limits, no dealing’ approach, individual credit and equity exposures must fit within approved counterparty limits. Market risk exposures are also governed by a suite of individual and portfolio limits.
These granular limits are set to allow businesses to achieve their near-term plans while promoting a reassessment of the opportunity and associated risks as the limit is approached.
4.2.3 Relevant policies
Policies expand on the principles found in the RAS and often translate them into operational requirements for individuals and business activities.
Formalising practices and principles into policies assists in providing a framework for the consistent management of risks. It also promotes sharing of experience and expertise gained from managing risks in various business activities.
4.2.4 Communication and training
The RAS is accessible to all staff and is referred to in the Code of conduct. In addition, the principles in the RAS are communicated to relevant staff through formal and informal training programs. These include regular communication of policies to key staff, training programs for specific policies and mandatory Director-level staff training on the risk management framework.
The Risk Appetite Test – An aggregate stress test
The key tool that the Board uses to quantify aggregate risk appetite is the Risk Appetite Test. This is a Macquarie-wide stress test that considers losses and earnings under a severe economic downturn scenario with the aim of Macquarie emerging from that scenario with sufficient capital to continue operating.
The Risk Appetite Test asserts that potential losses must be less than the Global Risk Limit, which comprises underlying earnings that Macquarie can achieve in a three-year downturn (downturn forward earnings capacity) plus surplus regulatory capital. Consideration is also given to the year-by-year outcome of the modelled downturn scenario to ensure that market confidence is maintained.
Operating Groups and Divisions estimate downturn forward earnings capacity under a three-year downturn scenario provided to them by RMG. RMG reviews the estimates for consistency with scenario assumptions and across groups.
Aggregate risk breaks down into two categories:
– business risk, meaning decline in earnings through deterioration in volumes and margins due to market conditions; and
– potential losses, including potential credit losses, write-downs of equity investments, operational risk losses and losses on trading positions.
Business risk is captured by the difference in base case and downturn forward earnings estimates. Potential losses are quantified using stress testing models, which translate scenario parameters (GDP, unemployment, interest rates etc) into loss and transition rates. A principal use of the Risk Appetite Test is in setting the Equity Risk Limit (ERL). This limit constrains Macquarie’s aggregate level of risk arising from principal equity positions, managed fund holdings, property equity investments, lease residuals and other equity investments. Any changes to the ERL are sized to ensure that even under full use of this limit and allowing for growth in other risk types, the requirements of the Risk Appetite Test will be met.
Macquarie Bank Limited Pillar 3 Disclosures September 2016 macquarie.com
4.0 Capital Adequacy continued
12
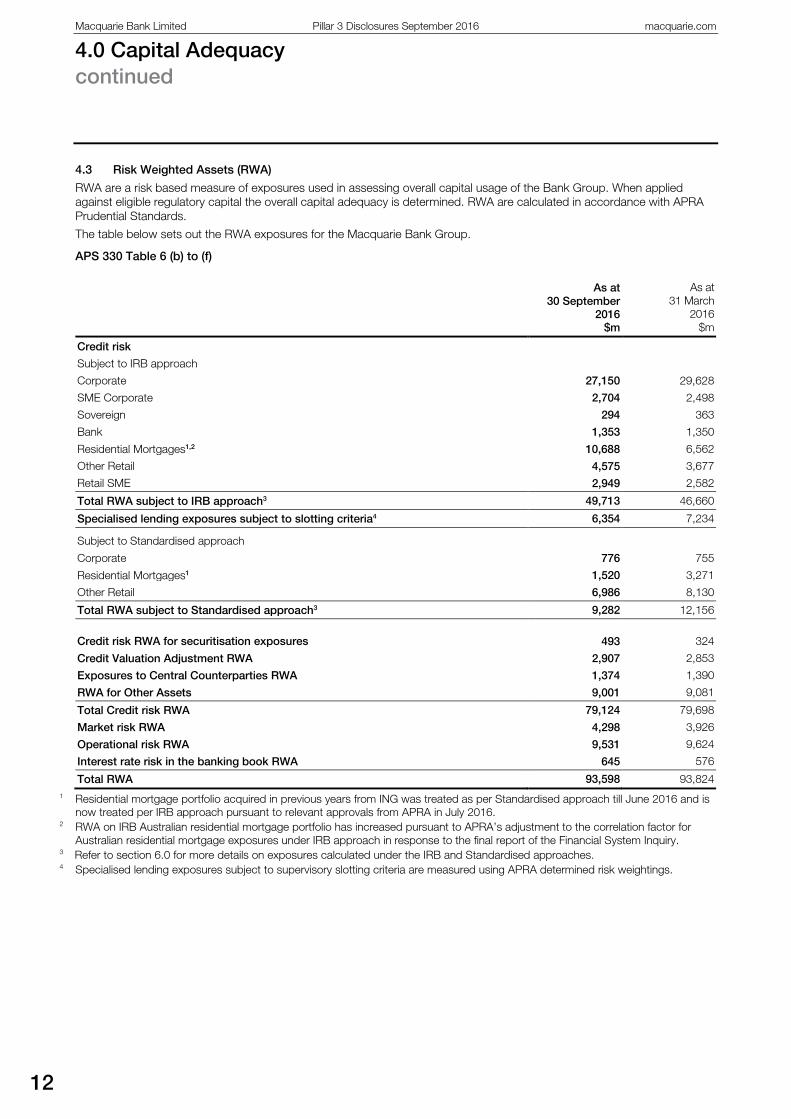
4.3 Risk Weighted Assets (RWA)
RWA are a risk based measure of exposures used in assessing overall capital usage of the Bank Group. When applied against eligible regulatory capital the overall capital adequacy is determined. RWA are calculated in accordance with APRA Prudential Standards.
The table below sets out the RWA exposures for the Macquarie Bank Group.
APS 330 Table 6 (b) to (f)
As at
30 September 2016
$m
As at 31 March
2016 $m
Credit risk
Subject to IRB approach
Corporate 27,150 29,628
SME Corporate 2,704 2,498
Sovereign 294 363
Bank 1,353 1,350
Residential Mortgages1,2 10,688 6,562
Other Retail 4,575 3,677
Retail SME 2,949 2,582
Total RWA subject to IRB approach3 49,713 46,660
Specialised lending exposures subject to slotting criteria4 6,354 7,234
Subject to Standardised approach
Corporate 776 755
Residential Mortgages1 1,520 3,271
Other Retail 6,986 8,130
Total RWA subject to Standardised approach3 9,282 12,156
Credit risk RWA for securitisation exposures 493
324
Credit Valuation Adjustment RWA 2,907 2,853
Exposures to Central Counterparties RWA 1,374 1,390
RWA for Other Assets 9,001 9,081
Total Credit risk RWA 79,124 79,698
Market risk RWA 4,298 3,926
Operational risk RWA 9,531 9,624
Interest rate risk in the banking book RWA 645 576
Total RWA 93,598 93,824 1 Residential mortgage portfolio acquired in previous years from ING was treated as per Standardised approach till June 2016 and is
now treated per IRB approach pursuant to relevant approvals from APRA in July 2016. 2 RWA on IRB Australian residential mortgage portfolio has increased pursuant to APRA’s adjustment to the correlation factor for
Australian residential mortgage exposures under IRB approach in response to the final report of the Financial System Inquiry. 3 Refer to section 6.0 for more details on exposures calculated under the IRB and Standardised approaches. 4 Specialised lending exposures subject to supervisory slotting criteria are measured using APRA determined risk weightings.
13
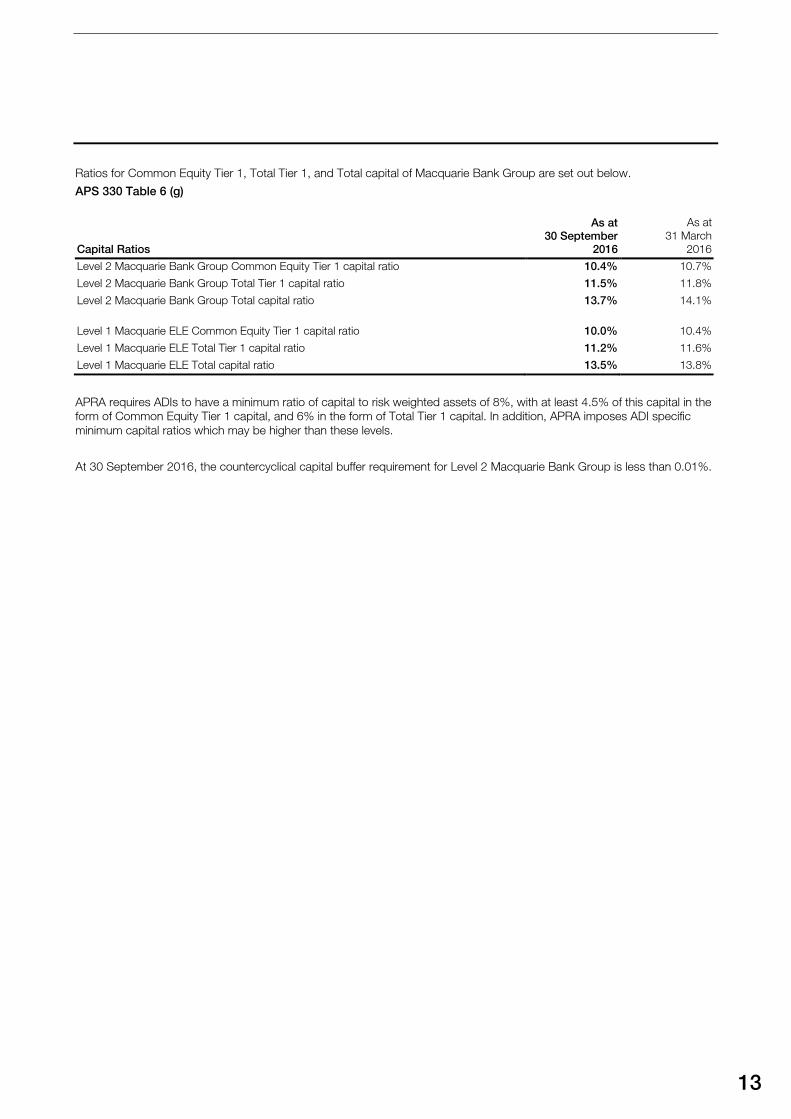
Ratios for Common Equity Tier 1, Total Tier 1, and Total capital of Macquarie Bank Group are set out below.
APS 330 Table 6 (g)
Capital Ratios
As at
30 September 2016
As at 31 March
2016
Level 2 Macquarie Bank Group Common Equity Tier 1 capital ratio 10.4% 10.7%
Level 2 Macquarie Bank Group Total Tier 1 capital ratio 11.5% 11.8%
Level 2 Macquarie Bank Group Total capital ratio 13.7% 14.1%
Level 1 Macquarie ELE Common Equity Tier 1 capital ratio
10.0%
10.4%
Level 1 Macquarie ELE Total Tier 1 capital ratio 11.2% 11.6%
Level 1 Macquarie ELE Total capital ratio 13.5% 13.8%
APRA requires ADIs to have a minimum ratio of capital to risk weighted assets of 8%, with at least 4.5% of this capital in the form of Common Equity Tier 1 capital, and 6% in the form of Total Tier 1 capital. In addition, APRA imposes ADI specific minimum capital ratios which may be higher than these levels.
At 30 September 2016, the countercyclical capital buffer requirement for Level 2 Macquarie Bank Group is less than 0.01%.
Macquarie Bank Limited Pillar 3 Disclosures September 2016 macquarie.com
5.0 Credit Risk Measurement
14
5.1 Credit Risk Overview
Credit risk is defined as the risk of a counterparty failing to complete its contractual obligations when they fall due. The consequent loss is either the amount of the loan not repaid, or the loss incurred in replicating a trading contract with a new counterparty.
RMG Credit maintains a comprehensive and robust framework for the identification, analysis and monitoring of credit risks arising in each business. Key aspects of this framework are detailed below.
5.2 Credit Risk Management
Macquarie’s philosophy on credit risk management reflects the principle of separating prudential control from operational management. The responsibility for approval of credit limits is delegated to specific individuals.
Credit risk approvals reflect two principles:
– a requirement for dual sign-off; and – a requirement that, above specified limits, all credit
exposures must be approved outside the business line proposing to undertake them.
5.2.1 Analysis and Approval of Exposures
The MGL and MBL Boards are responsible for establishing the framework for approving credit exposures. The Boards delegate discretions to approve credit exposure to designated individuals within the Group whose capacity to prudently exercise authority has been assessed.
Operating groups are assigned modest levels of credit discretions. Credit exposures above these levels are assessed independently by RMG and approved by senior RMG staff, the CEO and the Boards as required.
Macquarie enforces a strict ‘no limit, no dealing’ rule. All proposed transactions are analysed and approved by designated individuals before they can proceed.
All wholesale credit exposures are reviewed at least once a year, or more frequently if required. Retail credit exposures are monitored on a portfolio basis.
5.2.2 Macquarie Ratings
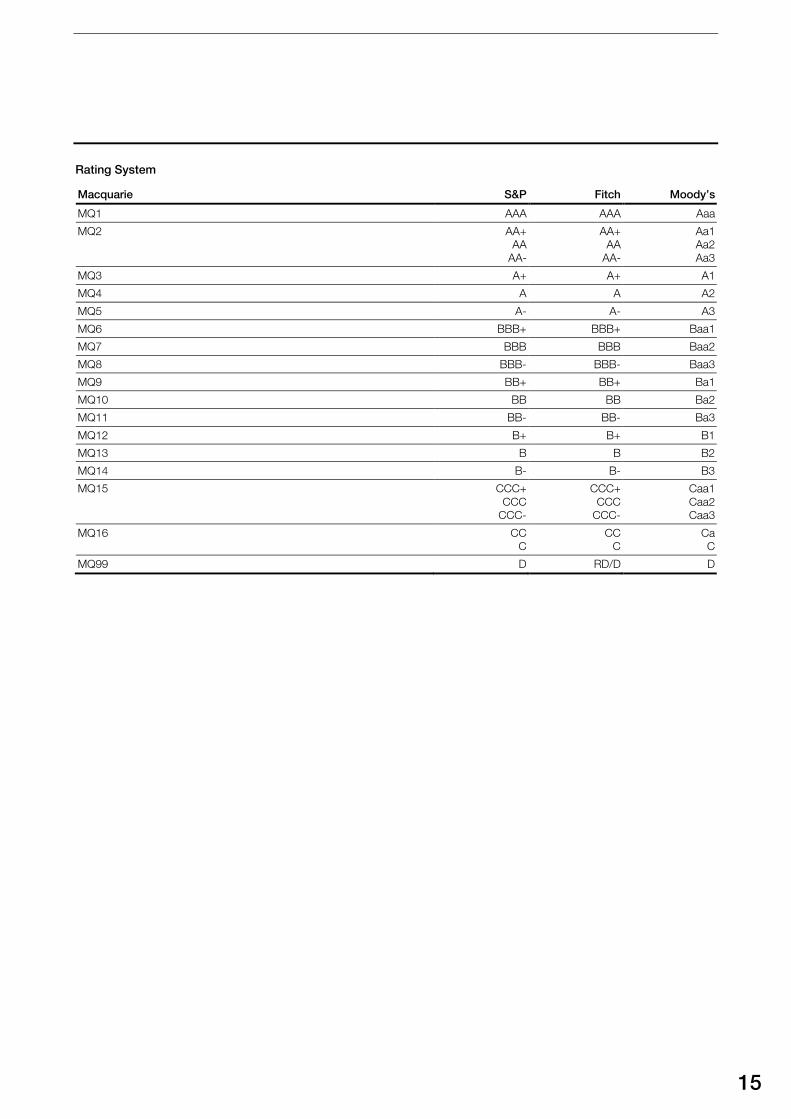
All corporate, sovereign and bank counterparties (wholesale) customer limits and exposures are allocated a Macquarie Group rating (MQ rating) which broadly correspond with Standard and Poor’s (S&P), Fitch and Moody’s Investor Services credit ratings. Each MQ rating has been assigned a PD derived from Standard and Poor’s or Moody’s long term average one year default rates for similarly rated obligors. A LGD percentage is additionally assigned to each limit and exposure, reflecting the economic loss estimated to result if default occurs, taking into account the security supporting the credit exposure.
Ratings provided by External Credit Assessment Institutions (ECAI) are considered throughout the rating process but are supplementary to the internal rating process.
The table below outlines the internal MQ Ratings relative to ECAI ratings.
MQ ratings are used to:
– assess the default risk of credit exposures for management reporting, credit approval of limits, risk attribution and regulatory purposes;
– assist in credit decisions by providing guidelines and tools that promote a more consistent analytical approach;
– assist in the process of sharing credit knowledge (including knowledge of specialised and unique companies, industries and products); and
– provide a basis for disclosing and reporting to investors and the market.
Each MQ rating band is associated with an estimate of the PD by the counterparty on its financial obligations and provides a consistent measure across the Bank Group. Applicable at either the borrower or transaction level, a rating must be justified and set as part of the credit approval and review process.
The ratings process combines a quantitative analysis by way of scoring industry specific risk factors and a qualitative assessment based on expert judgement.
15
Rating System
Macquarie S&P Fitch Moody’s
MQ1 AAA AAA Aaa
MQ2 AA+ AA
AA-
AA+ AA
AA-
Aa1 Aa2 Aa3
MQ3 A+ A+ A1
MQ4 A A A2
MQ5 A- A- A3
MQ6 BBB+ BBB+ Baa1
MQ7 BBB BBB Baa2
MQ8 BBB- BBB- Baa3
MQ9 BB+ BB+ Ba1
MQ10 BB BB Ba2
MQ11 BB- BB- Ba3
MQ12 B+ B+ B1
MQ13 B B B2
MQ14 B- B- B3
MQ15 CCC+ CCC
CCC-
CCC+ CCC
CCC-
Caa1 Caa2 Caa3
MQ16 CC C
CC C
Ca C
MQ99 D RD/D D
Macquarie Bank Limited Pillar 3 Disclosures September 2016 macquarie.com
5.0 Credit Risk Measurement continued
16
For wholesale counterparties, Macquarie utilises a number of industry templates and a sovereign template to assess the appropriate MQ ratings. These industry templates are designed to ensure that Macquarie ratings take into account the different risk factors that affect different industries. Analysts are required to input a range of quantitative and qualitative factors and then consider the MQ rating output. At the same time as considering the appropriate MQ rating, analysts are also required to consider the appropriate LGD. For economic capital purposes, LGDs are stressed estimates, taking into account the security, jurisdiction, seniority and quality of the balance sheet. For regulatory capital, MBL uses the APRA supervisory estimates for LGDs.
For retail counterparties, PDs and LGDs are assigned to retail pools. Retail exposures are allocated to pools, such that each pool has homogenous risk. PDs and LGDs are calculated using the following methods:
– PDs: calculate the long-run average default rate from the internal and external default data available for each pool. When internal data is not available in sufficient quantity, external data is used but only in the case where it is relevant to the pool.
– LGDs: consider a downturn scenario and the loss that would be incurred for this scenario on defaulted loans in each pool.
Macquarie applies a standard definition of default, which is that an item is considered defaulted when it is either (i) 90 days past due or; (ii) unlikely to pay. ‘Unlikely to pay’ is defined in Macquarie policies based on APRA standards.
All templates and models are validated annually by RMG Credit with oversight from the Capital Models Review Committee. The following annual validation activities are undertaken:
– validation of wholesale ratings templates; – validation of wholesale PD estimates; – validation of wholesale LGD estimates; – wholesale ratings migration analysis; – validation of retail PDs; – validation of retail LGDs; and – approval of any changes to credit risk models.
Macquarie has developed system functionality to support the allocation of internal ratings. This application ensures that all supporting factors and weightings are stored together with the system-generated rating. Approvers have access to all of these details through the credit approval process. Details are also maintained of any rating override which must be accompanied by specific commentary from the credit analyst and which is subject to regular review.
Macquarie considers that ratings are an integral part of determining the creditworthiness of the obligor. However, Macquarie does not believe that model and template output should replace thorough and thoughtful analysis. In addition to the system details, credit analysts must also provide specific justification of the internal rating as part of their overall credit analysis of each counterparty. Credit approvers consider and approve the internal rating for the counterparty in relation to the size and tenor of their proposed credit limits.
All proposals for significant deals, products and businesses must contain an analysis of risk-adjusted returns, based on the ECAM which for credit exposures is a function of the assessed credit rating (together with other factors such as maturity and estimates of LGD). In assessing these proposals, the Executive Committee and Board consider these returns together with other relevant factors. They therefore form an important element in ensuring the visibility and impact of the MQ rating to the overall risk acceptance decision.
Risk-adjusted performance metrics for each business unit are prepared on a regular basis and distributed to senior management and the Board as well as to business units. These performance metrics are also based on calculations of Economic Capital usage and are a significant factor when allocations of performance-based remuneration are determined for each business.
5.2.3 Measuring and Monitoring Exposures
Credit exposures are calculated differently according to the nature of the obligation. Loan assets are reported at full face value whereas derivative contracts are measured according to both internal and regulatory measures of Counterparty Credit Exposure. Exposures are assessed in the context of the replacement cost of the contract should the counterparty default prior to the maturity of the trade.
Derivative revaluation based measures are calculated using valuation models which are consistent with those used for determining mark to market values for financial reporting purposes and are reported daily to RMG Credit.
17
For regulatory purposes, CEA (Credit Equivalent Amount) is calculated according to the methodology outlined in the APRA ADI Prudential Standards (APS) which combines the positive mark-to-market value (Current Credit Exposure) with a percentage of the face value based on the type of contract and the contractual maturity (Potential Credit Exposure). CEA exposures are used in daily calculations of large exposures in accordance with APS 221 Large Exposures.
The internal measure of counterparty credit exposure is calculated as a function of market movements. A range of exposure profiles are calculated representing portfolio exposures at different confidence levels or under predefined scenarios through the life of the portfolio. At a minimum, counterparty credit limits are set for all businesses against a consistent low probability (high confidence) profile. The effect of this limit framework is to ensure that there is a low probability of exposures exceeding the original approved limit. The models and parameters used to determine future asset prices and consequent portfolio exposures are reviewed and approved by RMG quarterly, significant changes in volatility or market conditions result in more frequent reviews.
High confidence level exposure measures are supplemented by regular and ad hoc exposure sensitivity analysis to evaluate the effect of extreme stress on the portfolio.
Both the internal and regulatory calculations of exposure relating to derivatives are calculated on a net basis where appropriate legal netting arrangements are in effect. The details of what products can be netted for each counterparty are recorded in legal documentation systems. These systems are tightly integrated into the exposure calculation functionality and serve to ensure that netting is only performed when the legal basis for this has been formally assessed and confirmed.
Where trading gives rise to settlement risk, this risk is normally assessed at full face value of the settlement amount. However, Macquarie utilises a number of market standard clearing mechanisms to ensure that the bulk of settlements are effected on a secured basis or through exchanges where a Delivery vs payment (DVP) settlement process is ensured.
Contingent exposures arising from the issuance of guarantees, letters of credit and performance bonds are also reported daily.
On and off-balance sheet exposures are considered together for approval, monitoring and reporting purposes. Credit exposures of all types are calculated and reported daily.
Each business is responsible for calculating their credit exposures to ensure that they stay within credit limits. In addition, these exposures are supplied to RMG Credit on a daily basis for centralised limit monitoring. Any excesses identified are investigated and escalated as appropriate to both business line and RMG management. All reportable excesses are summarised and reported to the Board monthly.
All wholesale limits and ratings are reviewed at least once a year, or more frequently if necessary, to ensure any deterioration is identified and reflected in an adjustment to limits and/or their MQ rating. Furthermore, other indicators of deterioration in credit quality are monitored daily, such as share price and credit default swap spread movements, covenant breaches and credit ratings downgrades. Where appropriate, these are reported to senior management and where recoverability is in doubt, appropriate provisions are held.
A review of the Credit and Equity Portfolio analysing exposure concentrations by counterparty, country, risk type, industry and credit quality is carried out quarterly and reported to the Board semi-annually. Policies are in place to limit large exposures to single counterparties and sectoral concentrations.
5.2.4 Credit Assurance
Credit Assurance (CA) is a centralised function within RMG which verifies the effectiveness of Macquarie’s credit risk management. The role of CA is to provide independent assurance of analysis and process to support credit quality and the effectiveness of Credit controls. Key responsibilities are: – assuring the quality of wholesale credit approvals
through sample testing; – reporting on the effectiveness (design and performance)
of RMG Credit’s critical controls including sample testing to ensure compliance with key Credit policies and the effectiveness of critical controls; and
– overseeing Business (Retail) CA functions in BFS and CAF.
RMG CA reports to the RMG Head of Operational Risk to ensure independence. In addition to regular reporting to senior management and the Chief Risk Officer, CA is required to report at least annually to, and have an annual private session with, the Board. In the interim, matters that require Board attention are reported via the Chief Risk Officer.
Macquarie Bank Limited Pillar 3 Disclosures September 2016 macquarie.com
5.0 Credit Risk Measurement continued
18
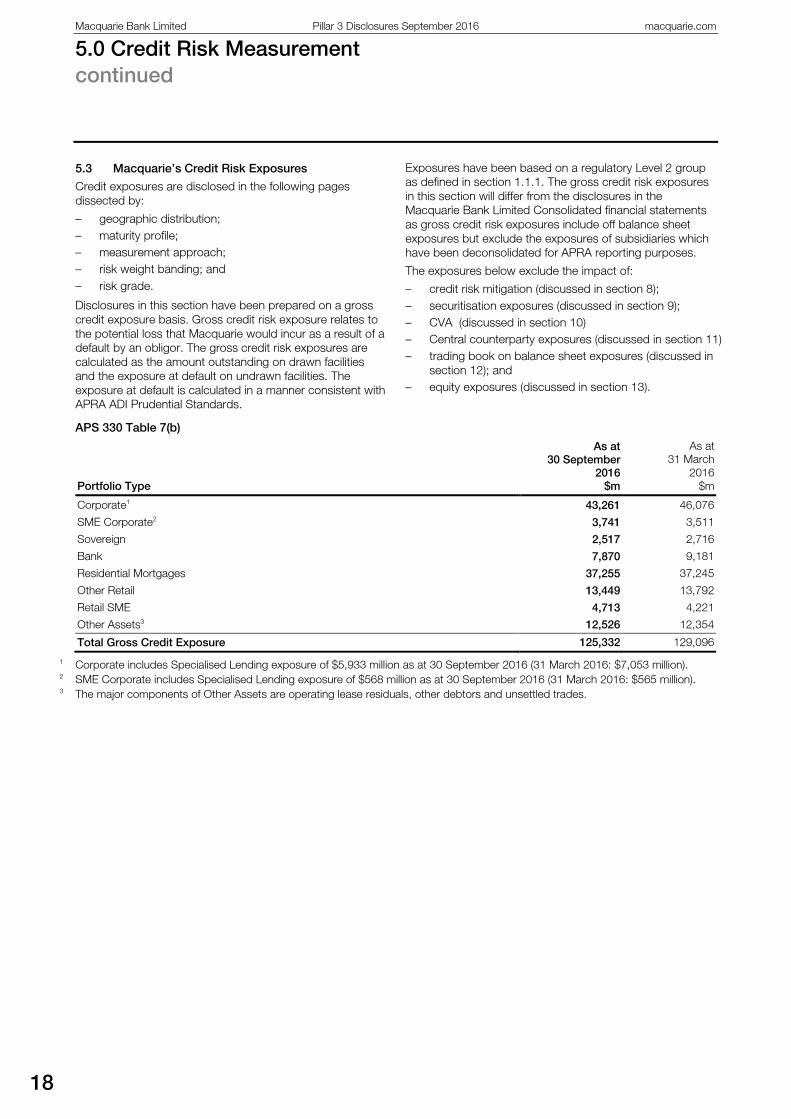
5.3 Macquarie’s Credit Risk Exposures
Credit exposures are disclosed in the following pages dissected by:
– geographic distribution; – maturity profile; – measurement approach; – risk weight banding; and – risk grade.
Disclosures in this section have been prepared on a gross credit exposure basis. Gross credit risk exposure relates to the potential loss that Macquarie would incur as a result of a default by an obligor. The gross credit risk exposures are calculated as the amount outstanding on drawn facilities and the exposure at default on undrawn facilities. The exposure at default is calculated in a manner consistent with APRA ADI Prudential Standards.
Exposures have been based on a regulatory Level 2 group as defined in section 1.1.1. The gross credit risk exposures in this section will differ from the disclosures in the Macquarie Bank Limited Consolidated financial statements as gross credit risk exposures include off balance sheet exposures but exclude the exposures of subsidiaries which have been deconsolidated for APRA reporting purposes.
The exposures below exclude the impact of:
– credit risk mitigation (discussed in section 8); – securitisation exposures (discussed in section 9); – CVA (discussed in section 10) – Central counterparty exposures (discussed in section 11) – trading book on balance sheet exposures (discussed in
section 12); and – equity exposures (discussed in section 13).
APS 330 Table 7(b)
Portfolio Type
As at 30 September
2016 $m
As at 31 March
2016 $m
Corporate1 43,261 46,076
SME Corporate2 3,741 3,511
Sovereign 2,517 2,716
Bank 7,870 9,181
Residential Mortgages 37,255 37,245
Other Retail 13,449 13,792
Retail SME 4,713 4,221
Other Assets3 12,526 12,354
Total Gross Credit Exposure 125,332 129,096
1 Corporate includes Specialised Lending exposure of $5,933 million as at 30 September 2016 (31 March 2016: $7,053 million). 2 SME Corporate includes Specialised Lending exposure of $568 million as at 30 September 2016 (31 March 2016: $565 million). 3 The major components of Other Assets are operating lease residuals, other debtors and unsettled trades.
19
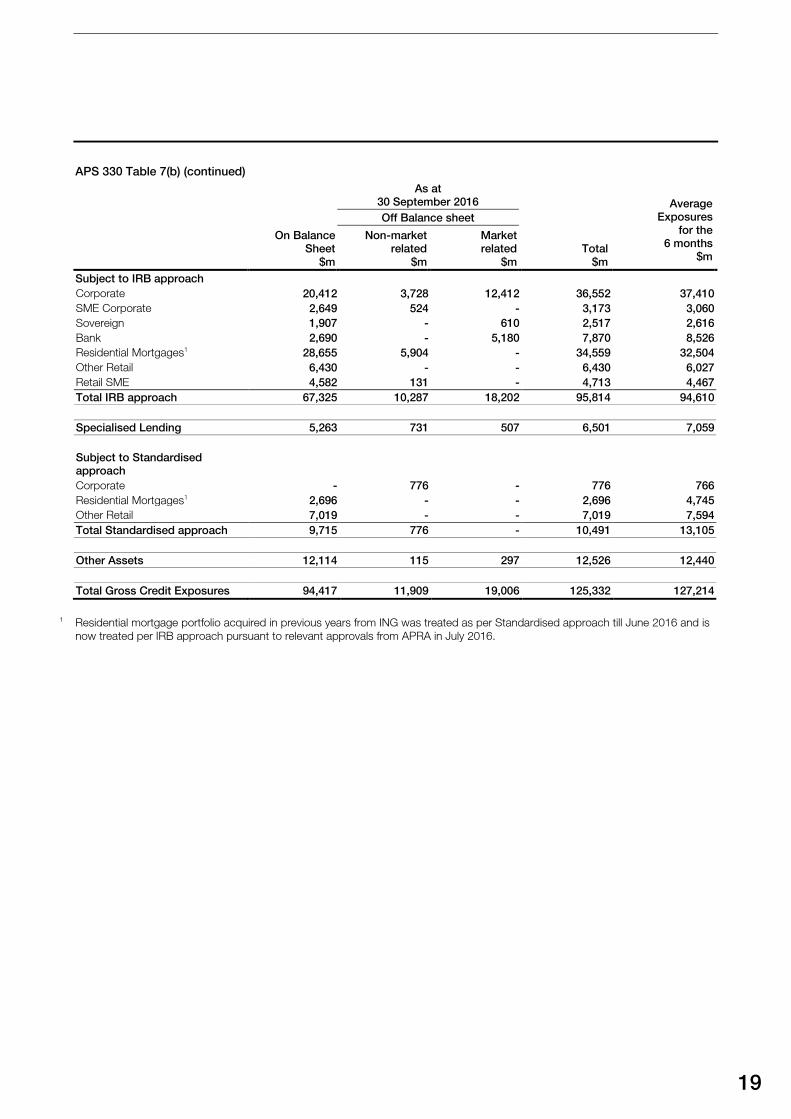
APS 330 Table 7(b) (continued)
As at
30 September 2016 Average
Exposures for the
6 months $m
Off Balance sheet
On Balance Sheet
$m
Non-market related
$m
Market related
$m Total
$m Subject to IRB approach Corporate 20,412 3,728 12,412 36,552 37,410 SME Corporate 2,649 524 - 3,173 3,060 Sovereign 1,907 - 610 2,517 2,616 Bank 2,690 - 5,180 7,870 8,526 Residential Mortgages1 28,655 5,904 - 34,559 32,504 Other Retail 6,430 - - 6,430 6,027 Retail SME 4,582 131 - 4,713 4,467 Total IRB approach 67,325 10,287 18,202 95,814 94,610 Specialised Lending 5,263 731 507 6,501 7,059 Subject to Standardised approach Corporate - 776 - 776 766 Residential Mortgages1 2,696 - - 2,696 4,745 Other Retail 7,019 - - 7,019 7,594 Total Standardised approach 9,715 776 - 10,491 13,105 Other Assets 12,114 115 297 12,526 12,440 Total Gross Credit Exposures 94,417 11,909 19,006 125,332 127,214
1 Residential mortgage portfolio acquired in previous years from ING was treated as per Standardised approach till June 2016 and is now treated per IRB approach pursuant to relevant approvals from APRA in July 2016.
Macquarie Bank Limited Pillar 3 Disclosures September 2016 macquarie.com
5.0 Credit Risk Measurement continued
20
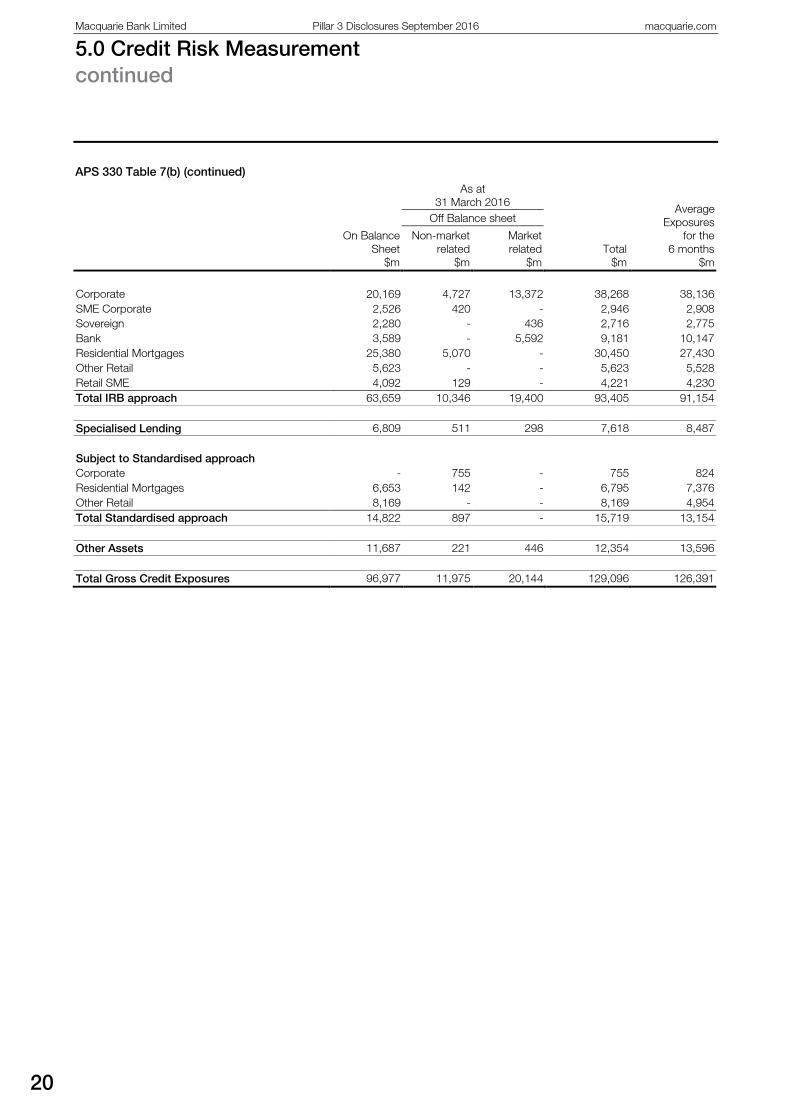
APS 330 Table 7(b) (continued)
As at
31 March 2016 Average
Exposures for the
6 months $m
Off Balance sheet
On Balance Sheet
$m
Non-market related
$m
Market related
$m Total
$m
Corporate 20,169 4,727 13,372 38,268 38,136 SME Corporate 2,526 420 - 2,946 2,908 Sovereign 2,280 - 436 2,716 2,775 Bank 3,589 - 5,592 9,181 10,147 Residential Mortgages 25,380 5,070 - 30,450 27,430 Other Retail 5,623 - - 5,623 5,528 Retail SME 4,092 129 - 4,221 4,230 Total IRB approach 63,659 10,346 19,400 93,405 91,154 Specialised Lending 6,809 511 298 7,618 8,487 Subject to Standardised approach Corporate - 755 - 755 824 Residential Mortgages 6,653 142 - 6,795 7,376 Other Retail 8,169 - - 8,169 4,954 Total Standardised approach 14,822 897 - 15,719 13,154 Other Assets 11,687 221 446 12,354 13,596 Total Gross Credit Exposures 96,977 11,975 20,144 129,096 126,391
21
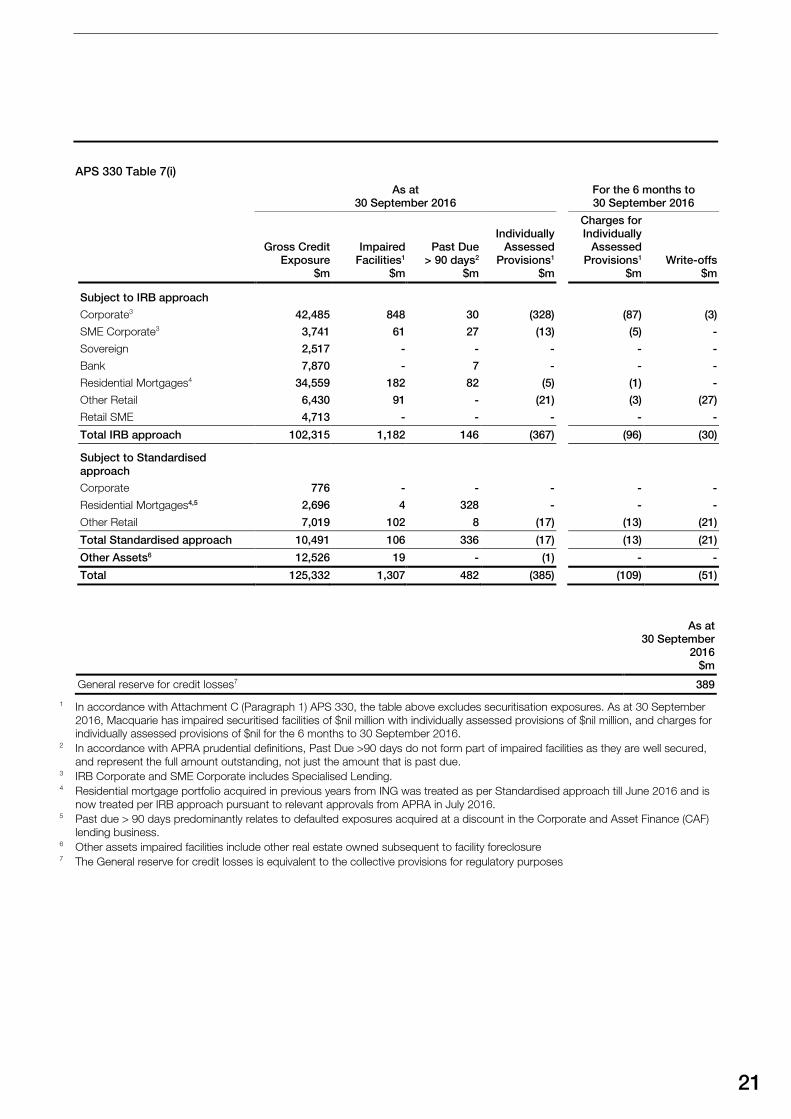
APS 330 Table 7(i)
As at
30 September 2016 For the 6 months to
30 September 2016
Gross Credit Exposure
$m
Impaired Facilities1
$m
Past Due > 90 days2
$m
Individually Assessed
Provisions1 $m
Charges for Individually
Assessed Provisions1
$m Write-offs
$m
Subject to IRB approach
Corporate3 42,485 848 30 (328) (87) (3)
SME Corporate3 3,741 61 27 (13) (5) -
Sovereign 2,517 - - - - -
Bank 7,870 - 7 - - -
Residential Mortgages4 34,559 182 82 (5) (1) -
Other Retail 6,430 91 - (21) (3) (27)
Retail SME 4,713 - - - - -
Total IRB approach 102,315 1,182 146 (367) (96) (30)
Subject to Standardised approach
Corporate 776 - - - - -
Residential Mortgages4,5 2,696 4 328 - - -
Other Retail 7,019 102 8 (17) (13) (21)
Total Standardised approach 10,491 106 336 (17) (13) (21)
Other Assets6 12,526 19 - (1) - -
Total 125,332 1,307 482 (385) (109) (51)
As at 30 September
2016 $m
General reserve for credit losses7 389
1 In accordance with Attachment C (Paragraph 1) APS 330, the table above excludes securitisation exposures. As at 30 September 2016, Macquarie has impaired securitised facilities of $nil million with individually assessed provisions of $nil million, and charges for individually assessed provisions of $nil for the 6 months to 30 September 2016.
2 In accordance with APRA prudential definitions, Past Due >90 days do not form part of impaired facilities as they are well secured, and represent the full amount outstanding, not just the amount that is past due.
3 IRB Corporate and SME Corporate includes Specialised Lending. 4 Residential mortgage portfolio acquired in previous years from ING was treated as per Standardised approach till June 2016 and is
now treated per IRB approach pursuant to relevant approvals from APRA in July 2016. 5 Past due > 90 days predominantly relates to defaulted exposures acquired at a discount in the Corporate and Asset Finance (CAF)
lending business. 6 Other assets impaired facilities include other real estate owned subsequent to facility foreclosure 7 The General reserve for credit losses is equivalent to the collective provisions for regulatory purposes
Macquarie Bank Limited Pillar 3 Disclosures September 2016 macquarie.com
5.0 Credit Risk Measurement continued
22
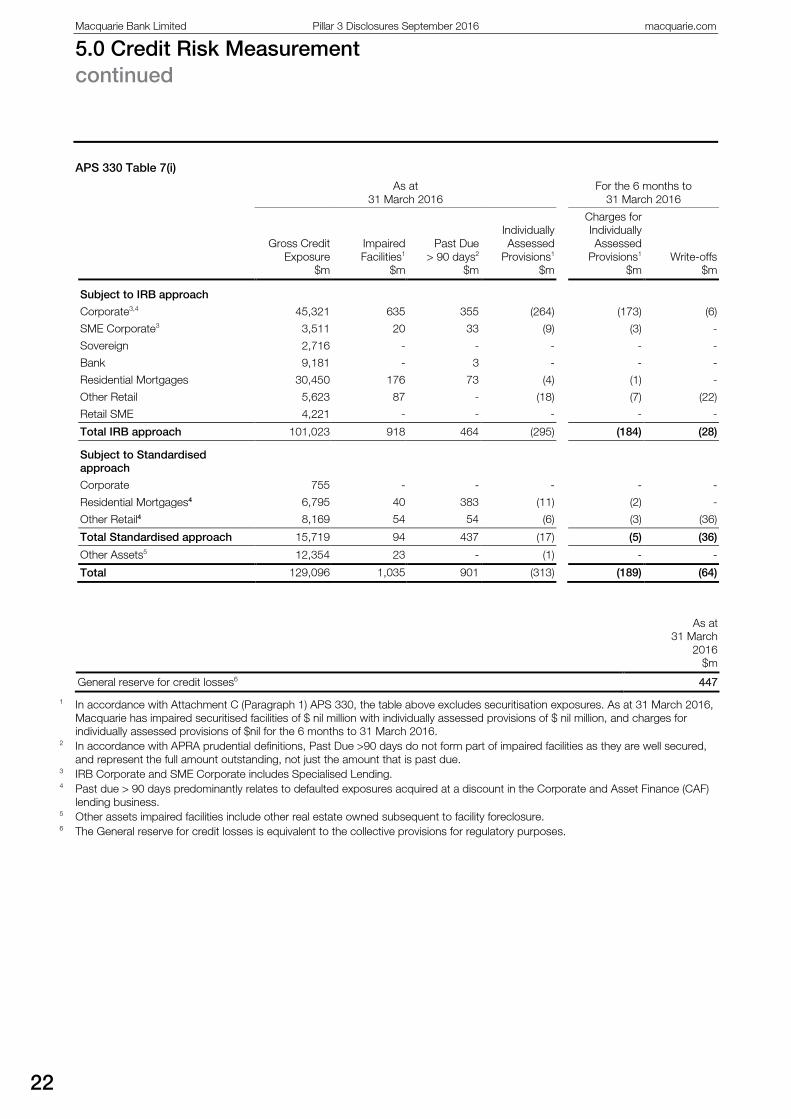
APS 330 Table 7(i)
As at
31 March 2016 For the 6 months to
31 March 2016
Gross Credit Exposure
$m
Impaired Facilities1
$m
Past Due > 90 days2
$m
Individually Assessed
Provisions1 $m
Charges for Individually Assessed
Provisions1 $m
Write-offs $m
Subject to IRB approach
Corporate3,4 45,321 635 355 (264) (173) (6)
SME Corporate3 3,511 20 33 (9) (3) -
Sovereign 2,716 - - - - -
Bank 9,181 - 3 - - -
Residential Mortgages 30,450 176 73 (4) (1) -
Other Retail 5,623 87 - (18) (7) (22)
Retail SME 4,221 - - - - -
Total IRB approach 101,023 918 464 (295) (184) (28)
Subject to Standardised approach
Corporate 755 - - - - -
Residential Mortgages4 6,795 40 383 (11) (2) -
Other Retail4 8,169 54 54 (6) (3) (36)
Total Standardised approach 15,719 94 437 (17) (5) (36)
Other Assets5 12,354 23 - (1) - -
Total 129,096 1,035 901 (313) (189) (64)
As at 31 March
2016 $m
General reserve for credit losses6 447
1 In accordance with Attachment C (Paragraph 1) APS 330, the table above excludes securitisation exposures. As at 31 March 2016, Macquarie has impaired securitised facilities of $ nil million with individually assessed provisions of $ nil million, and charges for individually assessed provisions of $nil for the 6 months to 31 March 2016.
2 In accordance with APRA prudential definitions, Past Due >90 days do not form part of impaired facilities as they are well secured, and represent the full amount outstanding, not just the amount that is past due.
3 IRB Corporate and SME Corporate includes Specialised Lending. 4 Past due > 90 days predominantly relates to defaulted exposures acquired at a discount in the Corporate and Asset Finance (CAF)
lending business. 5 Other assets impaired facilities include other real estate owned subsequent to facility foreclosure. 6 The General reserve for credit losses is equivalent to the collective provisions for regulatory purposes.

23
5.4 Credit Risk by Geographic Distribution
The credit risk exposures below have been based on a geographical split by domicile of the counterparty.
APS 330 Table 7(c)
As at
30 September 2016
Portfolio Type Asia Pacific
$m Australia
$m EMEA*
$m Americas
$m Total
$m
Corporate 3,901 7,287 16,437 15,636 43,261
SME Corporate 4 3,736 1 - 3,741
Sovereign 100 1,974 404 39 2,517
Bank 699 1,547 3,601 2,023 7,870
Residential Mortgages 101 35,539 964 651 37,255
Other Retail - 12,455 568 426 13,449
Retail SME - 4,713 - - 4,713
Other Assets 1,316 1,431 7,811 1,968 12,526
Total Gross Credit Exposure 6,121 68,682 29,786 20,743 125,332
*EMEA represents Europe, Middle East and Africa
As at
31 March 2016
Portfolio Type Asia Pacific
$m Australia
$m EMEA
$m Americas
$m Total
$m
Corporate 4,356 8,293 17,365 16,062 46,076
SME Corporate 4 3,500 7 - 3,511
Sovereign 124 2,216 323 53 2,716
Bank 563 2,423 3,964 2,231 9,181
Residential Mortgages 97 34,597 954 1,597 37,245
Other Retail - 12,923 486 383 13,792
Retail SME - 4,215 6 - 4,221
Other Assets 1,237 1,151 8,408 1,558 12,354
Total Gross Credit Exposure 6,381 69,318 31,513 21,884 129,096
Macquarie Bank Limited Pillar 3 Disclosures September 2016 macquarie.com
5.0 Credit Risk Measurement continued
24
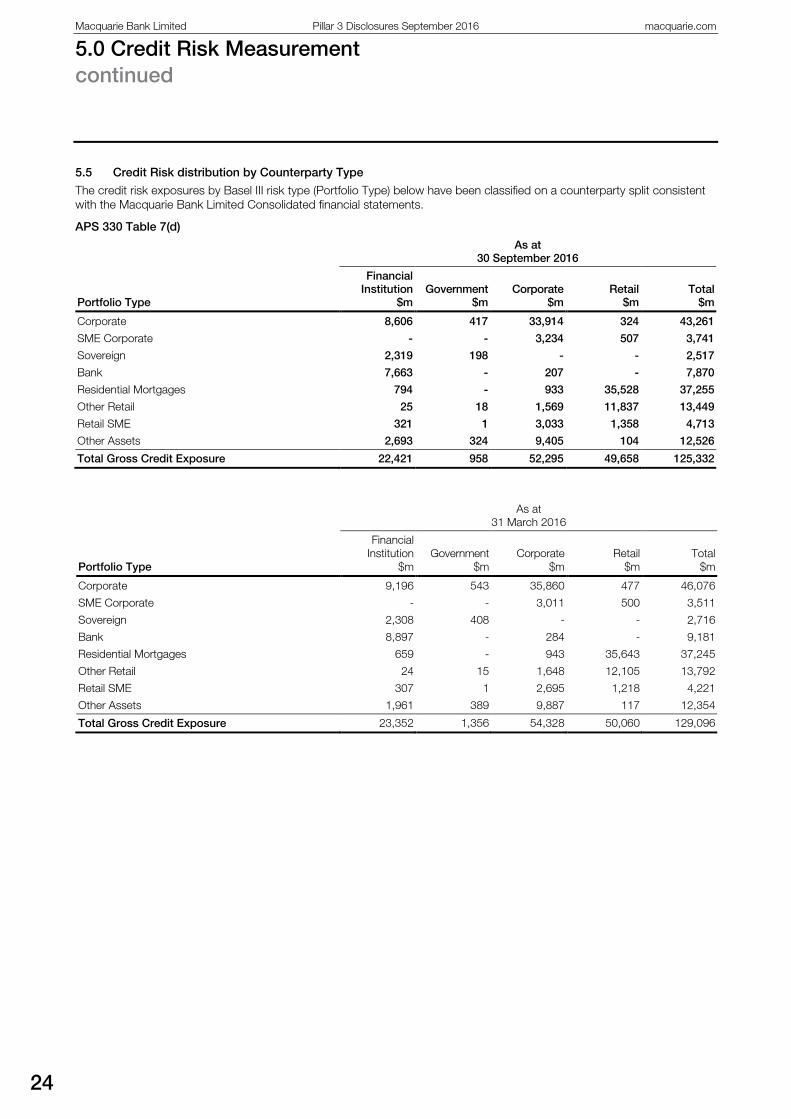
5.5 Credit Risk distribution by Counterparty Type
The credit risk exposures by Basel III risk type (Portfolio Type) below have been classified on a counterparty split consistent with the Macquarie Bank Limited Consolidated financial statements.
APS 330 Table 7(d)
As at
30 September 2016
Portfolio Type
Financial Institution
$m Government
$m Corporate
$m Retail
$m Total
$m
Corporate 8,606 417 33,914 324 43,261
SME Corporate - - 3,234 507 3,741
Sovereign 2,319 198 - - 2,517
Bank 7,663 - 207 - 7,870
Residential Mortgages 794 - 933 35,528 37,255
Other Retail 25 18 1,569 11,837 13,449
Retail SME 321 1 3,033 1,358 4,713
Other Assets 2,693 324 9,405 104 12,526
Total Gross Credit Exposure 22,421 958 52,295 49,658 125,332
As at
31 March 2016
Portfolio Type
Financial Institution
$m Government
$m Corporate
$m Retail
$m Total
$m
Corporate 9,196 543 35,860 477 46,076
SME Corporate - - 3,011 500 3,511
Sovereign 2,308 408 - - 2,716
Bank 8,897 - 284 - 9,181
Residential Mortgages 659 - 943 35,643 37,245
Other Retail 24 15 1,648 12,105 13,792
Retail SME 307 1 2,695 1,218 4,221
Other Assets 1,961 389 9,887 117 12,354
Total Gross Credit Exposure 23,352 1,356 54,328 50,060 129,096
25
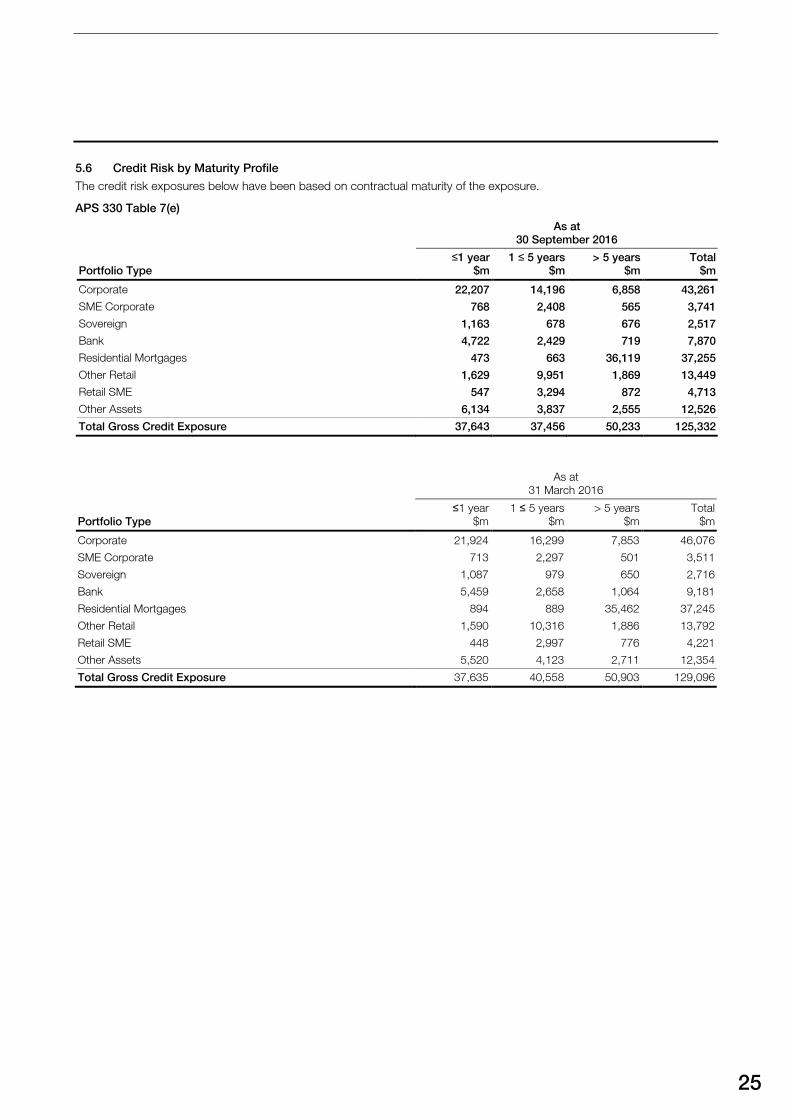
5.6 Credit Risk by Maturity Profile
The credit risk exposures below have been based on contractual maturity of the exposure.
APS 330 Table 7(e)
As at
30 September 2016
Portfolio Type ≤1 year
$m 1 ≤ 5 years
$m > 5 years
$m Total
$m
Corporate 22,207 14,196 6,858 43,261
SME Corporate 768 2,408 565 3,741
Sovereign 1,163 678 676 2,517
Bank 4,722 2,429 719 7,870
Residential Mortgages 473 663 36,119 37,255
Other Retail 1,629 9,951 1,869 13,449
Retail SME 547 3,294 872 4,713
Other Assets 6,134 3,837 2,555 12,526
Total Gross Credit Exposure 37,643 37,456 50,233 125,332
As at
31 March 2016
Portfolio Type ≤1 year
$m 1 ≤ 5 years
$m > 5 years
$m Total
$m
Corporate 21,924 16,299 7,853 46,076
SME Corporate 713 2,297 501 3,511
Sovereign 1,087 979 650 2,716
Bank 5,459 2,658 1,064 9,181
Residential Mortgages 894 889 35,462 37,245
Other Retail 1,590 10,316 1,886 13,792
Retail SME 448 2,997 776 4,221
Other Assets 5,520 4,123 2,711 12,354
Total Gross Credit Exposure 37,635 40,558 50,903 129,096
Macquarie Bank Limited Pillar 3 Disclosures September 2016 macquarie.com
5.0 Credit Risk Measurement continued
26
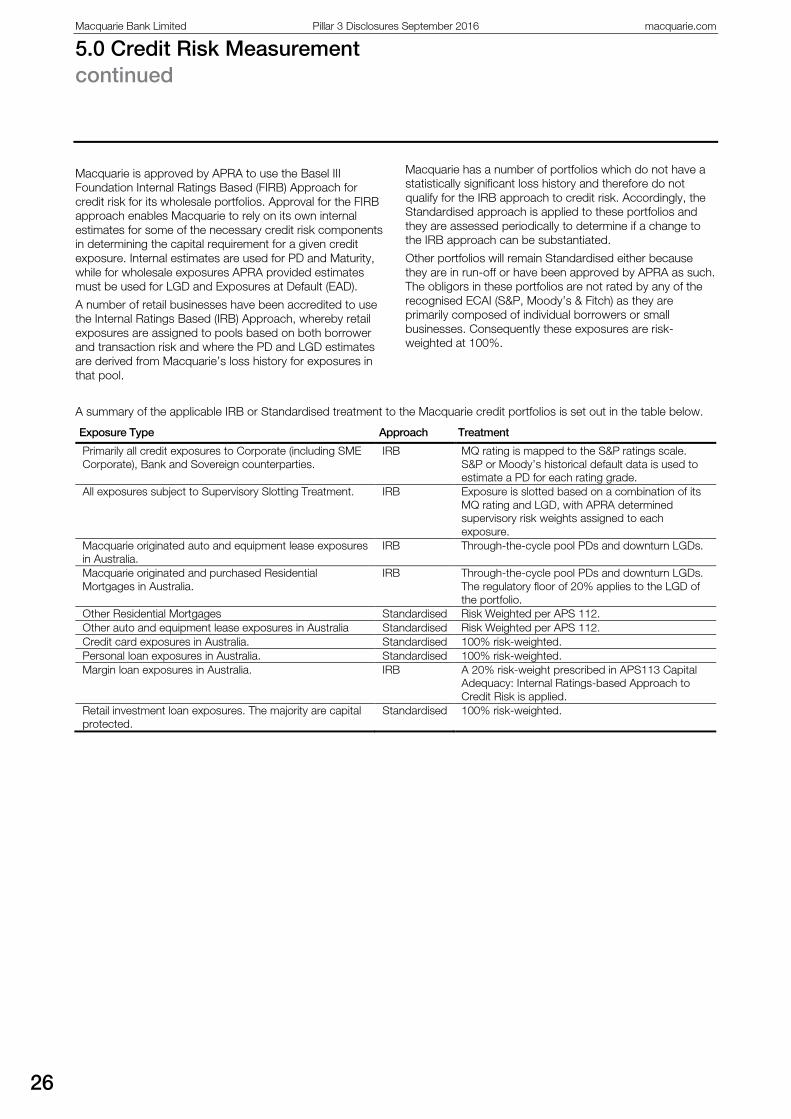
Macquarie is approved by APRA to use the Basel III Foundation Internal Ratings Based (FIRB) Approach for credit risk for its wholesale portfolios. Approval for the FIRB approach enables Macquarie to rely on its own internal estimates for some of the necessary credit risk components in determining the capital requirement for a given credit exposure. Internal estimates are used for PD and Maturity, while for wholesale exposures APRA provided estimates must be used for LGD and Exposures at Default (EAD).
A number of retail businesses have been accredited to use the Internal Ratings Based (IRB) Approach, whereby retail exposures are assigned to pools based on both borrower and transaction risk and where the PD and LGD estimates are derived from Macquarie’s loss history for exposures in that pool.
Macquarie has a number of portfolios which do not have a statistically significant loss history and therefore do not qualify for the IRB approach to credit risk. Accordingly, the Standardised approach is applied to these portfolios and they are assessed periodically to determine if a change to the IRB approach can be substantiated.
Other portfolios will remain Standardised either because they are in run-off or have been approved by APRA as such. The obligors in these portfolios are not rated by any of the recognised ECAI (S&P, Moody’s & Fitch) as they are primarily composed of individual borrowers or small businesses. Consequently these exposures are risk-weighted at 100%.
A summary of the applicable IRB or Standardised treatment to the Macquarie credit portfolios is set out in the table below.
Exposure Type Approach Treatment
Primarily all credit exposures to Corporate (including SME Corporate), Bank and Sovereign counterparties.
IRB MQ rating is mapped to the S&P ratings scale. S&P or Moody’s historical default data is used to estimate a PD for each rating grade.
All exposures subject to Supervisory Slotting Treatment. IRB Exposure is slotted based on a combination of its MQ rating and LGD, with APRA determined supervisory risk weights assigned to each exposure.
Macquarie originated auto and equipment lease exposures in Australia.
IRB Through-the-cycle pool PDs and downturn LGDs.
Macquarie originated and purchased Residential Mortgages in Australia.
IRB Through-the-cycle pool PDs and downturn LGDs. The regulatory floor of 20% applies to the LGD of the portfolio.
Other Residential Mortgages Standardised Risk Weighted per APS 112. Other auto and equipment lease exposures in Australia Standardised Risk Weighted per APS 112. Credit card exposures in Australia. Standardised 100% risk-weighted. Personal loan exposures in Australia. Standardised 100% risk-weighted. Margin loan exposures in Australia. IRB A 20% risk-weight prescribed in APS113 Capital
Adequacy: Internal Ratings-based Approach to Credit Risk is applied.
Retail investment loan exposures. The majority are capital protected.
Standardised 100% risk-weighted.
6.0 Calculation of Credit Risk Exposures
27
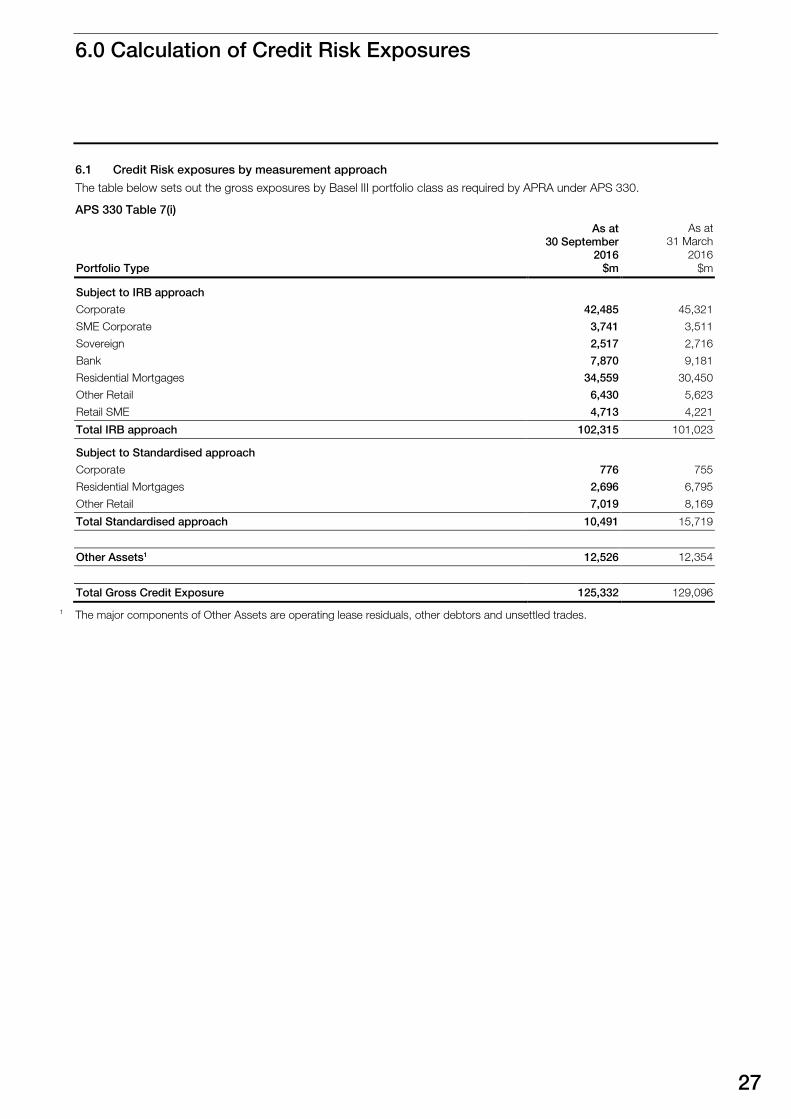
6.1 Credit Risk exposures by measurement approach
The table below sets out the gross exposures by Basel III portfolio class as required by APRA under APS 330.
APS 330 Table 7(i)
Portfolio Type
As at 30 September
2016 $m
As at 31 March
2016 $m
Subject to IRB approach
Corporate 42,485 45,321
SME Corporate 3,741 3,511
Sovereign 2,517 2,716
Bank 7,870 9,181
Residential Mortgages 34,559 30,450
Other Retail 6,430 5,623
Retail SME 4,713 4,221
Total IRB approach 102,315 101,023
Subject to Standardised approach
Corporate 776 755
Residential Mortgages 2,696 6,795
Other Retail 7,019 8,169
Total Standardised approach 10,491 15,719
Other Assets1 12,526 12,354
Total Gross Credit Exposure 125,332 129,096
1 The major components of Other Assets are operating lease residuals, other debtors and unsettled trades.
Macquarie Bank Limited Pillar 3 Disclosures September 2016 macquarie.com
6.0 Calculation of Credit Risk Exposures continued
28
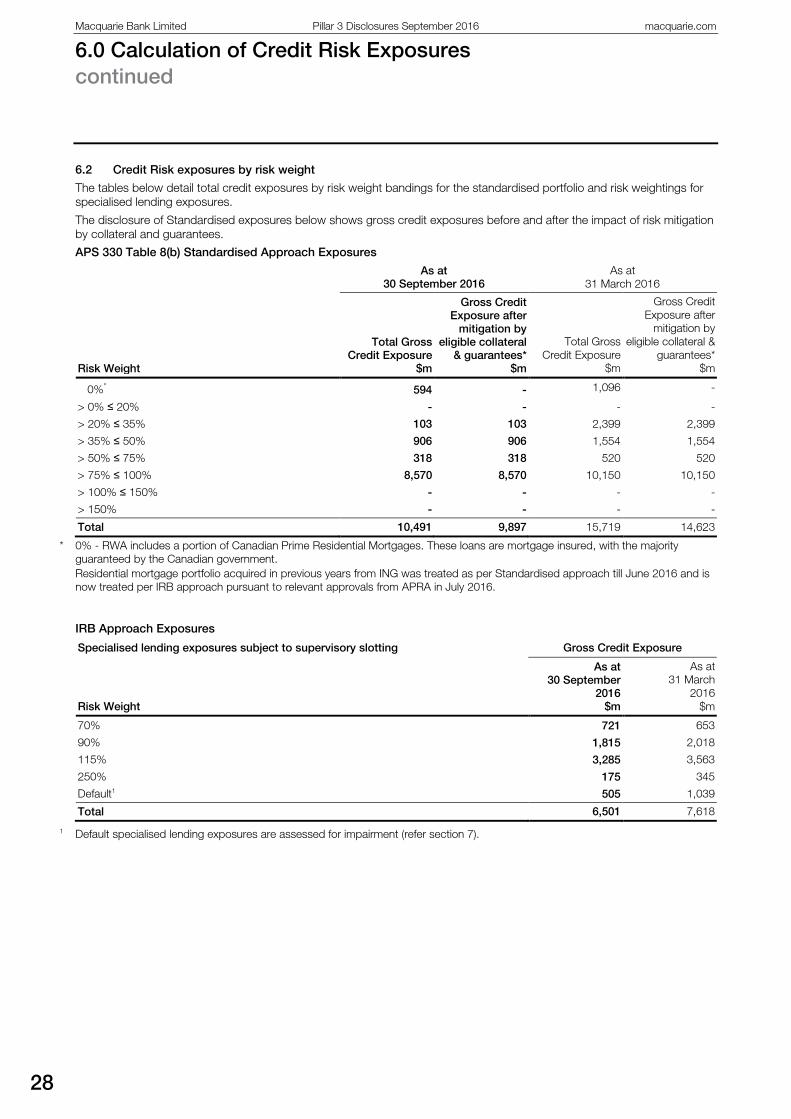
6.2 Credit Risk exposures by risk weight
The tables below detail total credit exposures by risk weight bandings for the standardised portfolio and risk weightings for specialised lending exposures.
The disclosure of Standardised exposures below shows gross credit exposures before and after the impact of risk mitigation by collateral and guarantees.
APS 330 Table 8(b) Standardised Approach Exposures
As at
30 September 2016 As at
31 March 2016
Risk Weight
Total Gross Credit Exposure
$m
Gross Credit Exposure after
mitigation by eligible collateral
& guarantees* $m
Total Gross Credit Exposure
$m
Gross Credit Exposure after
mitigation by eligible collateral &
guarantees* $m
0%* 594 - 1,096 -
> 0% ≤ 20% - - - -
> 20% ≤ 35% 103 103 2,399 2,399
> 35% ≤ 50% 906 906 1,554 1,554
> 50% ≤ 75% 318 318 520 520
> 75% ≤ 100% 8,570 8,570 10,150 10,150
> 100% ≤ 150% - - - -
> 150% - - - -
Total 10,491 9,897 15,719 14,623
* 0% - RWA includes a portion of Canadian Prime Residential Mortgages. These loans are mortgage insured, with the majority guaranteed by the Canadian government.
Residential mortgage portfolio acquired in previous years from ING was treated as per Standardised approach till June 2016 and is now treated per IRB approach pursuant to relevant approvals from APRA in July 2016.
IRB Approach Exposures
Specialised lending exposures subject to supervisory slotting Gross Credit Exposure
Risk Weight
As at 30 September
2016 $m
As at 31 March
2016 $m
70% 721 653
90% 1,815 2,018
115% 3,285 3,563
250% 175 345
Default1 505 1,039
Total 6,501 7,618
1 Default specialised lending exposures are assessed for impairment (refer section 7).
29
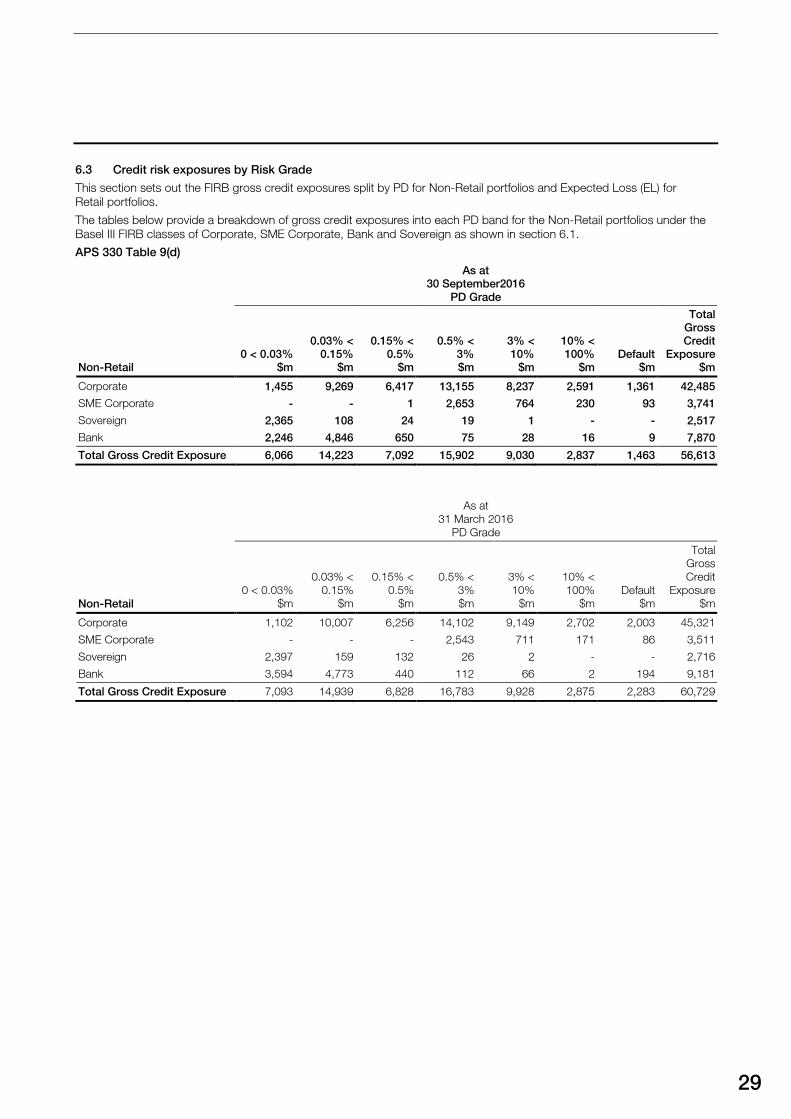
6.3 Credit risk exposures by Risk Grade
This section sets out the FIRB gross credit exposures split by PD for Non-Retail portfolios and Expected Loss (EL) for Retail portfolios.
The tables below provide a breakdown of gross credit exposures into each PD band for the Non-Retail portfolios under the Basel III FIRB classes of Corporate, SME Corporate, Bank and Sovereign as shown in section 6.1.
APS 330 Table 9(d)
As at 30 September2016
PD Grade
Non-Retail 0 < 0.03%
$m
0.03% < 0.15%
$m
0.15% < 0.5%
$m
0.5% < 3% $m
3% < 10%
$m
10% < 100%
$m Default
$m
Total Gross Credit
Exposure $m
Corporate 1,455 9,269 6,417 13,155 8,237 2,591 1,361 42,485
SME Corporate - - 1 2,653 764 230 93 3,741
Sovereign 2,365 108 24 19 1 - - 2,517
Bank 2,246 4,846 650 75 28 16 9 7,870
Total Gross Credit Exposure 6,066 14,223 7,092 15,902 9,030 2,837 1,463 56,613
As at 31 March 2016
PD Grade
Non-Retail 0 < 0.03%
$m
0.03% < 0.15%
$m
0.15% < 0.5%
$m
0.5% < 3% $m
3% < 10%
$m
10% < 100%
$m Default
$m
Total Gross Credit
Exposure $m
Corporate 1,102 10,007 6,256 14,102 9,149 2,702 2,003 45,321
SME Corporate - - - 2,543 711 171 86 3,511
Sovereign 2,397 159 132 26 2 - - 2,716
Bank 3,594 4,773 440 112 66 2 194 9,181
Total Gross Credit Exposure 7,093 14,939 6,828 16,783 9,928 2,875 2,283 60,729

Macquarie Bank Limited Pillar 3 Disclosures September 2016 macquarie.com
6.0 Calculation of Credit Risk Exposures continued
30
Included within Total Gross Credit Exposures above are exposures for undrawn commitments. These undrawn commitment exposures are set out in the following tables.
APS330 Table 9(d) continued
As at 30 September 2016
PD Grade
Undrawn Commitments 0 < 0.03%
$m
0.03% < 0.15%
$m
0.15% < 0.5%
$m
0.5% < 3% $m
3% < 10%
$m
10% < 100%
$m Total
$m
Corporate 31 1,386 482 1,200 324 55 3,478
SME Corporate - - - 362 76 17 455
Total Undrawn Commitments 31 1,386 482 1,562 400 72 3,933
As at 31 March 2016
PD Grade
Undrawn Commitments 0 < 0.03%
$m
0.03% < 0.15%
$m
0.15% < 0.5%
$m
0.5% < 3% $m
3% < 10%
$m
10% < 100%
$m Total
$m
Corporate 37 1,496 399 977 314 62 3,285
SME Corporate - - - 321 63 12 396
Total Undrawn Commitments 37 1,496 399 1,298 377 74 3,681
31
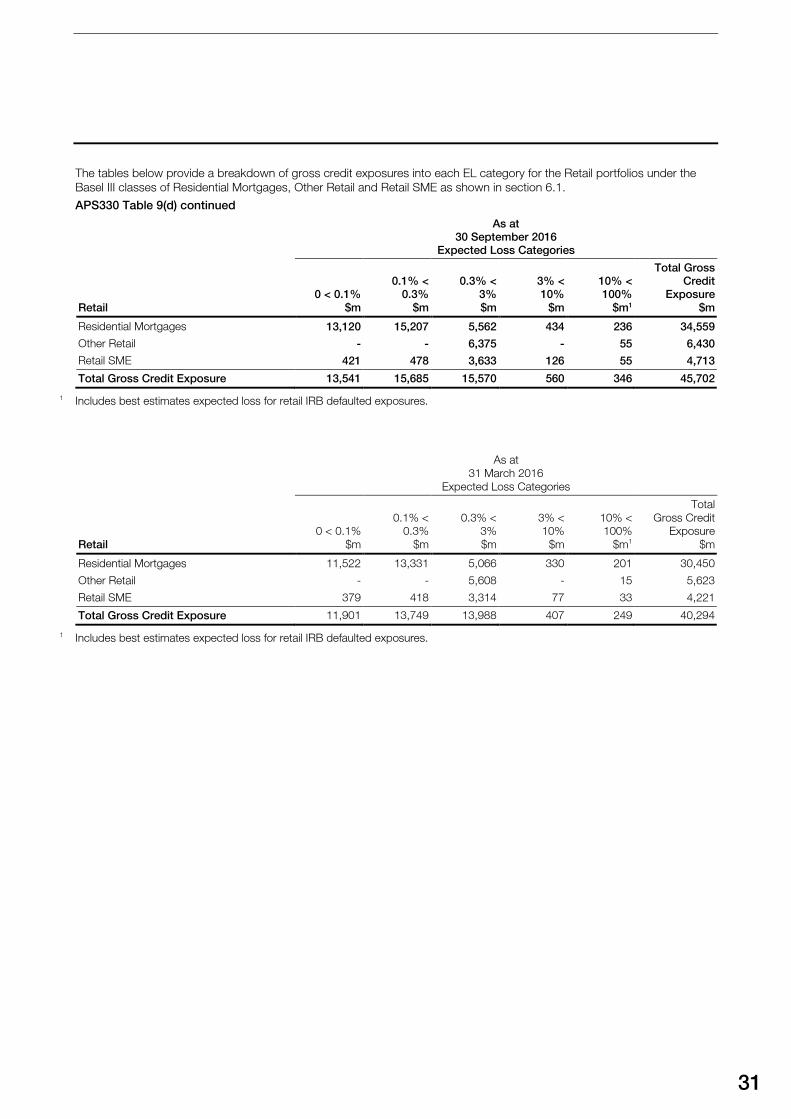
The tables below provide a breakdown of gross credit exposures into each EL category for the Retail portfolios under the Basel III classes of Residential Mortgages, Other Retail and Retail SME as shown in section 6.1.
APS330 Table 9(d) continued
As at 30 September 2016
Expected Loss Categories
Retail 0 < 0.1%
$m
0.1% < 0.3%
$m
0.3% < 3% $m
3% < 10%
$m
10% < 100%
$m1
Total Gross Credit
Exposure $m
Residential Mortgages 13,120 15,207 5,562 434 236 34,559
Other Retail - - 6,375 - 55 6,430
Retail SME 421 478 3,633 126 55 4,713
Total Gross Credit Exposure 13,541 15,685 15,570 560 346 45,702
1 Includes best estimates expected loss for retail IRB defaulted exposures.
As at 31 March 2016
Expected Loss Categories
Retail 0 < 0.1%
$m
0.1% < 0.3%
$m
0.3% < 3% $m
3% < 10%
$m
10% < 100%
$m1
Total Gross Credit
Exposure $m
Residential Mortgages 11,522 13,331 5,066 330 201 30,450
Other Retail - - 5,608 - 15 5,623
Retail SME 379 418 3,314 77 33 4,221
Total Gross Credit Exposure 11,901 13,749 13,988 407 249 40,294
1 Includes best estimates expected loss for retail IRB defaulted exposures.
Macquarie Bank Limited Pillar 3 Disclosures September 2016 macquarie.com
6.0 Calculation of Credit Risk Exposures continued
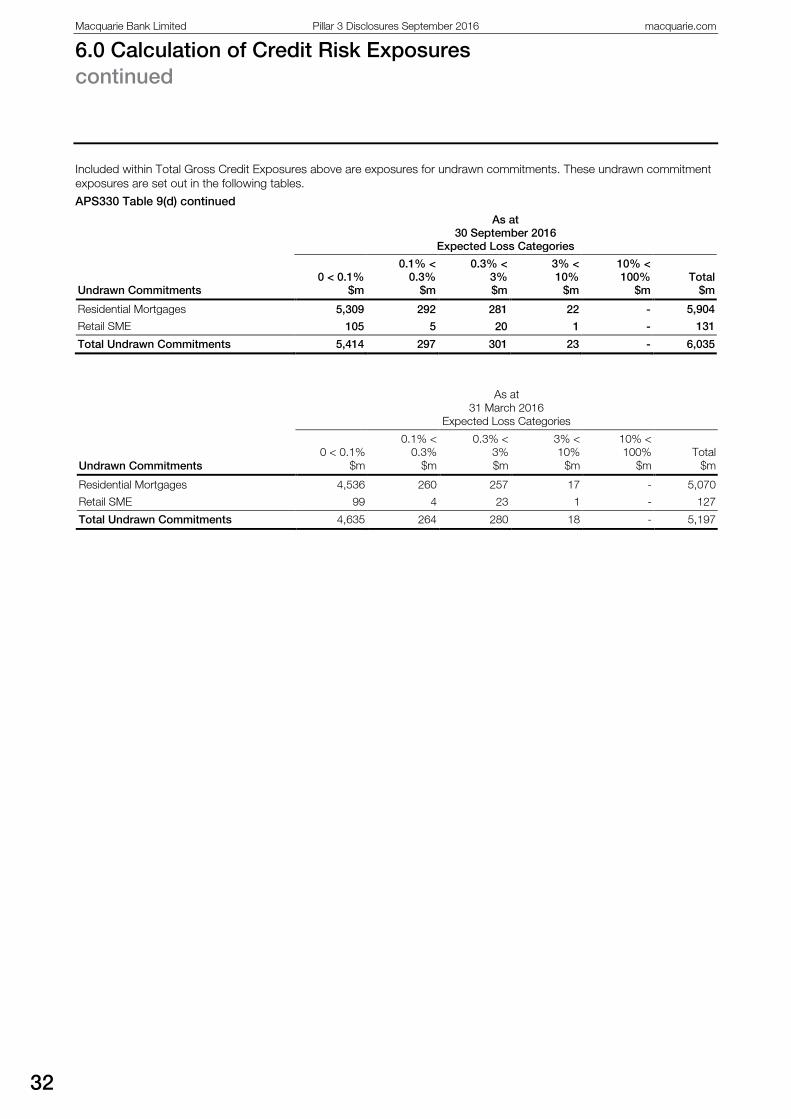
32
Included within Total Gross Credit Exposures above are exposures for undrawn commitments. These undrawn commitment exposures are set out in the following tables.
APS330 Table 9(d) continued
As at 30 September 2016
Expected Loss Categories
Undrawn Commitments 0 < 0.1%
$m
0.1% < 0.3%
$m
0.3% < 3% $m
3% < 10%
$m
10% < 100%
$m Total
$m
Residential Mortgages 5,309 292 281 22 - 5,904
Retail SME 105 5 20 1 - 131
Total Undrawn Commitments 5,414 297 301 23 - 6,035
As at 31 March 2016
Expected Loss Categories
Undrawn Commitments 0 < 0.1%
$m
0.1% < 0.3%
$m
0.3% < 3% $m
3% < 10%
$m
10% < 100%
$m Total
$m
Residential Mortgages 4,536 260 257 17 - 5,070
Retail SME 99 4 23 1 - 127
Total Undrawn Commitments 4,635 264 280 18 - 5,197
7.0 Provisioning
33
7.1 Impaired Facilities and Past Due
Impaired facilities are financial assets (including both on and off balance sheet exposures) where there is doubt regarding the collectability of some or all of the contractual payments due from a counterparty. The contractual payments include principal outstanding, interest and other related charges.
Exposures will be assessed for impairment where there is objective evidence of impairment. Objective evidence of impairment may include market, economic or legal factors impacting upon the ability of a counterparty to meet their repayment obligations. The assessment process consists of a comparison of the carrying value of the exposure and the present value of its estimated future cash flows (recoverable amount).
The estimation of expected future cash flows takes into consideration:
– external valuations of the asset (taking into account the value of any security held);
– costs of recovery; and – the timeframe for realisation of recovery and/or sale of
security.
The estimated future cash flows are discounted at the original effective interest rate to determine the recoverable amount of the financial asset.
Facilities that are more than 90 calendar days past contractual due date can be classified as either:
– impaired facility if it meets the criteria for impairment as detailed above; or
– past due where the facility is assessed as well secured.
For the purposes of this report, past dues represent the full amount outstanding, not just the amount that is past due.
7.2 Individually Assessed Provisions
Facilities that are assessed as impaired are subject to a recoverability test. Individually assessed provisions are calculated in accordance with Australian Accounting Standards and are recognised as the difference between the carrying value of the exposure and the present value of expected future cash flows, discounted using the original effective interest rate.
7.3 Collective Provisions
Facilities for which no individually assessed provision is required are assessed collectively for impairment. Collective provisions are calculated in accordance with Australian Accounting Standards and are representative of credit losses that have been incurred but not yet specifically identified. For Wholesale and Retail IRB facilities, the collective provision calculation primarily applies the PD and LGD estimates to the EAD. For other facilities, assets are placed into portfolios with similar characteristics and assessed against parameters based on historical loss experience. The historical loss experience is adjusted, where appropriate, for current circumstances, trends and conditions which may affect portfolio recoverability over a period of time.
7.4 Regulatory Expected Loss (REL)
REL represents the estimated future credit losses expected to be incurred in a portfolio. For non-defaulted exposures, similar to collective provisions, REL is calculated as a function of the outstanding exposure, PD and LGD whereas REL for defaulted corporate, sovereign and bank exposures under the FIRB approach is determined as the product of LGD and EAD. LGDs are defined by APRA for Corporate, Bank and Sovereign. Specialised lending exposures subject to supervisory slotting criteria are measured using APRA determined risk weightings. For defaulted retail exposures under the IRB approach, REL is based on the best estimate of loss.
The excess of REL over eligible provisions is required by APRA to be deducted from Common Equity Tier 1 capital. Eligible provisions include individually assessed provisions and collective provisions. As at 30 September 2016, the total REL was $1,316 million (31 March 2016: $1,705 million), with the excess of REL over eligible provisions resulting in a Common Equity Tier 1 deduction of $304 million (31 March 2016: $267 million).
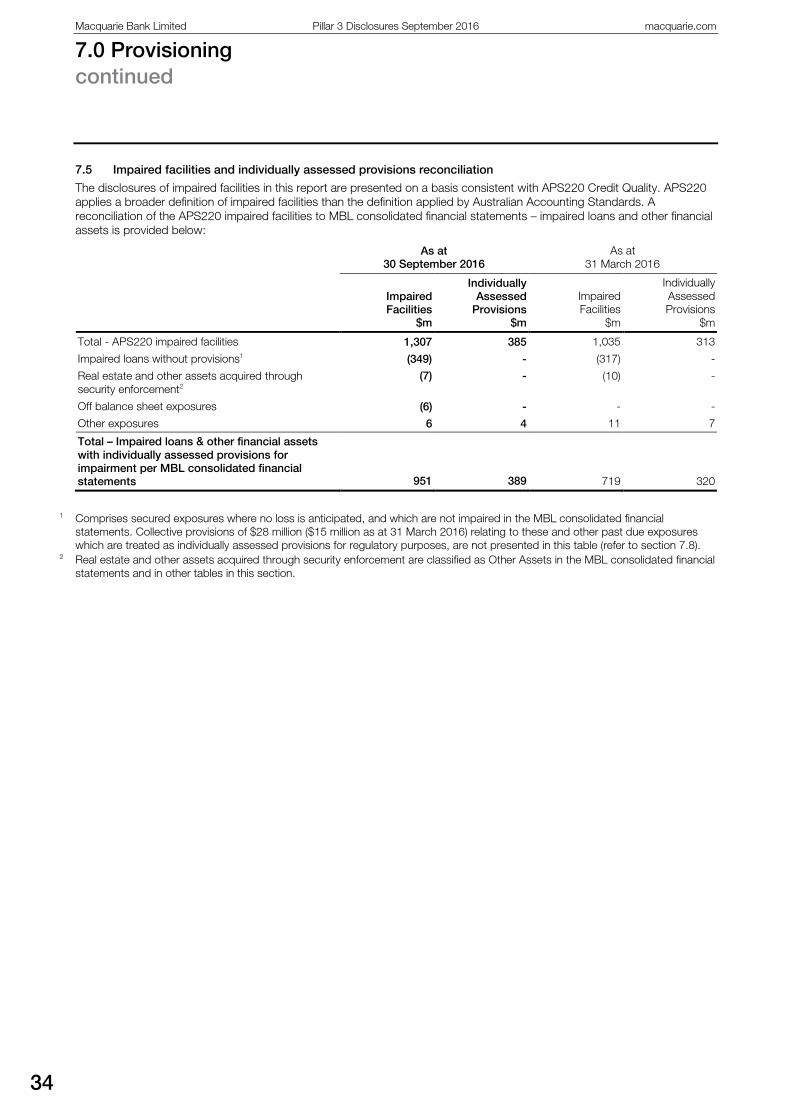
Macquarie Bank Limited Pillar 3 Disclosures September 2016 macquarie.com
7.0 Provisioning continued
34
7.5 Impaired facilities and individually assessed provisions reconciliation
The disclosures of impaired facilities in this report are presented on a basis consistent with APS220 Credit Quality. APS220 applies a broader definition of impaired facilities than the definition applied by Australian Accounting Standards. A reconciliation of the APS220 impaired facilities to MBL consolidated financial statements – impaired loans and other financial assets is provided below:
As at
30 September 2016 As at
31 March 2016
Impaired Facilities
$m
Individually Assessed
Provisions $m
Impaired Facilities
$m
Individually Assessed Provisions
$m
Total - APS220 impaired facilities 1,307 385 1,035 313
Impaired loans without provisions1 (349) - (317) -
Real estate and other assets acquired through security enforcement2
(7) - (10) -
Off balance sheet exposures (6) - - -
Other exposures 6 4 11 7
Total – Impaired loans & other financial assets with individually assessed provisions for impairment per MBL consolidated financial statements
951
389
719
320
1 Comprises secured exposures where no loss is anticipated, and which are not impaired in the MBL consolidated financial
statements. Collective provisions of $28 million ($15 million as at 31 March 2016) relating to these and other past due exposures which are treated as individually assessed provisions for regulatory purposes, are not presented in this table (refer to section 7.8).
2 Real estate and other assets acquired through security enforcement are classified as Other Assets in the MBL consolidated financial statements and in other tables in this section.

35
7.6 Provisions by Counterparty Type
The table below details impaired facilities, past due and individually assessed provisions.
APS 330 Table 7(f)
As at
30 September 2016 As at
31 March 2016
Impaired Facilities
$m
Past Due >90 days
$m
Individually Assessed
Provisions $m
Impaired Facilities
$m
Past Due >90 days
$m
Individually Assessed Provisions
$m
Subject to IRB approach
Corporate 848 30 (328) 635 355 (264)
SME Corporate 61 27 (13) 20 33 (9)
Bank - 7 - - 3 -
Residential Mortgages 182 82 (5) 176 73 (4)
Other Retail 91 - (21) 87 - (18)
Total IRB approach 1,182 146 (367) 918 464 (295)
Subject to Standardised approach
Residential Mortgages1 4 328 - 40 383 (11)
Other Retail 102 8 (17) 54 54 (6)
Total Standardised approach 106 336 (17) 94 437 (17)
Other Assets 19 - (1) 23 - (1)
Total 1,307 482 (385) 1,035 901 (313)
1 Past due > 90 days predominantly relates to defaulted exposures acquired at a discount in the CAF Lending business.
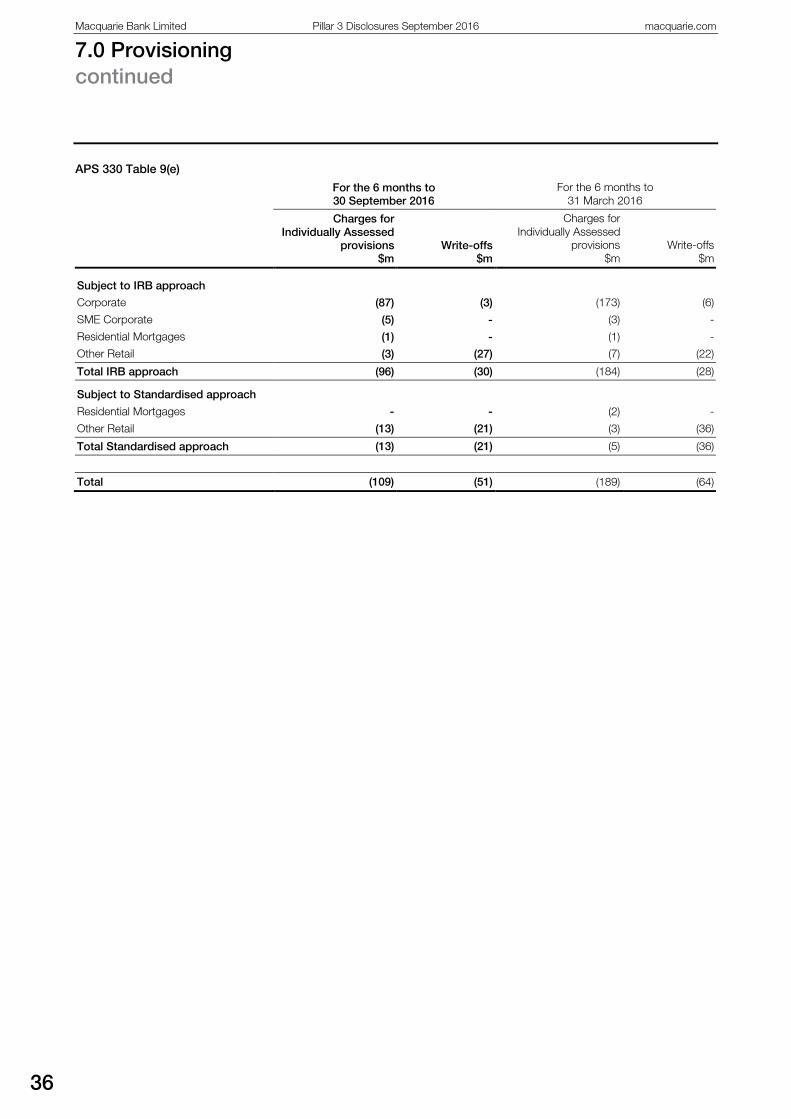
Macquarie Bank Limited Pillar 3 Disclosures September 2016 macquarie.com
7.0 Provisioning continued
36
APS 330 Table 9(e)
For the 6 months to 30 September 2016
For the 6 months to 31 March 2016
Charges for Individually Assessed
provisions $m
Write-offs $m
Charges for Individually Assessed
provisions $m
Write-offs $m
Subject to IRB approach
Corporate (87) (3) (173) (6)
SME Corporate (5) - (3) -
Residential Mortgages (1) - (1) -
Other Retail (3) (27) (7) (22)
Total IRB approach (96) (30) (184) (28)
Subject to Standardised approach
Residential Mortgages - - (2) -
Other Retail (13) (21) (3) (36)
Total Standardised approach (13) (21) (5) (36)
Total (109) (51) (189) (64)

37
7.7 Provisions by Geographic Region
The tables below split impaired facilities, past due and provisions by geographic region. Note that the geographic split has been based on the domicile of the risk counterparty.
APS 330 Table 7(g)
As at 30 September 2016
Geographic Region
Impaired Facilities
$m
Past due > 90 days
$m
Individually Assessed
Provisions $m
Collective Provisions
$m
Australia 632 123 (145) (231)
EMEA 76 333 (26) (67)
Americas 545 22 (197) (118)
Asia Pacific 54 4 (17) (1)
Total 1,307 482 (385) (417)
As at
31 March 2016
Geographic Region
Impaired Facilities
$m
Past due > 90 days
$m
Individually Assessed Provisions
$m
Collective Provisions
$m
Australia 552 480 (96) (242)
EMEA 60 384 (22) (75)
Americas 350 32 (157) (143)
Asia Pacific 73 5 (38) (2)
Total 1,035 901 (313) (462)
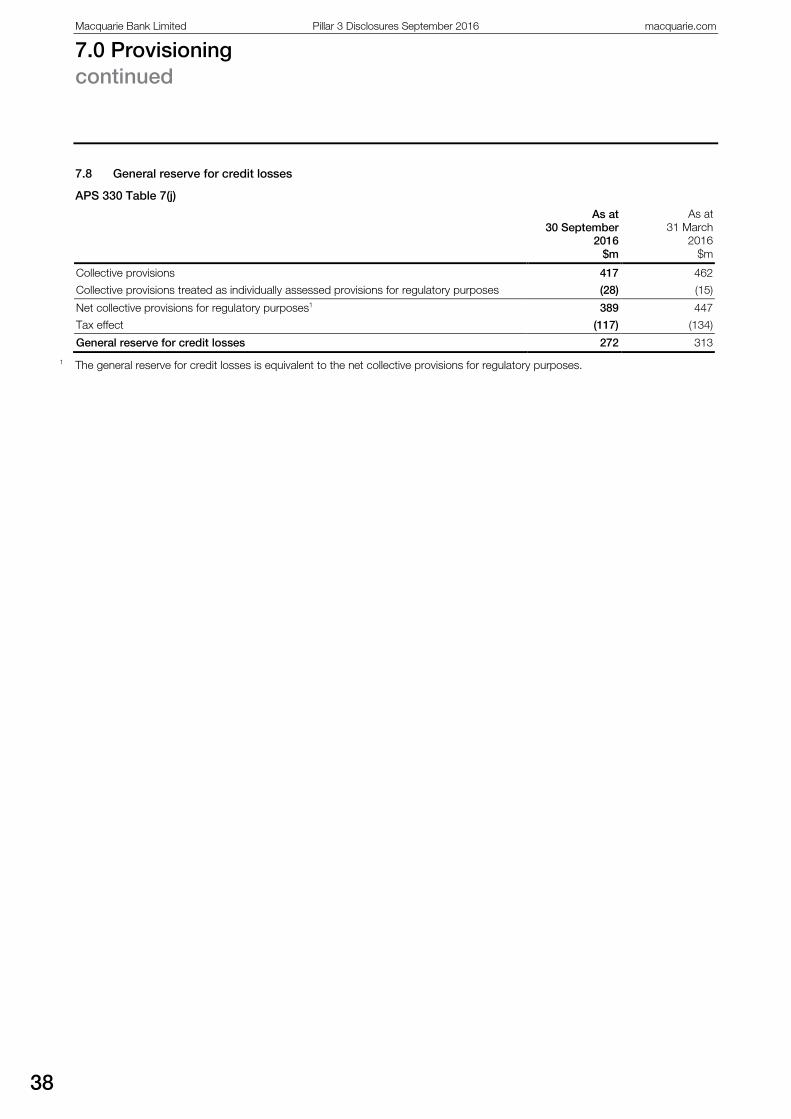
Macquarie Bank Limited Pillar 3 Disclosures September 2016 macquarie.com
7.0 Provisioning continued
38
7.8 General reserve for credit losses
APS 330 Table 7(j)
As at 30 September
2016 $m
As at 31 March
2016 $m
Collective provisions 417 462
Collective provisions treated as individually assessed provisions for regulatory purposes (28) (15)
Net collective provisions for regulatory purposes1 389 447
Tax effect (117) (134)
General reserve for credit losses 272 313
1 The general reserve for credit losses is equivalent to the net collective provisions for regulatory purposes.
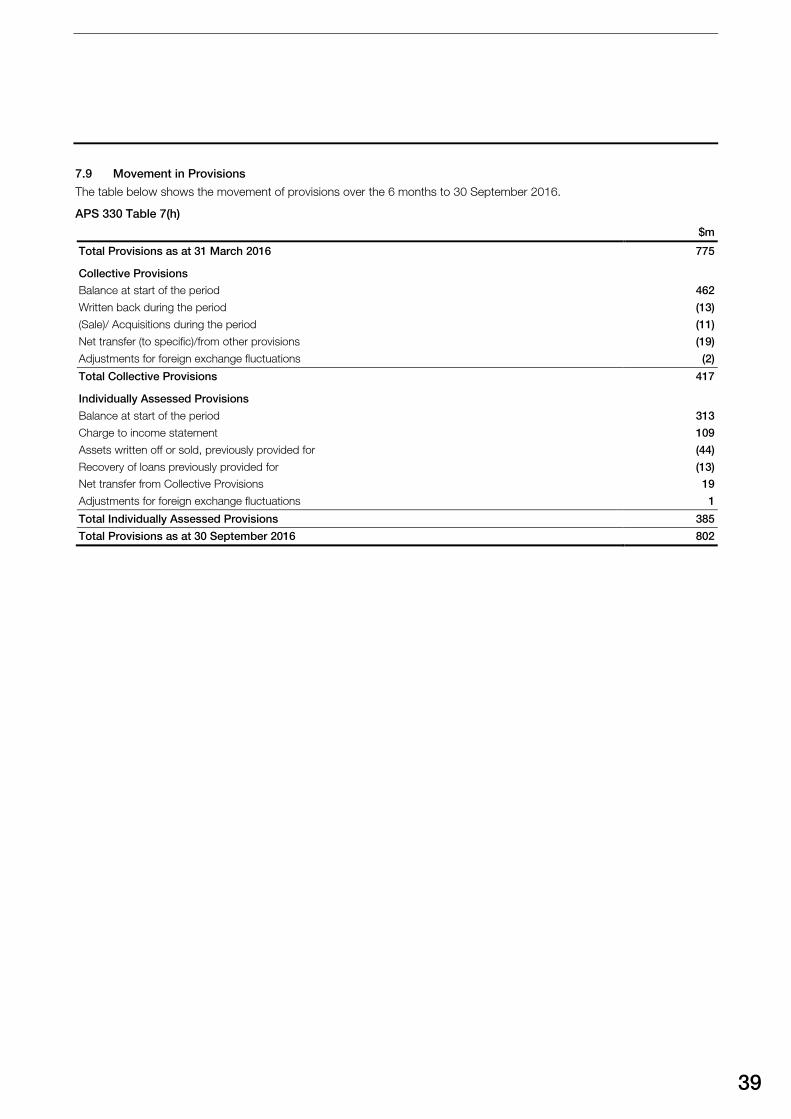
39
7.9 Movement in Provisions
The table below shows the movement of provisions over the 6 months to 30 September 2016.
APS 330 Table 7(h)
$m
Total Provisions as at 31 March 2016 775
Collective Provisions
Balance at start of the period 462
Written back during the period (13)
(Sale)/ Acquisitions during the period (11)
Net transfer (to specific)/from other provisions (19)
Adjustments for foreign exchange fluctuations (2)
Total Collective Provisions 417
Individually Assessed Provisions
Balance at start of the period 313
Charge to income statement 109
Assets written off or sold, previously provided for (44)
Recovery of loans previously provided for (13)
Net transfer from Collective Provisions 19
Adjustments for foreign exchange fluctuations 1
Total Individually Assessed Provisions 385
Total Provisions as at 30 September 2016 802

Macquarie Bank Limited Pillar 3 Disclosures September 2016 macquarie.com
7.0 Provisioning continued
40
7.10 Analysis of expected credit model performance versus actual results
The table below relates only to Macquarie’s portfolios measured under the IRB approach and compares actual results to the average estimate over the January 2008 to September 2016 period.
APS 330 Table 9(f)
PD Exposure at
default LGD
Portfolio Type Estimated
% Actual
% Estimate to
Actual Ratio Estimated
% Actual
% Corporate 1.52% 0.91% N/A1 N/A1 N/A1
SME Corporate 2.20% 1.43% N/A1 N/A1 N/A1
Sovereign 0.12% 0.00% N/A1 N/A1 N/A1
Bank 0.10% 0.00% N/A1 N/A1 N/A1
Residential Mortgages2 1.13% 1.26% 100% 20.50% 5.38%
Other Retail2 1.55% 1.33% 112% 48.05% 29.98%
1 Macquarie is accredited under the Foundation Internal Ratings Based Approach (FIRB). As the LGD and EAD assumptions under FIRB are set by APRA for these portfolio types, disclosure of actual against estimates does not facilitate meaningful assessment of the performance of internal rating processes for these portfolios.
2 Includes exposures disclosed as Retail SME.

8.0 Credit Risk Mitigation
41
8.1 Netting
Netting arises where a single legal obligation is created covering all transactions included in a netting agreement. The most common form of netting which Macquarie applies for these purposes is close-out netting.
Netting is applied to a counterparty balance only when appropriate documentation governing transactions between the Macquarie entity and the counterparty has been entered into, Legal Risk Management has confirmed that it is legally effective to net with that counterparty, and APRA ADI Prudential Standard APS 112 Capital Adequacy: Standardised Approach to Credit Risk (APS 112), has been complied with.
8.1.1 Collateral Valuation and Management
RMG Credit limits are set and the related exposures are calculated before taking any non-cash collateral into consideration other than for securities finance transactions where liquid financial instruments are an inherent part of the lending arrangement. Typically collateral is required for all but short-dated, vanilla trading activity.
A wide variety of collateral can be accepted depending on the counterparty and the nature of the exposure. Some of the most common forms are charges over:
– cash or gold deposits; – debt or equity securities; – company assets; and – commercial or residential property.
Guarantees are frequently requested from banks, parent or associated companies. Relative ratings between the obligor and guarantor are monitored as part of the regulatory capital calculation process as mitigation will cease to be eligible if the rating of the guarantor falls below that of the underlying obligor. Collateral taken in the form of tradeable securities is revalued daily by the same application systems which are used to trade those particular products. Credit default swaps are not a common form of credit risk mitigation. Macquarie policies ensure that all security is taken in conjunction with a formal written agreement which gives Macquarie direct and unconditional rights over the collateral in the event of default by the obligor.
To mitigate credit risk Macquarie makes frequent use of margining arrangements. In these cases, counterparties post collateral daily in the form of cash or liquid securities to cover outstanding trading positions. Macquarie also engages in reciprocal margining agreements with counterparties under ISDA or similar agreements where the Credit Support Annex can contain provisions whereby margining thresholds may vary in relation to the credit ratings of the respective parties. These thresholds are incorporated into one of the scenarios considered under the MGL Group liquidity policy which assesses the collateral and funding requirements in the event of a credit downgrade.
This is part of the general requirement of the MGL Group to be able to meet all obligations for a period of twelve months under both an individual and combined name and systemic challenge. The resultant increase in collateral requirements is included as an outflow in the scenarios - explicitly ensuring that Macquarie has sufficient funding coverage in this event.
Specific protocols surround the acceptance of real estate as collateral.
Prior to acceptance, any independent valuation must undergo a formal review process by which it is assessed for quality and adherence to policy and standing instructions. The escalation of this review and acceptance process will depend on:
– the type of property being valued; – the dollar value of the property being valued; and – the proposed loan-to-value ratio (LVR).
The value of all real estate collateral is assessed regularly and is re-valued where appropriate. The interval between re-valuation is contingent on the type of property, extent of the property’s encumbrance, the LVR at origination and the market conditions that have prevailed since the valuation was conducted. All prior claims on the property collateral are recorded and taken into consideration when calculating the available security value.
All details regarding security together with netting/margining rules are recorded in collateral management systems which support the operational control framework.
8.1.2 Wrong Way Risk
Specific wrong-way risk occurs when exposure to the counterparty is positively correlated with the counterparty’s probability of default. General wrong-way risk occurs when the probabilities of counterparty defaults are positively correlated with market risk factor movements. Macquarie considers these correlations as part of the credit assessment process.
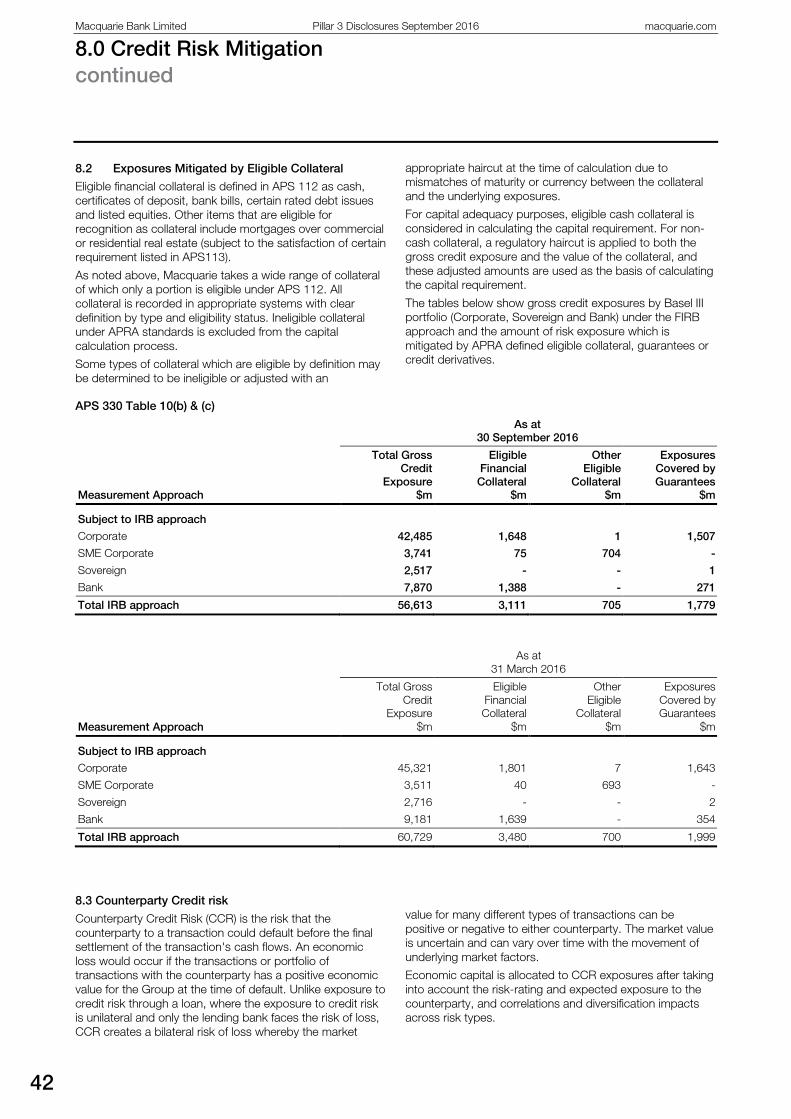
Macquarie Bank Limited Pillar 3 Disclosures September 2016 macquarie.com
8.0 Credit Risk Mitigation continued
42
8.2 Exposures Mitigated by Eligible Collateral
Eligible financial collateral is defined in APS 112 as cash, certificates of deposit, bank bills, certain rated debt issues and listed equities. Other items that are eligible for recognition as collateral include mortgages over commercial or residential real estate (subject to the satisfaction of certain requirement listed in APS113).
As noted above, Macquarie takes a wide range of collateral of which only a portion is eligible under APS 112. All collateral is recorded in appropriate systems with clear definition by type and eligibility status. Ineligible collateral under APRA standards is excluded from the capital calculation process.
Some types of collateral which are eligible by definition may be determined to be ineligible or adjusted with an
appropriate haircut at the time of calculation due to mismatches of maturity or currency between the collateral and the underlying exposures.
For capital adequacy purposes, eligible cash collateral is considered in calculating the capital requirement. For non-cash collateral, a regulatory haircut is applied to both the gross credit exposure and the value of the collateral, and these adjusted amounts are used as the basis of calculating the capital requirement.
The tables below show gross credit exposures by Basel III portfolio (Corporate, Sovereign and Bank) under the FIRB approach and the amount of risk exposure which is mitigated by APRA defined eligible collateral, guarantees or credit derivatives.
APS 330 Table 10(b) & (c)
As at
30 September 2016
Measurement Approach
Total Gross Credit
Exposure $m
Eligible Financial Collateral
$m
Other Eligible
Collateral $m
Exposures Covered by Guarantees
$m
Subject to IRB approach
Corporate 42,485 1,648 1 1,507
SME Corporate 3,741 75 704 -
Sovereign 2,517 - - 1
Bank 7,870 1,388 - 271
Total IRB approach 56,613 3,111 705 1,779
As at
31 March 2016
Measurement Approach
Total Gross Credit
Exposure $m
Eligible Financial Collateral
$m
Other Eligible
Collateral $m
Exposures Covered by Guarantees
$m
Subject to IRB approach
Corporate 45,321 1,801 7 1,643
SME Corporate 3,511 40 693 -
Sovereign 2,716 - - 2
Bank 9,181 1,639 - 354
Total IRB approach 60,729 3,480 700 1,999
8.3 Counterparty Credit risk
Counterparty Credit Risk (CCR) is the risk that the counterparty to a transaction could default before the final settlement of the transaction's cash flows. An economic loss would occur if the transactions or portfolio of transactions with the counterparty has a positive economic value for the Group at the time of default. Unlike exposure to credit risk through a loan, where the exposure to credit risk is unilateral and only the lending bank faces the risk of loss, CCR creates a bilateral risk of loss whereby the market
value for many different types of transactions can be positive or negative to either counterparty. The market value is uncertain and can vary over time with the movement of underlying market factors.
Economic capital is allocated to CCR exposures after taking into account the risk-rating and expected exposure to the counterparty, and correlations and diversification impacts across risk types.

43
As at 30 September 2016, a unilateral one-notch and two-notch downgrade in the MBL’s rating would have resulted in a further $362 million and $75 million of collateral being posted to other counterparties respectively.
Collateral stress tests are also conducted on the MBL’s counterparties so that it can monitor for likely collateral stresses in the event of a counterparty downgrade.
APS 330 Table 11(b)
Credit equivalent amounts for counterparty exposures
As at 30 September 2016
$m
Replacement cost 13,975
Potential future exposure 12,086
Gross credit equivalent amount 26,061
Comprising:
Interest rate contracts 3,545
Credit derivative contracts 196
Equity contracts 2,189
Foreign exchange and gold contracts 7,644
Commodities and precious metals contracts 12,487
Gross credit equivalent amount 26,061
Less: Effect of netting arrangements 12,842
Credit equivalent amount after netting 13,219
Less: Collateral amount
Eligible financial collateral 2,403
Other eligible collateral -
Net credit equivalent amount 10,816
APS 330 Table 11(c)
As at
30 September 2016
Notional amount of credit derivatives Protection Bought $m Protection Sold $m
Own credit portfolio 1,973 3,474
Client intermediation activities - -
Total 1,973 3,474
Credit default swaps (CDS) 1,779 3,095
Total return swaps 194 379
Total 1,973 3,474

Macquarie Bank Limited Pillar 3 Disclosures September 2016 macquarie.com
9.0 Securitisation
44
9.1 Overview
A securitisation is defined by APRA ADI Prudential Standard APS 120 Securitisation (APS 120) as “a structure where the cash flow from a pool is used to service obligations to at least two different tranches or classes of creditors (typically holders of debt securities), with each class or tranche reflecting a different degree of credit risk (i.e. one class of creditors is entitled to receive payments from the pool before another class of creditors).”
Macquarie engages in a range of activities in the securitisation market, including playing the following roles:
– Originator, Arranger, Manager and Servicer on Macquarie mortgage and auto and equipment finance securitisation programs;
– Lead Manager on Macquarie originated and third party securitisations;
– Swap Counterparty to Macquarie originated and third party securitisations;
– Warehouse facility provider to several third-party originators;
– Liquidity facility provider to several third-party originators and provider of redraw facilities to all Macquarie Mortgage SPVs; and
– Investor in third-party securitisation transactions.
Macquarie has also established contingent liquidity securitisation SPVs that issue and hold Residential Mortgage Backed Securities (RMBS) eligible for repurchase with the RBA.
Macquarie may, as sponsor, use the following types of special purpose vehicles to securitise third-party exposures:
– trusts, and – special purpose companies,
issuing RMBS or asset-backed securities (ABS).
Following are the affiliated entities which Macquarie manages or advises and which can invest either in the securitisation exposures that Macquarie has securitised or in SPVs in relation to whom Macquarie performs any of the above roles:
– Macquarie Life Superannuation Approved Deposit Fund;
– Macquarie Global Income Opportunities Fund;
Any investments by these entities (if any) in securitisation exposures that Macquarie has securitised or sponsored does not form a majority of their investment portfolios and
their investment represents a small percentage of the relevant securitisation issue.
9.1.1 Securitisation Risk Management
RMG is responsible for overseeing the management of the risk arising from all securitisation exposures. RMG approves all securitisation transactions and exposures arising from securitisation activity. RMG Prudential, Capital & Markets (PCM) reviews transactions where Macquarie acts as originator, manager or sponsor to ensure compliance with APS 120 and other regulations. RMG Credit sets limits on securitisation exposures and reviews transactions to identify all risks involved. RMG Market Risk reviews market exposures associated with securitisations, such as swaps, and other exposures held in the trading book. Macquarie’s primary risk mitigant is the limit framework and approval process governing exposures to securitisations.
In addition to credit risk, securitised assets can be subject to liquidity risk, interest rate risk, and in some instances FX risk. The nature and scale of these risks varies from transaction to transaction. All securitised assets are subject to a degree of operational risk associated with documentation and the collection of cashflows.
Securitisation exposures are measured daily and monitored by RMG. RMG completes an annual review of all securitisation exposures and limits. Regulatory capital is calculated on all securitisation exposures using the available approaches in APS116 and APS 120 and economic capital is calculated on all securitisation exposures across the Macquarie Bank Group.
Macquarie applies the following approaches to the calculation of regulatory capital for securitisation exposures:
– the Ratings Based approach; – the Inferred Ratings Based approach; – the supervisory formula; and – the approach for eligible facilities under APS 120
Attachment D paragraph 39.
If the exposure is not covered by one of the above approaches it is assigned a 1250% risk weight.
S&P, Moody’s and Fitch Ratings have all been used to rate Macquarie securitisations. They have been used to rate notes and commercial paper issued by Macquarie securitisation and Commercial Paper programs.
Mitigation of credit risk on securitisation exposures is performed in accordance with Macquarie’s overall credit risk mitigation policy. Details of the policy can be found in section 8.0 of this disclosure.
45
9.1.2 Accounting for Securitisation
Securitisation transactions undertaken by Macquarie are accounted for in accordance with Australian Accounting Standards (AAS). As noted above, securitised positions are managed in a number of SPVs.
Where these SPVs are deconsolidated for regulatory purposes under APS 120, they still need to be assessed under AAS to determine whether these SPVs should be considered part of the consolidated accounting group.
In Macquarie’s case, it has been determined that under accounting standards, Macquarie should consolidate Macquarie mortgage SPVs and auto and equipment finance SPVs. The assets and liabilities in these SPVs detailed in the tables within this section are consolidated into the Macquarie accounting consolidated group. However in most cases, these SPVs are deconsolidated for APRA reporting purposes.
Banking book securitised assets consolidated by Macquarie are held on the balance sheet at amortised cost. Macquarie accounts for securitisation transactions at fair value, which means that generally there is no gain or loss booked on the sale of the mortgage assets to the SPVs. Securitised exposures in the trading book are held at market value. There has been no material change to the methods of valuation from the prior period.
If there are circumstances where Macquarie is required to provide financial support for securitised assets, a relevant liability is recognised on the Bank’s balance sheet. Where no current liability exists, but could in the future, the likelihood of this arising is assessed and a contingent liability disclosed as required. This does not give rise to an actual liability being recognised on the Bank’s balance sheet.
Further information on accounting policies as they relate to securitisation exposures, including key assumptions and inputs to valuation processes, can be found in the Macquarie Bank Limited annual report.
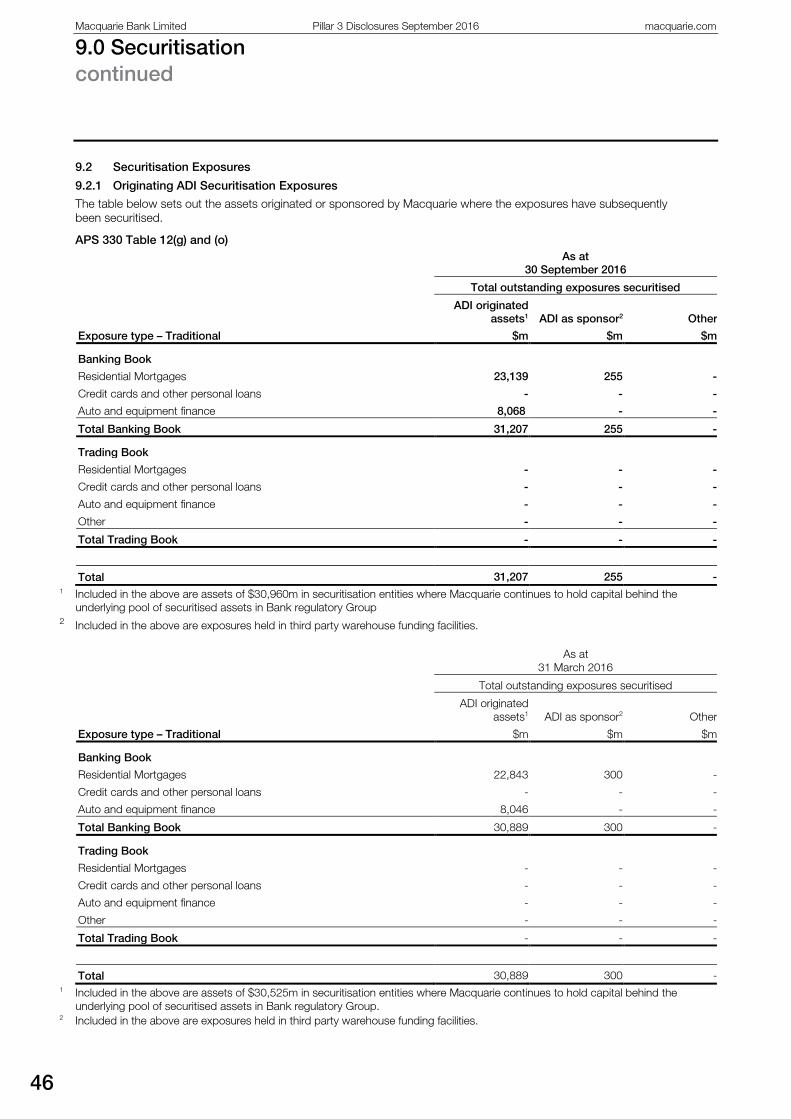
Macquarie Bank Limited Pillar 3 Disclosures September 2016 macquarie.com
9.0 Securitisation continued
46
9.2 Securitisation Exposures
9.2.1 Originating ADI Securitisation Exposures
The table below sets out the assets originated or sponsored by Macquarie where the exposures have subsequently been securitised.
APS 330 Table 12(g) and (o)
As at 30 September 2016
Total outstanding exposures securitised
Exposure type – Traditional
ADI originated assets1
$m
ADI as sponsor2
$m
Other
$m
Banking Book
Residential Mortgages 23,139 255 -
Credit cards and other personal loans - - -
Auto and equipment finance 8,068 - -
Total Banking Book 31,207 255 -
Trading Book
Residential Mortgages - - -
Credit cards and other personal loans - - -
Auto and equipment finance - - -
Other - - -
Total Trading Book - - -
Total 31,207 255 - 1 Included in the above are assets of $30,960m in securitisation entities where Macquarie continues to hold capital behind the
underlying pool of securitised assets in Bank regulatory Group 2 Included in the above are exposures held in third party warehouse funding facilities.
As at
31 March 2016
Total outstanding exposures securitised
Exposure type – Traditional
ADI originated assets1
$m
ADI as sponsor2
$m
Other
$m
Banking Book
Residential Mortgages 22,843 300 -
Credit cards and other personal loans - - -
Auto and equipment finance 8,046 - -
Total Banking Book 30,889 300 -
Trading Book
Residential Mortgages - - -
Credit cards and other personal loans - - -
Auto and equipment finance - - -
Other - - -
Total Trading Book - - -
Total 30,889 300 - 1 Included in the above are assets of $30,525m in securitisation entities where Macquarie continues to hold capital behind the
underlying pool of securitised assets in Bank regulatory Group. 2 Included in the above are exposures held in third party warehouse funding facilities.

47
9.2.2 Performance of assets securitised
The assets below have been originated and securitised by Macquarie. The table below identifies the total exposures and impairment of these assets.
APS 330 Table 12(h)
As at
30 September 2016
Total outstanding exposures securitised
Exposure type
Total outstanding exposures1
$m Impaired2
$m Past due3
$m
ADI recognised loss from
exposures securitised
$m
Residential Mortgages 23,139 185 89 -
Credit cards and other personal loans - - - -
Auto and equipment finance 8,068 66 - -
Total 31,207 251 89 - 1 Included in the above are assets of $30,960m in securitisation entities where Macquarie continues to hold capital behind the
underlying pool of securitised assets in Bank regulatory Group. 2 Included in the above are impaired facilities of $243m in securitisation entities where Macquarie continues to hold capital behind the
underlying pool of securitised assets in Bank regulatory Group. 3 Included in the above are past due > 90 days facilities of $87m in securitisation entities where Macquarie continues to hold
capital behind the underlying pool of securitised assets in Bank regulatory Group.
As at
31 March 2016
Total outstanding exposures securitised
Exposure type
Total outstanding exposures1
$m Impaired2
$m Past due3
$m
ADI recognised loss from
exposures securitised
$m
Residential Mortgages 22,843 185 84 -
Credit cards and other personal loans - - - -
Auto and equipment finance 8,046 66 - -
Total 30,889 251 84 - 1 Included in the above are assets of $30,525m in securitisation entities where Macquarie continues to hold capital behind the
underlying pool of securitised assets in Bank regulatory Group. 2 Included in the above are impaired facilities of $237m in securitisation entities where Macquarie continues to hold capital behind the
underlying pool of securitised assets in Bank regulatory Group. 3 Included in the above are past due > 90 days facilities of $77m in securitisation entities where Macquarie continues to hold capital
behind the underlying pool of securitised assets in Bank regulatory Group.
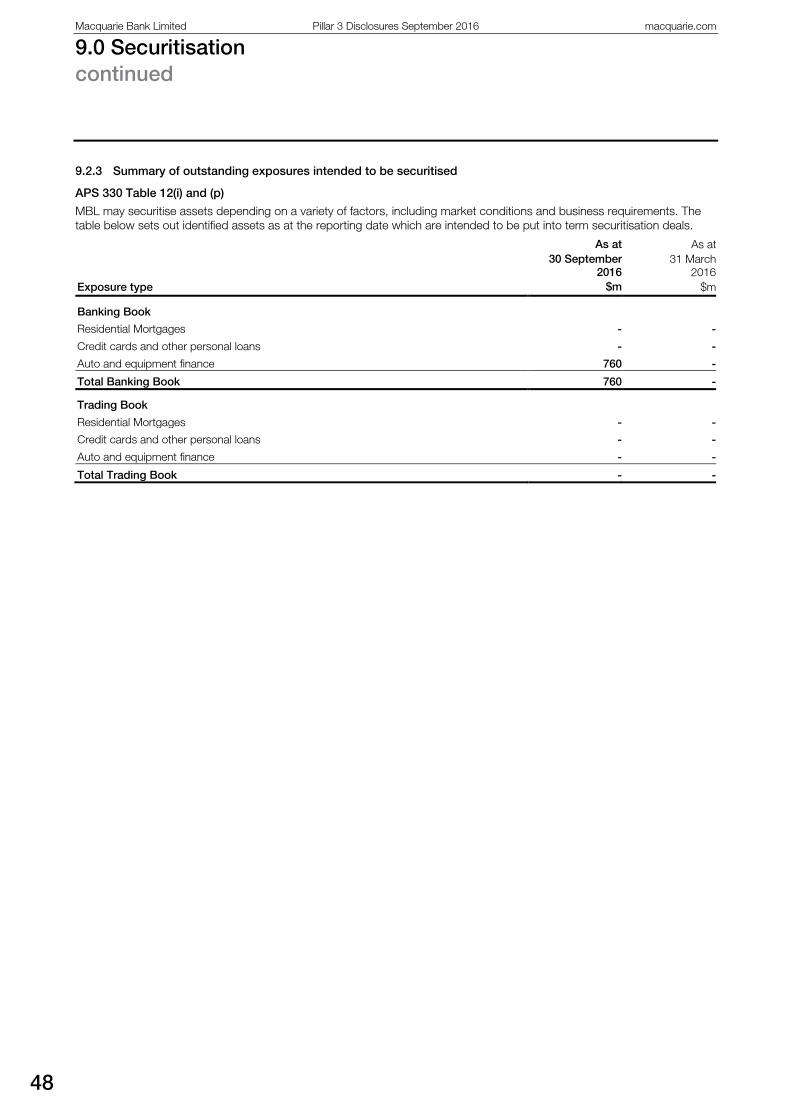
Macquarie Bank Limited Pillar 3 Disclosures September 2016 macquarie.com
9.0 Securitisation continued
48
9.2.3 Summary of outstanding exposures intended to be securitised
APS 330 Table 12(i) and (p)
MBL may securitise assets depending on a variety of factors, including market conditions and business requirements. The table below sets out identified assets as at the reporting date which are intended to be put into term securitisation deals.
Exposure type
As at 30 September
2016 $m
As at 31 March
2016 $m
Banking Book
Residential Mortgages - -
Credit cards and other personal loans - -
Auto and equipment finance 760 -
Total Banking Book 760 -
Trading Book
Residential Mortgages - -
Credit cards and other personal loans - -
Auto and equipment finance - -
Total Trading Book - -
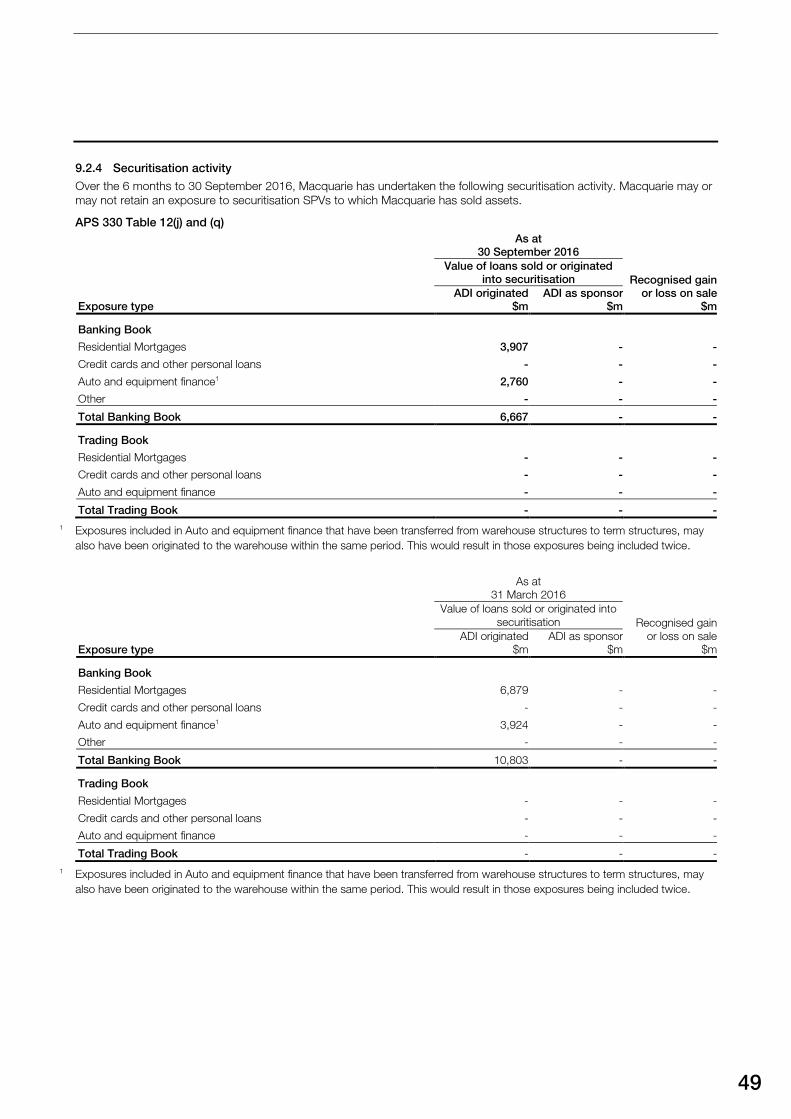
49
9.2.4 Securitisation activity
Over the 6 months to 30 September 2016, Macquarie has undertaken the following securitisation activity. Macquarie may or may not retain an exposure to securitisation SPVs to which Macquarie has sold assets.
APS 330 Table 12(j) and (q)
As at 30 September 2016
Recognised gain or loss on sale
$m
Value of loans sold or originated into securitisation
Exposure type ADI originated
$m ADI as sponsor
$m
Banking Book
Residential Mortgages 3,907 - -
Credit cards and other personal loans - - -
Auto and equipment finance1 2,760 - -
Other - - -
Total Banking Book 6,667 - -
Trading Book
Residential Mortgages - - -
Credit cards and other personal loans - - -
Auto and equipment finance - - -
Total Trading Book - - - 1 Exposures included in Auto and equipment finance that have been transferred from warehouse structures to term structures, may
also have been originated to the warehouse within the same period. This would result in those exposures being included twice.
As at 31 March 2016
Recognised gain or loss on sale
$m
Value of loans sold or originated into securitisation
Exposure type ADI originated
$m ADI as sponsor
$m
Banking Book
Residential Mortgages 6,879 - -
Credit cards and other personal loans - - -
Auto and equipment finance1 3,924 - -
Other - - -
Total Banking Book 10,803 - -
Trading Book
Residential Mortgages - - -
Credit cards and other personal loans - - -
Auto and equipment finance - - -
Total Trading Book - - - 1 Exposures included in Auto and equipment finance that have been transferred from warehouse structures to term structures, may
also have been originated to the warehouse within the same period. This would result in those exposures being included twice.
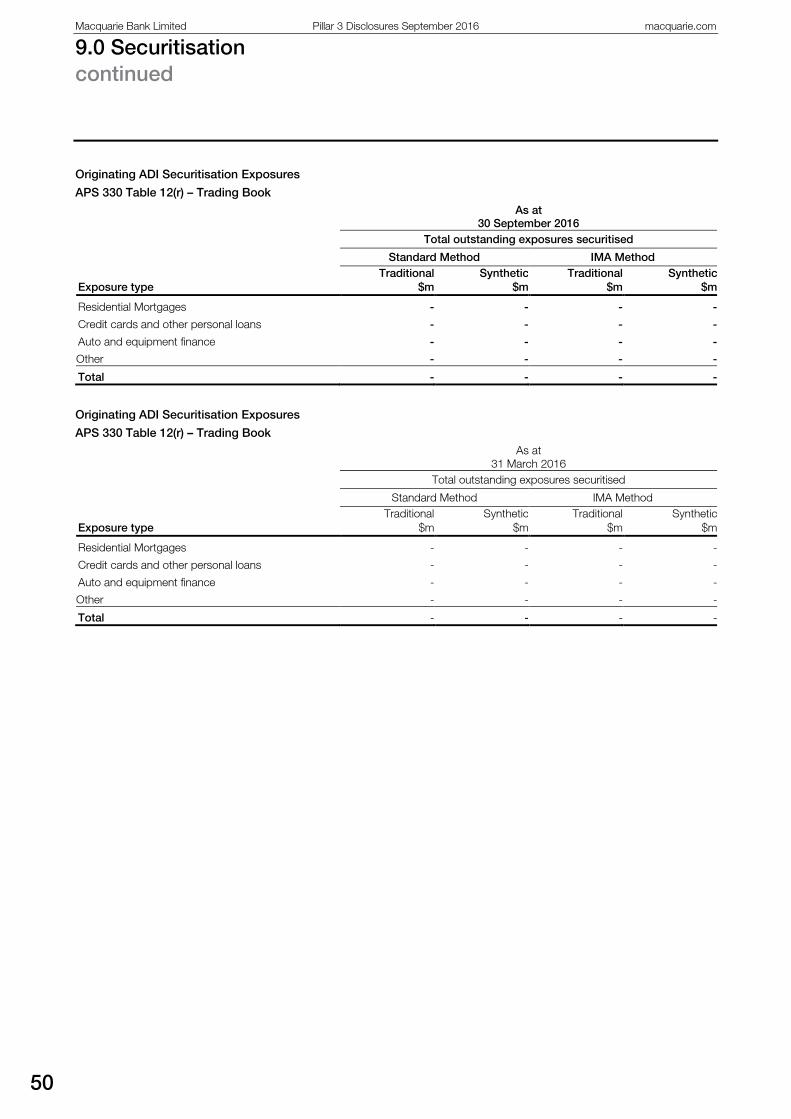
Macquarie Bank Limited Pillar 3 Disclosures September 2016 macquarie.com
9.0 Securitisation continued
50
Originating ADI Securitisation Exposures
APS 330 Table 12(r) – Trading Book
As at 30 September 2016
Total outstanding exposures securitised
Standard Method IMA Method
Exposure type Traditional
$m Synthetic
$m Traditional
$m Synthetic
$m
Residential Mortgages - - - -
Credit cards and other personal loans - - - -
Auto and equipment finance - - - -
Other - - - -
Total - - - -
Originating ADI Securitisation Exposures
APS 330 Table 12(r) – Trading Book
As at 31 March 2016
Total outstanding exposures securitised
Standard Method IMA Method
Exposure type Traditional
$m Synthetic
$m Traditional
$m Synthetic
$m
Residential Mortgages - - - -
Credit cards and other personal loans - - - -
Auto and equipment finance - - - -
Other - - - -
Total - - - -
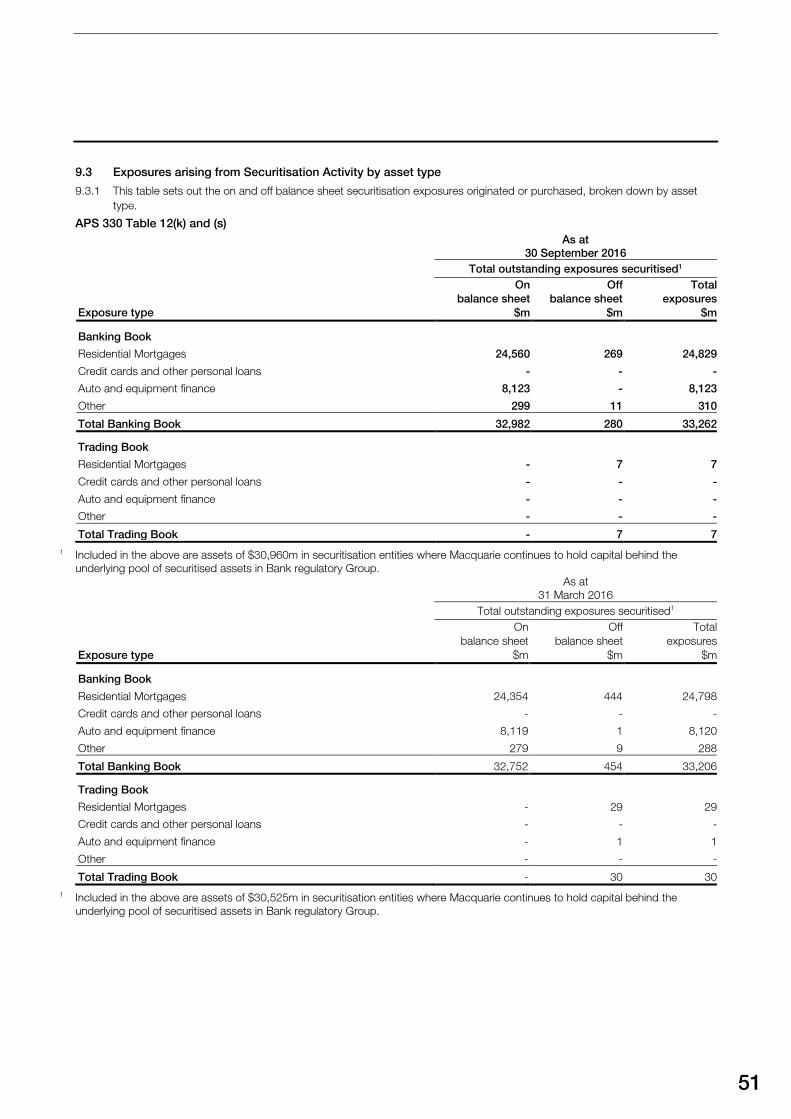
51
9.3 Exposures arising from Securitisation Activity by asset type
9.3.1 This table sets out the on and off balance sheet securitisation exposures originated or purchased, broken down by asset type.
APS 330 Table 12(k) and (s)
As at
30 September 2016
Total outstanding exposures securitised1
Exposure type
On balance sheet
$m
Off balance sheet
$m
Total exposures
$m
Banking Book
Residential Mortgages 24,560 269 24,829
Credit cards and other personal loans - - -
Auto and equipment finance 8,123 - 8,123
Other 299 11 310
Total Banking Book 32,982 280 33,262
Trading Book
Residential Mortgages - 7 7
Credit cards and other personal loans - - -
Auto and equipment finance - - -
Other - - -
Total Trading Book - 7 7 1 Included in the above are assets of $30,960m in securitisation entities where Macquarie continues to hold capital behind the
underlying pool of securitised assets in Bank regulatory Group.
As at
31 March 2016
Total outstanding exposures securitised1
Exposure type
On balance sheet
$m
Off balance sheet
$m
Total exposures
$m
Banking Book
Residential Mortgages 24,354 444 24,798
Credit cards and other personal loans - - -
Auto and equipment finance 8,119 1 8,120
Other 279 9 288
Total Banking Book 32,752 454 33,206
Trading Book
Residential Mortgages - 29 29
Credit cards and other personal loans - - -
Auto and equipment finance - 1 1
Other - - -
Total Trading Book - 30 30 1 Included in the above are assets of $30,525m in securitisation entities where Macquarie continues to hold capital behind the
underlying pool of securitised assets in Bank regulatory Group.
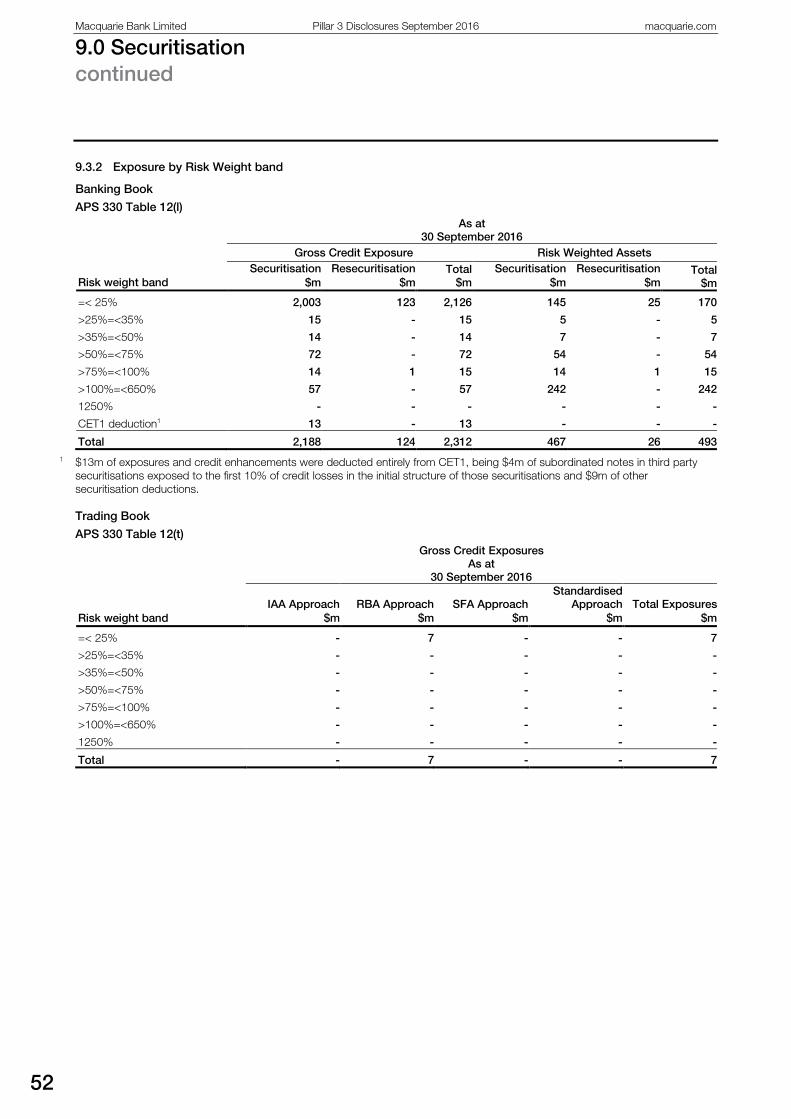
Macquarie Bank Limited Pillar 3 Disclosures September 2016 macquarie.com
9.0 Securitisation continued
52
9.3.2 Exposure by Risk Weight band
Banking Book
APS 330 Table 12(l)
As at 30 September 2016
Gross Credit Exposure Risk Weighted Assets
Risk weight band Securitisation
$m Resecuritisation
$m Total
$m Securitisation
$m Resecuritisation
$m Total
$m
=< 25% 2,003 123 2,126 145 25 170
>25%=<35% 15 - 15 5 - 5
>35%=<50% 14 - 14 7 - 7
>50%=<75% 72 - 72 54 - 54
>75%=<100% 14 1 15 14 1 15
>100%=<650% 57 - 57 242 - 242
1250% - - - - - -
CET1 deduction1 13 - 13 - - -
Total 2,188 124 2,312 467 26 493 1 $13m of exposures and credit enhancements were deducted entirely from CET1, being $4m of subordinated notes in third party
securitisations exposed to the first 10% of credit losses in the initial structure of those securitisations and $9m of other securitisation deductions.
Trading Book
APS 330 Table 12(t)
Gross Credit Exposures
As at 30 September 2016
Risk weight band IAA Approach
$m RBA Approach
$m SFA Approach
$m
Standardised Approach
$m Total Exposures
$m
=< 25% - 7 - - 7
>25%=<35% - - - - -
>35%=<50% - - - - -
>50%=<75% - - - - -
>75%=<100% - - - - -
>100%=<650% - - - - -
1250% - - - - -
Total - 7 - - 7
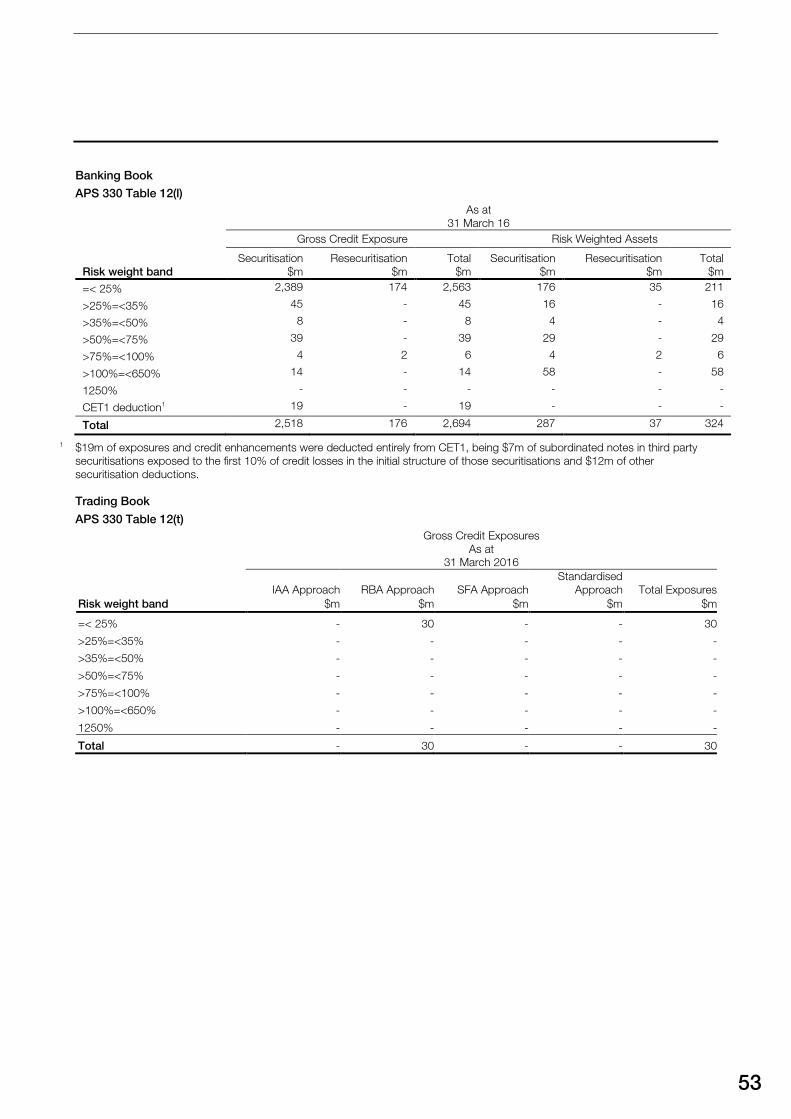
53
Banking Book
APS 330 Table 12(l)
As at 31 March 16
Gross Credit Exposure Risk Weighted Assets
Risk weight band Securitisation
$m Resecuritisation
$m Total
$m Securitisation
$m Resecuritisation
$m Total
$m
=< 25% 2,389 174 2,563 176 35 211
>25%=<35% 45 - 45 16 - 16
>35%=<50% 8 - 8 4 - 4
>50%=<75% 39 - 39 29 - 29
>75%=<100% 4 2 6 4 2 6
>100%=<650% 14 - 14 58 - 58
1250% - - - - - -
CET1 deduction1 19 - 19 - - -
Total 2,518 176 2,694 287 37 324
1 $19m of exposures and credit enhancements were deducted entirely from CET1, being $7m of subordinated notes in third party securitisations exposed to the first 10% of credit losses in the initial structure of those securitisations and $12m of other securitisation deductions.
Trading Book
APS 330 Table 12(t)
Gross Credit Exposures
As at 31 March 2016
Risk weight band IAA Approach
$m RBA Approach
$m SFA Approach
$m
Standardised Approach
$m Total Exposures
$m
=< 25% - 30 - - 30
>25%=<35% - - - - -
>35%=<50% - - - - -
>50%=<75% - - - - -
>75%=<100% - - - - -
>100%=<650% - - - - -
1250% - - - - -
Total - 30 - - 30
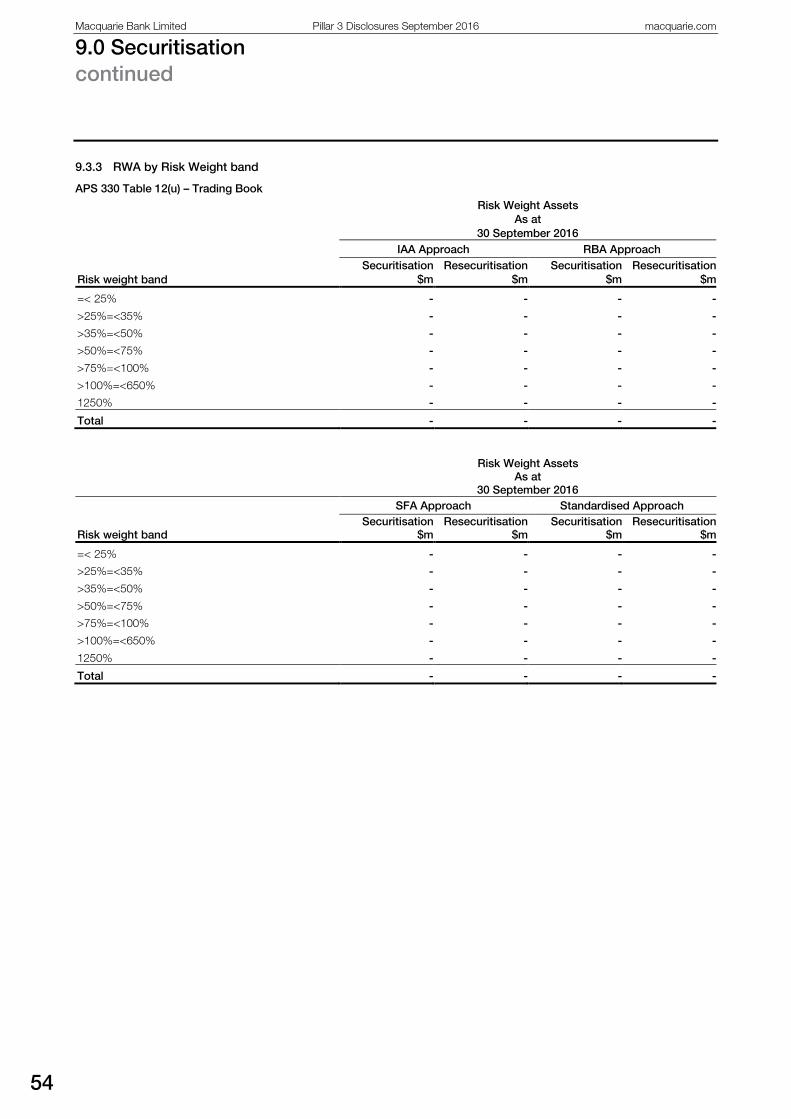
Macquarie Bank Limited Pillar 3 Disclosures September 2016 macquarie.com
9.0 Securitisation continued
54
9.3.3 RWA by Risk Weight band
APS 330 Table 12(u) – Trading Book Risk Weight Assets
As at 30 September 2016
IAA Approach RBA Approach
Risk weight band Securitisation
$m Resecuritisation
$m Securitisation
$m Resecuritisation
$m
=< 25% - - - -
>25%=<35% - - - -
>35%=<50% - - - -
>50%=<75% - - - -
>75%=<100% - - - -
>100%=<650% - - - -
1250% - - - -
Total - - - -
Risk Weight Assets
As at 30 September 2016
SFA Approach Standardised Approach
Risk weight band Securitisation
$m Resecuritisation
$m Securitisation
$m Resecuritisation
$m
=< 25% - - - -
>25%=<35% - - - -
>35%=<50% - - - -
>50%=<75% - - - -
>75%=<100% - - - -
>100%=<650% - - - -
1250% - - - -
Total - - - -

55
APS 330 Table 12(u) – Trading Book continued Risk Weight Assets
As at 31 March 2016
IAA Approach RBA Approach
Risk weight band Securitisation
$m Resecuritisation
$m Securitisation
$m Resecuritisation
$m
=< 25% - - - 1
>25%=<35% - - - -
>35%=<50% - - - -
>50%=<75% - - - -
>75%=<100% - - - -
>100%=<650% - - - -
1250% (Deduction) - - - -
Total - - - 1
Risk Weight Assets
As at 31 March 2016
SFA Approach Standardised Approach
Risk weight band Securitisation
$m Resecuritisation
$m Securitisation
$m Resecuritisation
$m
=< 25% - - - -
>25%=<35% - - - -
>35%=<50% - - - -
>50%=<75% - - - -
>75%=<100% - - - -
>100%=<650% - - - -
1250% (Deduction) - - - -
Total - - - -
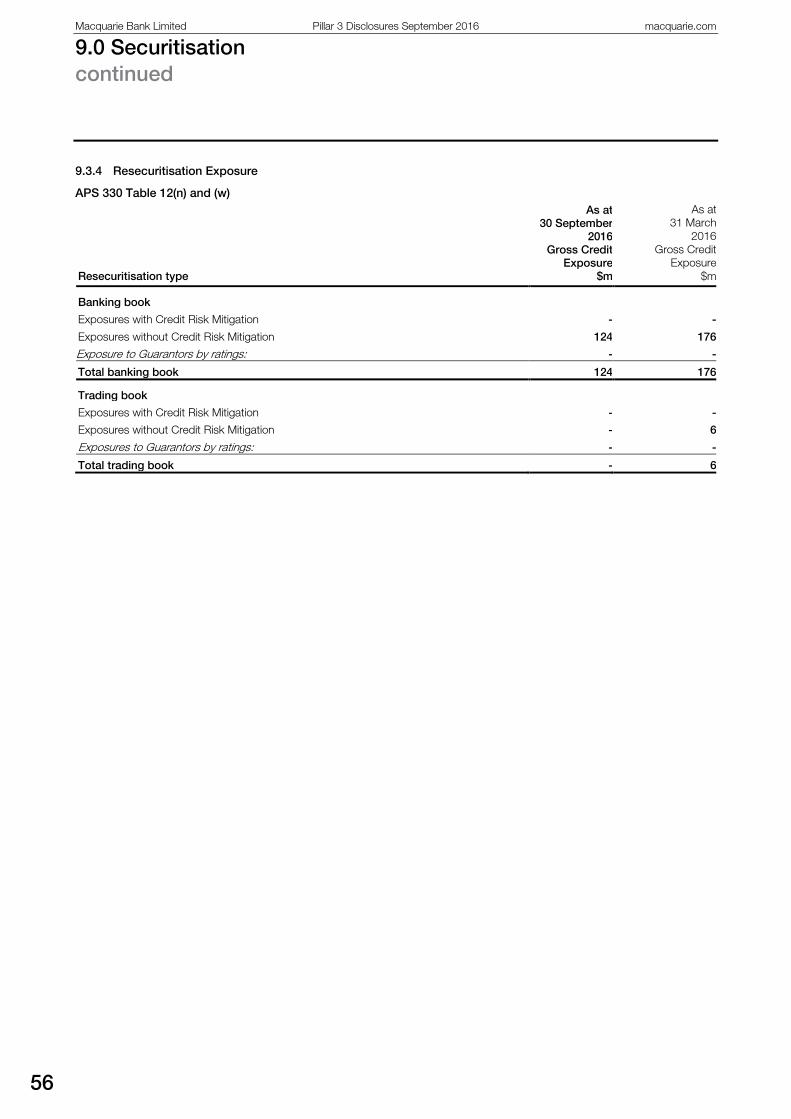
Macquarie Bank Limited Pillar 3 Disclosures September 2016 macquarie.com
9.0 Securitisation continued
56
9.3.4 Resecuritisation Exposure
APS 330 Table 12(n) and (w)
Resecuritisation type
As at 30 September
2016 Gross Credit
Exposure $m
As at 31 March
2016 Gross Credit
Exposure $m
Banking book
Exposures with Credit Risk Mitigation - -
Exposures without Credit Risk Mitigation 124 176
Exposure to Guarantors by ratings: - -
Total banking book 124 176
Trading book
Exposures with Credit Risk Mitigation - -
Exposures without Credit Risk Mitigation - 6
Exposures to Guarantors by ratings: - -
Total trading book - 6
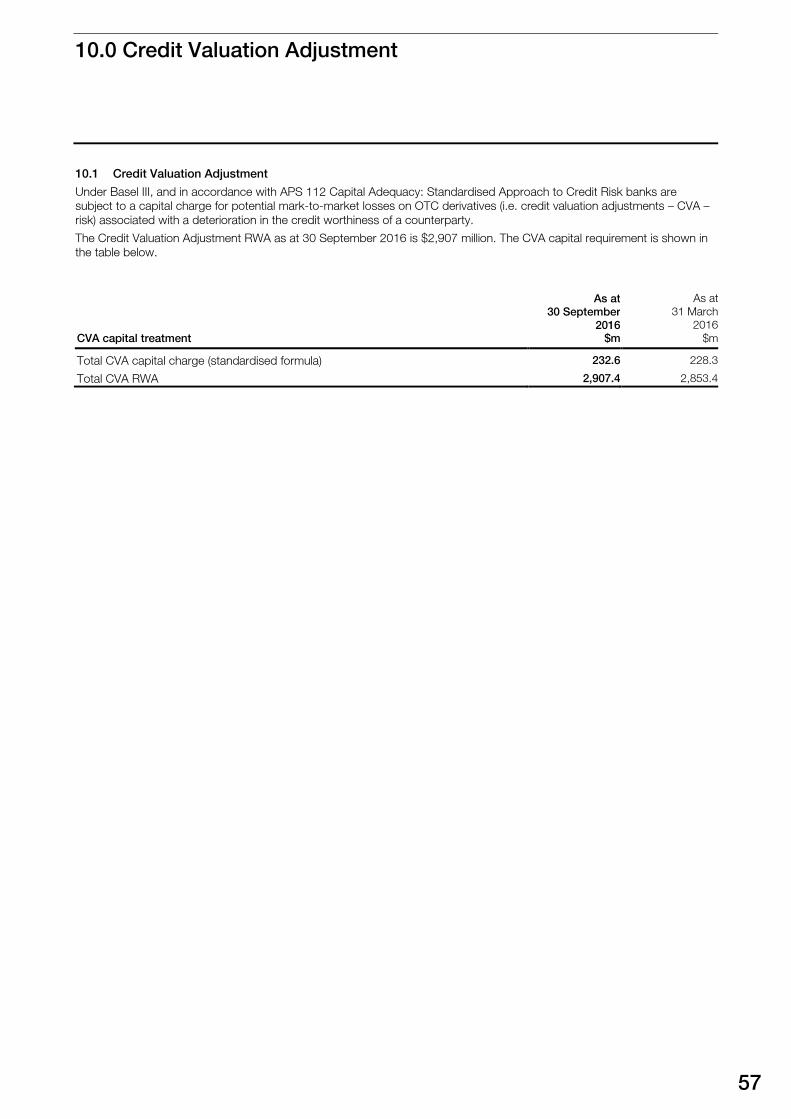
10.0 Credit Valuation Adjustment
57
10.1 Credit Valuation Adjustment
Under Basel III, and in accordance with APS 112 Capital Adequacy: Standardised Approach to Credit Risk banks are subject to a capital charge for potential mark-to-market losses on OTC derivatives (i.e. credit valuation adjustments – CVA – risk) associated with a deterioration in the credit worthiness of a counterparty.
The Credit Valuation Adjustment RWA as at 30 September 2016 is $2,907 million. The CVA capital requirement is shown in the table below.
CVA capital treatment
As at 30 September
2016 $m
As at 31 March
2016 $m
Total CVA capital charge (standardised formula) 232.6 228.3
Total CVA RWA 2,907.4 2,853.4
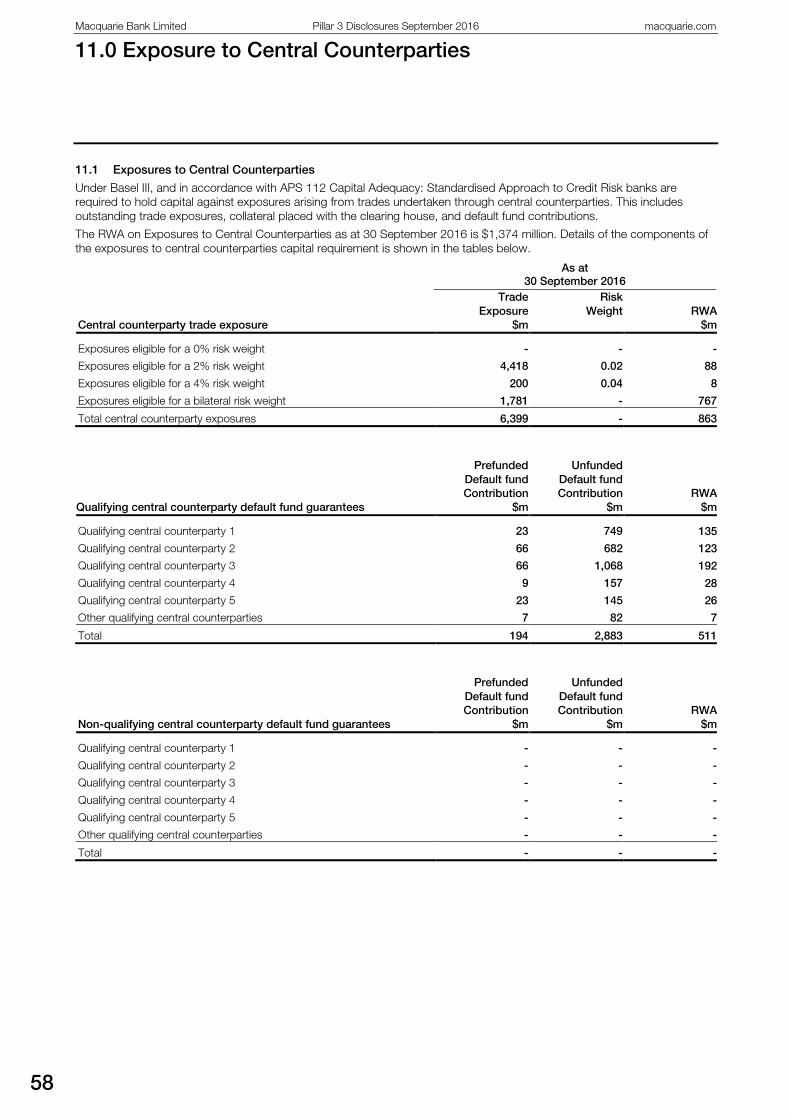
Macquarie Bank Limited Pillar 3 Disclosures September 2016 macquarie.com
11.0 Exposure to Central Counterparties
58
11.1 Exposures to Central Counterparties
Under Basel III, and in accordance with APS 112 Capital Adequacy: Standardised Approach to Credit Risk banks are required to hold capital against exposures arising from trades undertaken through central counterparties. This includes outstanding trade exposures, collateral placed with the clearing house, and default fund contributions.
The RWA on Exposures to Central Counterparties as at 30 September 2016 is $1,374 million. Details of the components of the exposures to central counterparties capital requirement is shown in the tables below.
As at
30 September 2016
Central counterparty trade exposure
Trade Exposure
$m
Risk Weight
RWA
$m
Exposures eligible for a 0% risk weight - - -
Exposures eligible for a 2% risk weight 4,418 0.02 88
Exposures eligible for a 4% risk weight 200 0.04 8
Exposures eligible for a bilateral risk weight 1,781 - 767
Total central counterparty exposures 6,399 - 863
Qualifying central counterparty default fund guarantees
Prefunded Default fund Contribution
$m
Unfunded Default fund Contribution
$m RWA
$m
Qualifying central counterparty 1 23 749 135
Qualifying central counterparty 2 66 682 123
Qualifying central counterparty 3 66 1,068 192
Qualifying central counterparty 4 9 157 28
Qualifying central counterparty 5 23 145 26
Other qualifying central counterparties 7 82 7
Total 194 2,883 511
Non-qualifying central counterparty default fund guarantees
Prefunded Default fund Contribution
$m
Unfunded Default fund Contribution
$m RWA
$m
Qualifying central counterparty 1 - - -
Qualifying central counterparty 2 - - -
Qualifying central counterparty 3 - - -
Qualifying central counterparty 4 - - -
Qualifying central counterparty 5 - - -
Other qualifying central counterparties - - -
Total - - -
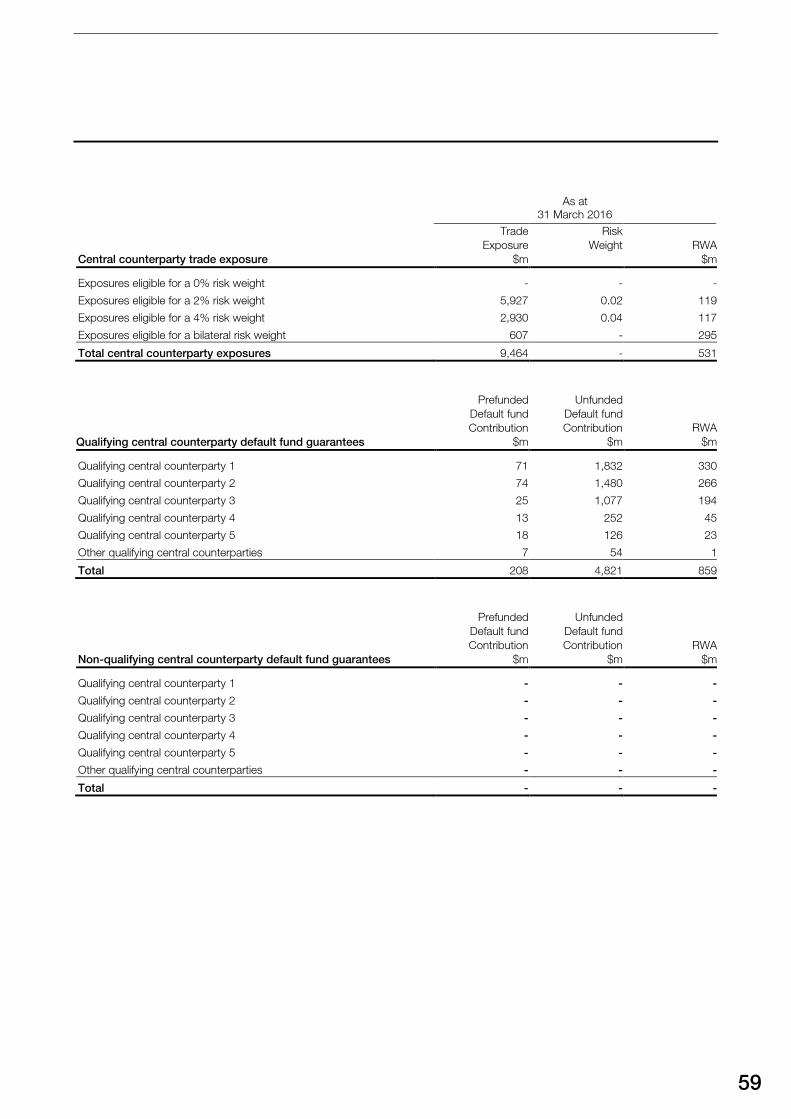
59
As at
31 March 2016
Central counterparty trade exposure
Trade Exposure
$m
Risk Weight
RWA
$m
Exposures eligible for a 0% risk weight - - -
Exposures eligible for a 2% risk weight 5,927 0.02 119
Exposures eligible for a 4% risk weight 2,930 0.04 117
Exposures eligible for a bilateral risk weight 607 - 295
Total central counterparty exposures 9,464 - 531
Qualifying central counterparty default fund guarantees
Prefunded Default fund Contribution
$m
Unfunded Default fund Contribution
$m RWA
$m
Qualifying central counterparty 1 71 1,832 330
Qualifying central counterparty 2 74 1,480 266
Qualifying central counterparty 3 25 1,077 194
Qualifying central counterparty 4 13 252 45
Qualifying central counterparty 5 18 126 23
Other qualifying central counterparties 7 54 1
Total 208 4,821 859
Non-qualifying central counterparty default fund guarantees
Prefunded Default fund Contribution
$m
Unfunded Default fund Contribution
$m RWA
$m
Qualifying central counterparty 1 - - -
Qualifying central counterparty 2 - - -
Qualifying central counterparty 3 - - -
Qualifying central counterparty 4 - - -
Qualifying central counterparty 5 - - -
Other qualifying central counterparties - - -
Total - - -
Macquarie Bank Limited Pillar 3 Disclosures September 2016 macquarie.com
12.0 Market Risk
60
0.0 Market Ris
12.1 Market Risk
Market risk is the risk of adverse changes in the value of Macquarie’s trading portfolios from changes in market prices or volatility. Macquarie is exposed to the following risks in each of the major markets in which it trades: – foreign exchange and bullion: changes in spot and
forward exchange rates and bullion prices and the volatility of exchange rates and bullion prices
– interest rates and debt securities: changes in the level, shape and volatility of yield curves, the basis between different debt securities and derivatives and credit margins
– equities: changes in the price and volatility of individual equities, equity baskets and equity indices
– commodities and energy: changes in the price and volatility of base metals, agricultural commodities and energy products.
Macquarie is also exposed to the correlation of market prices and rates within and across markets. Macquarie has long favoured transparent scenario analysis over complex statistical modelling as the cornerstone of risk measurement.
12.1.1 Traded Market Risk
All trading activities contain calculated elements of risk taking. Macquarie is prepared to accept such risks provided they are within agreed limits, independently and correctly identified, calculated and monitored by RMG and reported to senior management on a regular basis.
RMG monitors positions within Macquarie according to a limit structure that sets limits for all exposures in all markets. Limits are applied at a granular level to individual trading desks, through increasing levels of aggregation to Divisions and Operating Groups, and ultimately, Macquarie. This approach removes the need for future correlations or scenarios to be precisely predicted as all risks are stressed to the extreme and accounted for within the risk profile agreed for each business and Macquarie in aggregate.
Limits are approved by Senior Management with appropriate authority for the size and nature of the risk and Macquarie adheres to a strict ‘no limit, no dealing’ policy. If a product or position has not been authorised and given a limit structure by RMG, then it cannot be traded. Material breaches of the approved limit structure are communicated monthly to the Macquarie and Macquarie Bank Boards.
RMG sets three complementary limit structures: – contingent loss limits: worst-case scenarios that shock
prices and volatilities by more than has occurred historically. Multiple scenarios are set for each market to capture the non-linearity and complexity of exposures arising from derivatives
– position limits: volume, maturity and open position limits are set on a large number of market instruments and securities to constrain concentration risk and to avoid the accumulation of risky, illiquid positions
– Value-at-Risk (VaR) limits: statistical measure that determines the potential loss in trading value at both a business and aggregate level.
The risk of loss from incorrect or inappropriate pricing and hedging models is mitigated by the requirement for all new pricing models to be independently tested by the specialist Quantitative Applications Division within RMG.
12.1.2 Aggregate Measures of Market Risk
Aggregate market risk is constrained by two risk measures, Value at Risk (VaR) and the Macro-Economic Linkages (MEL) stress scenarios. The VaR model predicts the maximum likely loss in Macquarie’s trading portfolio due to adverse movements in global markets over holding periods of one and ten days. The MEL scenario uses the contingent loss approach to capture simultaneous, worst case movements across all major markets. Whereas MEL focuses on extreme price movements, VaR focuses on unexceptional changes in price so that it does not account for losses that could occur beyond the 99% level of confidence. Stress testing therefore remains the predominant focus of RMG as it is considered to be the most effective mechanism to reduce Macquarie’s exposure to unexpected market events.
61
12.1.3 Value at Risk Model
VaR provides a statistically based summary of overall market risk in the Group. The VaR model uses a Monte Carlo simulation to generate normally distributed price and volatility paths for approximately 3,500 benchmarks, using volatilities and correlations based on three years of historical data. Emphasis is placed on more recent market movements to more accurately reflect current conditions. Each benchmark represents an asset at a specific maturity, for example one year crude oil futures or spot gold. The benchmarks provide a high level of granularity in assessing risk, covering a range of points on yield curves and forward price curves, and distinguishing between similar but distinct assets; for example crude oil as opposed to heating oil, or gas traded at different locations. Exposures to individual equities within a national market are captured by specific risk modelling incorporated directly into the VaR model.
The integrity of the VaR model is tested against daily hypothetical and actual trading outcomes (profit and loss) and reported to APRA quarterly.
12.1.4 Macro Economic Linkage Model
MEL scenarios are large, simultaneous, ‘worst case’ movements in global markets. The MEL scenarios consider very large movements in a number of markets at once, based on Macquarie’s understanding of the economic linkages between markets. The MEL scenarios reflect a market ‘shock’ or ‘gap’ as opposed to a sustained deterioration.
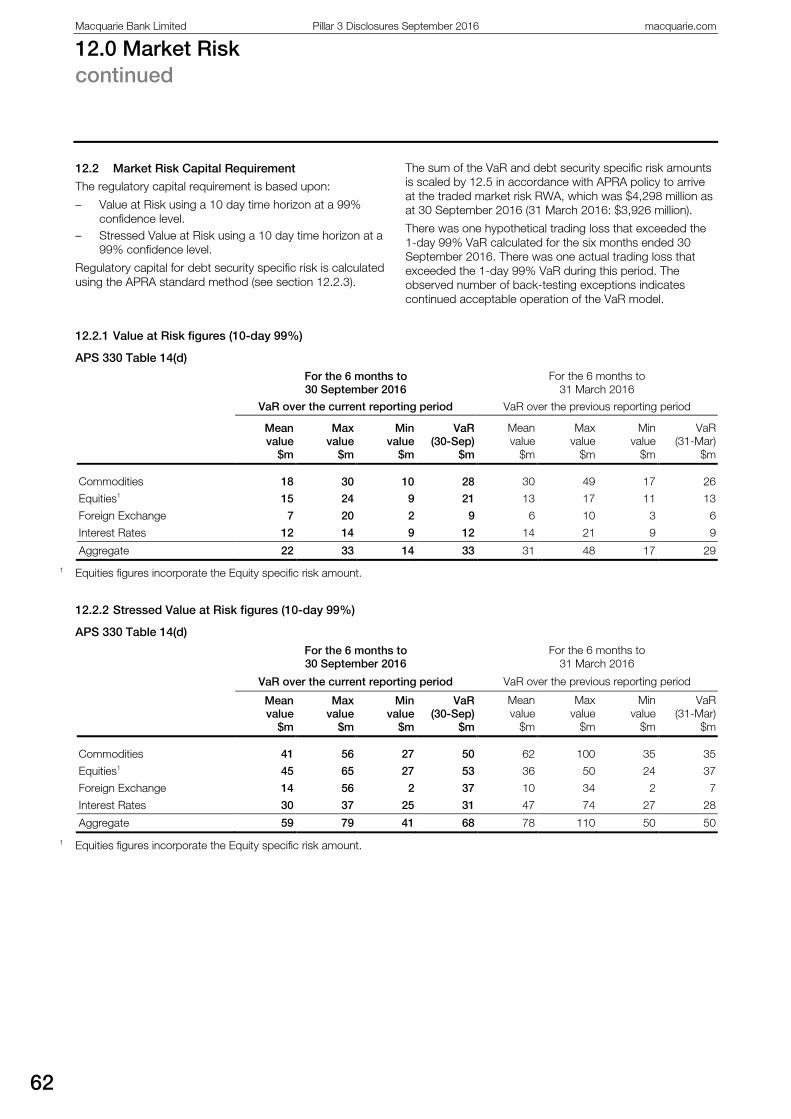
Macquarie Bank Limited Pillar 3 Disclosures September 2016 macquarie.com
12.0 Market Risk continued
62
12.2 Market Risk Capital Requirement
The regulatory capital requirement is based upon:
– Value at Risk using a 10 day time horizon at a 99% confidence level.
– Stressed Value at Risk using a 10 day time horizon at a 99% confidence level.
Regulatory capital for debt security specific risk is calculated using the APRA standard method (see section 12.2.3).
The sum of the VaR and debt security specific risk amounts is scaled by 12.5 in accordance with APRA policy to arrive at the traded market risk RWA, which was $4,298 million as at 30 September 2016 (31 March 2016: $3,926 million).
There was one hypothetical trading loss that exceeded the 1-day 99% VaR calculated for the six months ended 30 September 2016. There was one actual trading loss that exceeded the 1-day 99% VaR during this period. The observed number of back-testing exceptions indicates continued acceptable operation of the VaR model.
12.2.1 Value at Risk figures (10-day 99%)
APS 330 Table 14(d)
For the 6 months to 30 September 2016
For the 6 months to 31 March 2016
VaR over the current reporting period VaR over the previous reporting period
Mean value
$m
Max value
$m
Min value
$m
VaR (30-Sep)
$m
Mean value
$m
Max value
$m
Min value
$m
VaR (31-Mar)
$m
Commodities 18 30 10 28 30 49 17 26
Equities1 15 24 9 21 13 17 11 13
Foreign Exchange 7 20 2 9 6 10 3 6
Interest Rates 12 14 9 12 14 21 9 9
Aggregate 22 33 14 33 31 48 17 29
1 Equities figures incorporate the Equity specific risk amount.
12.2.2 Stressed Value at Risk figures (10-day 99%)
APS 330 Table 14(d)
For the 6 months to 30 September 2016
For the 6 months to 31 March 2016
VaR over the current reporting period VaR over the previous reporting period
Mean value
$m
Max value
$m
Min value
$m
VaR (30-Sep)
$m
Mean value
$m
Max value
$m
Min value
$m
VaR (31-Mar)
$m
Commodities 41 56 27 50 62 100 35 35
Equities1 45 65 27 53 36 50 24 37
Foreign Exchange 14 56 2 37 10 34 2 7
Interest Rates 30 37 25 31 47 74 27 28
Aggregate 59 79 41 68 78 110 50 50
1 Equities figures incorporate the Equity specific risk amount.
63
12.2.3 Debt Security Specific Risk figures
Regulatory capital for Macquarie’s debt security specific risk (including securitisations held in the trading book) is calculated using the APRA standard method.
APS 330 Table 13(b)
As at 30 September
2016 $m
As at 31 March
2016 $m
Debt specific risk 56 38
The specific risks referred to above arise from movements in credit curves in the Macquarie trading book.
12.2.4 Interest Rate Risk in the Banking Book
Interest rate exposures, where possible, are transferred into the trading books of the Commodities and Financial Markets and Group Treasury, and managed under market risk limits. The residual risks in the banking book are not material but are nevertheless monitored and controlled by RMG and reported to senior management monthly. Macquarie measures interest rate risk on a monthly basis using an APRA approved repricing gap model with monthly bucketing of exposures.
The total IRRBB capital is calculated by adding the change in economic value derived from the worst-case of extreme parallel and non-parallel moves in the yield curves of each currency to the embedded gains and losses as defined in APS 117 Capital Adequacy: Interest Rate Risk in the Banking Book (Advanced ADIs) for each currency.
The IRRBB RWA as at 30 September 2016 is $645 million (31 March 2016: $576 million).
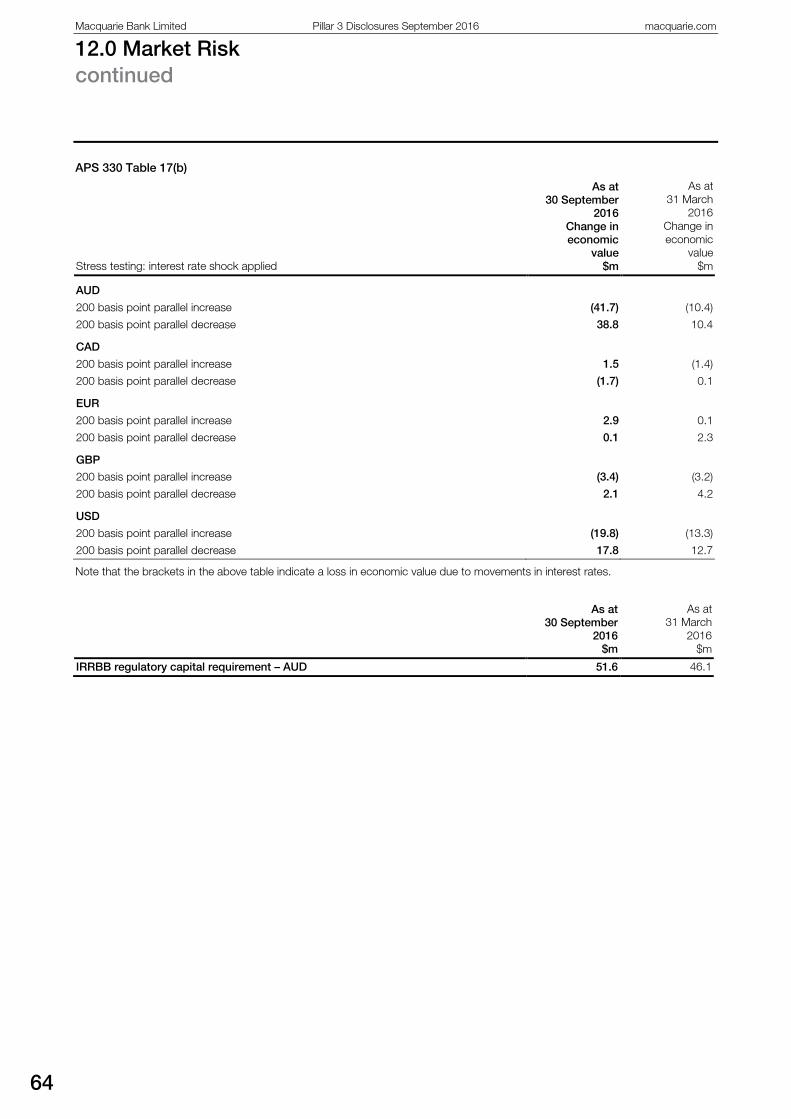
Macquarie Bank Limited Pillar 3 Disclosures September 2016 macquarie.com
12.0 Market Risk continued
64
APS 330 Table 17(b)
Stress testing: interest rate shock applied
As at 30 September
2016 Change in economic
value $m
As at 31 March
2016 Change in economic
value $m
AUD
200 basis point parallel increase (41.7) (10.4)
200 basis point parallel decrease 38.8 10.4
CAD
200 basis point parallel increase 1.5 (1.4)
200 basis point parallel decrease (1.7) 0.1
EUR
200 basis point parallel increase 2.9 0.1
200 basis point parallel decrease 0.1 2.3
GBP
200 basis point parallel increase (3.4) (3.2)
200 basis point parallel decrease 2.1 4.2
USD
200 basis point parallel increase (19.8) (13.3)
200 basis point parallel decrease 17.8 12.7
Note that the brackets in the above table indicate a loss in economic value due to movements in interest rates.
As at 30 September
2016 $m
As at 31 March
2016 $m
IRRBB regulatory capital requirement – AUD 51.6 46.1

13.0 Equity Risk
65
11.0 Equity Risk
Equity risk is the risk of loss arising from banking book equity-type exposures. These exposures include: – holdings in specialised funds managed by Macquarie; – principal exposures taken by Macquarie Capital,
including direct investments in entities external to Macquarie;
– property equity, including property trusts and direct property equity investments;
– lease residuals; – other equity investments. All of the above equity risk positions are subject to an aggregate Equity Risk Limit (ERL). The ERL is set by the Board by reference to the Risk Appetite Test that is described further in the Capital Adequacy section 4. When the Board sets the limit, it also considers the level of earnings, capital and market conditions. RMG reviews the limit semi-annually and reports the results of the review to the Group Risk and Compliance Committee (GRCC) and the Board.
Additional GRCC approved limits manage concentration risk in the equity portfolio. These include limits on: – property equity investments; – investments in the resources sector; – lease residuals (by type of leased asset); – co-investments and other assets of Macquarie Capital.
13.1 Accounting for Equity Holdings in the Banking Book
Equity investment positions have varying accounting treatments depending on the nature of the exposure. These include: – equity accounting for investments in associates; – available for sale (AVS) equity investments; and – investments in subsidiaries and held for sale (HFS)
associates held at lower of cost or net realisable value.
In addition to equity investment positions in the Banking Book, Macquarie has equity investments held at Fair Value through Profit and Loss, which are generally included in the Market Risk calculation.
13.1.1 Investments in Associates
Equity accounting is applied to investments in which Macquarie has significant influence or joint control. These equity investments are described as Investments in Associates. Equity accounting is applied such that Macquarie’s share of its investee’s post acquisition profit or losses are recorded in Macquarie’s Income Statement. Investments accounted for using equity accounting are subject to recurring review and assessment for possible impairment. At each balance date, if there is an indication that an investment in an associate may be impaired, then the entire carrying amount of the investment in associate is tested for impairment by comparing the recoverable amount (higher of value in use and fair value less costs to sell) with its carrying amount. Any impairment losses are recognised in the Income Statement.
13.1.2 AVS equity investments
Where an equity investment is not subject to the significant influence or joint control of Macquarie, it is held as a direct equity investment. These direct investments are classified as AVS. AVS securities are initially carried at fair value plus transaction costs. Gains and losses arising from subsequent changes in fair value are recognised directly in the AVS reserve in equity, until the asset is derecognised or impaired, at which time the cumulative gain or loss is recognised in the Income Statement.
At each balance sheet date, an assessment is performed to determine whether there is any objective evidence that available for sale financial assets have been impaired. Impairment exists if there is objective evidence of impairment as a result of one or more events (loss event) which have an impact on the estimated future cash flows of the financial asset that can be reliably estimated. For equity securities, classified as AVS, the main indicators of impairment are: significant changes in the market, economic or legal environment; and a significant or prolonged decline in fair value below cost.
Fair values of quoted investments in active markets are based on current bid prices. If the relevant market is not considered active (or the securities are unlisted), fair value is established by using valuation techniques, including recent arm’s length transactions, discounted cash flow analysis, option pricing models and other valuation techniques commonly used by market participants.
13.1.3 Held for sale (HFS) investments
HFS assets include subsidiaries and interests in associates or joint ventures whose carrying amount will be recovered principally through a sale transaction rather than continuing use. The policy of management is to classify these assets as held for sale when it is highly probable that the asset will be sold within the twelve months subsequent to being classified as such. Assets classified as HFS investments are carried at the lower of carrying amount and fair value less costs to sell.
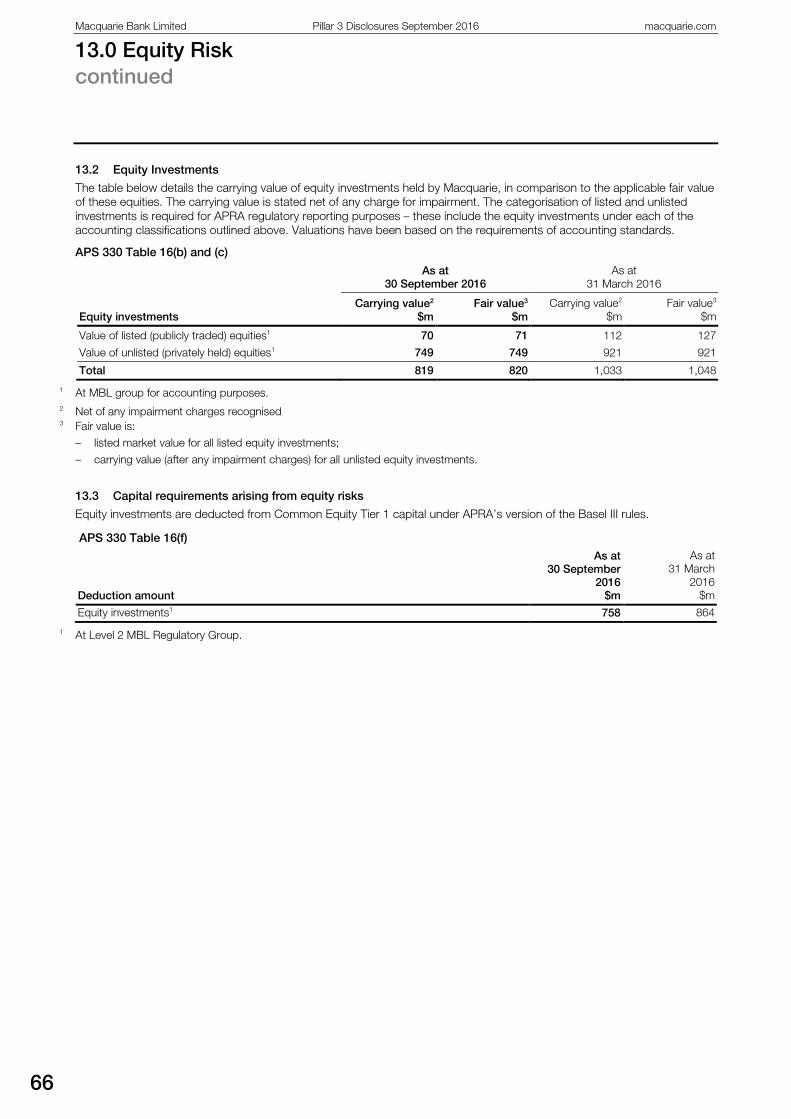
Macquarie Bank Limited Pillar 3 Disclosures September 2016 macquarie.com
13.0 Equity Risk continued
66
13.2 Equity Investments
The table below details the carrying value of equity investments held by Macquarie, in comparison to the applicable fair value of these equities. The carrying value is stated net of any charge for impairment. The categorisation of listed and unlisted investments is required for APRA regulatory reporting purposes – these include the equity investments under each of the accounting classifications outlined above. Valuations have been based on the requirements of accounting standards.
APS 330 Table 16(b) and (c)
Equity investments
As at 30 September 2016
As at 31 March 2016
Carrying value2 $m
Fair value3 $m
Carrying value2 $m
Fair value3 $m
Value of listed (publicly traded) equities1 70 71 112 127
Value of unlisted (privately held) equities1 749 749 921 921
Total 819 820 1,033 1,048
1 At MBL group for accounting purposes. 2 Net of any impairment charges recognised 3 Fair value is:
– listed market value for all listed equity investments;
– carrying value (after any impairment charges) for all unlisted equity investments.
13.3 Capital requirements arising from equity risks
Equity investments are deducted from Common Equity Tier 1 capital under APRA’s version of the Basel III rules.
APS 330 Table 16(f)
Deduction amount
As at 30 September
2016 $m
As at 31 March
2016 $m
Equity investments1 758 864
1 At Level 2 MBL Regulatory Group.
67
13.4 Gains and losses on equity investments
APS 330 Table 16(d) and (e)
Gains / (losses) on equity investments
For the 6 months to 30 September
2016 $m
For the 6 months to 31 March
2016 $m
Cumulative realised gains in 6 months to the period end1 112 23
Total unrealised gains/ (losses)2 69 (3)
Total unrealised gains / (losses) included in Tier 1 69 (3)
1 Gains are defined as proceeds on sale less costs net of provisions. 2 Includes gains / (losses) that have not gone through the Income Statement. These are primarily the amounts recognised in the
Available for Sale Reserve.
Macquarie Bank Limited Pillar 3 Disclosures September 2016 macquarie.com
14.0 Operational Risk
68
Operational risk is inherent in Macquarie’s business. Macquarie defines operational risk as the risk of loss resulting from inadequate or failed internal processes, controls or systems or from external events.
It also includes the failure or inadequate management of other risk types.
14.1 Macquarie’s Operational Risk Capital Framework
Operational Risk Objectives Macquarie’s Operational Risk Management Framework (ORMF) is designed to identify, assess and manage operational risks within the organisation. The key objectives of the framework are: – risk identification, analysis and acceptance – execution and monitoring of risk management practices – reporting and escalation of risk information on a routine
and exception basis.
Operational Risk Management Process Operating and Central Service Groups carry out elements of the ORMF in a manner that is tailored to their specific operational risk profile. However, to ensure consistency and minimum standards the framework includes the following mandatory elements: – A robust change management process to ensure
operational risks in new activities or products are identified, addressed and managed prior to implementation
– An operational risk self-assessment process to identify operational risks at the business level, evaluate controls and develop action plans to address deficiencies
– Recording operational risk incidents in a centralised reporting system. Incidents are analysed to identify trends and establish lessons learnt on the effectiveness of controls
– Allocation of operational risk capital to all Macquarie businesses as a tool to further encourage positive behaviour in Macquarie’s day-to-day management of operational risk
– Macquarie-wide policies that require a consistent approach and minimum standards on specific operational risk matters
– Embedded operational risk representatives in Operating Groups who act as delegates of the Operating Group Head. These representatives are required to assess whether operational risks are addressed appropriately and that the ORMF is executed within their area.
Structure and Organisation of the Operational Risk Function
Most Macquarie operational risk staff operate at the business level. These Business Operational Risk Managers (BORMs) are responsible for embedding operational risk management within their business. They report directly to the relevant business and have a dotted reporting line to the Head of RMG Operational Risk.
RMG Operational Risk is a division of RMG and is managed separately from other risk disciplines within RMG. RMG Operational Risk is responsible for ensuring the Framework remains appropriate and that skilled resources are available
to support it. It is also responsible for Macquarie’s operational risk capital measurement methodology.
RMG regularly reports on the operational risk profile and the effectiveness of the Framework to the BRiC and to senior management.
14.2 Operational Risk Capital Calculation
APRA approved Macquarie’s use of the AMA for assessing operational risk capital in December 2007. Macquarie holds operational risk capital to absorb potential losses arising from operational risk exposures. Macquarie’s operational risk capital framework has two main elements: – an annual scenario approach for modelling operational
risk losses and to determine operational risk capital – a process for allocating capital to businesses based on
risk exposures. Operational risk scenarios identify key risks that, while very low in probability may, if they occurred, result in very high impact losses. When identifying the potential for such losses, consideration is given to the individual statistical distribution for each scenario, external loss data, internal loss data, risk and control factors determined by the operational risk self-assessments and the contribution of expert opinion from Operating and Central Service Groups. Scenario estimates are then modelled to determine the operational risk component of regulatory capital required to be held by Macquarie at the 99.9th percentile.
Over time, changes in operational risk capital reflect: – new or significantly changed business activity or growth – changes in the external environment such as new
regulations or movements in the economic cycle.
Mitigation of Operational Risk through Insurance
Macquarie does not currently use insurance in its AMA model for the purpose of operational risk capital reduction.
Operational Risk - RWA
The operational risk RWA as at 30 September 2016 is $9,531 million (31 March 2016: $9,624 million).
15.0 Leverage ratio disclosures
69
In July 2015, APRA released an updated APS 110 and APS 330, which include new disclosure requirements relating to leverage ratios for ADIs. The leverage ratio is a non-risk based ratio that is intended to restrict the build-up of excessive leverage in the banking system and act as a supplementary measure to create a back-stop for the risk-based capital requirements. As of September 2016, APRA has not proposed a minimum leverage ratio requirement and confirmed that Basel III leverage ratio is a disclosure requirement for September 2016.
Macquarie Bank Group's September 2016 APRA leverage ratio has increased by 0.3% from June 2016 APRA leverage ratio of 5.3% due to net capital generation and reduced leverage exposures during the quarter.
15.1 Leverage ratio disclosure template
APS 330 Table 18
Item
As at 30 September
2016
On-balance sheet exposures $m
1 On-balance sheet items (excluding derivatives and securities financing transactions (SFTs), but including collateral)
134,452
2 (Asset amounts deducted in determining Tier 1 capital) (1,956)
3 Total on-balance sheet exposures (excluding derivatives and SFTs) (sum of rows 1 and 2) 132,496
Derivative exposures
4 Replacement cost associated with all derivatives transactions (i.e. net of eligible cash variation margin)
9,295
5 Add-on amounts for potential future credit exposure (PFCE) associated with all derivatives transactions
16,187
6 Gross-up for derivatives collateral provided where deducted from the balance sheet assets pursuant to the Australian Accounting Standards
-
7 (Deductions of receivables assets for cash variation margin provided in derivatives transactions) (462)
8 (Exempted central counterparty (CCP) leg of client-cleared trade exposures) (5,685)
9 Adjusted effective notional amount of written credit derivatives 3,560
10 (Adjusted effective notional offsets and add-on deductions for written credit derivatives) (1,484)
11 Total derivative exposures (sum of rows 4 to 10) 21,411
SFT exposures
12 Gross SFT assets (with no recognition of netting), after adjusting for sales accounting transactions 25,389
13 (Netted amounts of cash payables and cash receivables of gross SFT assets) (38)
14 CCR exposure for SFT assets 1,731
15 Agent transaction exposures -
16 Total SFT exposures (sum of rows 12 to 15) 27,082
Other off-balance sheet exposures
17 Off-balance sheet exposure at gross notional amount 17,577
18 (Adjustments for conversion to credit equivalent amounts) (4,898)
19 Other off-balance sheet exposures (sum of rows 17 and 18) 12,679
Capital and total exposures
20 Tier 1 Capital 10,793
21 Total exposures (sum of rows 3, 11, 16 and 19) 193,668
Leverage ratio
22 Leverage ratio 5.6%
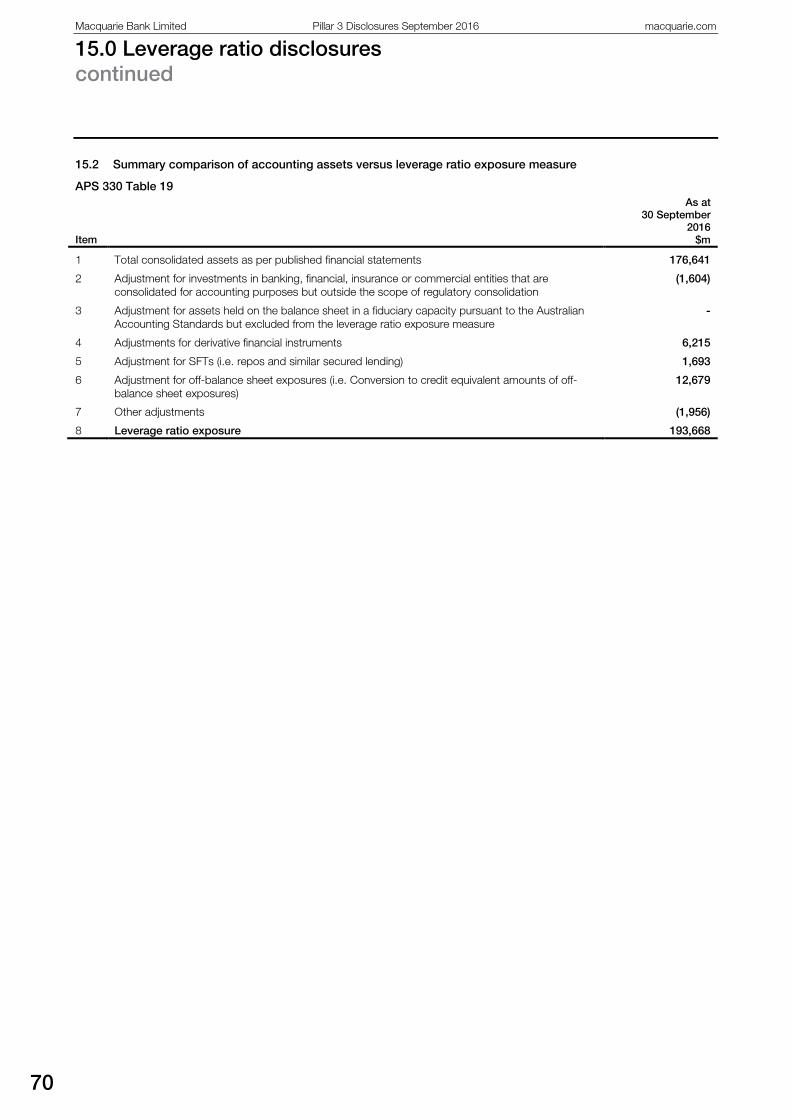
Macquarie Bank Limited Pillar 3 Disclosures September 2016 macquarie.com
15.0 Leverage ratio disclosures continued
70
15.2 Summary comparison of accounting assets versus leverage ratio exposure measure
APS 330 Table 19
Item
As at 30 September
2016 $m
1 Total consolidated assets as per published financial statements 176,641
2 Adjustment for investments in banking, financial, insurance or commercial entities that are consolidated for accounting purposes but outside the scope of regulatory consolidation
(1,604)
3 Adjustment for assets held on the balance sheet in a fiduciary capacity pursuant to the Australian Accounting Standards but excluded from the leverage ratio exposure measure
-
4 Adjustments for derivative financial instruments 6,215
5 Adjustment for SFTs (i.e. repos and similar secured lending) 1,693
6 Adjustment for off-balance sheet exposures (i.e. Conversion to credit equivalent amounts of off-balance sheet exposures)
12,679
7 Other adjustments (1,956)
8 Leverage ratio exposure 193,668
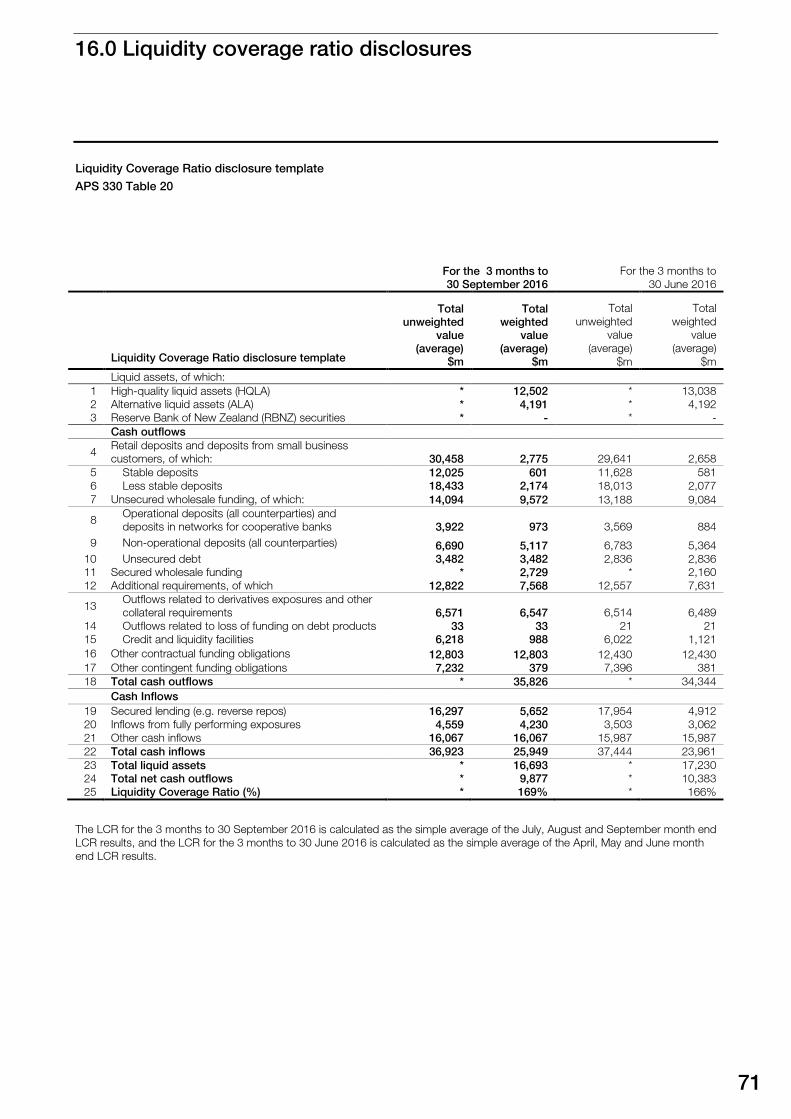
16.0 Liquidity coverage ratio disclosures
71
Liquidity Coverage Ratio disclosure template
APS 330 Table 20
For the 3 months to 30 September 2016
For the 3 months to 30 June 2016
Liquidity Coverage Ratio disclosure template
Total unweighted
value (average)
$m
Total weighted
value (average)
$m
Total unweighted
value (average)
$m
Total weighted
value (average)
$m Liquid assets, of which:
1 High-quality liquid assets (HQLA) * 12,502 * 13,038 2 Alternative liquid assets (ALA) * 4,191 * 4,192 3 Reserve Bank of New Zealand (RBNZ) securities * - * -
Cash outflows
4 Retail deposits and deposits from small business customers, of which:
30,458
2,775 29,641 2,658
5 Stable deposits 12,025 601 11,628 581 6 Less stable deposits 18,433 2,174 18,013 2,077 7 Unsecured wholesale funding, of which: 14,094 9,572 13,188 9,084
8 Operational deposits (all counterparties) and deposits in networks for cooperative banks
3,922
973 3,569 884
9 Non-operational deposits (all counterparties) 6,690 5,117 6,783 5,364 10 Unsecured debt 3,482 3,482 2,836 2,836 11 Secured wholesale funding * 2,729 * 2,160 12 Additional requirements, of which 12,822 7,568 12,557 7,631
13 Outflows related to derivatives exposures and other collateral requirements
6,571
6,547 6,514 6,489
14 Outflows related to loss of funding on debt products 33 33 21 21 15 Credit and liquidity facilities 6,218 988 6,022 1,121 16 Other contractual funding obligations 12,803 12,803 12,430 12,430 17 Other contingent funding obligations 7,232 379 7,396 381 18 Total cash outflows * 35,826 * 34,344
Cash Inflows
19 Secured lending (e.g. reverse repos) 16,297 5,652 17,954 4,912 20 Inflows from fully performing exposures 4,559 4,230 3,503 3,062 21 Other cash inflows 16,067 16,067 15,987 15,987 22 Total cash inflows 36,923 25,949 37,444 23,961 23 Total liquid assets * 16,693 * 17,230 24 Total net cash outflows * 9,877 * 10,383 25 Liquidity Coverage Ratio (%) * 169% * 166%
The LCR for the 3 months to 30 September 2016 is calculated as the simple average of the July, August and September month end
LCR results, and the LCR for the 3 months to 30 June 2016 is calculated as the simple average of the April, May and June month end LCR results.
Macquarie Bank Limited Pillar 3 Disclosures September 2016 macquarie.com
16.0 Liquidity coverage ratio disclosures continued
72
The Liquidity Coverage Ratio (LCR)
The LCR requires sufficient levels of unencumbered, high-quality liquid assets (HQLA) to be held to meet expected net cash outflows (NCOs) under a regulatory-defined stress scenario lasting 30 calendar days. Macquarie has been compliant with the LCR at all times since the ratio was introduced as a minimum requirement in January 2015. Macquarie’s 3 month average LCR to 30 September 2016 was 169% (average based on month-end observations).
Macquarie sets internal management- and Board-approved minimum limits for the LCR above the regulatory minimum level and estimates its aggregate LCR position against these limits on a daily basis. Macquarie also monitors the LCR position on a standalone basis for all major currencies in which it operates, with the HQLA portfolio being denominated and held in both Australian Dollars and a range of other currencies to ensure Macquarie’s liquidity requirements are broadly matched by currency.
Whilst the LCR is a regulatory minimum, Macquarie also models a number of additional internal liquidity scenarios covering both market-wide and firm-specific crises. The most binding of all scenarios (LCR and internal) determines Macquarie’s absolute minimum required level of cash and liquid assets.
Macquarie actively considers the impact of business decisions on the LCR, as well as other internal liquidity metrics that form part of the broader liquidity risk management framework. Macquarie’s LCR fluctuates on a daily basis as a result of normal business activities and, accordingly, ongoing fluctuations in the reported LCR are expected and are not necessarily indicative of a changing risk appetite. Some examples of factors that can influence the LCR include wholesale funding activities (such as upcoming maturities and pre-funding expected future asset growth), the degree of activity in Macquarie’s capital markets facing businesses, the composition and nature of liquid asset holdings, and a variety of other external market considerations that could impact day-to-day collateral requirements.
High-Quality Liquid Assets (HQLA) and the Committed Liquidity Facility (CLF)
For the half year ended 30 September 2016, Macquarie’s HQLA portfolio was comprised of Level 1 qualifying AUD and non-AUD HQLA, Level 2 qualifying non-AUD HQLA, as well as AUD CLF eligible collateral.
Macquarie’s CLF allocation for calendar year 2016 is $4,600 million, which is reflected in the disclosure template under ‘Alternative Liquid Assets (ALA)’. Note the disclosed balance of $4,191 million reflects the required ‘open-repo’ of internal self-securitised RMBS with the RBA (which increases cash balances in the Exchange Settlement Account (ESA) with the RBA but is considered an ongoing ‘utilisation’ of the CLF).
Net Cash Outflows (NCOs)
Net Cash Outflows (NCOs) in the LCR include contractual and assumed cash outflows, offset by certain allowable contractual cash inflows. Some of the key drivers of Macquarie’s NCOs include:
Retail and SME deposits: assumed regulatory outflow relating to deposits from retail and SME customers that are at-call or potentially callable within 30 days. Note that any superannuation deposits received through a self-managed trust are required by APRA to be classified as ‘less stable’, even though the majority of these deposits are covered by the FCS.
Unsecured wholesale funding: includes remaining deposits which are not received from retail or SME customers along with unsecured debt balances contractually maturing within 30 days.
Secured wholesale funding and lending: represent inflows and outflows from secured lending and borrowing activities contractually maturing within 30 days, such as repurchase and reverse repurchase agreements.
Outflows relating to derivative exposures and other collateral requirements: includes gross contractual cash outflows relating to contractually maturing derivative contracts (with gross inflows on maturing derivative contracts profiled in ‘other cash inflows’). Further, contingent liquidity outflows such as potential collateral requirements from market movements, a 3-notch credit ratings downgrade and withdrawal of excess collateral placed with Macquarie are also included in this category.
Inflows from fully performing exposures: In Macquarie’s LCR, a large component of this balance relates to excess liquidity placed on an overnight or very short-term basis with third parties (internally considered part of the cash and liquid asset portfolio).
Other contractual funding obligations and other cash inflows: includes other gross flows not profiled elsewhere in the LCR. The volumes in these categories are large relative to Macquarie’s total cash outflows and inflows, however are comprised of two balances in particular:
Segregated client funds placed with Macquarie: Macquarie acts as a clearing agent for clients on various futures exchanges. Clients place margin with Macquarie and Macquarie places this margin either directly with the exchange, holds it in other segregated external asset accounts or retains a small portion on deposit with Macquarie. Although these funds are segregated from Macquarie, the balances are recorded on a gross basis on Macquarie’s balance sheet and APRA require them to be profiled as offsetting gross inflows and outflows in the LCR.
Security and broker settlement balances: these represent securities that have been purchased or sold by Macquarie that have not yet settled and broker balances where stock has been bought or sold on behalf of clients but payment has not been made to / received from the client. APRA require these balances to be reflected on a gross basis in the LCR as 100% weighted inflows and outflows.
It is important to note that in both of the cases above, the profiled outflow must be viewed in conjunction with the profiled inflow and the net effect of these balances on Macquarie’s LCR is negligible.
Disclaimer
73
– The material in this document has been prepared by Macquarie Bank Limited ABN 46 008 583 542 (Macquarie) purely for the purpose of explaining the basis on which Macquarie has prepared and disclosed certain capital requirements and information about the management of risks relating to those requirements and for no other purpose. Information in this document, including any forward looking statements, should not be considered as advice or a recommendation to investors or potential investors in relation to holding, purchasing or selling activities or other financial products or instruments and does not take into account your particular investment objectives, financial situation or needs. Before acting on any information you should consider the appropriateness of information having regard to the matters, any relevant offer document and in particular, you should seek independent financial advice. All securities and financial product or instrument transactions involve risks, which include (among others) the risk of adverse and unanticipated market, financial or political developments and, in international transactions, currency risk.
– This document may contain forward looking statements including statements regarding our intent, belief or current expectations with respect to Macquarie’s businesses and operations, market conditions, results of operation and financial conditions, capital adequacy, individually assessed provisions and risk management practices. Readers are cautioned not to place undue reliance on these forward looking statements. Macquarie does not take any obligation to publicly release the results of any revisions to these forward looking statements to reflect events or circumstances after the date hereof to reflect the occurrence of unanticipated events. While due care has been used in the preparation of forecast information, actual results may vary in a materially positive or negative manner. Forecasts and hypothetical examples are subject to uncertainty and contingencies outside Macquarie’s control. Past performance is not a reliable indication of future performance.
Unless otherwise specified all information is at 30 September 2016.
– Although Pillar 3 disclosures are intended to provide transparent capital disclosures on a common basis the information contained in this document may not be directly comparable with other banks. This may be due to a number of factors such as:
– The mix of business exposures between banks
– Pillar 2 capital requirements are excluded from this disclosure but play a major role in determining both the total capital requirements of the bank and any surplus capital available.
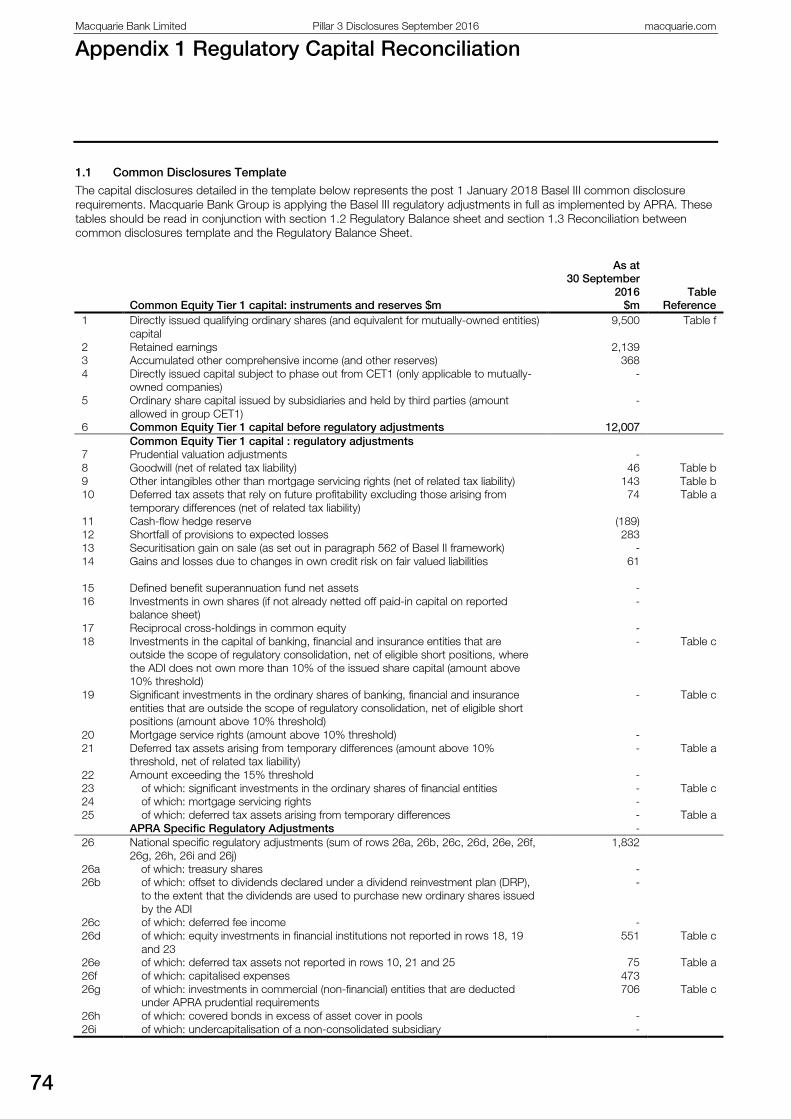
Macquarie Bank Limited Pillar 3 Disclosures September 2016 macquarie.com
Appendix 1 Regulatory Capital Reconciliation
74
1.1 Common Disclosures Template
The capital disclosures detailed in the template below represents the post 1 January 2018 Basel III common disclosure requirements. Macquarie Bank Group is applying the Basel III regulatory adjustments in full as implemented by APRA. These tables should be read in conjunction with section 1.2 Regulatory Balance sheet and section 1.3 Reconciliation between common disclosures template and the Regulatory Balance Sheet.
Common Equity Tier 1 capital: instruments and reserves $m
As at 30 September
2016 $m
Table Reference
1 Directly issued qualifying ordinary shares (and equivalent for mutually-owned entities) capital
9,500 Table f
2 Retained earnings 2,139 3 Accumulated other comprehensive income (and other reserves) 368 4 Directly issued capital subject to phase out from CET1 (only applicable to mutually-
owned companies) -
5 Ordinary share capital issued by subsidiaries and held by third parties (amount allowed in group CET1)
-
6 Common Equity Tier 1 capital before regulatory adjustments 12,007 Common Equity Tier 1 capital : regulatory adjustments 7 Prudential valuation adjustments - 8 Goodwill (net of related tax liability) 46 Table b 9 Other intangibles other than mortgage servicing rights (net of related tax liability) 143 Table b 10 Deferred tax assets that rely on future profitability excluding those arising from
temporary differences (net of related tax liability) 74 Table a
11 Cash-flow hedge reserve (189) 12 Shortfall of provisions to expected losses 283 13 Securitisation gain on sale (as set out in paragraph 562 of Basel II framework) - 14 Gains and losses due to changes in own credit risk on fair valued liabilities 61
15 Defined benefit superannuation fund net assets - 16 Investments in own shares (if not already netted off paid-in capital on reported
balance sheet) -
17 Reciprocal cross-holdings in common equity - 18 Investments in the capital of banking, financial and insurance entities that are
outside the scope of regulatory consolidation, net of eligible short positions, where the ADI does not own more than 10% of the issued share capital (amount above 10% threshold)
- Table c
19 Significant investments in the ordinary shares of banking, financial and insurance entities that are outside the scope of regulatory consolidation, net of eligible short positions (amount above 10% threshold)
- Table c
20 Mortgage service rights (amount above 10% threshold) - 21 Deferred tax assets arising from temporary differences (amount above 10%
threshold, net of related tax liability) - Table a
22 Amount exceeding the 15% threshold - 23 of which: significant investments in the ordinary shares of financial entities - Table c 24 of which: mortgage servicing rights - 25 of which: deferred tax assets arising from temporary differences - Table a APRA Specific Regulatory Adjustments - 26 National specific regulatory adjustments (sum of rows 26a, 26b, 26c, 26d, 26e, 26f,
26g, 26h, 26i and 26j) 1,832
26a of which: treasury shares - 26b of which: offset to dividends declared under a dividend reinvestment plan (DRP),
to the extent that the dividends are used to purchase new ordinary shares issued by the ADI
-
26c of which: deferred fee income - 26d of which: equity investments in financial institutions not reported in rows 18, 19
and 23 551 Table c
26e of which: deferred tax assets not reported in rows 10, 21 and 25 75 Table a 26f of which: capitalised expenses 473 26g of which: investments in commercial (non-financial) entities that are deducted
under APRA prudential requirements 706 Table c
26h of which: covered bonds in excess of asset cover in pools - 26i of which: undercapitalisation of a non-consolidated subsidiary -
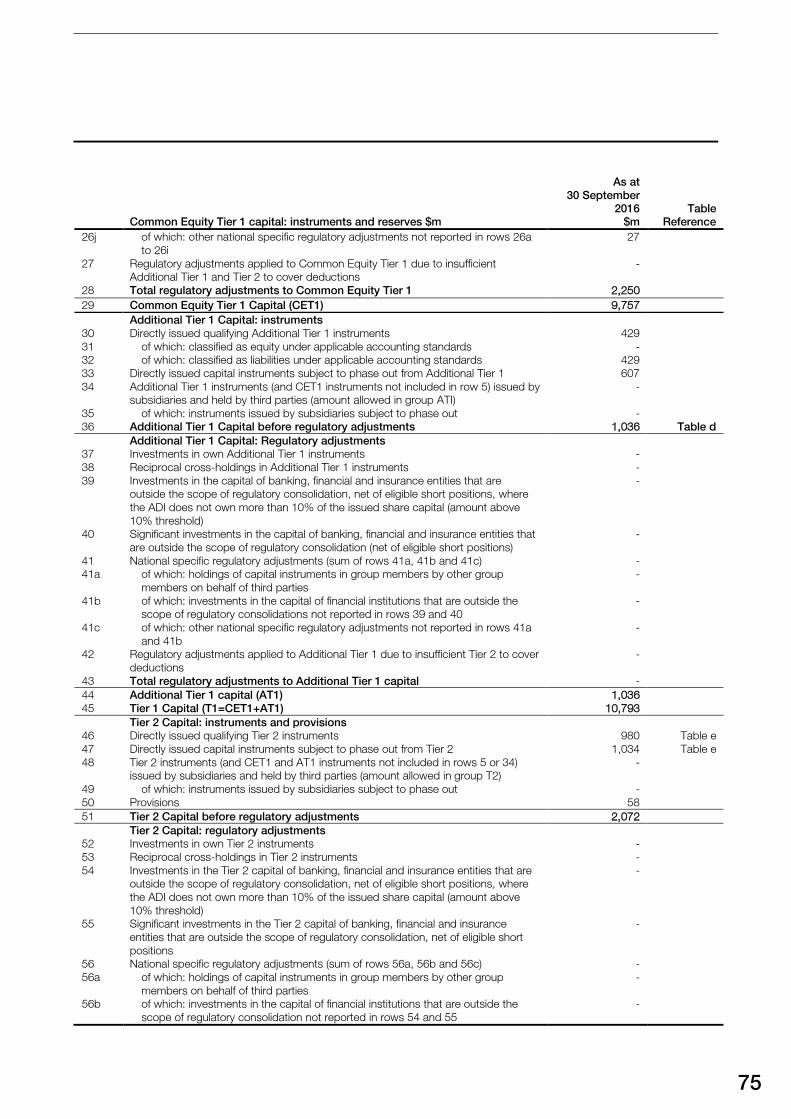
75
Common Equity Tier 1 capital: instruments and reserves $m
As at 30 September
2016 $m
Table Reference
26j of which: other national specific regulatory adjustments not reported in rows 26a to 26i
27
27 Regulatory adjustments applied to Common Equity Tier 1 due to insufficient Additional Tier 1 and Tier 2 to cover deductions
-
28 Total regulatory adjustments to Common Equity Tier 1 2,250 29 Common Equity Tier 1 Capital (CET1) 9,757 Additional Tier 1 Capital: instruments 30 Directly issued qualifying Additional Tier 1 instruments 429 31 of which: classified as equity under applicable accounting standards - 32 of which: classified as liabilities under applicable accounting standards 429 33 Directly issued capital instruments subject to phase out from Additional Tier 1 607 34 Additional Tier 1 instruments (and CET1 instruments not included in row 5) issued by
subsidiaries and held by third parties (amount allowed in group ATI) -
35 of which: instruments issued by subsidiaries subject to phase out - 36 Additional Tier 1 Capital before regulatory adjustments 1,036 Table d Additional Tier 1 Capital: Regulatory adjustments 37 Investments in own Additional Tier 1 instruments - 38 Reciprocal cross-holdings in Additional Tier 1 instruments - 39 Investments in the capital of banking, financial and insurance entities that are
outside the scope of regulatory consolidation, net of eligible short positions, where the ADI does not own more than 10% of the issued share capital (amount above 10% threshold)
-
40 Significant investments in the capital of banking, financial and insurance entities that are outside the scope of regulatory consolidation (net of eligible short positions)
-
41 National specific regulatory adjustments (sum of rows 41a, 41b and 41c) - 41a of which: holdings of capital instruments in group members by other group
members on behalf of third parties -
41b of which: investments in the capital of financial institutions that are outside the scope of regulatory consolidations not reported in rows 39 and 40
-
41c of which: other national specific regulatory adjustments not reported in rows 41a and 41b
-
42 Regulatory adjustments applied to Additional Tier 1 due to insufficient Tier 2 to cover deductions
-
43 Total regulatory adjustments to Additional Tier 1 capital - 44 Additional Tier 1 capital (AT1) 1,036 45 Tier 1 Capital (T1=CET1+AT1) 10,793 Tier 2 Capital: instruments and provisions 46 Directly issued qualifying Tier 2 instruments 980 Table e 47 Directly issued capital instruments subject to phase out from Tier 2 1,034 Table e 48 Tier 2 instruments (and CET1 and AT1 instruments not included in rows 5 or 34)
issued by subsidiaries and held by third parties (amount allowed in group T2) -
49 of which: instruments issued by subsidiaries subject to phase out - 50 Provisions 58 51 Tier 2 Capital before regulatory adjustments 2,072 Tier 2 Capital: regulatory adjustments 52 Investments in own Tier 2 instruments - 53 Reciprocal cross-holdings in Tier 2 instruments - 54 Investments in the Tier 2 capital of banking, financial and insurance entities that are
outside the scope of regulatory consolidation, net of eligible short positions, where the ADI does not own more than 10% of the issued share capital (amount above 10% threshold)
-
55 Significant investments in the Tier 2 capital of banking, financial and insurance entities that are outside the scope of regulatory consolidation, net of eligible short positions
-
56 National specific regulatory adjustments (sum of rows 56a, 56b and 56c) - 56a of which: holdings of capital instruments in group members by other group
members on behalf of third parties -
56b of which: investments in the capital of financial institutions that are outside the scope of regulatory consolidation not reported in rows 54 and 55
-
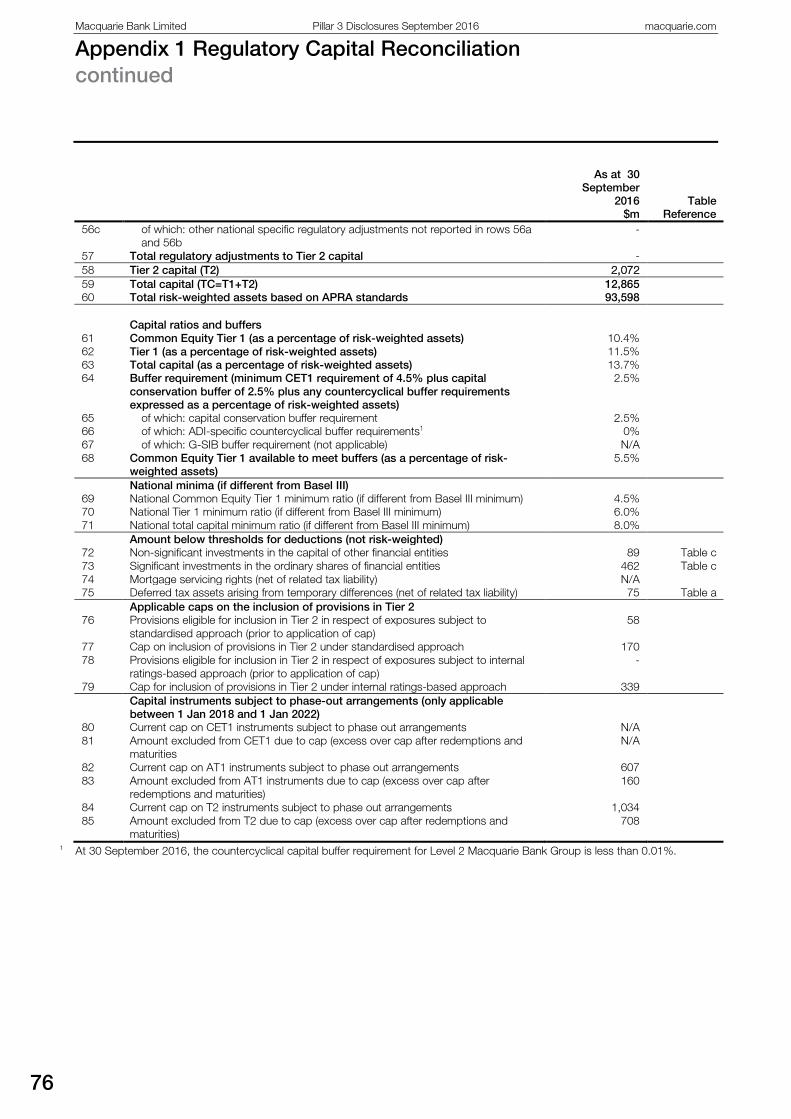
Macquarie Bank Limited Pillar 3 Disclosures September 2016 macquarie.com
Appendix 1 Regulatory Capital Reconciliation continued
76
As at 30 September
2016 $m
Table Reference
56c of which: other national specific regulatory adjustments not reported in rows 56a and 56b
-
57 Total regulatory adjustments to Tier 2 capital - 58 Tier 2 capital (T2) 2,072 59 Total capital (TC=T1+T2) 12,865 60 Total risk-weighted assets based on APRA standards 93,598
Capital ratios and buffers 61 Common Equity Tier 1 (as a percentage of risk-weighted assets) 10.4% 62 Tier 1 (as a percentage of risk-weighted assets) 11.5% 63 Total capital (as a percentage of risk-weighted assets) 13.7% 64 Buffer requirement (minimum CET1 requirement of 4.5% plus capital
conservation buffer of 2.5% plus any countercyclical buffer requirements expressed as a percentage of risk-weighted assets)
2.5%
65 of which: capital conservation buffer requirement 2.5% 66 of which: ADI-specific countercyclical buffer requirements1 0% 67 of which: G-SIB buffer requirement (not applicable) N/A 68 Common Equity Tier 1 available to meet buffers (as a percentage of risk-
weighted assets) 5.5%
National minima (if different from Basel III) 69 National Common Equity Tier 1 minimum ratio (if different from Basel III minimum) 4.5% 70 National Tier 1 minimum ratio (if different from Basel III minimum) 6.0% 71 National total capital minimum ratio (if different from Basel III minimum) 8.0% Amount below thresholds for deductions (not risk-weighted) 72 Non-significant investments in the capital of other financial entities 89 Table c 73 Significant investments in the ordinary shares of financial entities 462 Table c 74 Mortgage servicing rights (net of related tax liability) N/A 75 Deferred tax assets arising from temporary differences (net of related tax liability) 75 Table a Applicable caps on the inclusion of provisions in Tier 2 76 Provisions eligible for inclusion in Tier 2 in respect of exposures subject to
standardised approach (prior to application of cap) 58
77 Cap on inclusion of provisions in Tier 2 under standardised approach 170 78 Provisions eligible for inclusion in Tier 2 in respect of exposures subject to internal
ratings-based approach (prior to application of cap) -
79 Cap for inclusion of provisions in Tier 2 under internal ratings-based approach 339 Capital instruments subject to phase-out arrangements (only applicable
between 1 Jan 2018 and 1 Jan 2022)
80 Current cap on CET1 instruments subject to phase out arrangements N/A 81 Amount excluded from CET1 due to cap (excess over cap after redemptions and
maturities N/A
82 Current cap on AT1 instruments subject to phase out arrangements 607 83 Amount excluded from AT1 instruments due to cap (excess over cap after
redemptions and maturities) 160
84 Current cap on T2 instruments subject to phase out arrangements 1,034 85 Amount excluded from T2 due to cap (excess over cap after redemptions and
maturities) 708
1 At 30 September 2016, the countercyclical capital buffer requirement for Level 2 Macquarie Bank Group is less than 0.01%.

77
1.2 Regulatory Balance Sheet as at 30 September 2016
Macquarie Bank Group
Consolidated1 $m
Adjustment2 $m
Level 2 Regulatory
Balance Sheet $m
Template/ Reconciliation
Table Reference
Assets
Receivables from financial institutions 30,679 (54) 30,625
Trading portfolio assets 27,029 - 27,029
Derivative assets 15,211 (15) 15,196
Investment securities available for sale 5,314 21 5,335
Other assets 8,102 (1,525) 6,577
Loan assets held at amortised cost 76,672 (189) 76,483
Other financial assets at fair value through profit or loss 768 - 768
Due from related body corporate entities 1,544 334 1,878
Property, plant and equipment 10,735 (528) 10,207
Interests in associates and joint ventures accounted for using the equity method 243 (86) 157
Intangible assets3 189 - 189 Table b
Deferred tax assets 155 (6) 149 Table a
Investments in regulatory non-consolidated subsidiaries1 - 444 444 Table c (Footnote 2)
Total Assets 176,641 (1,604) 175,037
Liabilities
Trading portfolio liabilities 5,051 - 5,051
Derivative liabilities 12,908 (13) 12,895
Deposits 55,433 (2) 55,431
Other liabilities 7,576 (1,116) 6,460
Payables to financial institutions 20,826 (222) 20,604
Other financial liabilities at fair value through profit or loss 2,591 (1) 2,590
Due to related body corporate entities 6,600 76 6,676
Debt issued at amortised cost 48,978 (223) 48,755
Deferred tax liabilities 372 (9) 363
Total liabilities excluding loan capital 160,335 (1,510) 158,825
Loan capital
Subordinated debt at amortised cost 3,811 - 3,811 Table d
Total loan capital 3,811 - 3,811
Total liabilities 164,146 (1,510) 162,636
Net Assets 12,495 (94) 12,401
Equity
Contributed equity 9,891 - 9,891 Table f
Reserves 330 38 368 Row 3
Retained earnings 2,270 (131) 2,139 Row 2
Total capital and reserves attributable to equity holders of Macquarie Bank Limited 12,491 (93) 12,398
Non-controlling Interests 4 (1) 3 Table g
Total equity 12,495 (94) 12,401 1 Macquarie Bank Limited Consolidated Group as per financial statements as at 30 September 2016. 2 Reflects the deconsolidation of certain subsidiaries for APRA reporting purposes. The subsidiaries which are deconsolidated for
regulatory purposes include mortgage and leasing special purpose vehicles (SPV) which Macquarie has not made an APS120 Attachment B Para 25 election to be included in the Bank Regulatory Group, and entities conducting insurance, funds management and non-financial operations. Mortgage and leasing special purpose vehicles (SPV) which Macquarie has made an APS 120 Attachment B Para 25 election are included in the Bank Level 2 Regulatory Group.
3 The intangible component of investments in non-consolidated subsidiaries is included in Intangible assets.
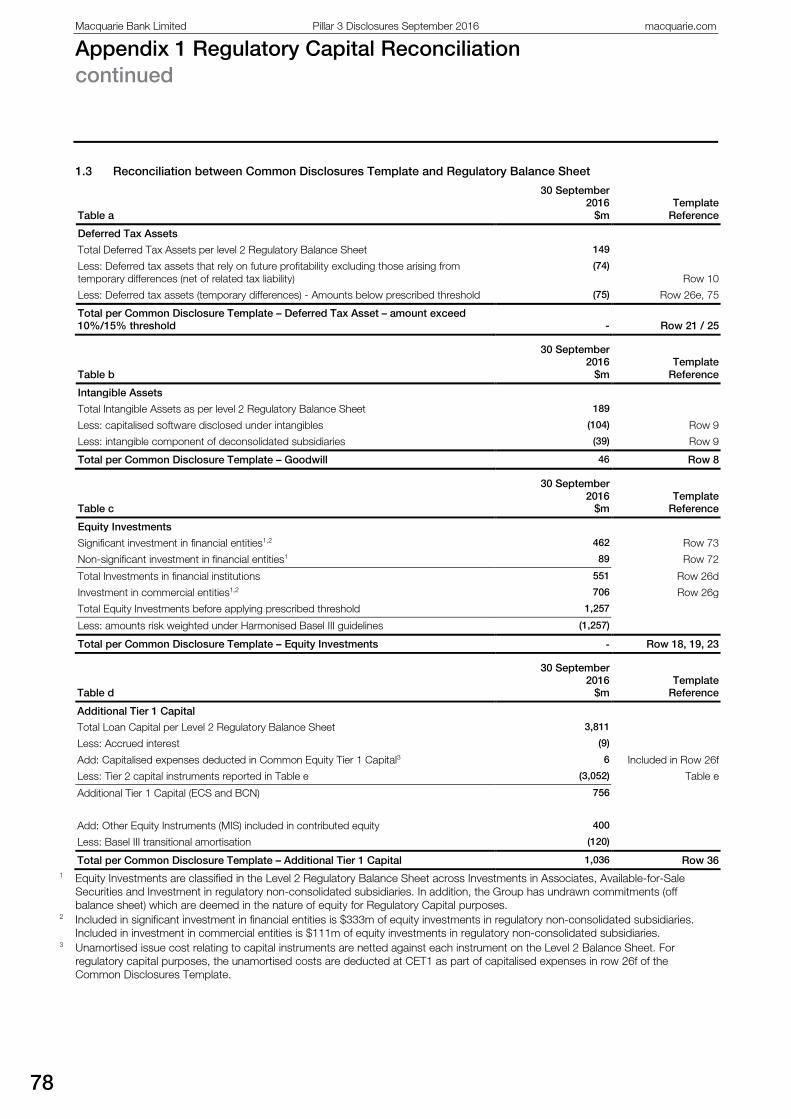
Macquarie Bank Limited Pillar 3 Disclosures September 2016 macquarie.com
Appendix 1 Regulatory Capital Reconciliation continued
78
1.3 Reconciliation between Common Disclosures Template and Regulatory Balance Sheet
Table a
30 September 2016
$m Template
Reference
Deferred Tax Assets
Total Deferred Tax Assets per level 2 Regulatory Balance Sheet 149
Less: Deferred tax assets that rely on future profitability excluding those arising from temporary differences (net of related tax liability)
(74) Row 10
Less: Deferred tax assets (temporary differences) - Amounts below prescribed threshold (75) Row 26e, 75
Total per Common Disclosure Template – Deferred Tax Asset – amount exceed 10%/15% threshold - Row 21 / 25
Table b
30 September 2016
$m Template
Reference
Intangible Assets
Total Intangible Assets as per level 2 Regulatory Balance Sheet 189
Less: capitalised software disclosed under intangibles (104) Row 9
Less: intangible component of deconsolidated subsidiaries (39) Row 9
Total per Common Disclosure Template – Goodwill 46 Row 8
Table c
30 September 2016
$m Template
Reference
Equity Investments
Significant investment in financial entities1,2 462 Row 73
Non-significant investment in financial entities1 89 Row 72
Total Investments in financial institutions 551 Row 26d
Investment in commercial entities1,2 706 Row 26g
Total Equity Investments before applying prescribed threshold 1,257
Less: amounts risk weighted under Harmonised Basel III guidelines (1,257)
Total per Common Disclosure Template – Equity Investments - Row 18, 19, 23
Table d
30 September 2016
$m Template
Reference
Additional Tier 1 Capital
Total Loan Capital per Level 2 Regulatory Balance Sheet 3,811
Less: Accrued interest (9)
Add: Capitalised expenses deducted in Common Equity Tier 1 Capital3 6 Included in Row 26f
Less: Tier 2 capital instruments reported in Table e (3,052) Table e
Additional Tier 1 Capital (ECS and BCN) 756
Add: Other Equity Instruments (MIS) included in contributed equity 400
Less: Basel III transitional amortisation (120)
Total per Common Disclosure Template – Additional Tier 1 Capital 1,036 Row 36 1 Equity Investments are classified in the Level 2 Regulatory Balance Sheet across Investments in Associates, Available-for-Sale
Securities and Investment in regulatory non-consolidated subsidiaries. In addition, the Group has undrawn commitments (off balance sheet) which are deemed in the nature of equity for Regulatory Capital purposes.
2 Included in significant investment in financial entities is $333m of equity investments in regulatory non-consolidated subsidiaries. Included in investment in commercial entities is $111m of equity investments in regulatory non-consolidated subsidiaries.
3 Unamortised issue cost relating to capital instruments are netted against each instrument on the Level 2 Balance Sheet. For regulatory capital purposes, the unamortised costs are deducted at CET1 as part of capitalised expenses in row 26f of the Common Disclosures Template.

79
Table d cont
30 September 2016
$m Template
Reference
Additional Tier 1 Capital Instruments
Macquarie Income Securities 280
Macquarie Bank Capital Notes 429
Macquarie Exchangeable Capital Securities 327
Total per Common Disclosure Template – Additional Tier 1 Capital 1,036 Row 36
Table e
30 September 2016
$m Template
Reference
Total Tier 2 Capital per Balance Sheet
Total Tier 2 Capital per Balance Sheet 3,052 Table d
Less: Fair value hedge adjustments1 (282)
Less: Accrued Interest (50)
Less: Foreign Exchange Gain Included in Balance Sheet (11)
Less: Basel III transitional amortisation (695)
Total per Common Disclosure Template – Tier 2 Capital 2,014 Row 46+47
Tier 2 Capital Instruments
Subordinated Debt- EUR600m – eligible for transition (457)
Subordinated Debt – USD1.0bn – eligible for transition (577)
Subordinated Debt – USD750m– fully qualified Tier 2 instruments (980)
Total per Common Disclosure Template – Tier 2 Capital (2,014) Row 46+47
Details on the main features of Capital instruments included in the Group’s Regulatory Capital, (Ordinary Share Capital, Additional Tier 1 Capital and Tier 2 capital) as required by APS 330 Attachment B can be found at: http://www.macquarie.com.au/mgl/au/about-macquarie-group/investor-relations.
Table f
30 September 2016
$m Template
Reference
Contributed Equity
Total Contributed Equity as per level 2 Regulatory Balance Sheet 9,891
Less: Additional tier 1 instruments (MIS) included in share capital (400)
Add: Capitalised expenses deducted in Common Equity Tier 1 Capital 9 Included in Row 26f
Total per Common Disclosure Template – Contributed Equity 9,500 Row 1
1 For regulatory capital purposes, APRA requires these instruments to be included as if they were unhedged.
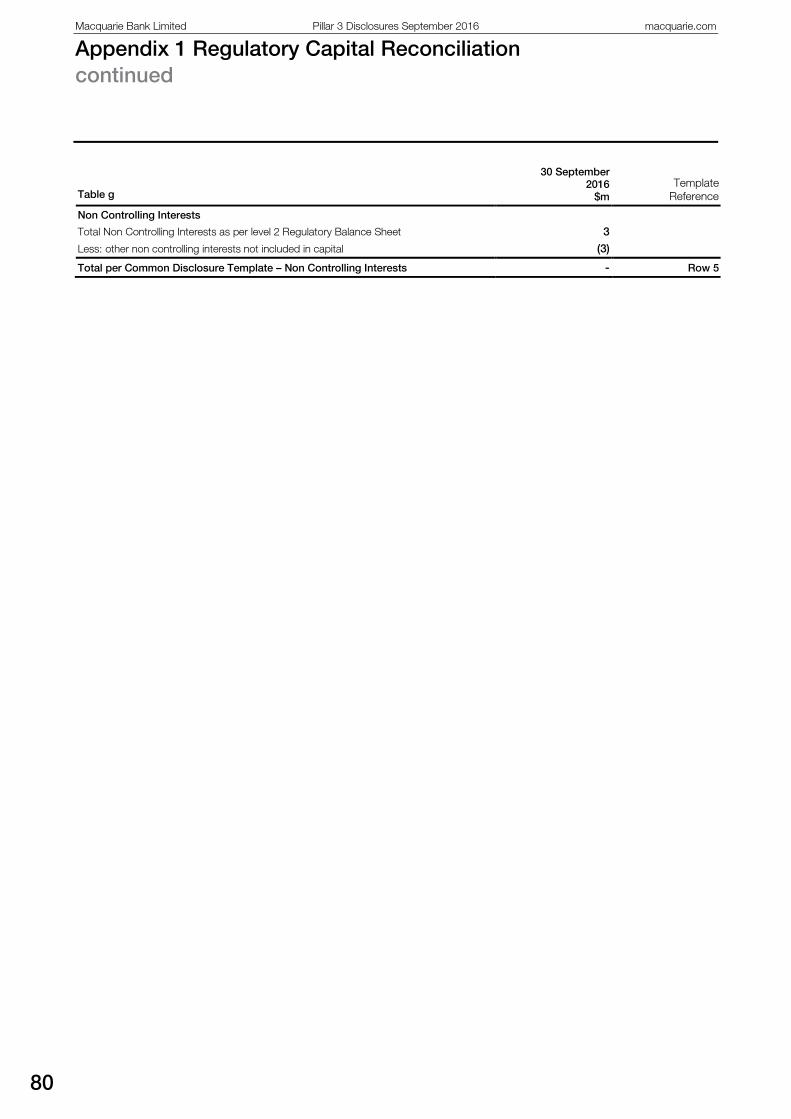
Macquarie Bank Limited Pillar 3 Disclosures September 2016 macquarie.com
Appendix 1 Regulatory Capital Reconciliation continued
80
Table g
30 September 2016
$m Template
Reference
Non Controlling Interests
Total Non Controlling Interests as per level 2 Regulatory Balance Sheet 3
Less: other non controlling interests not included in capital (3)
Total per Common Disclosure Template – Non Controlling Interests - Row 5
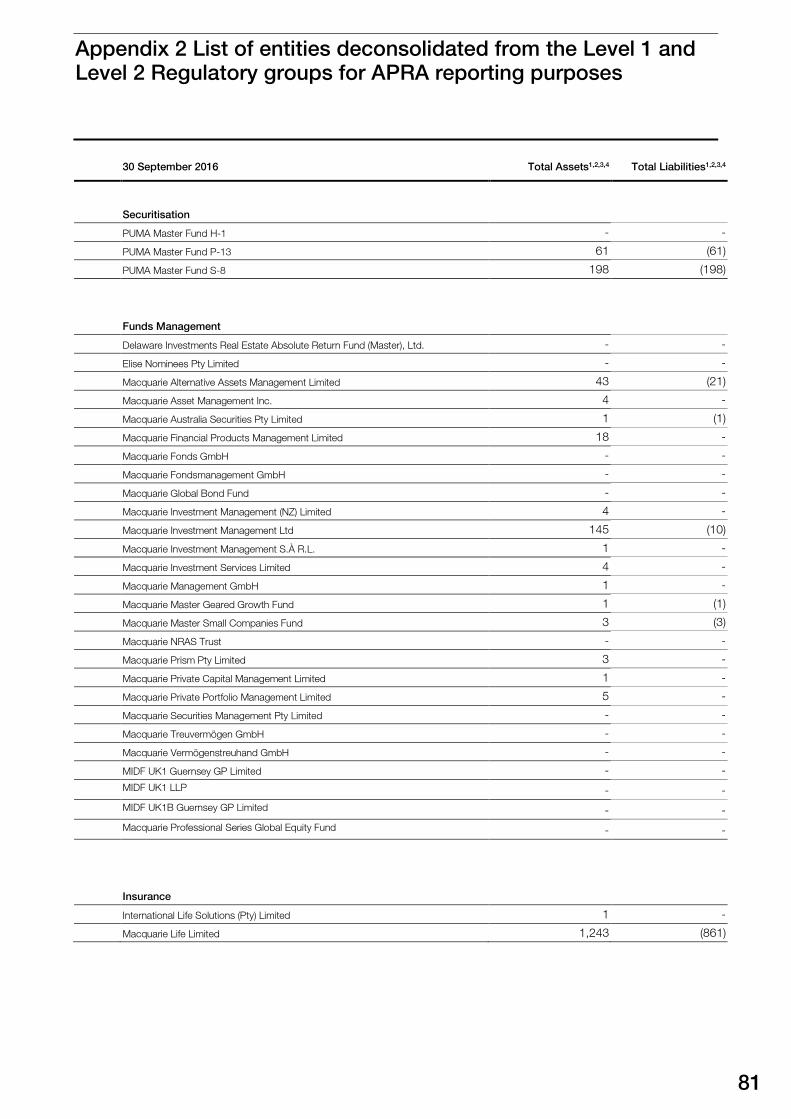
Appendix 2 List of entities deconsolidated from the Level 1 and Level 2 Regulatory groups for APRA reporting purposes
81
30 September 2016 Total Assets1,2,3,4 Total Liabilities1,2,3,4
Securitisation
PUMA Master Fund H-1 - - PUMA Master Fund P-13 61 (61) PUMA Master Fund S-8 198 (198)
Funds Management
Delaware Investments Real Estate Absolute Return Fund (Master), Ltd. - - Elise Nominees Pty Limited - - Macquarie Alternative Assets Management Limited 43 (21) Macquarie Asset Management Inc. 4 - Macquarie Australia Securities Pty Limited 1 (1) Macquarie Financial Products Management Limited 18 - Macquarie Fonds GmbH - - Macquarie Fondsmanagement GmbH - -
Macquarie Global Bond Fund - - Macquarie Investment Management (NZ) Limited 4 - Macquarie Investment Management Ltd 145 (10) Macquarie Investment Management S.À R.L. 1 - Macquarie Investment Services Limited 4 - Macquarie Management GmbH 1 - Macquarie Master Geared Growth Fund 1 (1) Macquarie Master Small Companies Fund 3 (3) Macquarie NRAS Trust - - Macquarie Prism Pty Limited 3 - Macquarie Private Capital Management Limited 1 - Macquarie Private Portfolio Management Limited 5 - Macquarie Securities Management Pty Limited - - Macquarie Treuvermögen GmbH - - Macquarie Vermögenstreuhand GmbH - - MIDF UK1 Guernsey GP Limited - - MIDF UK1 LLP - - MIDF UK1B Guernsey GP Limited - - Macquarie Professional Series Global Equity Fund - -
Insurance
International Life Solutions (Pty) Limited 1 -
Macquarie Life Limited 1,243 (861)
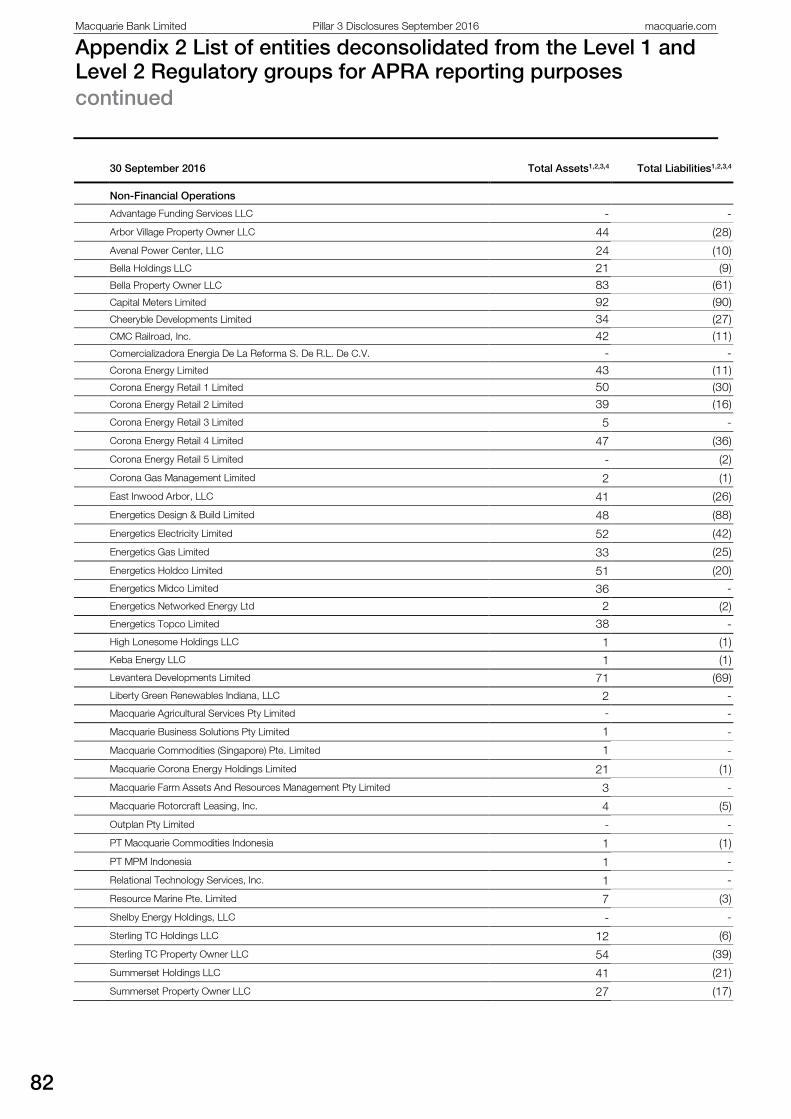
Macquarie Bank Limited Pillar 3 Disclosures September 2016 macquarie.com
Appendix 2 List of entities deconsolidated from the Level 1 and Level 2 Regulatory groups for APRA reporting purposes continued
82
30 September 2016 Total Assets1,2,3,4 Total Liabilities1,2,3,4
Non-Financial Operations
Advantage Funding Services LLC - -
Arbor Village Property Owner LLC 44 (28) Avenal Power Center, LLC 24 (10) Bella Holdings LLC 21 (9) Bella Property Owner LLC 83 (61) Capital Meters Limited 92 (90) Cheeryble Developments Limited 34 (27) CMC Railroad, Inc. 42 (11) Comercializadora Energia De La Reforma S. De R.L. De C.V. - - Corona Energy Limited 43 (11) Corona Energy Retail 1 Limited 50 (30) Corona Energy Retail 2 Limited 39 (16) Corona Energy Retail 3 Limited 5 - Corona Energy Retail 4 Limited 47 (36) Corona Energy Retail 5 Limited - (2) Corona Gas Management Limited 2 (1) East Inwood Arbor, LLC 41 (26) Energetics Design & Build Limited 48 (88) Energetics Electricity Limited 52 (42) Energetics Gas Limited 33 (25) Energetics Holdco Limited 51 (20) Energetics Midco Limited 36 - Energetics Networked Energy Ltd 2 (2) Energetics Topco Limited 38 -
High Lonesome Holdings LLC 1 (1) Keba Energy LLC 1 (1) Levantera Developments Limited 71 (69) Liberty Green Renewables Indiana, LLC 2 - Macquarie Agricultural Services Pty Limited - -
Macquarie Business Solutions Pty Limited 1 -
Macquarie Commodities (Singapore) Pte. Limited 1 -
Macquarie Corona Energy Holdings Limited 21 (1) Macquarie Farm Assets And Resources Management Pty Limited 3 - Macquarie Rotorcraft Leasing, Inc. 4 (5) Outplan Pty Limited - - PT Macquarie Commodities Indonesia 1 (1) PT MPM Indonesia 1 - Relational Technology Services, Inc. 1 - Resource Marine Pte. Limited 7 (3) Shelby Energy Holdings, LLC - - Sterling TC Holdings LLC 12 (6) Sterling TC Property Owner LLC 54 (39) Summerset Holdings LLC 41 (21) Summerset Property Owner LLC 27 (17)

83
1 These balances, along with any Australian GAAP adjustment where required, are included in Macquarie Bank Group’s reviewed Australian GAAP financial statements for the period ended 30 September 2016. Financial statements under local GAAP of certain entities may be subjected to separate review/audit from the Macquarie Bank Group audit and these reviews/audit may not be complete as at the date of this report.
2 The total assets and liabilities should not be aggregated as certain entities are holding companies for other entities in the table shown above.
3 Numbers are rounded to the nearest A$ million. Asset balances are shown as positive and liability balances are shown as negative. 4 The assets and liabilities for deconsolidated subsidiaries includes receivable from and payable to related entities.
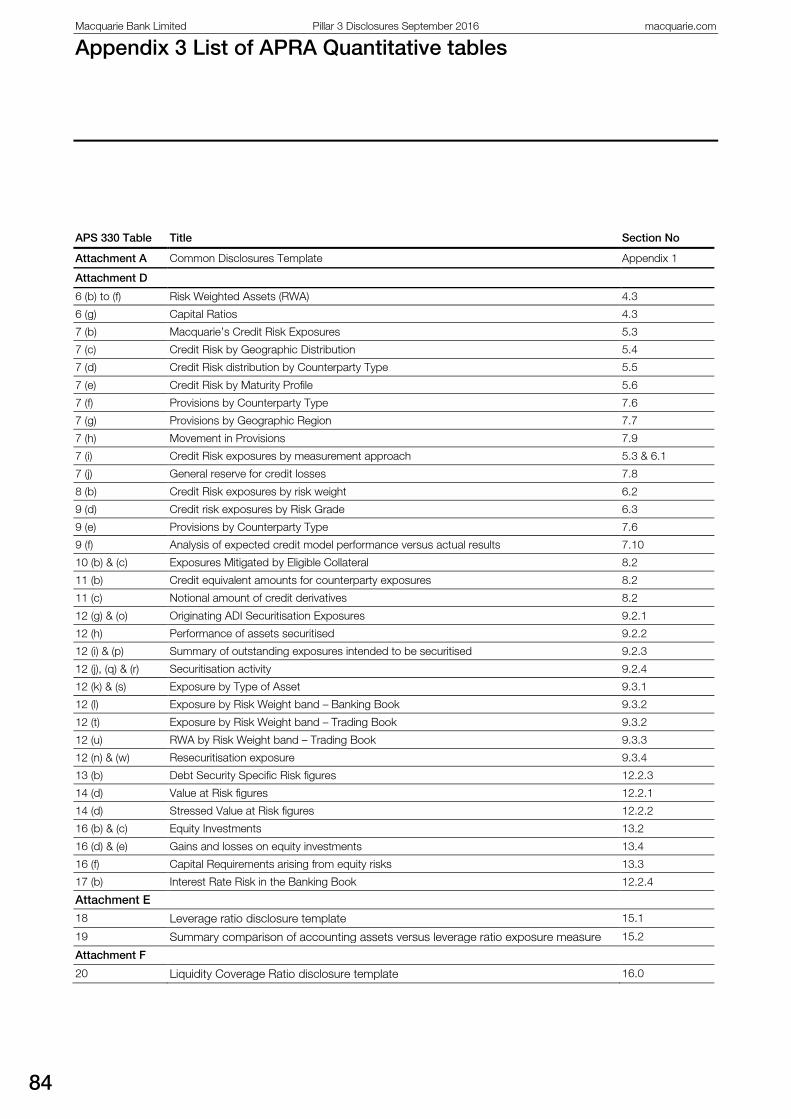
Macquarie Bank Limited Pillar 3 Disclosures September 2016 macquarie.com
Appendix 3 List of APRA Quantitative tables
84
APS 330 Table Title Section No
Attachment A Common Disclosures Template Appendix 1
Attachment D
6 (b) to (f) Risk Weighted Assets (RWA) 4.3
6 (g) Capital Ratios 4.3
7 (b) Macquarie’s Credit Risk Exposures 5.3
7 (c) Credit Risk by Geographic Distribution 5.4
7 (d) Credit Risk distribution by Counterparty Type 5.5
7 (e) Credit Risk by Maturity Profile 5.6
7 (f) Provisions by Counterparty Type 7.6
7 (g) Provisions by Geographic Region 7.7
7 (h) Movement in Provisions 7.9
7 (i) Credit Risk exposures by measurement approach 5.3 & 6.1
7 (j) General reserve for credit losses 7.8
8 (b) Credit Risk exposures by risk weight 6.2
9 (d) Credit risk exposures by Risk Grade 6.3
9 (e) Provisions by Counterparty Type 7.6
9 (f) Analysis of expected credit model performance versus actual results 7.10
10 (b) & (c) Exposures Mitigated by Eligible Collateral 8.2
11 (b) Credit equivalent amounts for counterparty exposures 8.2
11 (c) Notional amount of credit derivatives 8.2
12 (g) & (o) Originating ADI Securitisation Exposures 9.2.1
12 (h) Performance of assets securitised 9.2.2
12 (i) & (p) Summary of outstanding exposures intended to be securitised 9.2.3
12 (j), (q) & (r) Securitisation activity 9.2.4
12 (k) & (s) Exposure by Type of Asset 9.3.1
12 (l) Exposure by Risk Weight band – Banking Book 9.3.2
12 (t) Exposure by Risk Weight band – Trading Book 9.3.2
12 (u) RWA by Risk Weight band – Trading Book 9.3.3
12 (n) & (w) Resecuritisation exposure 9.3.4
13 (b) Debt Security Specific Risk figures 12.2.3
14 (d) Value at Risk figures 12.2.1
14 (d) Stressed Value at Risk figures 12.2.2
16 (b) & (c) Equity Investments 13.2
16 (d) & (e) Gains and losses on equity investments 13.4
16 (f) Capital Requirements arising from equity risks 13.3
17 (b) Interest Rate Risk in the Banking Book 12.2.4
Attachment E
18 Leverage ratio disclosure template 15.1
19 Summary comparison of accounting assets versus leverage ratio exposure measure 15.2
Attachment F
20 Liquidity Coverage Ratio disclosure template 16.0
Appendix 4 Glossary of terms
85
ADI Authorised Deposit-taking Institution.
Additional Tier 1 Capital A capital measure defined by APRA comprising high quality components of capital that satisfy the following essential characteristics: – provide a permanent and unrestricted commitment of funds; – are freely available to absorb losses; – rank behind the claims of depositors and other more senior creditors in the event of winding up of the issuer; and – provide for fully discretionary capital distributions.
ALA Alternative Liquid Assets
AMA Advanced Measurement Approach (for determining operational risk).
APRA Australian Prudential Regulation Authority.
Associates Associates are entities over which Macquarie has significant influence, but not control. Investments in associates may be further classified as Held For Sale (‘HFS’) associates. HFS investments are those that have a high probability of being sold within 12 months to external parties. Associates that are not held for sale are carried at cost and equity-accounted. Macquarie’s share of the investment’s post-acquisition profits or losses is recognised in the income statement and its share of post-acquisition movements in reserves is recognised within equity.
AVC multiplier Asset Value Correlation multiplier. A loading introduced as part of Basel III which is added to the correlation factor when calculating the RWA on exposures to certain financial institutions.
AVS assets Available-for-sale assets Available for sale. AVS assets are investments where Macquarie does not have significant influence or control and are intended to be held for an indefinite period. AVS investments are initially recognised at fair value and revalued in subsequent periods to recognise changes in the assets’ fair value with these revaluations included in the AVS reserve in equity. If and when the AVS asset is derecognised or impaired, the cumulative gain or loss will be recognised in the income statement.
BAC Board Audit Committee.
BRiC Board Risk Committee
CA Credit Assurance
Contingent liabilities Defined in AASB 137 Provisions, Contingent Liabilities and Contingent Assets as a possible obligation that arises from past events and whose existence will be confirmed only by the occurrence or non-occurrence of one or more uncertain future events not wholly within the control of the entity; or a present obligation that arises from past events but is not recognised because it is not probable to occur or the amount cannot be reliably measured.
CCE Current Credit Exposure. The sum of the positive mark-to-market value (or replacement cost) of market-related contracts entered into by the ADI.
CCR Counterparty Credit risk
CEA Credit Equivalent Amount. The on-balance sheet equivalent value of an off balance sheet transaction.
Central counterparty A clearing house or exchange that interposes itself between counterparties to contracts traded in one or more financial markets, becoming the buyer to every seller and the seller to every buyer, and therefore ensuring the future performance or open contracts.
CLF Committed Liquidity Facility
Common Equity Tier 1 capital A capital measure defined by APRA comprising the highest quality components of capital that fully satisfy all the following essential characteristics: - provide a permanent and unrestricted commitment of funds, - are freely available to absorb losses, - do not impose any unavoidable servicing charge against earnings; and - rank behind the claims of depositors and other creditors in the event of winding up. Common equity tier 1 capital comprises Paid Up Capital, Retained Earnings, and certain reserves.
Common Equity Tier 1 Capital Ratio
Common Equity Tier 1 Capital net of Common Equity Tier 1 deductions expressed as a percentage of RWA.
CRO Chief Risk Officer
CVA Credit Valuation Adjustment. The risk of mark-to-market losses on the expected counterparty risk to OTC derivatives.
Deconsolidated entities Entities involved in conducting insurance, funds management and non financial operations including special purpose vehicles (SPV) that are not consolidated for the APRA regulatory reporting group.
DVP Delivery versus Payment
Macquarie Bank Limited Pillar 3 Disclosures September 2016 macquarie.com
Appendix 4 Glossary of terms continued
86
EAD Exposure at Default – the gross exposure under a facility (the amount that is legally owed to the ADI) upon
default of an obligor.
ECAI External Credit Assessment Institution.
ECAM Economic Capital Adequacy Model.
EL Expected Loss, which is a function of PD and LGD.
ELE Extended Licensed Entity is an entity that is treated as part of the ADI (‘Level 1’) for the purpose of measuring the ADI’s capital adequacy and exposures to related entities. The criterion for qualification as an ELE is detailed in the APRA Prudential Standards.
EMEA Europe, Middle East & Africa.
ERL Equity Risk Limit – Board imposed limit by which equity risk positions are managed.
FCS Financial Claims Scheme
FICO Fair Isaac Corporation
FIRB Foundation Internal Ratings Based Approach whereby PD and Maturity are internally estimated by the ADI and LGD is set by APRA.
GAAP Generally Accepted Accounting Principles
Gross credit risk exposure The potential loss that Macquarie would incur as a result of a default by an obligor excluding the impact of netting and credit risk mitigation.
HQLA High Quality Liquid Assets
ICAAP Internal Capital Adequacy Assessment Process.
IRRBB Interest Rate Risk in the Banking Book.
Impaired assets An asset for which the ultimate collectability of principal and interest is compromised.
ISDA International Swaps and Derivatives Association
LCR Liquidity Coverage Ratio
Level 2 MBL Regulatory Group MBL, its parent Macquarie B.H. Pty Ltd and MBL’s subsidiaries but excluding deconsolidated entities for APRA reporting purposes.
Level 3 Regulatory Group MGL and its subsidiaries.
LGD Loss given default is defined as the economic loss which arises upon default of the obligor.
Macquarie Income Preferred Securities (MIPS)
MIPS were issued when the London branch of the Bank issued 7,000 reset subordinated convertible debentures, each with a face value of £50,000, to Macquarie Capital Funding LP, a controlled entity of the Bank. The convertible debentures currently pay a fixed return of 6.177% until April 2020. As at 31 March 2014, Macquarie Bank had £42.5 million of MIPS on issue which are held by parties not associated with Macquarie. MIPS were fully redeemed by Macquarie Bank Group on 22 June 2015.
Macquarie Income Securities (MIS) The Macquarie Income Securities (MIS) are perpetual and carry no conversion rights. Distributions are paid quarterly, based on a floating rate of BBSW plus 1.7%. Subject to limitations on the amount of hybrids eligible for inclusion as Tier 1 Capital, they qualify as Tier 1 Capital and are treated as equity on the balance sheet. There are four million $A100 face value MIS on issue.
MBL Macquarie Bank Limited.
MBL Consolidated Group MBL, its parent Macquarie B.H. Pty Ltd and MBL’s subsidiaries.
MGL Macquarie Group Limited.
NCO Net Cash Outflows
ORMF Operational Risk Management Framework
PCE, PFCE Potential Credit Exposure (PCE) / Potential Future Credit Exposure (PFCE). The potential exposures arising on a transaction calculated as the notional principal amount multiplied by a credit conversion factor specified by APRA.
PD Probability of Default. The likelihood of an obligor not satisfying its financial obligations.
Reserve Bank of Australia (RBA) Central bank of Australia with responsibility over monetary policy.
Risk-weighted assets (RWA) A risk-based measure of an entity’s exposures, which is used in assessing its overall capital adequacy.
RMBS Residential Mortgage Backed Securities
87
SFT Securities Financing Transactions (SFT). SFTs are transactions such as repurchase agreements, reverse repurchase agreements and security lending and borrowing, where the value of the transactions depends on market valuations and the transactions are often subject to margin agreements.
SME Small – Medium Enterprises
SPV’s Special purpose vehicles or securitisation vehicles.
Subordinated debt Debt issued by Macquarie for which agreements between Macquarie and the lenders provide, in the event of liquidation, that the entitlement of such lenders to repayment of the principal sum and interest thereon is and shall at all times be and remain subordinated to the rights of all other present and future creditors of Macquarie. Subordinated debt is classified as liabilities in the Macquarie financial statements and may be included in Tier 2 Capital.
Tier 1 Capital A capital measure defined by APRA, comprising common equity tier 1 capital plus eligible hybrid securities.
Tier 1 Capital Deductions An amount deducted in determining Tier 1 Capital, as defined in Prudential Standard APS 111.
Tier 1 Capital Ratio Tier 1 Capital expressed as a percentage of RWA.
Tier 2 Capital A capital measure defined by APRA, comprising other components of capital which contribute to the strength of the entity.
Tier 2 Capital Deductions An amount deducted in Tier 2 Capital, as defined in Prudential Standard APS 111.
Total Capital Tier 1 Capital plus Tier 2 Capital less Total Capital Deductions.
Total Capital Ratio Total Capital expressed as a percentage of RWA.