Embed Size (px)
Citation preview

Commercial in confidence
Piccadilly User Experience Testing
3G/4G/WiFi

Page 2 Commercial in confidence
Overview and Background
Test Equipment
Test Overview
Test Methodology
Test Results
Outline

Page 3 Commercial in confidence
Overview and Background
This document describes the user experience testing conducted in Piccadilly Circus by AWTG on 19th
October 2013. The aim of the exercise was to measure the performance of 3G and 4G within WiFi
network’s boundary and evaluating handover from 4G/3G to WiFi and vice versa. It should be noted
that tests were conducted under heavy rain. Table below shows overview of the tests:
Test
Connectivity
Smartphone 1 Smartphone 2 Smartphone 3 Smartphone 4 Smartphone 5
WiFi Only 3G Only 4G Only Roaming 3G/WiFi Roaming 4G/3G/2G/WiFi
User Connectivity Test X X X
Indoor Static Test
Outdoor Static Test
Outdoor Walk Test

Page 4 Commercial in confidence
Test Equipment: SwissQual QualiPoc Freerider
QualiPoc Freerider II consists of: • an Android master tablet • up to 6 Android slave Smartphones (5 Smartphones used for
the QoE measurement tests mentioned in this document) • GPS device.
AWTG has selected the SwissQual QualiPoc Freerider tool to carry out the tests in the area to capture user experience. MNO SIM cards installed in Samsung Galaxy SIII handsets have been used for these tests.
Page 5 Commercial in confidence
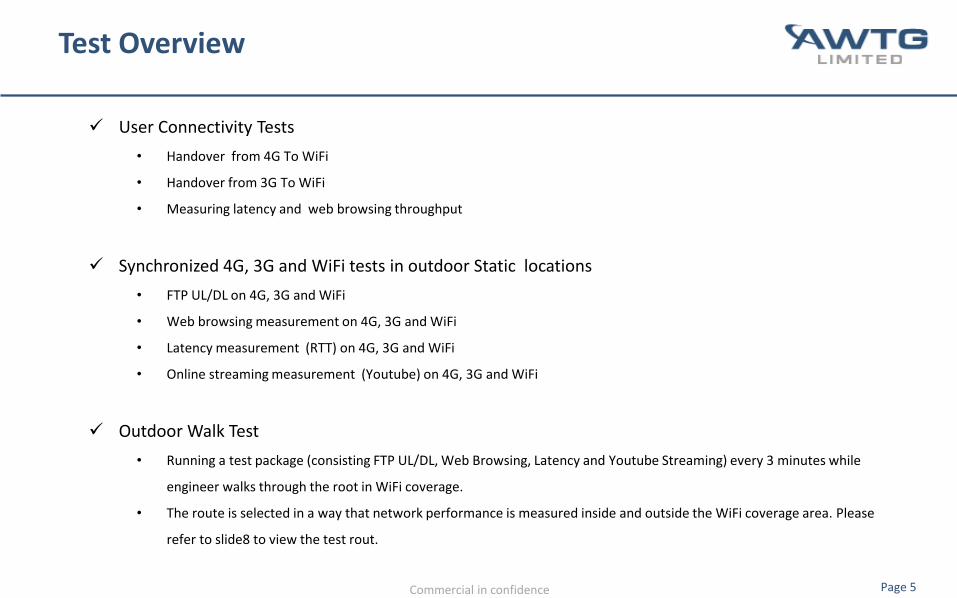
Test Overview
User Connectivity Tests
• Handover from 4G To WiFi
• Handover from 3G To WiFi
• Measuring latency and web browsing throughput
Synchronized 4G, 3G and WiFi tests in outdoor Static locations
• FTP UL/DL on 4G, 3G and WiFi
• Web browsing measurement on 4G, 3G and WiFi
• Latency measurement (RTT) on 4G, 3G and WiFi
• Online streaming measurement (Youtube) on 4G, 3G and WiFi
Outdoor Walk Test
• Running a test package (consisting FTP UL/DL, Web Browsing, Latency and Youtube Streaming) every 3 minutes while
engineer walks through the root in WiFi coverage.
• The route is selected in a way that network performance is measured inside and outside the WiFi coverage area. Please
refer to slide8 to view the test rout.
Page 6 Commercial in confidence
Test Methodology - User Connectivity
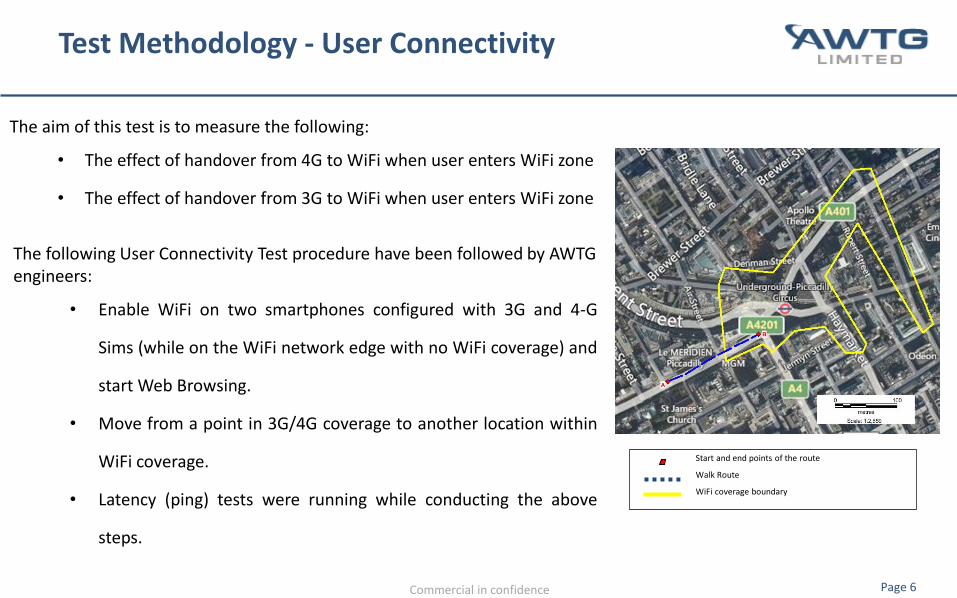
The following User Connectivity Test procedure have been followed by AWTG engineers:
• Enable WiFi on two smartphones configured with 3G and 4-G
Sims (while on the WiFi network edge with no WiFi coverage) and
start Web Browsing.
• Move from a point in 3G/4G coverage to another location within
WiFi coverage.
• Latency (ping) tests were running while conducting the above
steps.
Start and end points of the route
Walk Route
WiFi coverage boundary
The aim of this test is to measure the following:
• The effect of handover from 4G to WiFi when user enters WiFi zone
• The effect of handover from 3G to WiFi when user enters WiFi zone

Page 7 Commercial in confidence
Test Methodology - Outdoor Walk Test
4G/3G-WiFi walk tests have been conducted on a route within the WiFi network coverage area. One engineer
walked through the route carrying SwissQual Freerider tool which consisted of five Smartphones running the
following test package every 3 minutes.
• Latency/Ping (maximum test duration of 10 sec)
• Web Browsing (maximum test duration of 30sec)
• FTP DL (maximum test duration of 30sec)
• FTP UL (maximum test duration of 30sec)
• YouTube Streaming (maximum test duration of 1min)
Latency Web Browsing FTP DL FTP UL YouTube Streaming
10s 30 s 30s 30s 60s
180s 20s
wait
Test Cycle

Page 8 Commercial in confidence
Test Methodology - Outdoor Walk Test Route
4G/3G-WiFi walk tests have been conducted on a route
within the WiFi network coverage area. One engineer
walked through the route carrying SwissQual Freerider tool
which consisted of five Smartphones running the test
package every three minutes.
The walk test route which engineers followed is shown on
the map. The route is selected in a way that 3G and 4G
network performance is measured inside and outside the
WiFi coverage area.
Walk Route
WiFi AP
WiFi Network Boundary

Page 9 Commercial in confidence
Test Methodology - Static Tests
4G/3G-WiFi measurement static tests have been conducted in 2 fixed outdoor locations.
The tests ran on all 5 Smartphones and the following user experience measurements have been collected:
• Latency/ping (test duration of 10 sec)
• FTP DL (test duration of 30sec)
• FTP UL (test duration of 30sec)
• Web Browsing (test duration of 30sec)
• YouTube Streaming (test duration of 1min)
3 cycles have been conducted at each location in order to achieve a certain confidence level for the investigated KPIs.

Page 10 Commercial in confidence
Test Results - User Connectivity S3 - Roaming 3G/WiFi
This section shows the handover between 3G and WiFi. The graphs below show the user was switched to WiFi when entering the WiFi boundary which resulted in lower RTT and higher web browsing throughput.
WiFi Boundary WiFi Boundary WiFi Boundary
Technology Heat-map Latency Heat-map HTTP Throughput Heat-map
Technology WiFi
3G
The user connectivity test results above show the UE connected to WiFi from 3G when entering the WiFi
coverage. Furthermore the latency value improved when the UE connected to WiFi.

Page 11 Commercial in confidence
Test Results - User Connectivity S5 - Roaming 4G/WiFi
This section shows the handover between 4G and WiFi networks. The graphs below show the user was switched to WiFi when entering the WiFi boundary which resulted in lower RTT and higher web browsing throughput.
Technology Heat-map Latency Heat-map HTTP Throughput Heat-map
Technology WiFi
LTE
WiFi Boundary WiFi Boundary WiFi Boundary
The user connectivity test results above show the UE connected to WiFi from 4G when entering the WiFi
coverage. However the effect on the latency test values was minor.

Page 12 Commercial in confidence
Test Results - Walk Tests 3G RSCP
WiFi Network Boundary
Average RSCP = -71.87 dBm
Minimum RSCP = -99.7 dBm
Maximum RSCP = -48.7 dBm
Standard Deviation = 6.66

Page 13 Commercial in confidence
Test Results - Walk Tests 4G RSRP
WiFi Network Boundary
Average RSRP = -93.058 dBm
Minimum RSRP = -176.9 dBm
Maximum RSRP = -62.2 dBm
Standard Deviation = 11.29

Page 14 Commercial in confidence
Test Results - Walk Tests WiFi Signal Strength
WiFi AP WiFi Network Boundary
Average RSCP = -65.85 dBm
Minimum RSCP = -200 dBm
Maximum RSCP = -38 dBm
Standard Deviation = 27.84

Page 15 Commercial in confidence
Test Results - Walk Tests Technology Heat-maps
Roaming 3G/2G/WiFi
WiFi Boundary
S5-Roaming 4G/3G/2G/WiFi
WiFi Boundary
This slide shows the technology which the two roaming handsets were connected during the walk test. The graphs below show the user was on WiFi majority of the time in the WiFi boundary.
Technology
WiFi
2G
3G
4G
Technology
WiFi 3G
Technology
WiFi
3G

Page 16 Commercial in confidence
Walk Test – Youtube Time to Load Comparison
WiFi 3G
4G/3G/WiFi
4G
3G/WiFi

Page 17 Commercial in confidence
Walk Test - HTTP Time to Load the Webpage Comparison
WiFi 3G
4G/3G/WiFi
4G
3G/WiFi

Page 18 Commercial in confidence
Walk Test - HTTP Throughput Comparison
WiFi 3G
4G/3G/WiFi
4G
3G/WiFi

Page 19 Commercial in confidence
Walk Test - FTP Download Comparison
WiFi 3G
4G/3G/WiFi
4G
3G/WiFi

Page 20 Commercial in confidence
Walk Test - FTP Upload Comparison
WiFi 3G
4G/3G/WiFi
4G
3G/WiFi

Page 21 Commercial in confidence
Test Results - Static Location 1 Static Location 1
Test Location WiFi AP
Date Time Longitude Latidute
19/10/2013 17:15 51.51 -0.134631
Tests were conducted outside Piccadilly Circus station, 4 metres from WiFi AP 1 hop away from Root AP. This needs to be taken into account that this test have been conducted during busy hours on Saturday .

Page 22 Commercial in confidence
Test Results – Static Location 2 Static Location 2
Test Location WiFi AP
Date Time Longitude Latidute
19/10/2013 18:15 51.512 -0.13284
Tests were conducted in Shaftesbury Avenue, 7 metres from a Fibre Root WiFi AP. This needs to be taken into account that this test have been conducted during busy hours on Saturday.

Page 23 Commercial in confidence
The following measurements on WiFi, 3G and 4G have been conducted in 2 fixed outdoor locations.
• FTP Download
• FTP upload
• Web Performance (www.bbc.co.uk)
• HTTP Throughput
• Time to Load the webpage
• Latency (Ping from handsets to FTP Server)
• Video Streaming (YouTube streaming)
Summary Results Outdoor Static Tests
FTP Tests
Operation Technology Avg Throughput [Mbps]
FTP (DL)
WiFi 15.66
3G 1.25
4G 4.06
FTP (UL)
WiFi 21.14
3G 0.1
4G 11.06
HTTP
Host Technology Avg Throughput [Kbps] Average Time to Load (s)
http://www.bbc.co.uk
WiFi 554.77 1.66
3G 399.64 4.29
4G 384.11 3.64
Latency
Technology Avg RTT [ms]
WiFi 108.7
3G 332.96
4G 109.46
YouTube Streaming
Technology Avg Time to Start Play (s)
WiFi 1
3G 6.09
4G 1.99
The Average static test results show better WiFi performance for FTP-DL/UL, Latency, YouTube Streaming and
HTTP web browsing.

Page 24 Commercial in confidence
Summary Results Outdoor Static Tests
The Average static test results show better WiFi performance for FTP-DL/UL, Latency, YouTube Streaming and
HTTP web browsing.
The following Pie Charts show the average of the tests conducted in 2 fixed outdoor locations WiFi, 3G and 4G,.

Page 25 Commercial in confidence
Measurements have been conducted on five handsets:
• Smartphone1 : locked to WiFi
• Smartphone2 : locked to 3G
• Smartphone3 : locked to 4G
• Smartphone4 : Roaming 3G/WiFi
• Smartphone5 : Roaming 4G/3G/2G/WiFi
Please note that in the majority of the tests, 2 to 3 handsets were conducting simultaneous
tests on WiFi, one handset on 3G and one handset was on 4G. The average results of the walk
test per handset are shown in the tables.
Summary Results Outdoor Walk Tests
FTP Tests
Operation Technology Avg Throughput [Mbps]
FTP (DL)
3G (S2) 0.33
4G (S3) 6.85
WiFi (S1) 6.03
3G/WiFi (S4) 2.73
4G/3G/WiFi (S5) 6.45
FTP (UL)
3G (S2) 0.55
4G (S3) 4.63
WiFi (S1) 8.8
3G/WiFi (S4) 3.71
4G/3G/WiFi (S5) 6.61
HTTP
Host Technology Avg Throughput [Kbps] Average Time to Load (s)
http://www.bbc.co.uk
3G (S2) 415.08 4.75
4G (S3) 256.78 3.53
WiFi (S1) 518.2 2.3
3G/WiFi (S4) 401.02 4.28
4G/3G/WiFi (S5) 379.21 5.22
Latency
Technology Avg RTT [ms]
3G (S2) 347.77
4G (S3) 96.94
WiFi (S1) 85.75
3G/WiFi (S4) 203.45
4G/3G/WiFi (S5) 152.53
Youtube Streaming
Technology Avg Time to Start Play (s)
3G (S2) 4.92
4G (S3) 1.41
WiFi (S1) 2.39
3G/WiFi (S4) 2.46
4G/3G/WiFi (S5) 2.35
The average walk test results show better WiFi Performance for FTP DL/UL, Latency and HTTP Web browsing,
nevertheless the UE connected to 4G had lowest time to load YouTube video.

Commercial in confidence Page 26
Summary Results Outdoor Walk Tests
The following Pie Charts show the average of the tests conducted while walking through the rout.

Commercial in confidence Page 27
Registered in UK No. 5793772HQ in London UK
Office: +44 (0) 208 799 0368
Fax: +44 (0) 208 728 9610
www.awtg.co.uk
Thank You