Embed Size (px)
Citation preview
Physical Flow Accounts for Water
Regional Training Workshop on the
System of Environmental-Economic Accounting
François Soulard
Environment, Energy and Transportation Statistics Division
16-18 November 2015
Shanghai, China
12/11/2015 Statistics Canada • Statistique Canada 2
Physical flow accounts for water
Objective: Acquire technical knowledge and discuss
compilation issues
1. Review accounting structure and principles
2. Review supply and use tables for water
3. Data sources and compilation issues
Introduction
12/11/2015 Statistics Canada • Statistique Canada 3

Introduction
12/11/2015 Statistics Canada • Statistique Canada 4
“Conventional economic aggregates generated
through national accounting, such as GDP, do not
reflect the extent to which production and
consumption activities may be using up
environmental assets and limiting the capacity for
these assets to generate ecosystem services in the
future.”
-The Economics of Ecosystems and Biodiversity:
Guidance Manual for Countries (2013)
Introduction
“Lack of integrated water data is a systematic
impediment to informed decision making related to
the sustainable use of water resources. Data are
needed to provide information not just about water
quantity, both on the surface and underground, but
also about its quality, social and economic relations
as well as environmental dimensions.”
Conclusion from Session 6.4 “Data for All”
5th World Water Forum
Introduction
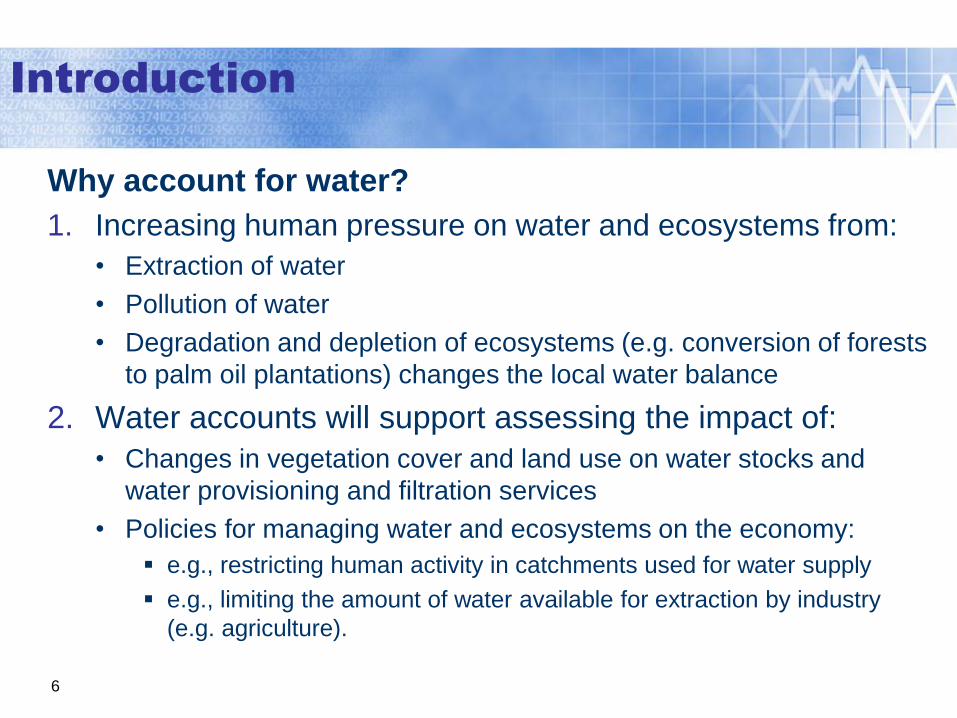
Why account for water?
1. Increasing human pressure on water and ecosystems from:
• Extraction of water
• Pollution of water
• Degradation and depletion of ecosystems (e.g. conversion of forests
to palm oil plantations) changes the local water balance
2. Water accounts will support assessing the impact of:
• Changes in vegetation cover and land use on water stocks and
water provisioning and filtration services
• Policies for managing water and ecosystems on the economy:
e.g., restricting human activity in catchments used for water supply
e.g., limiting the amount of water available for extraction by industry
(e.g. agriculture).
6
12/11/2015 Statistics Canada • Statistique Canada 7
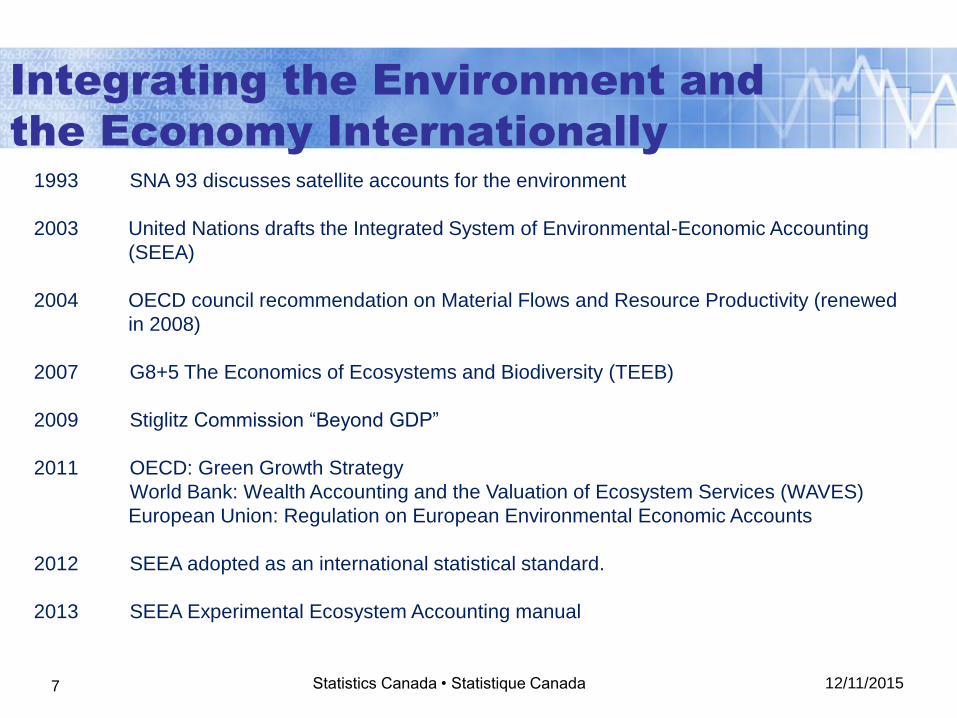
Integrating the Environment and
the Economy Internationally
1993 SNA 93 discusses satellite accounts for the environment
2003 United Nations drafts the Integrated System of Environmental-Economic Accounting
(SEEA)
2004 OECD council recommendation on Material Flows and Resource Productivity (renewed
in 2008)
2007 G8+5 The Economics of Ecosystems and Biodiversity (TEEB)
2009 Stiglitz Commission “Beyond GDP”
2011 OECD: Green Growth Strategy
World Bank: Wealth Accounting and the Valuation of Ecosystem Services (WAVES)
European Union: Regulation on European Environmental Economic Accounts
2012 SEEA adopted as an international statistical standard.
2013 SEEA Experimental Ecosystem Accounting manual
12/11/2015 Statistics Canada • Statistique Canada 8
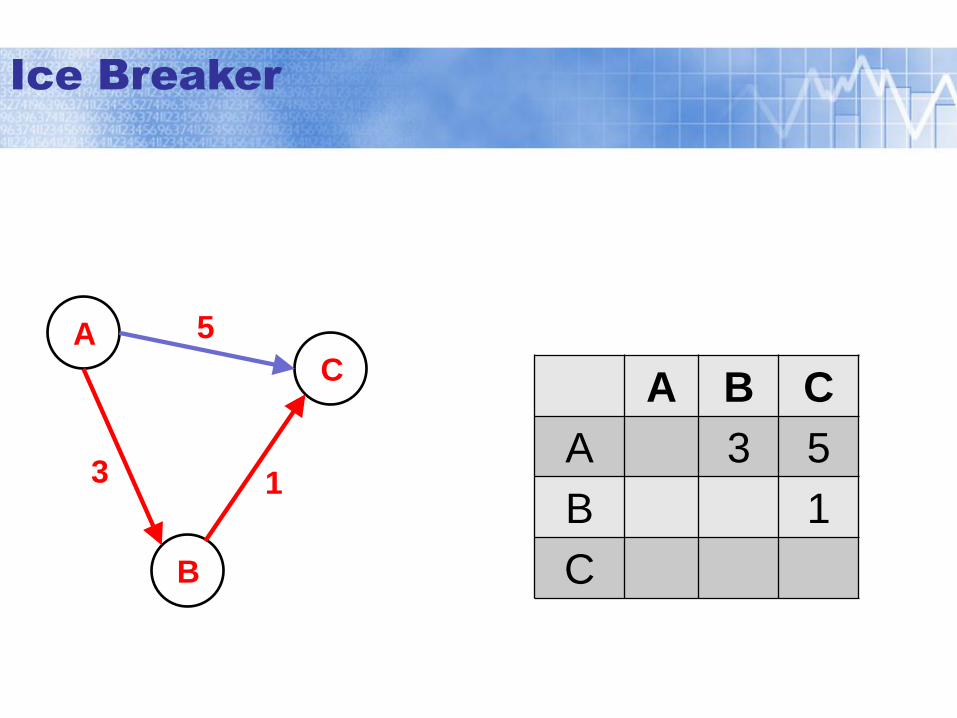
A
B
C
5
3 1
Ice Breaker
A B C
A 3 5
B 1
C
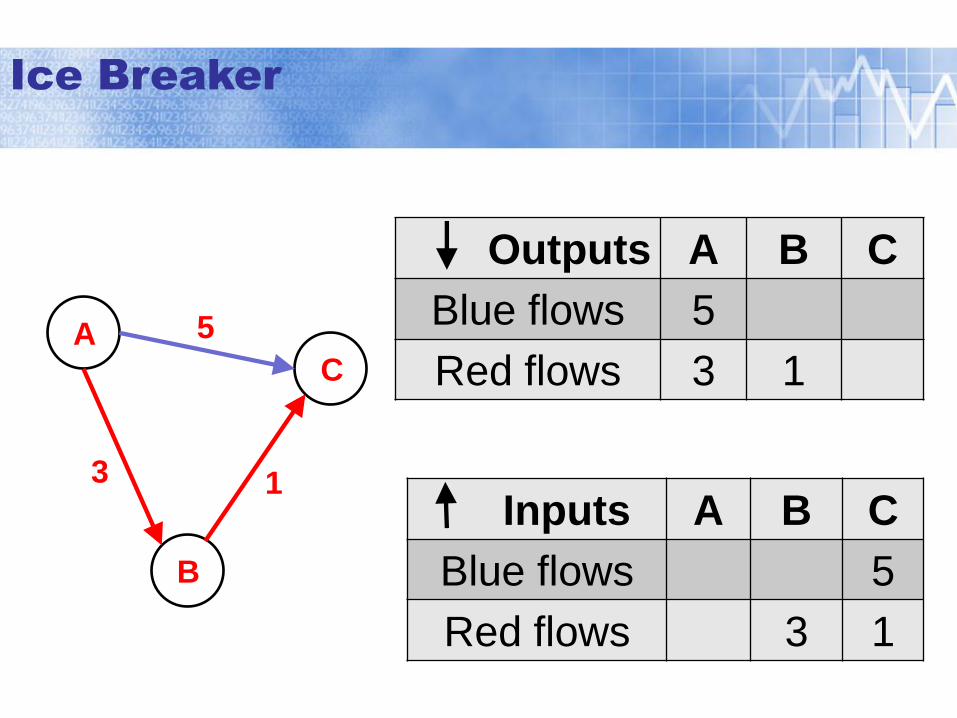
A
B
C
Outputs A B C
Blue flows 5
Red flows 3 1 5
3 1 Inputs A B C
Blue flows 5
Red flows 3 1
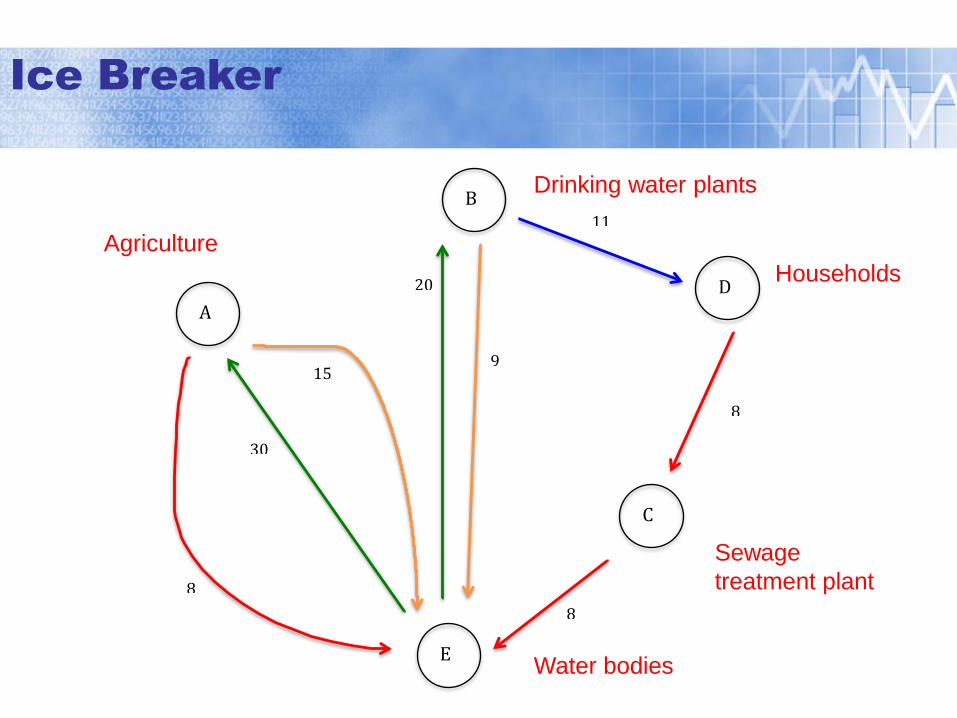
Ice Breaker
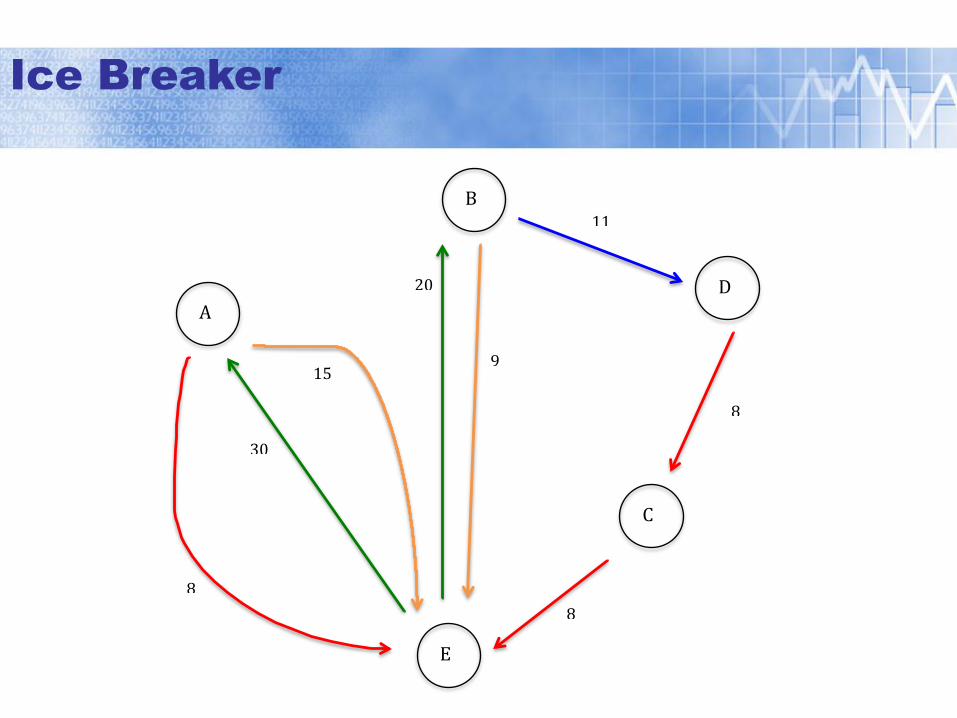
A
D
C
E
B
15
30
20
9
11
8
8
8
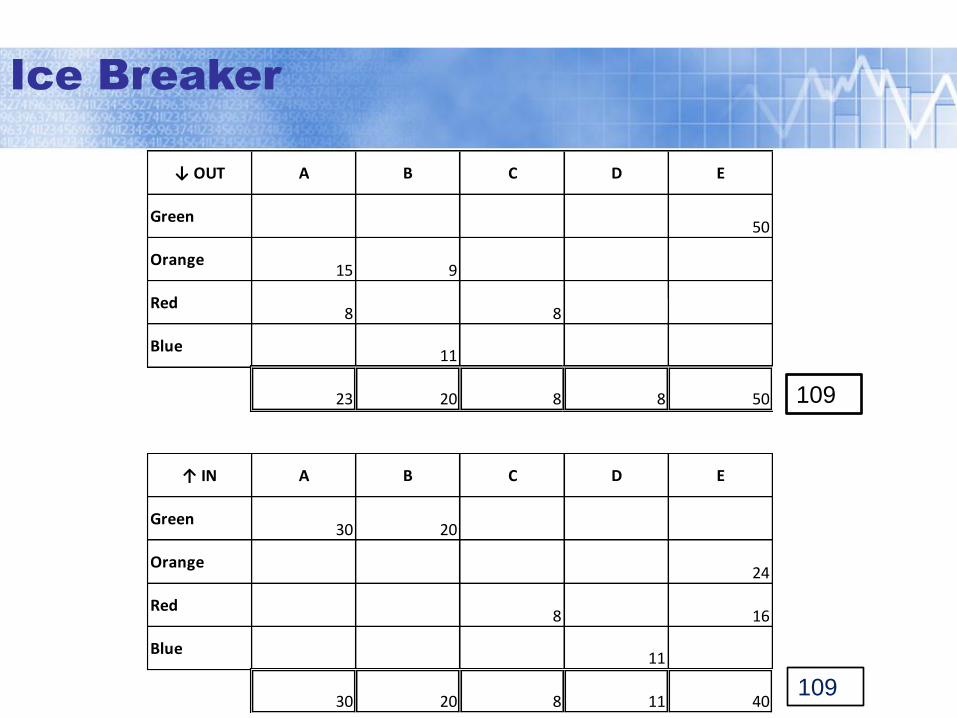
Ice Breaker

↓ OUT A B C D E
Green50
Orange15 9
Red8 8 8
Blue11
23 20 8 8 50
↑ IN A B C D E
Green30 20
Orange24
Red8 16
Blue11
30 20 8 11 40
Ice Breaker
109
109
↓ OUT A B C D E
Green50
Orange15 9
Red8 8 8
Blue11
23 20 8 8 50
↑ IN A B C D E
Green30 20
Orange24
Red8 16
Blue11
30 20 8 11 40
Ice Breaker
109
109
A
D
C
E
B
15
30
20
9
11
8
8
8
Ice Breaker
Agriculture
Drinking water plants
Households
Sewage
treatment plant
Water bodies
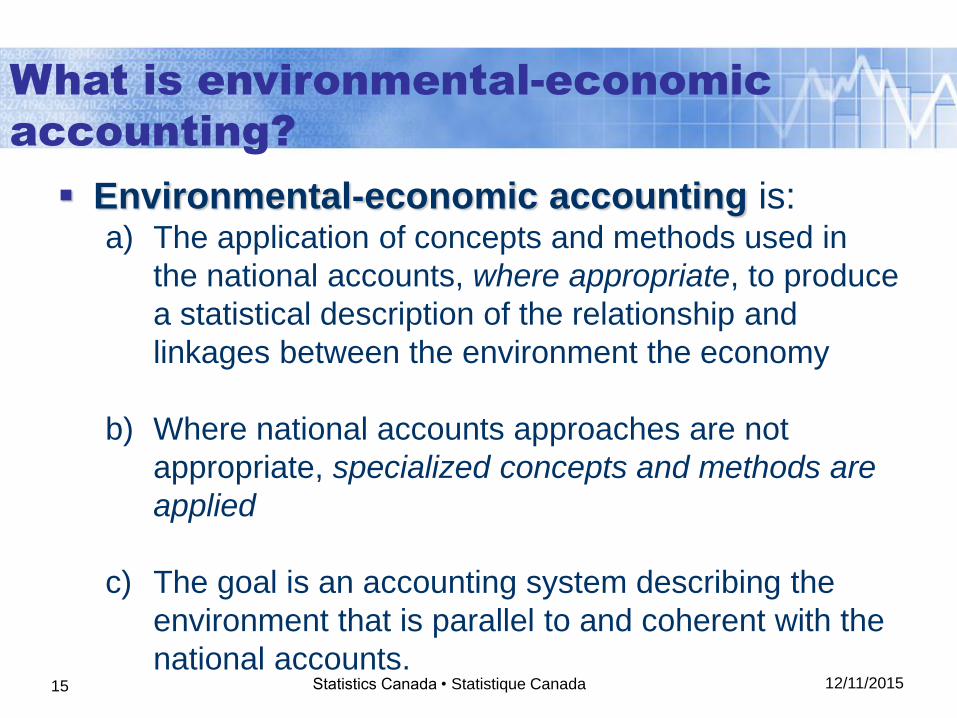
What is environmental-economic
accounting?
Environmental-economic accounting is: a) The application of concepts and methods used in
the national accounts, where appropriate, to produce
a statistical description of the relationship and
linkages between the environment the economy
b) Where national accounts approaches are not
appropriate, specialized concepts and methods are
applied
c) The goal is an accounting system describing the
environment that is parallel to and coherent with the
national accounts.
12/11/2015 Statistics Canada • Statistique Canada 15
12/11/2015 16 Statistics Canada • Statistique Canada
Why Produce Environmental Accounts?
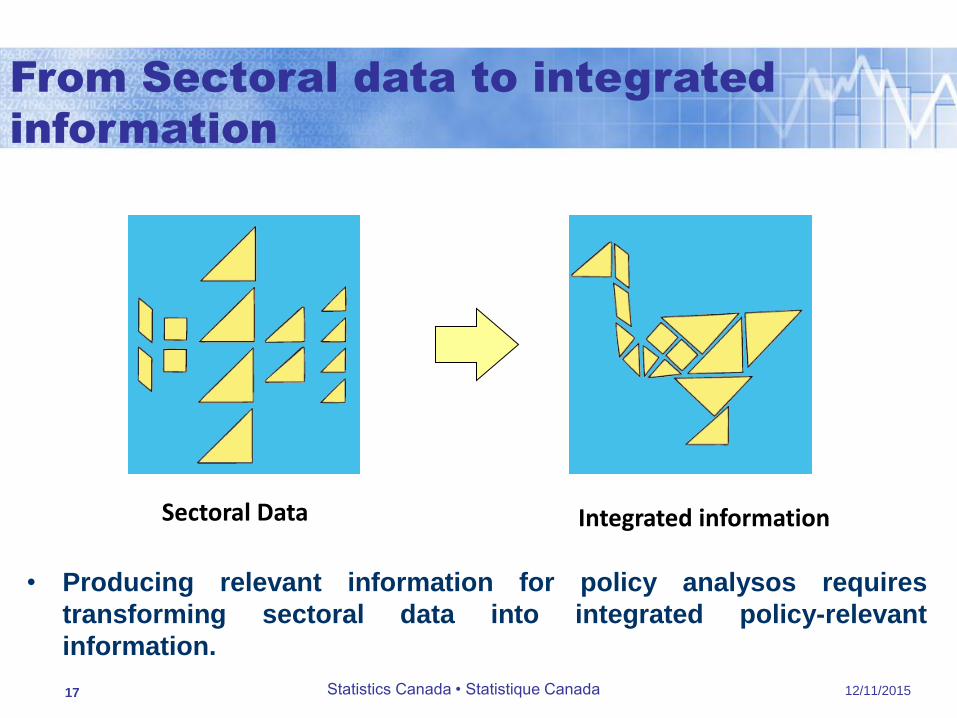
Sectoral Data Integrated information
• Producing relevant information for policy analysos requires
transforming sectoral data into integrated policy-relevant
information.
From Sectoral data to integrated
information
12/11/2015 17 Statistics Canada • Statistique Canada
Sectoral Data Integrated information
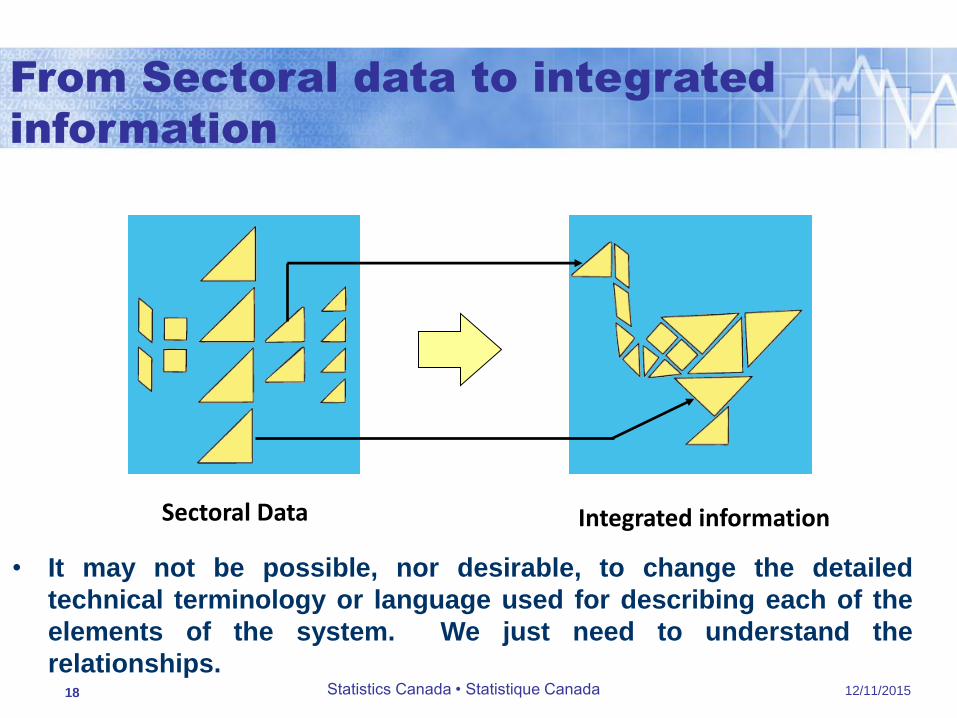
• It may not be possible, nor desirable, to change the detailed
technical terminology or language used for describing each of the
elements of the system. We just need to understand the
relationships. 12/11/2015 18 Statistics Canada • Statistique Canada
From Sectoral data to integrated
information
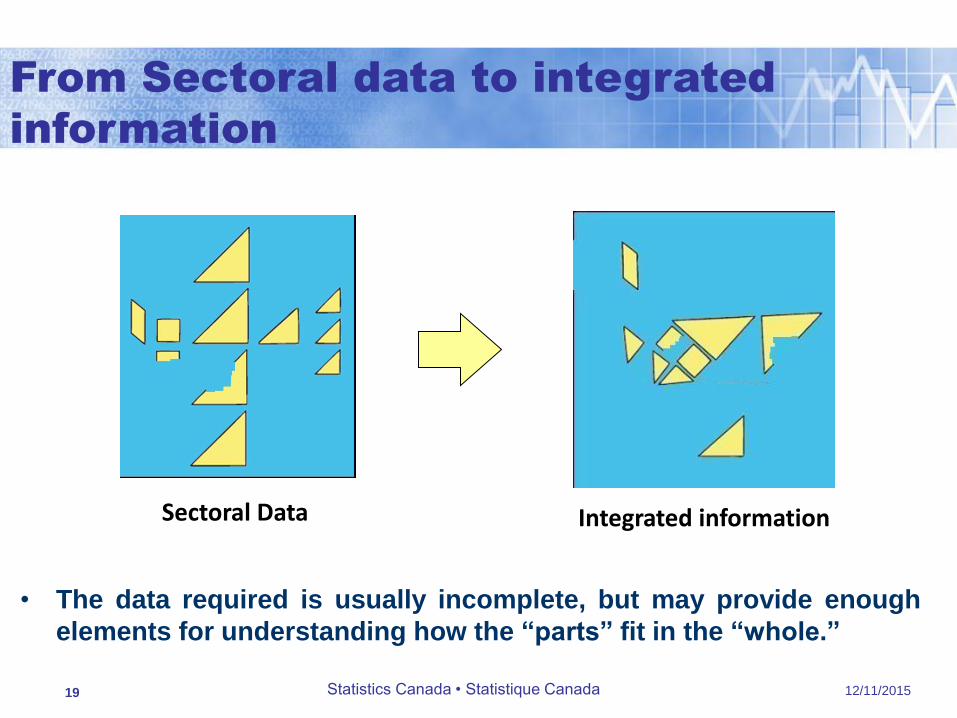
Sectoral Data Integrated information
• The data required is usually incomplete, but may provide enough
elements for understanding how the “parts” fit in the “whole.”
From Sectoral data to integrated
information
12/11/2015 19 Statistics Canada • Statistique Canada
1. Integrate environmental-economic data in a
coherent framework
• Increase significantly our capacity to assess the economic
activity and its dependence upon the natural environment
• Favours using norms, consistency between economic and
environment data, which in turn help with inter-regional and
international comparisons
2. Guide/direct environmental data collection
• Data within an integrated information system are coherent to an
extent not possible in a set of independent databases
• Clear guidance on what to measure but also on what not to
measure
12/11/2015 20 Statistics Canada • Statistique Canada
Why Produce Environmental Accounts?
1. Record the flows of materials and energy between the economy and the environment • resource and energy use
• waste produced
2. Directly link environment data to the rich body of economic statistics of the national accounts • use same concepts, methods, and framework
• provide numerous opportunities to study the economy and the demands it places on the environment
Why Produce Environmental Accounts?
12/11/2015 20 Statistics Canada • Statistique Canada
12/11/2015 Statistics Canada • Statistique Canada 22
Analytical uses…
1. Linkage to the economic accounts
a) Measures of intensity over time
b) Demand perspectives on material flows
2. Linkage to ecosystem assets
a) Reliance on natural inputs
b) Impacts on the environment
Why Produce Environmental Accounts?
12/11/2015 Statistics Canada • Statistique Canada 23
And indicators
Why Produce Environmental Accounts?
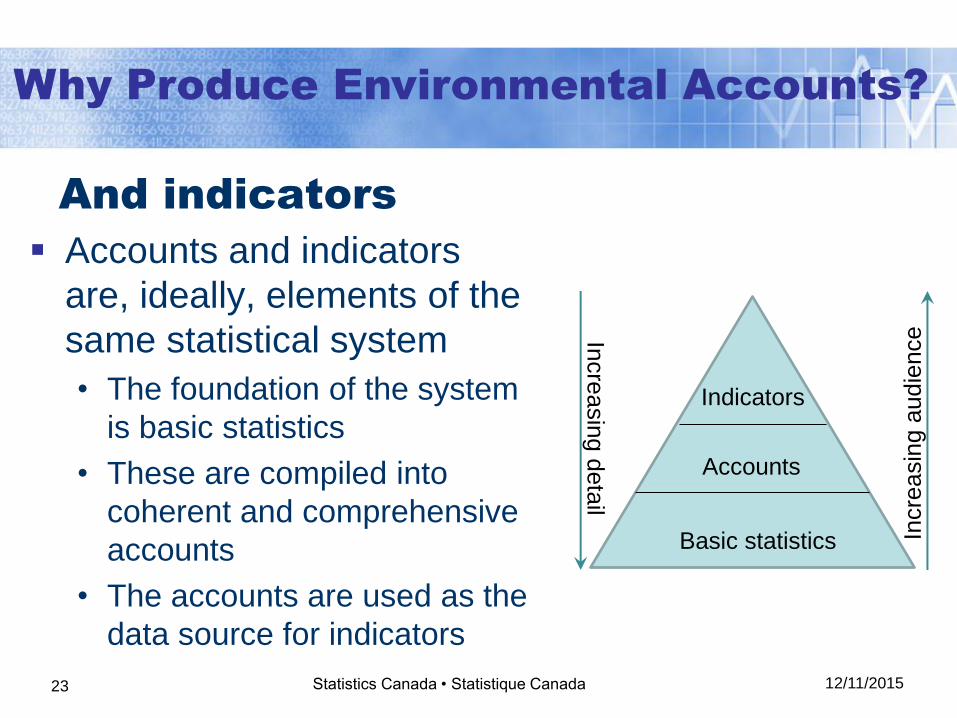
Accounts and indicators
are, ideally, elements of the
same statistical system
• The foundation of the system
is basic statistics
• These are compiled into
coherent and comprehensive
accounts
• The accounts are used as the
data source for indicators
Basic statistics
Accounts
Indicators
Incre
asin
g d
eta
il
Incre
asin
g a
udie
nce
12/11/2015 Statistics Canada • Statistique Canada 24
What are environmental accounts?
1. Environmental accounts are records of: 1. The stock and value of environmental assets
2. The flows of material and energy resources between the
economy and the environment, and within the economy
3. The expenditures on environmental protection, and the cost of
environmental damage.
2. That meet specific criteria: 1. Consistent over time
always uses the same methods and data sources
2. Comprehensive in their coverage
3. compatible with economic accounts
4. national in scope (with sub-national detail as appropriate)
12/11/2015 Statistics Canada • Statistique Canada 25
What are environmental accounts?
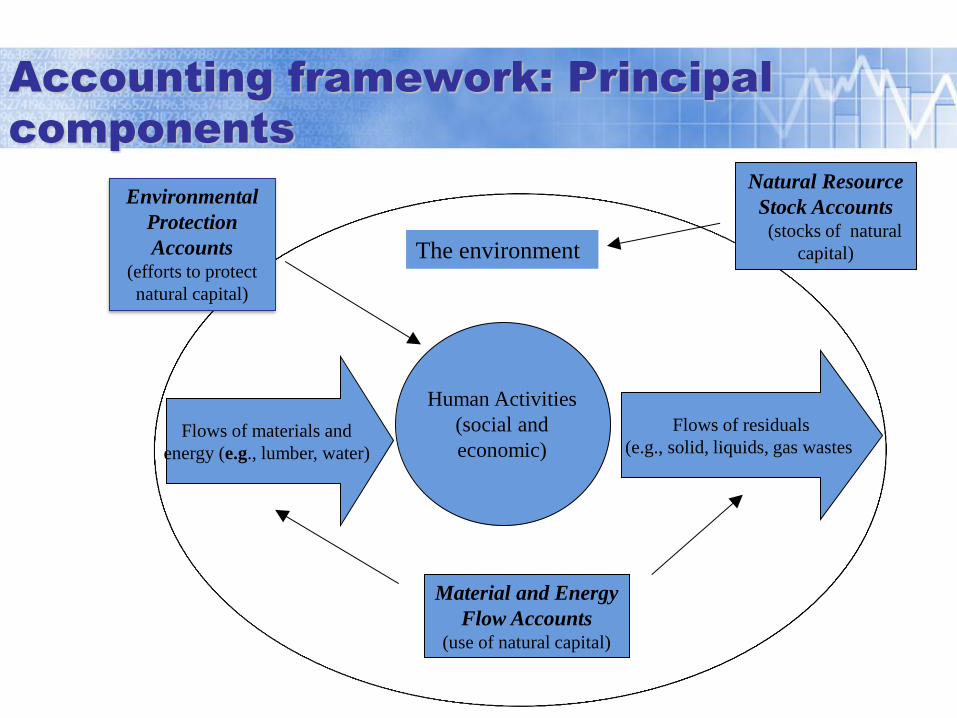
Accounting framework: Principal
components
The environment
Flows of materials and
energy (e.g., lumber, water)
Flows of residuals
(e.g., solid, liquids, gas wastes
Material and Energy
Flow Accounts (use of natural capital)
Human Activities
(social and
economic)
Natural Resource
Stock Accounts (stocks of natural
capital)
Environmental
Protection
Accounts (efforts to protect
natural capital)
27
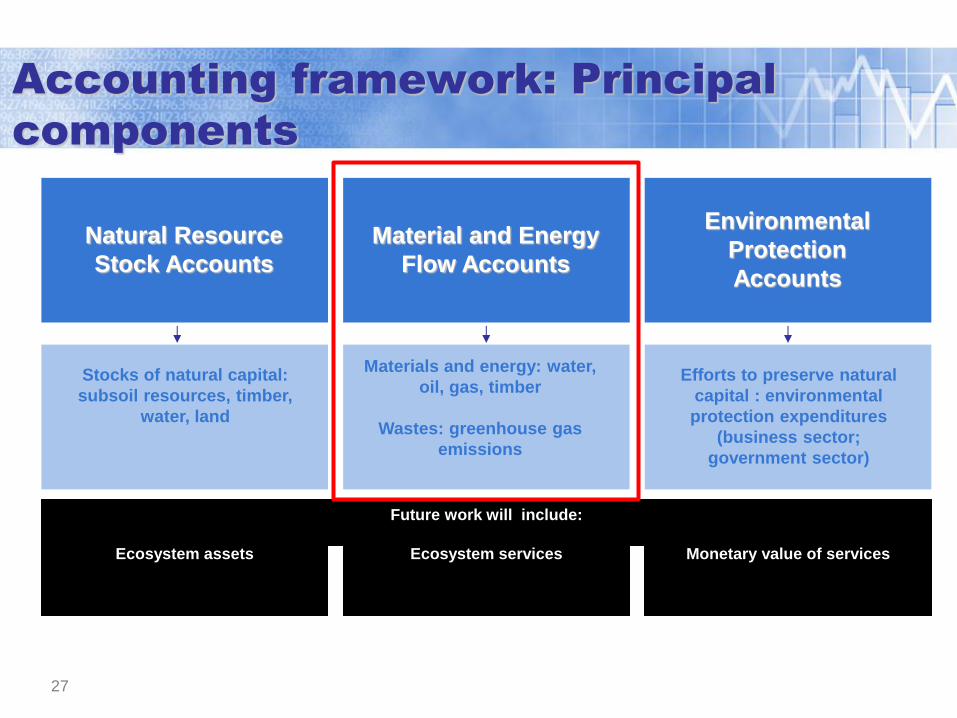
Accounting framework: Principal
components
Natural Resource
Stock Accounts
Material and Energy
Flow Accounts
Environmental
Protection
Accounts
Efforts to preserve natural
capital : environmental
protection expenditures
(business sector;
government sector)
Materials and energy: water,
oil, gas, timber
Wastes: greenhouse gas
emissions
Stocks of natural capital:
subsoil resources, timber,
water, land
Ecosystem assets
Future work will include:
Ecosystem services Monetary value of services
12/11/2015 Statistics Canada • Statistique Canada 28
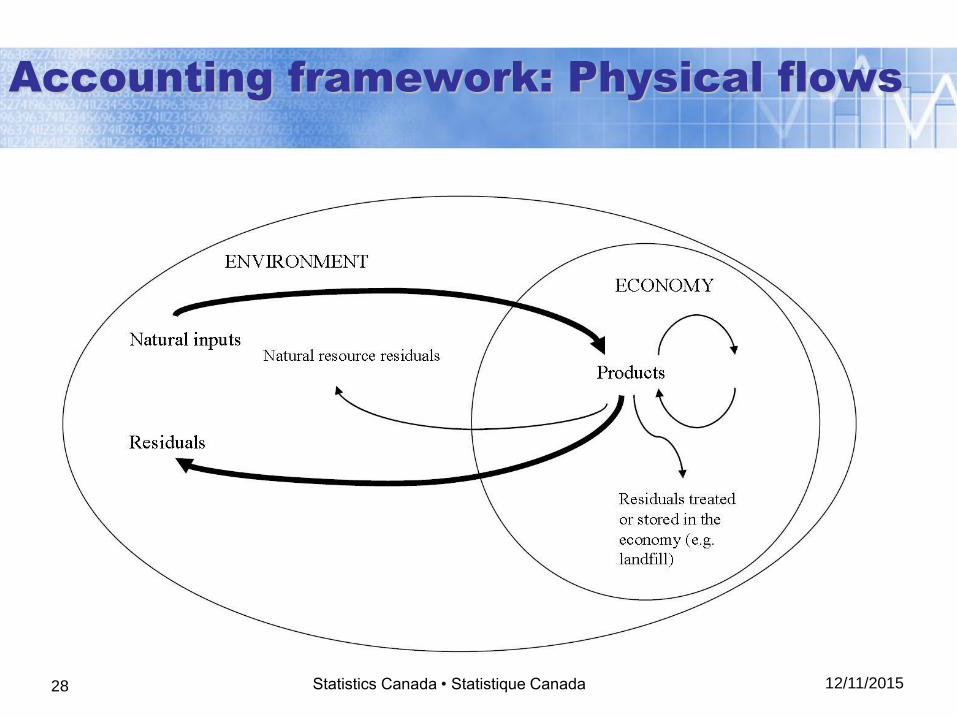
Accounting framework: Physical flows
29
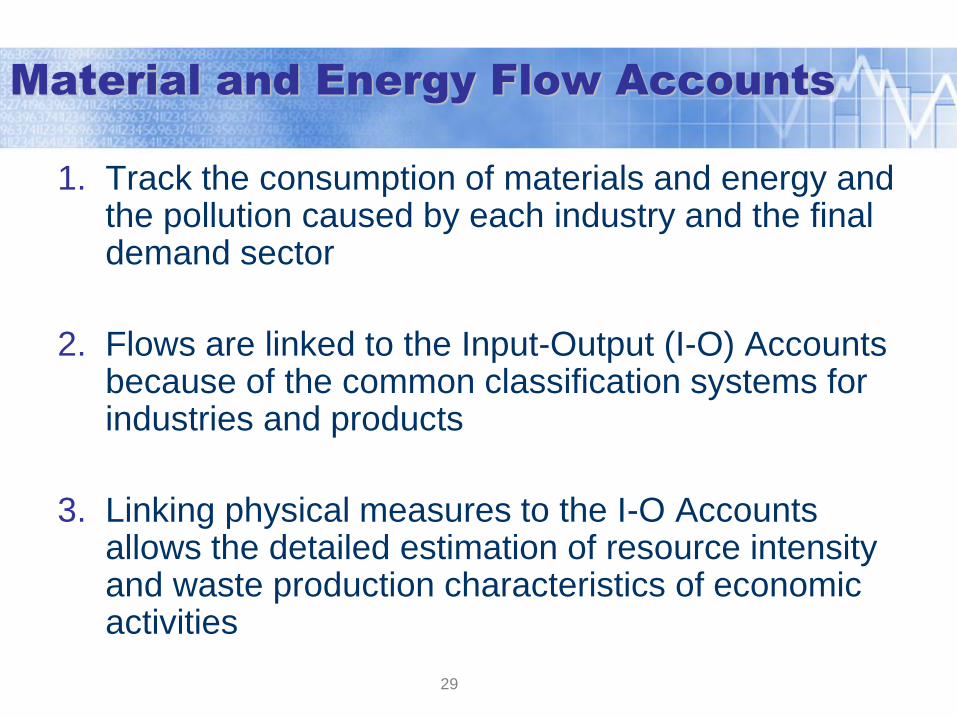
Material and Energy Flow Accounts
1. Track the consumption of materials and energy and the pollution caused by each industry and the final demand sector
2. Flows are linked to the Input-Output (I-O) Accounts because of the common classification systems for industries and products
3. Linking physical measures to the I-O Accounts allows the detailed estimation of resource intensity and waste production characteristics of economic activities
12/11/2015 Statistics Canada • Statistique Canada 30
1. Material consumption
2. Material productivity
3. Energy use analysis
4. Energy policy
5. Emissions analysis
6. Environmental assessment
7. Natural resource management
8. Multi-factor productivity
9. Footprint calculations
Material and Energy Flow Accounts
31
0
20
40
60
80
100
120
330
340
350
360
370
380
390
400
410
420
430
440
19
90
19
91
19
92
19
93
19
94
19
95
19
96
19
97
19
98
19
99
20
00
20
01
20
02
20
03
20
04
20
05
20
06
20
07
Em
issio
ns p
er
un
it o
f exp
en
dit
ure
(1
990 =
100)
meg
ato
nn
es
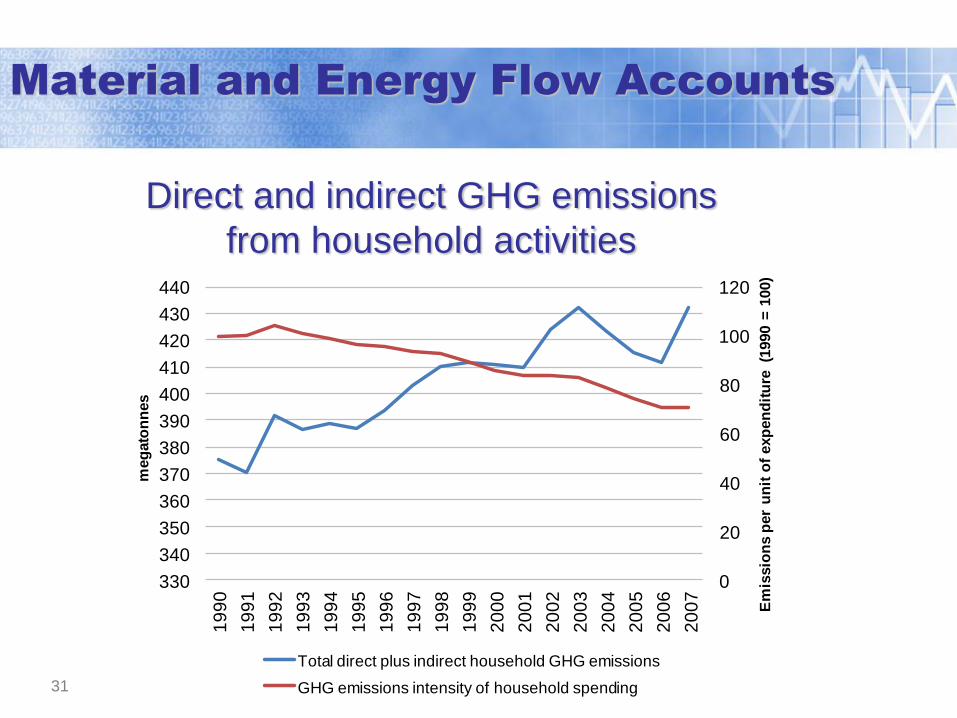
Total direct plus indirect household GHG emissions
GHG emissions intensity of household spending
Direct and indirect GHG emissions
from household activities
Material and Energy Flow Accounts
SEEA and the SNA
12/11/2015 Statistics Canada • Statistique Canada 32
12/11/2015 Statistics Canada • Statistique Canada 33
System of National Accounts
framework
Se
cto
rs
Se
cto
rs
Wa
ste
s
Com
mo
ditie
s
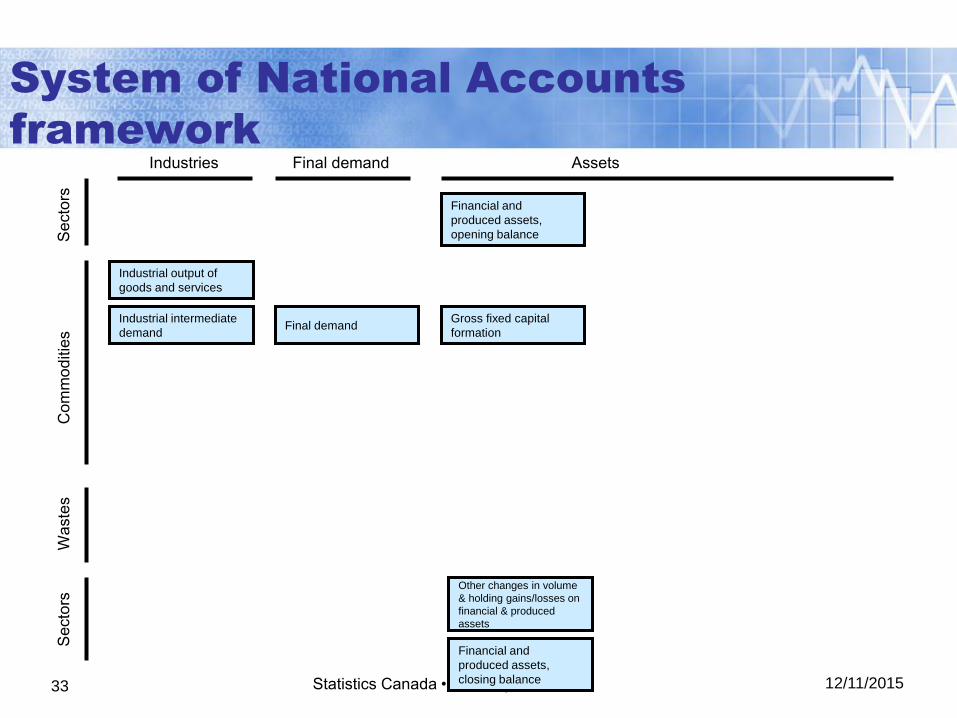
Industries Final demand Assets
Industrial output of
goods and services
Industrial intermediate
demand Final demand
Gross fixed capital
formation
Financial and
produced assets,
opening balance
Other changes in volume
& holding gains/losses on
financial & produced
assets
Financial and
produced assets,
closing balance
12/11/2015 Statistics Canada • Statistique Canada 34
Se
cto
rs
Se
cto
rs
Wa
ste
s
Com
mo
ditie
s
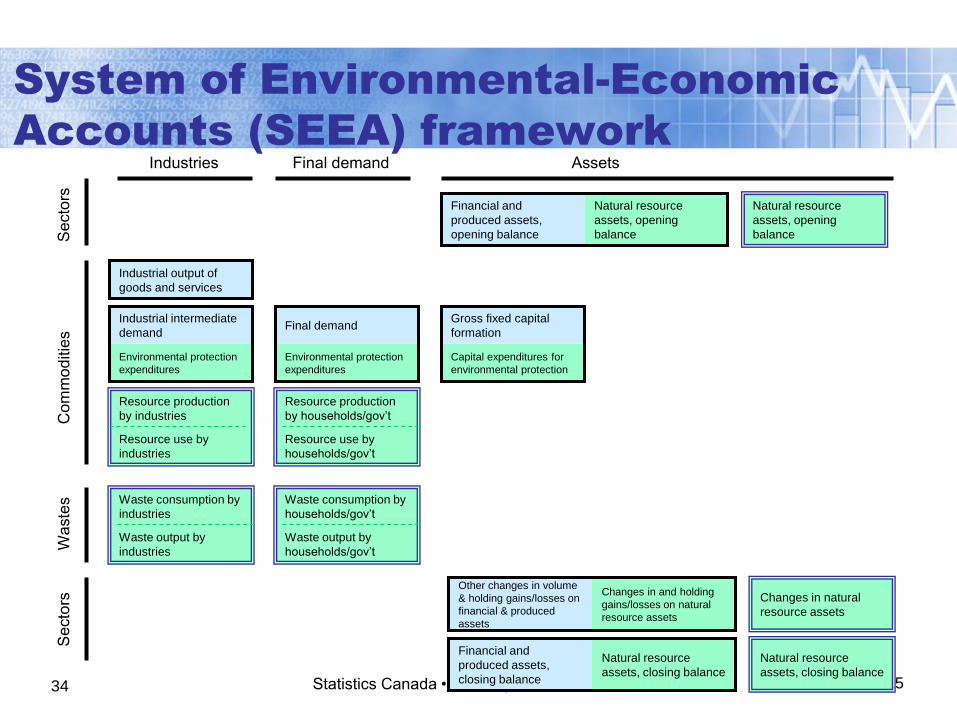
Industries Final demand Assets
Industrial output of
goods and services
Industrial intermediate
demand
Environmental protection
expenditures
Final demand
Environmental protection
expenditures
Gross fixed capital
formation
Capital expenditures for
environmental protection
Financial and
produced assets,
opening balance
Natural resource
assets, opening
balance
Natural resource
assets, opening
balance
Changes in natural
resource assets
Natural resource
assets, closing balance
Other changes in volume
& holding gains/losses on
financial & produced
assets
Changes in and holding
gains/losses on natural
resource assets
Financial and
produced assets,
closing balance
Natural resource
assets, closing balance
Resource production
by industries
Resource use by
industries
Resource production
by households/gov’t
Resource use by
households/gov’t
Waste consumption by
industries
Waste output by
industries
Waste output by
households/gov’t
Waste consumption by
households/gov’t
System of Environmental-Economic
Accounts (SEEA) framework
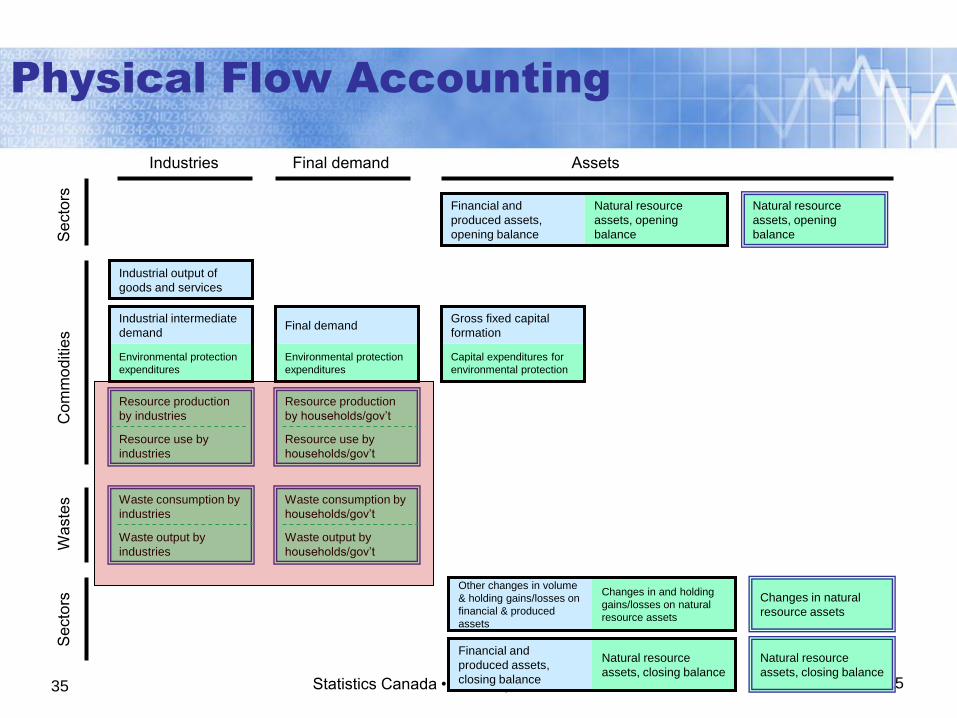
Physical Flow Accounting
12/11/2015 Statistics Canada • Statistique Canada 35
Se
cto
rs
Se
cto
rs
Wa
ste
s
Com
mo
ditie
s
Industries Final demand Assets
Industrial output of
goods and services
Industrial intermediate
demand
Environmental protection
expenditures
Final demand
Environmental protection
expenditures
Gross fixed capital
formation
Capital expenditures for
environmental protection
Financial and
produced assets,
opening balance
Natural resource
assets, opening
balance
Natural resource
assets, opening
balance
Changes in natural
resource assets
Natural resource
assets, closing balance
Other changes in volume
& holding gains/losses on
financial & produced
assets
Changes in and holding
gains/losses on natural
resource assets
Financial and
produced assets,
closing balance
Natural resource
assets, closing balance
Resource production
by industries
Resource use by
industries
Resource production
by households/gov’t
Resource use by
households/gov’t
Waste consumption by
industries
Waste output by
industries
Waste output by
households/gov’t
Waste consumption by
households/gov’t
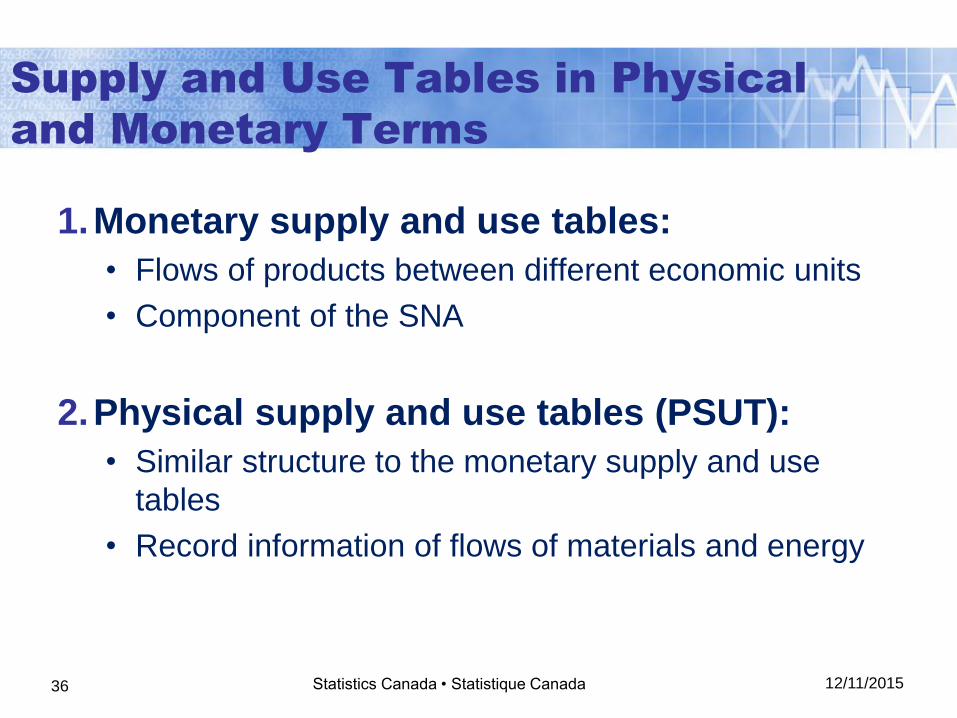
Supply and Use Tables in Physical
and Monetary Terms
1.Monetary supply and use tables:
• Flows of products between different economic units
• Component of the SNA
2.Physical supply and use tables (PSUT):
• Similar structure to the monetary supply and use
tables
• Record information of flows of materials and energy
12/11/2015 Statistics Canada • Statistique Canada 36
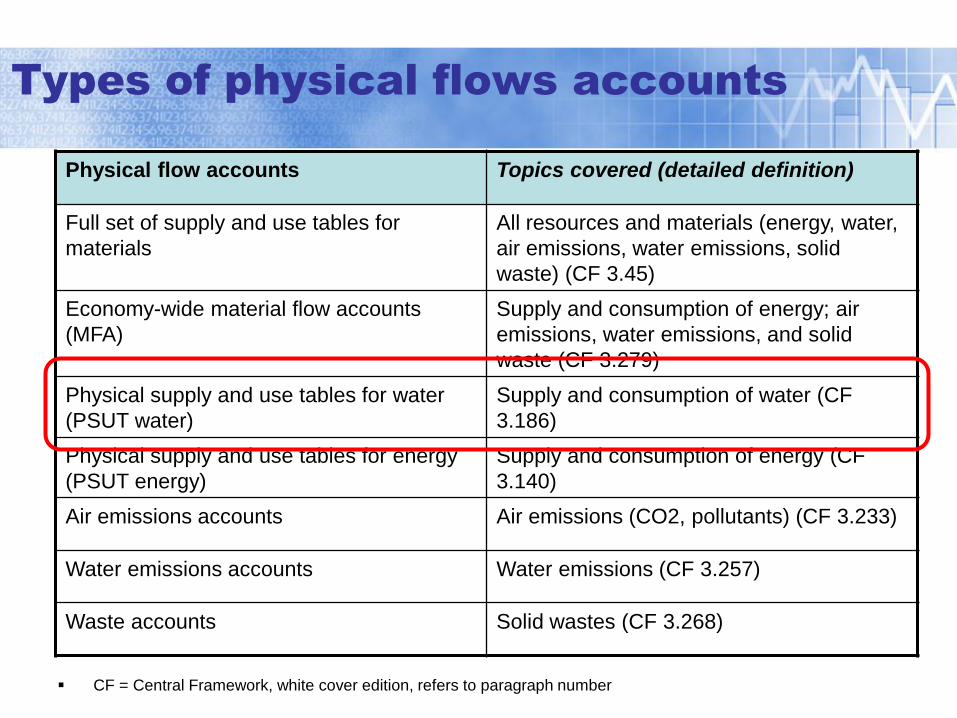
Types of physical flows accounts
Physical flow accounts Topics covered (detailed definition)
Full set of supply and use tables for
materials
All resources and materials (energy, water,
air emissions, water emissions, solid
waste) (CF 3.45)
Economy-wide material flow accounts
(MFA)
Supply and consumption of energy; air
emissions, water emissions, and solid
waste (CF 3.279)
Physical supply and use tables for water
(PSUT water)
Supply and consumption of water (CF
3.186)
Physical supply and use tables for energy
(PSUT energy)
Supply and consumption of energy (CF
3.140)
Air emissions accounts Air emissions (CO2, pollutants) (CF 3.233)
Water emissions accounts Water emissions (CF 3.257)
Waste accounts Solid wastes (CF 3.268)
CF = Central Framework, white cover edition, refers to paragraph number
12/11/2015 Statistics Canada • Statistique Canada 38
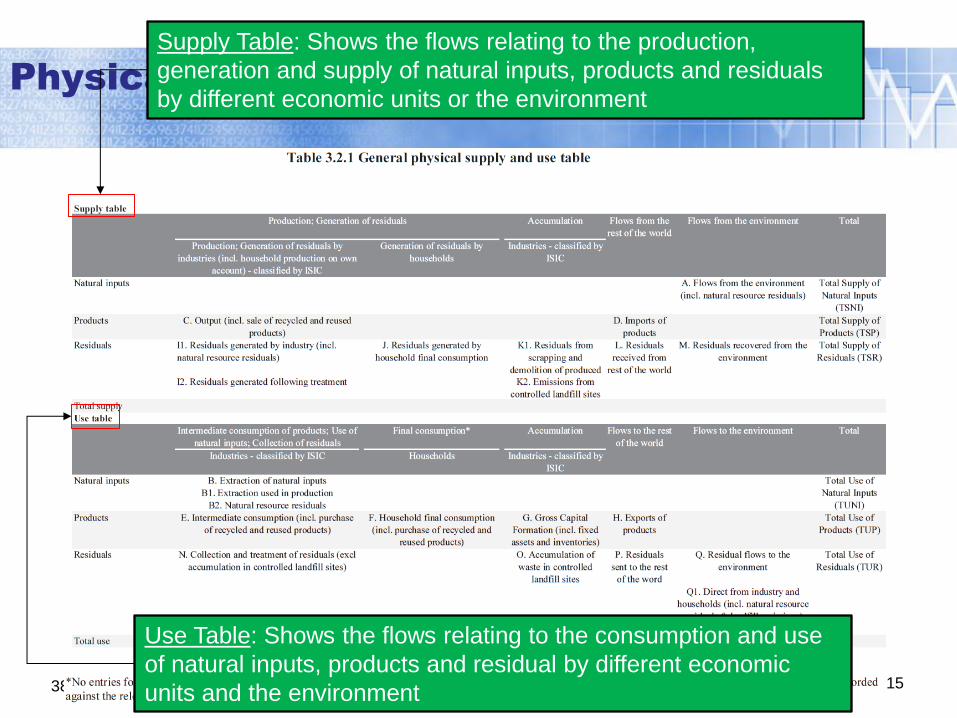
Physical Flow Accounts: Basic Tables
Use Table: Shows the flows relating to the consumption and use
of natural inputs, products and residual by different economic
units and the environment
Supply Table: Shows the flows relating to the production,
generation and supply of natural inputs, products and residuals
by different economic units or the environment
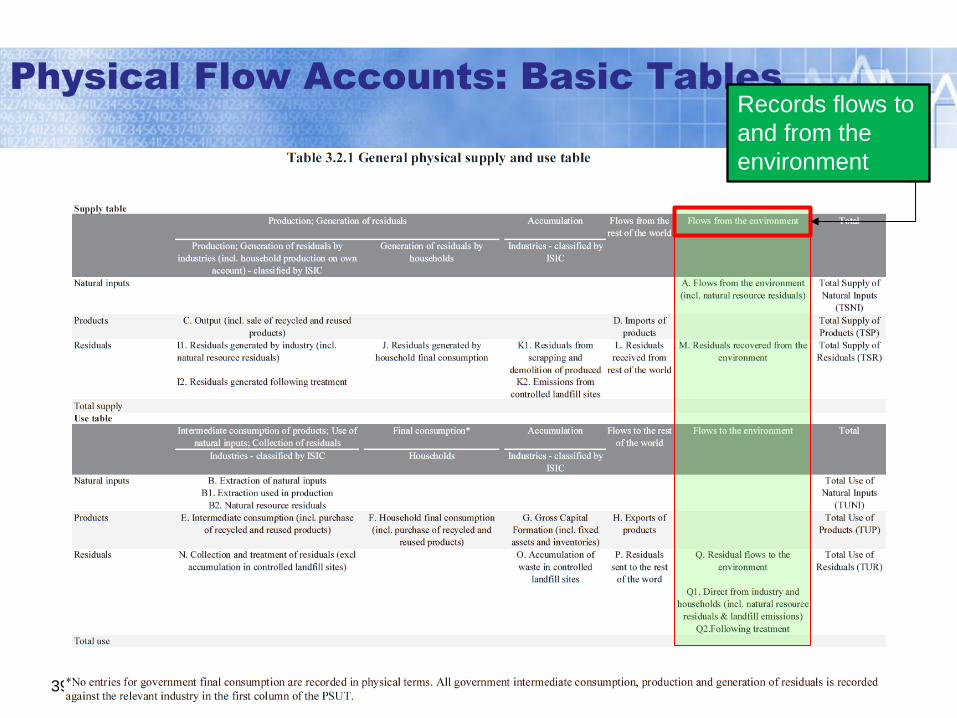
Physical Flow Accounts: Basic Tables
39
Records flows to
and from the
environment
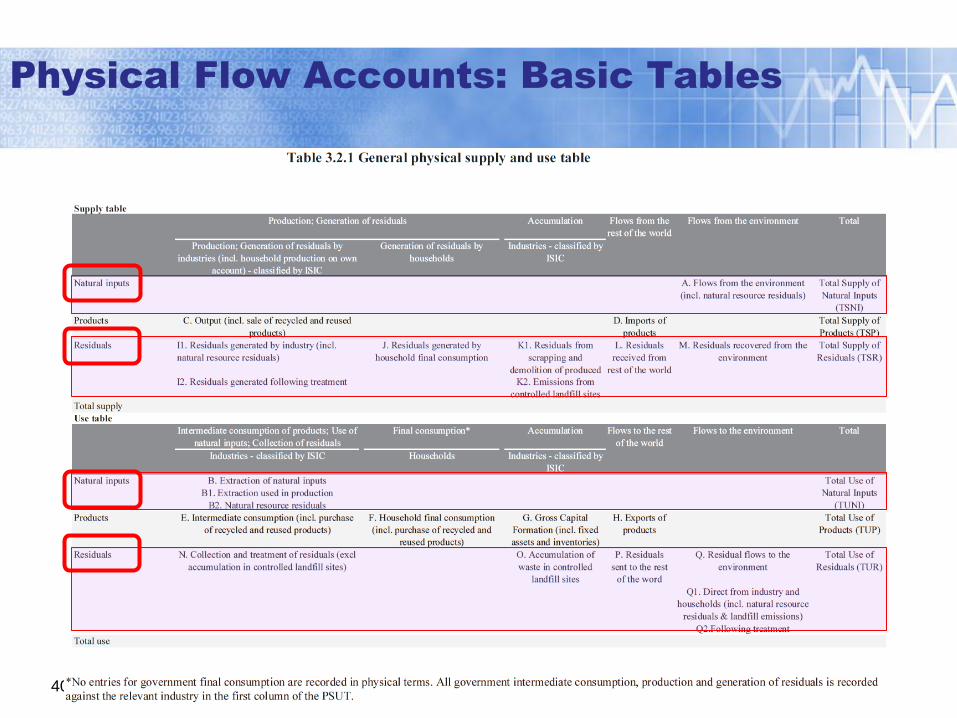
Physical Flow Accounts: Basic Tables
40
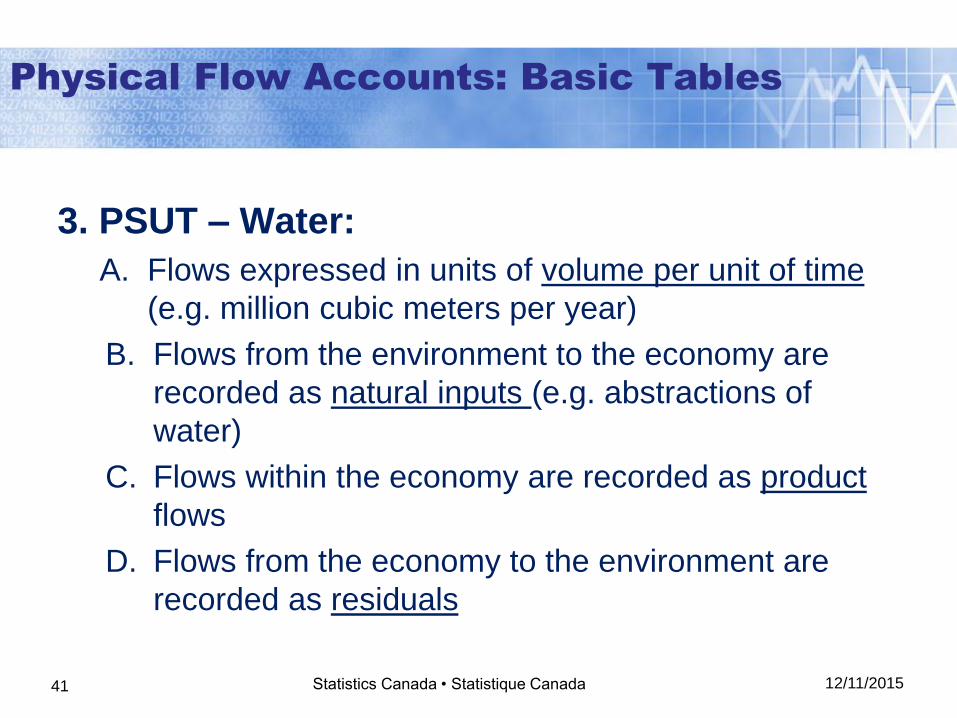
3. PSUT – Water:
A. Flows expressed in units of volume per unit of time
(e.g. million cubic meters per year)
B. Flows from the environment to the economy are
recorded as natural inputs (e.g. abstractions of
water)
C. Flows within the economy are recorded as product
flows
D. Flows from the economy to the environment are
recorded as residuals
12/11/2015 Statistics Canada • Statistique Canada 41
Physical Flow Accounts: Basic Tables
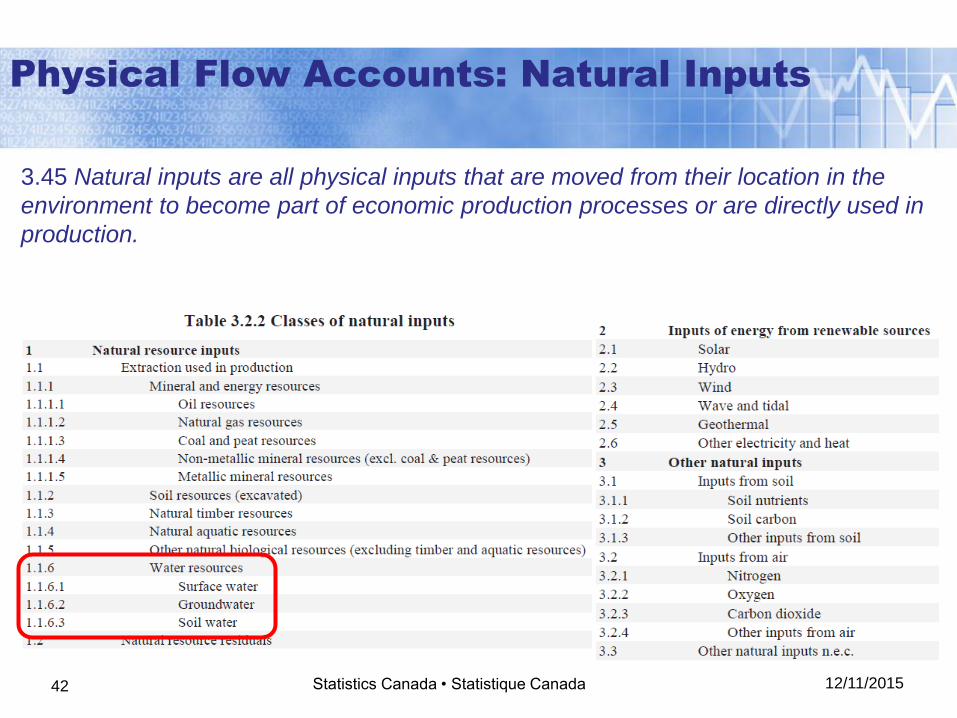
Physical Flow Accounts: Natural Inputs
12/11/2015 Statistics Canada • Statistique Canada 42
3.45 Natural inputs are all physical inputs that are moved from their location in the
environment to become part of economic production processes or are directly used in
production.
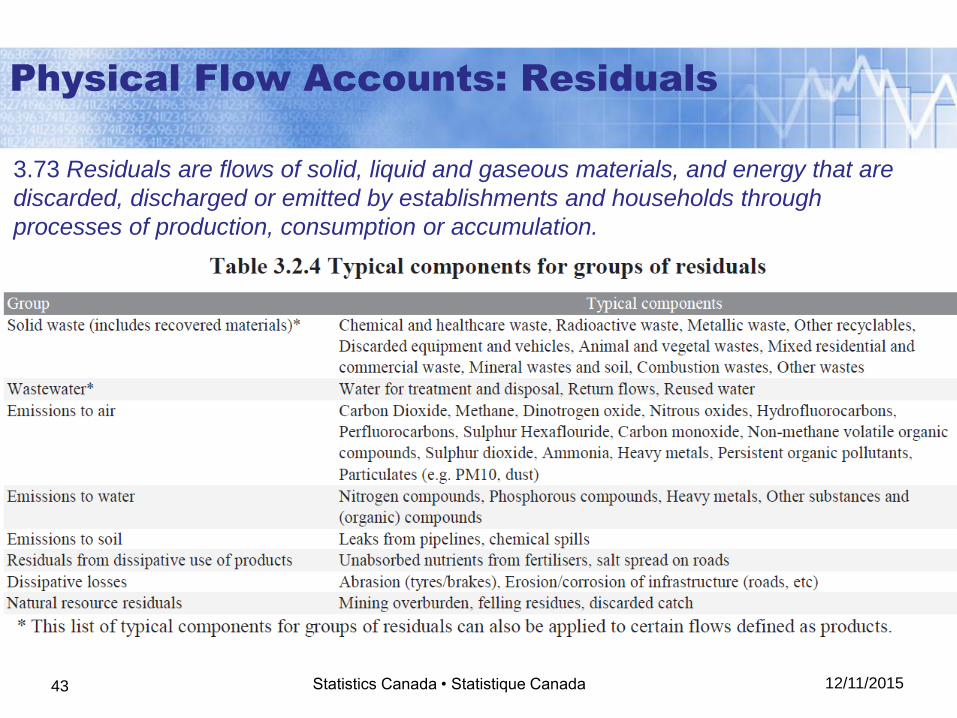
Physical Flow Accounts: Residuals
12/11/2015 Statistics Canada • Statistique Canada 43
3.73 Residuals are flows of solid, liquid and gaseous materials, and energy that are
discarded, discharged or emitted by establishments and households through
processes of production, consumption or accumulation.
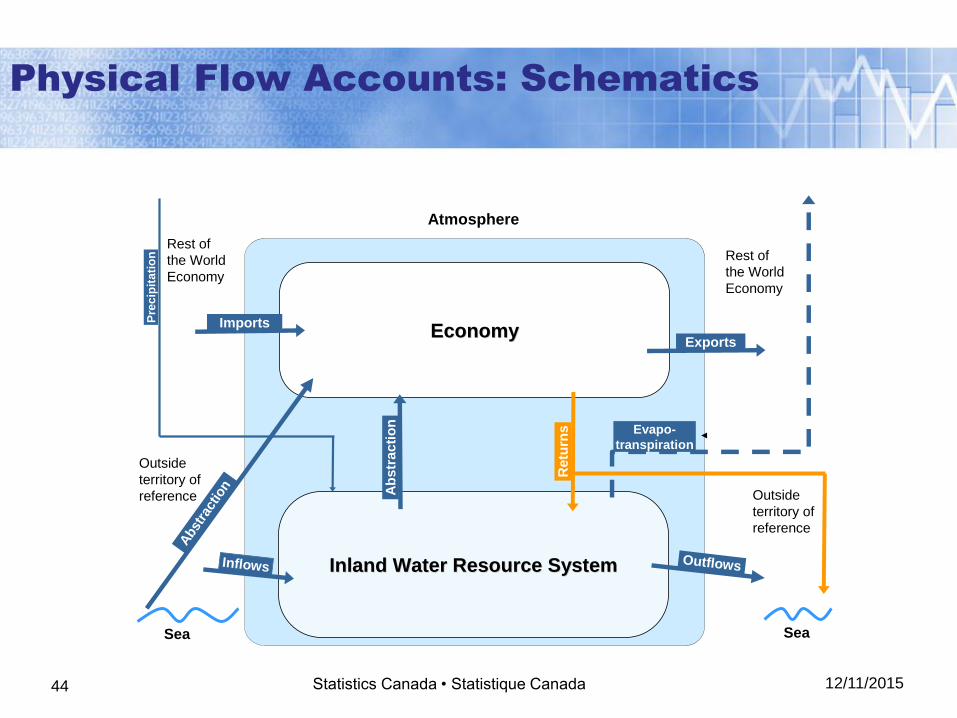
InlandInland WaterWater ResourceResource SystemSystem
EconomyEconomy
Evapo-
transpiration
Sea Sea
Atmosphere
Abst
ract
ion
Imports
Exports
InflowsOutflows
Ab
str
acti
on
Rest of
the World
Economy
Outside
territory of
reference Outside
territory of
reference
Rest of
the World
Economy
Retu
rns
Pre
cip
ita
tio
n
12/11/2015 Statistics Canada • Statistique Canada 44
Physical Flow Accounts: Schematics
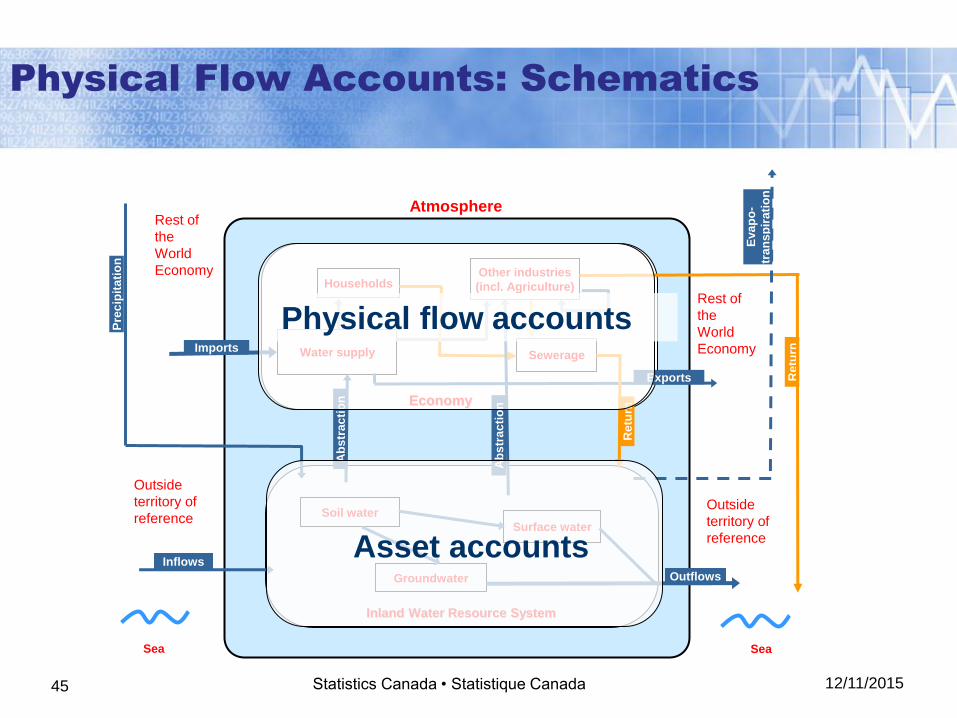
A
bs
trac
tio
n
Imports
Exports
Pre
cip
ita
tio
n
Economy
Water supply
Households Other industries
(incl. Agriculture)
Sewerage
Retu
rn
Rest of
the
World
Economy
Rest of
the
World
Economy
Eva
po
-
tran
sp
irati
on
Inland Water Resource System
Groundwater
Soil water
Surface water
Outflows
Inflows
Outside
territory of
reference Outside
territory of
reference
Sea
Retu
rn
Sea
Atmosphere
Ab
str
ac
tio
n
12/11/2015 Statistics Canada • Statistique Canada 45
Physical flow accounts
Asset accounts
Physical Flow Accounts: Schematics
Physical flow accounts
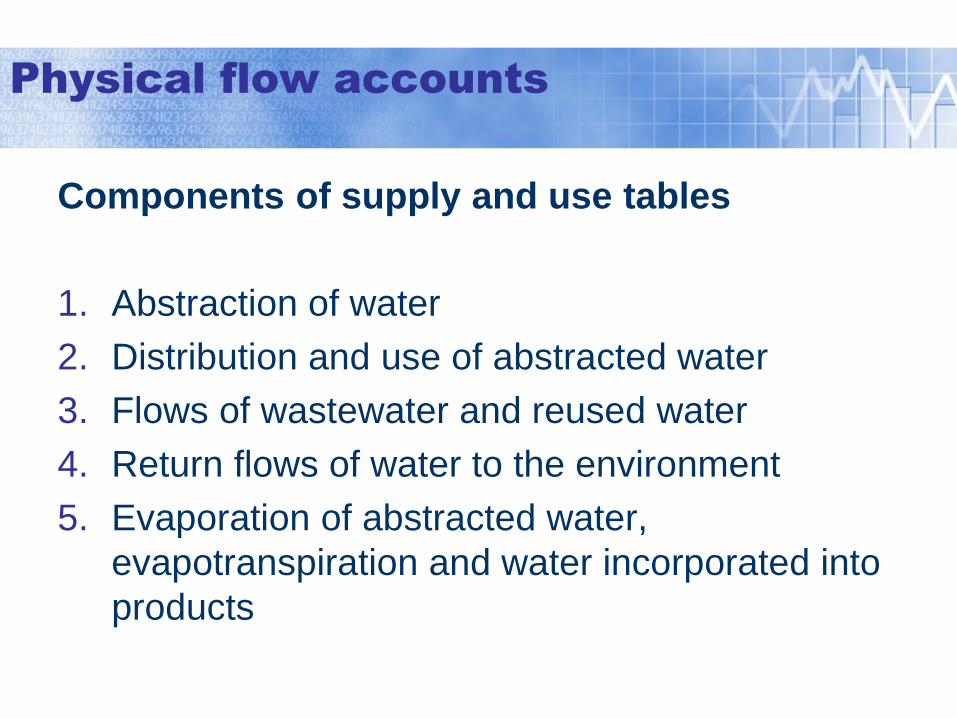
Components of supply and use tables
1. Abstraction of water
2. Distribution and use of abstracted water
3. Flows of wastewater and reused water
4. Return flows of water to the environment
5. Evaporation of abstracted water,
evapotranspiration and water incorporated into
products
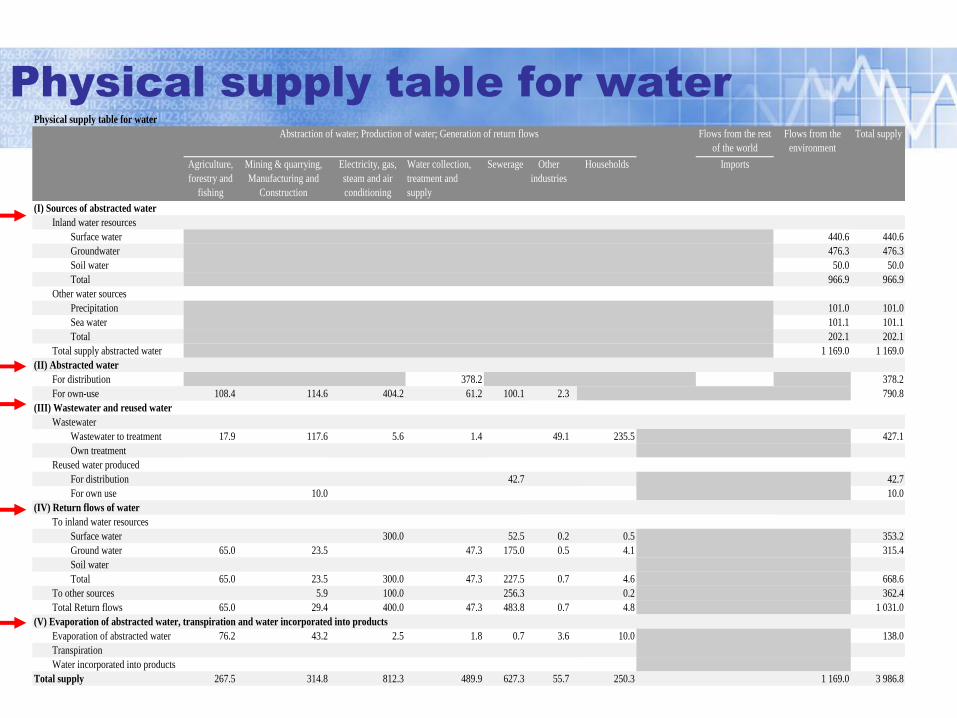
Physical supply table for water
Flows from the rest
of the world
Flows from the
environment
Total supply
Agriculture,
forestry and
fishing
Mining & quarrying,
Manufacturing and
Construction
Electricity, gas,
steam and air
conditioning
supply
Water collection,
treatment and
supply
Sewerage Other
industries
Households Imports
(I) Sources of abstracted water
Inland water resources
Surface water 440.6 440.6
Groundwater 476.3 476.3
Soil water 50.0 50.0
Total 966.9 966.9
Other water sources
Precipitation 101.0 101.0
Sea water 101.1 101.1
Total 202.1 202.1
Total supply abstracted water 1 169.0 1 169.0
(II) Abstracted water
For distribution 378.2 378.2
For own-use 108.4 114.6 404.2 61.2 100.1 2.3 790.8
(III) Wastewater and reused water
Wastewater
Wastewater to treatment 17.9 117.6 5.6 1.4 49.1 235.5 427.1
Own treatment
Reused water produced
For distribution 42.7 42.7
For own use 10.0 10.0
(IV) Return flows of water
To inland water resources
Surface water 300.0 52.5 0.2 0.5 353.2
Ground water 65.0 23.5 47.3 175.0 0.5 4.1 315.4
Soil water
Total 65.0 23.5 300.0 47.3 227.5 0.7 4.6 668.6
To other sources 5.9 100.0 256.3 0.2 362.4
Total Return flows 65.0 29.4 400.0 47.3 483.8 0.7 4.8 1 031.0
(V) Evaporation of abstracted water, transpiration and water incorporated into products
Evaporation of abstracted water 76.2 43.2 2.5 1.8 0.7 3.6 10.0 138.0
Transpiration
Water incorporated into products
Total supply 267.5 314.8 812.3 489.9 627.3 55.7 250.3 1 169.0 3 986.8
Abstraction of water; Production of water; Generation of return flows
Physical supply table for water
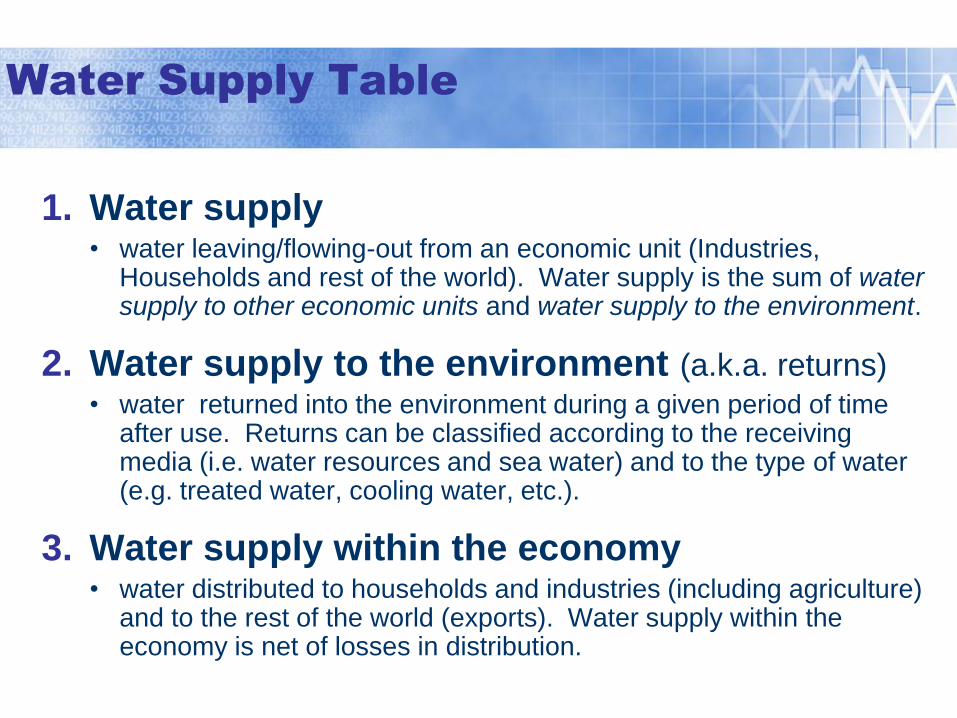
Water Supply Table
1. Water supply • water leaving/flowing-out from an economic unit (Industries,
Households and rest of the world). Water supply is the sum of water supply to other economic units and water supply to the environment.
2. Water supply to the environment (a.k.a. returns)
• water returned into the environment during a given period of time after use. Returns can be classified according to the receiving media (i.e. water resources and sea water) and to the type of water (e.g. treated water, cooling water, etc.).
3. Water supply within the economy • water distributed to households and industries (including agriculture)
and to the rest of the world (exports). Water supply within the economy is net of losses in distribution.
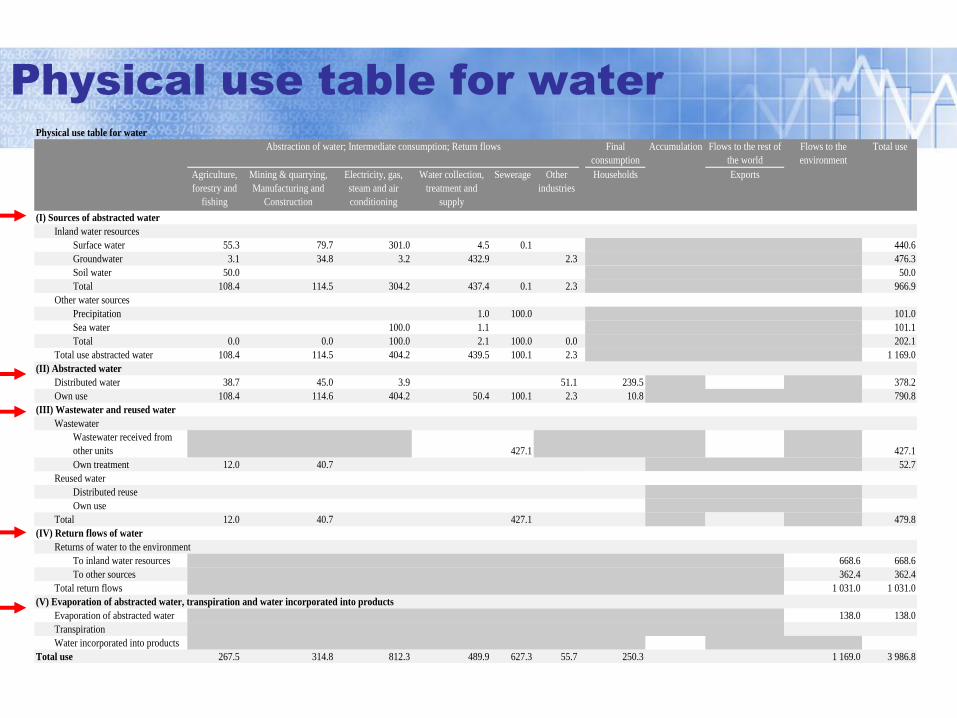
Physical use table for water
Physical use table for water
Final
consumption
Accumulation Flows to the rest of
the world
Flows to the
environment
Total use
Agriculture,
forestry and
fishing
Mining & quarrying,
Manufacturing and
Construction
Electricity, gas,
steam and air
conditioning
supply
Water collection,
treatment and
supply
Sewerage Other
industries
Households Exports
(I) Sources of abstracted water
Inland water resources
Surface water 55.3 79.7 301.0 4.5 0.1 440.6
Groundwater 3.1 34.8 3.2 432.9 2.3 476.3
Soil water 50.0 50.0
Total 108.4 114.5 304.2 437.4 0.1 2.3 966.9
Other water sources
Precipitation 1.0 100.0 101.0
Sea water 100.0 1.1 101.1
Total 0.0 0.0 100.0 2.1 100.0 0.0 202.1
Total use abstracted water 108.4 114.5 404.2 439.5 100.1 2.3 1 169.0
(II) Abstracted water
Distributed water 38.7 45.0 3.9 51.1 239.5 378.2
Own use 108.4 114.6 404.2 50.4 100.1 2.3 10.8 790.8
(III) Wastewater and reused water
Wastewater
Wastewater received from
other units 427.1 427.1
Own treatment 12.0 40.7 52.7
Reused water
Distributed reuse
Own use
Total 12.0 40.7 427.1 479.8
(IV) Return flows of water
Returns of water to the environment
To inland water resources 668.6 668.6
To other sources 362.4 362.4
Total return flows 1 031.0 1 031.0
(V) Evaporation of abstracted water, transpiration and water incorporated into products
Evaporation of abstracted water 138.0 138.0
Transpiration
Water incorporated into products
Total use 267.5 314.8 812.3 489.9 627.3 55.7 250.3 1 169.0 3 986.8
Abstraction of water; Intermediate consumption; Return flows
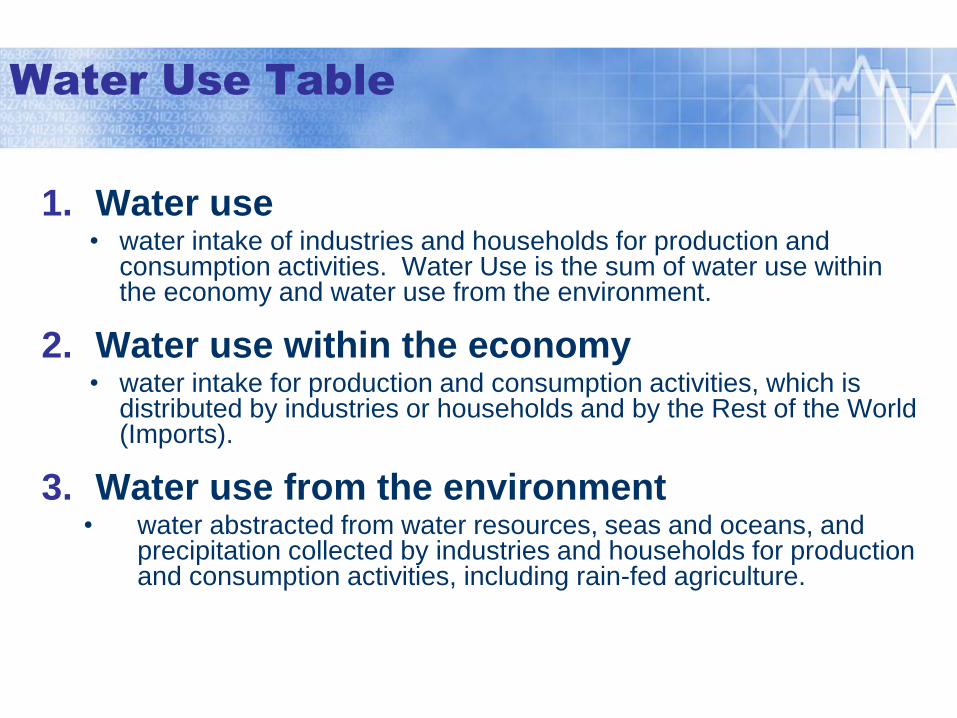
Water Use Table
1. Water use • water intake of industries and households for production and
consumption activities. Water Use is the sum of water use within the economy and water use from the environment.
2. Water use within the economy • water intake for production and consumption activities, which is
distributed by industries or households and by the Rest of the World (Imports).
3. Water use from the environment • water abstracted from water resources, seas and oceans, and
precipitation collected by industries and households for production and consumption activities, including rain-fed agriculture.
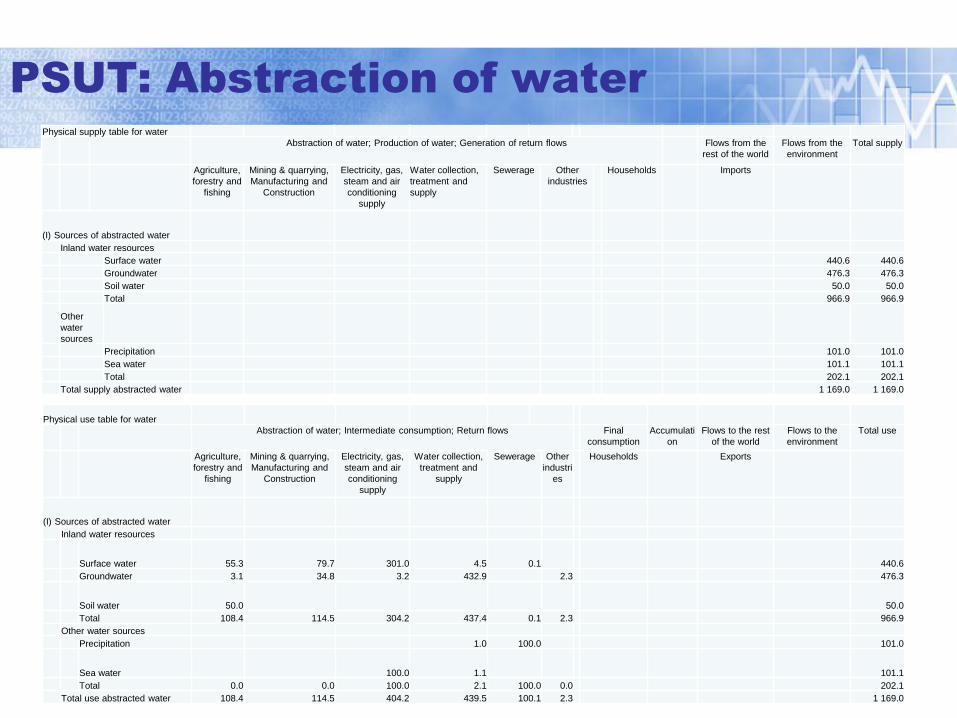
PSUT: Abstraction of water
Physical use table for water
Abstraction of water; Intermediate consumption; Return flows Final
consumption
Accumulati
on
Flows to the rest
of the world
Flows to the
environment
Total use
Agriculture,
forestry and
fishing
Mining & quarrying,
Manufacturing and
Construction
Electricity, gas,
steam and air
conditioning
supply
Water collection,
treatment and
supply
Sewerage Other
industri
es
Households Exports
(I) Sources of abstracted water
Inland water resources
Surface water 55.3 79.7 301.0 4.5 0.1 440.6
Groundwater 3.1 34.8 3.2 432.9 2.3 476.3
Soil water 50.0 50.0
Total 108.4 114.5 304.2 437.4 0.1 2.3 966.9
Other water sources
Precipitation 1.0 100.0 101.0
Sea water 100.0 1.1 101.1
Total 0.0 0.0 100.0 2.1 100.0 0.0 202.1
Total use abstracted water 108.4 114.5 404.2 439.5 100.1 2.3 1 169.0
Physical supply table for water
Abstraction of water; Production of water; Generation of return flows Flows from the
rest of the world
Flows from the
environment
Total supply
Agriculture,
forestry and
fishing
Mining & quarrying,
Manufacturing and
Construction
Electricity, gas,
steam and air
conditioning
supply
Water collection,
treatment and
supply
Sewerage Other
industries
Households
Imports
(I) Sources of abstracted water
Inland water resources
Surface water 440.6 440.6
Groundwater 476.3 476.3
Soil water 50.0 50.0
Total 966.9 966.9
Other
water
sources
Precipitation 101.0 101.0
Sea water 101.1 101.1
Total 202.1 202.1
Total supply abstracted water 1 169.0 1 169.0
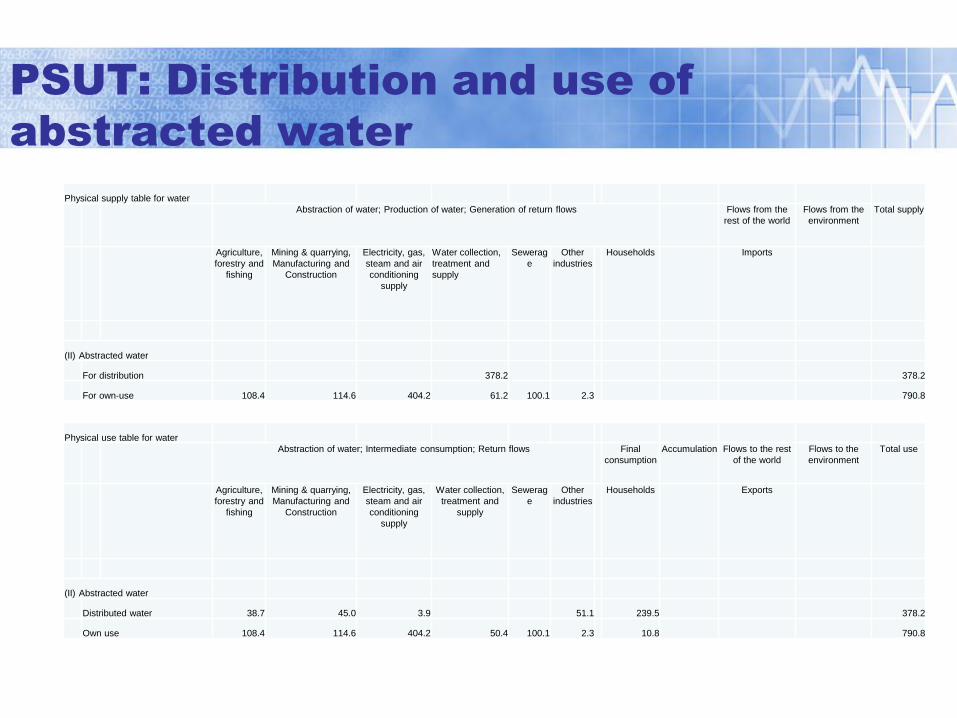
PSUT: Distribution and use of
abstracted water
Physical supply table for water
Abstraction of water; Production of water; Generation of return flows Flows from the
rest of the world
Flows from the
environment
Total supply
Agriculture,
forestry and
fishing
Mining & quarrying,
Manufacturing and
Construction
Electricity, gas,
steam and air
conditioning
supply
Water collection,
treatment and
supply
Sewerag
e
Other
industries
Households
Imports
(II) Abstracted water
For distribution 378.2 378.2
For own-use 108.4 114.6 404.2 61.2 100.1 2.3 790.8
Physical use table for water
Abstraction of water; Intermediate consumption; Return flows Final
consumption
Accumulation Flows to the rest
of the world
Flows to the
environment
Total use
Agriculture,
forestry and
fishing
Mining & quarrying,
Manufacturing and
Construction
Electricity, gas,
steam and air
conditioning
supply
Water collection,
treatment and
supply
Sewerag
e
Other
industries
Households Exports
(II) Abstracted water
Distributed water 38.7 45.0 3.9 51.1 239.5 378.2
Own use 108.4 114.6 404.2 50.4 100.1 2.3 10.8 790.8
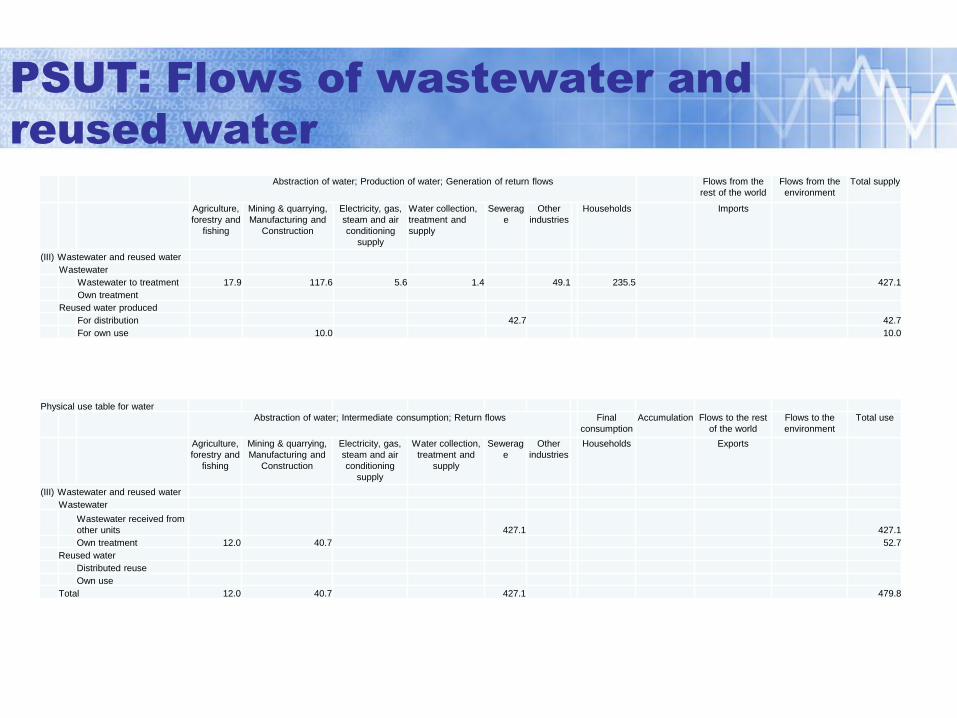
PSUT: Flows of wastewater and
reused water
Abstraction of water; Production of water; Generation of return flows Flows from the
rest of the world
Flows from the
environment
Total supply
Agriculture,
forestry and
fishing
Mining & quarrying,
Manufacturing and
Construction
Electricity, gas,
steam and air
conditioning
supply
Water collection,
treatment and
supply
Sewerag
e
Other
industries
Households
Imports
(III) Wastewater and reused water
Wastewater
Wastewater to treatment 17.9 117.6 5.6 1.4 49.1 235.5 427.1
Own treatment
Reused water produced
For distribution 42.7 42.7
For own use 10.0 10.0
Physical use table for water
Abstraction of water; Intermediate consumption; Return flows Final
consumption
Accumulation Flows to the rest
of the world
Flows to the
environment
Total use
Agriculture,
forestry and
fishing
Mining & quarrying,
Manufacturing and
Construction
Electricity, gas,
steam and air
conditioning
supply
Water collection,
treatment and
supply
Sewerag
e
Other
industries
Households Exports
(III) Wastewater and reused water
Wastewater
Wastewater received from
other units 427.1 427.1
Own treatment 12.0 40.7 52.7
Reused water
Distributed reuse
Own use
Total 12.0 40.7 427.1 479.8
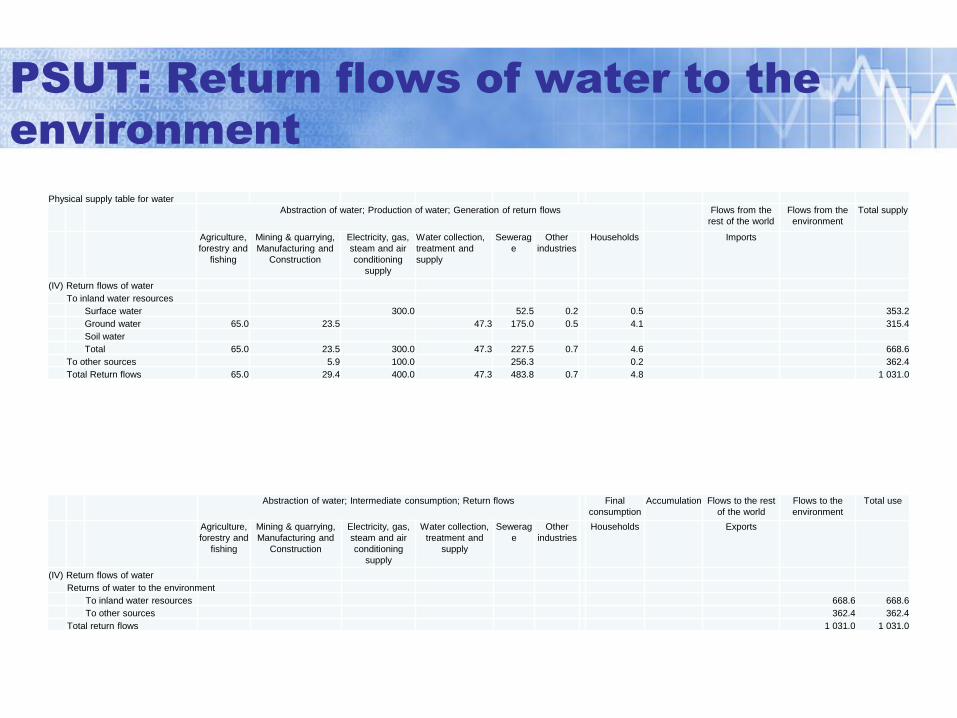
PSUT: Return flows of water to the
environment
Physical supply table for water
Abstraction of water; Production of water; Generation of return flows Flows from the
rest of the world
Flows from the
environment
Total supply
Agriculture,
forestry and
fishing
Mining & quarrying,
Manufacturing and
Construction
Electricity, gas,
steam and air
conditioning
supply
Water collection,
treatment and
supply
Sewerag
e
Other
industries
Households
Imports
(IV) Return flows of water
To inland water resources
Surface water 300.0 52.5 0.2 0.5 353.2
Ground water 65.0 23.5 47.3 175.0 0.5 4.1 315.4
Soil water
Total 65.0 23.5 300.0 47.3 227.5 0.7 4.6 668.6
To other sources 5.9 100.0 256.3 0.2 362.4
Total Return flows 65.0 29.4 400.0 47.3 483.8 0.7 4.8 1 031.0
Abstraction of water; Intermediate consumption; Return flows Final
consumption
Accumulation Flows to the rest
of the world
Flows to the
environment
Total use
Agriculture,
forestry and
fishing
Mining & quarrying,
Manufacturing and
Construction
Electricity, gas,
steam and air
conditioning
supply
Water collection,
treatment and
supply
Sewerag
e
Other
industries
Households Exports
(IV) Return flows of water
Returns of water to the environment
To inland water resources 668.6 668.6
To other sources 362.4 362.4
Total return flows 1 031.0 1 031.0
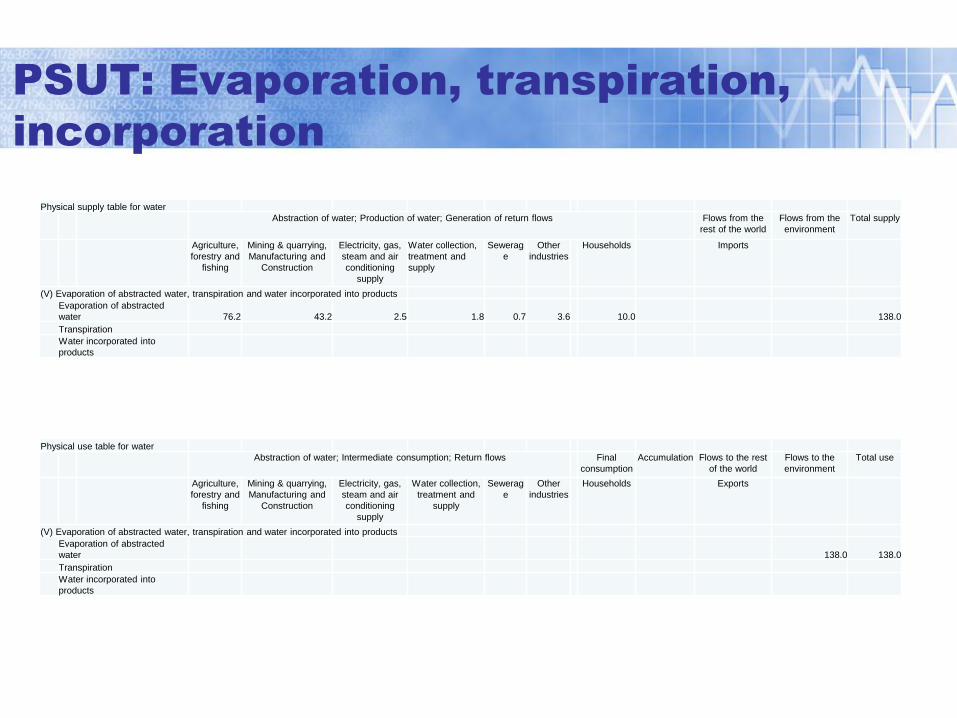
PSUT: Evaporation, transpiration,
incorporation
Physical supply table for water
Abstraction of water; Production of water; Generation of return flows Flows from the
rest of the world
Flows from the
environment
Total supply
Agriculture,
forestry and
fishing
Mining & quarrying,
Manufacturing and
Construction
Electricity, gas,
steam and air
conditioning
supply
Water collection,
treatment and
supply
Sewerag
e
Other
industries
Households
Imports
(V) Evaporation of abstracted water, transpiration and water incorporated into products
Evaporation of abstracted
water 76.2 43.2 2.5 1.8 0.7 3.6 10.0 138.0
Transpiration
Water incorporated into
products
Physical use table for water
Abstraction of water; Intermediate consumption; Return flows Final
consumption
Accumulation Flows to the rest
of the world
Flows to the
environment
Total use
Agriculture,
forestry and
fishing
Mining & quarrying,
Manufacturing and
Construction
Electricity, gas,
steam and air
conditioning
supply
Water collection,
treatment and
supply
Sewerag
e
Other
industries
Households Exports
(V) Evaporation of abstracted water, transpiration and water incorporated into products
Evaporation of abstracted
water 138.0 138.0
Transpiration
Water incorporated into
products
Accounting for emissions to water
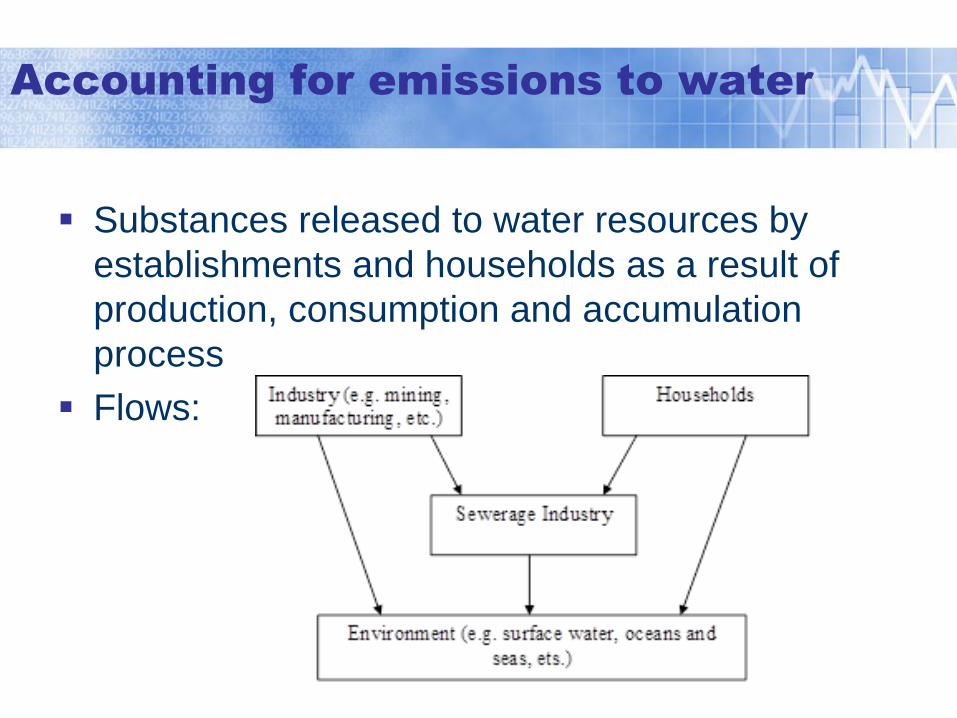
Substances released to water resources by
establishments and households as a result of
production, consumption and accumulation
process
Flows:
Accounting for emissions to water
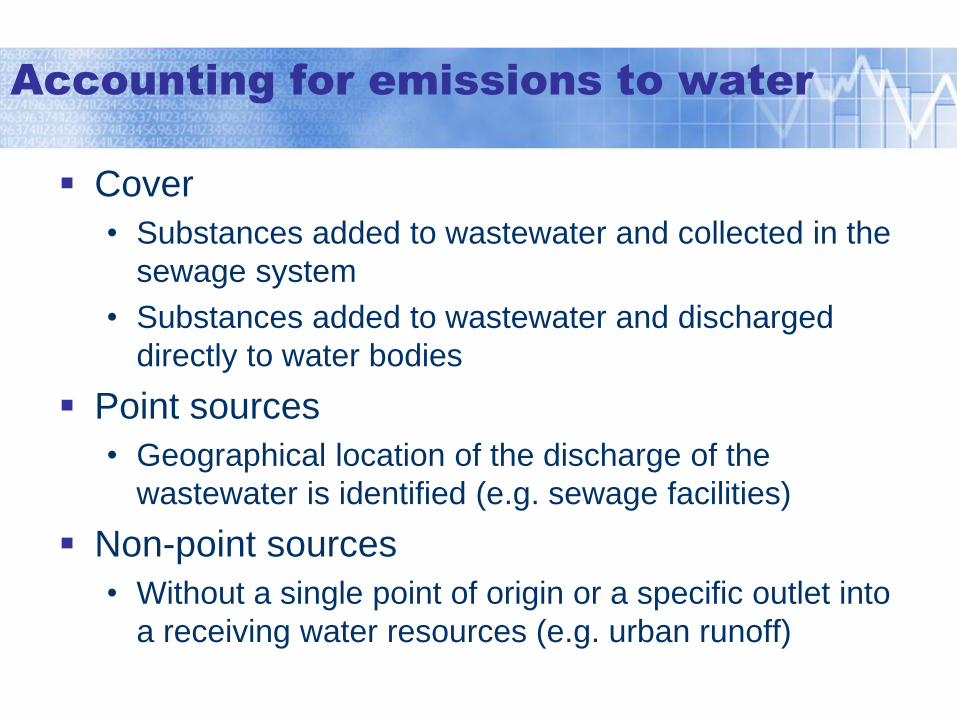
Cover
• Substances added to wastewater and collected in the
sewage system
• Substances added to wastewater and discharged
directly to water bodies
Point sources
• Geographical location of the discharge of the
wastewater is identified (e.g. sewage facilities)
Non-point sources
• Without a single point of origin or a specific outlet into
a receiving water resources (e.g. urban runoff)
Accounting for emissions to water
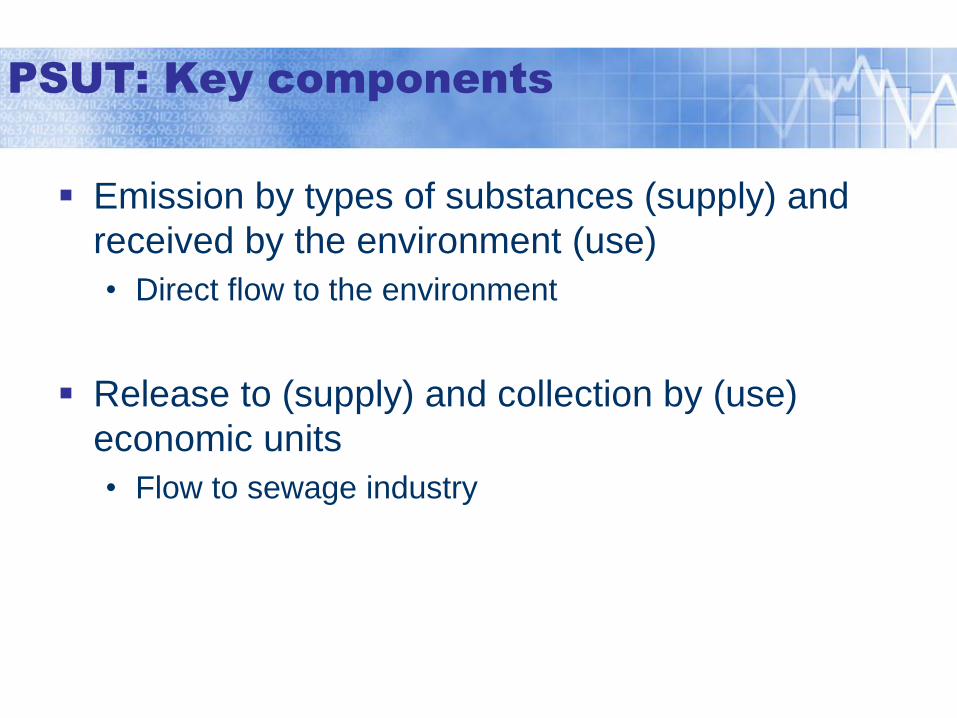
PSUT: Key components
Emission by types of substances (supply) and
received by the environment (use)
• Direct flow to the environment
Release to (supply) and collection by (use)
economic units
• Flow to sewage industry

PSUT for water emission
Physical supply table for gross releases of substances to water
Accumulation Flows with
the rest of
the world
Flows from the
environment
Total supply
Sewerage
industry
Other
industries
Households Emissions
from fixed
assets
Emissions by type of substance
BOD / COD * 5 594 11 998 2 712 20 304
Suspended solids
Heavy metals
Phosphorous 836 1 587 533 2 956
Nitrogen 10 033 47 258 1 908 59 199
Releases to other economic units
BOD / COD * 7 927 8 950 16 877
Suspended solids
Heavy metals
Phosphorous 814 6 786 7 600
Nitrogen 15 139 30 463 45 602
Physical use table for gross releases of substances to water
Flows with
the rest of
the world
Flows to the
environment
Total use
Sewerage
industry
Other
industries
Households
Emissions received by the environment
BOD / COD * 20 304 20 304
Suspended solids
Heavy metals
Phosphorous 2 956 2 956
Nitrogen 59 199 59 199
Collection by other economic units
BOD / COD * 16 877 16 877
Suspended solids
Heavy metals
Phosphorous 7 600 7 600
Nitrogen 45 602 45 602
Generation of gross releases to
water
Collection of gross releases to
water
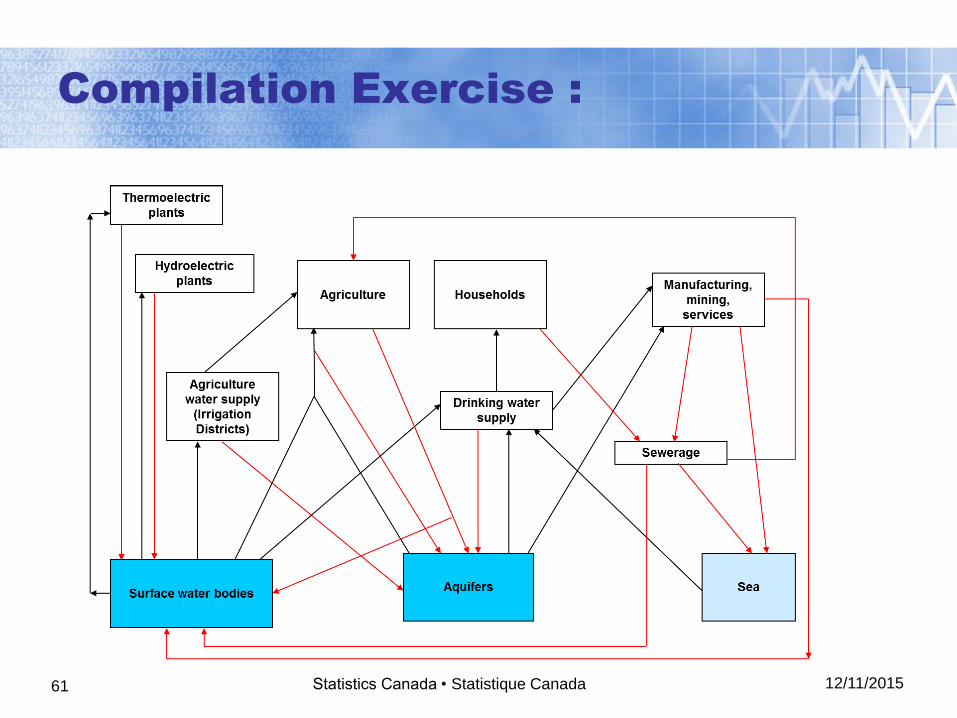
Compilation Exercise :
12/11/2015 Statistics Canada • Statistique Canada 61
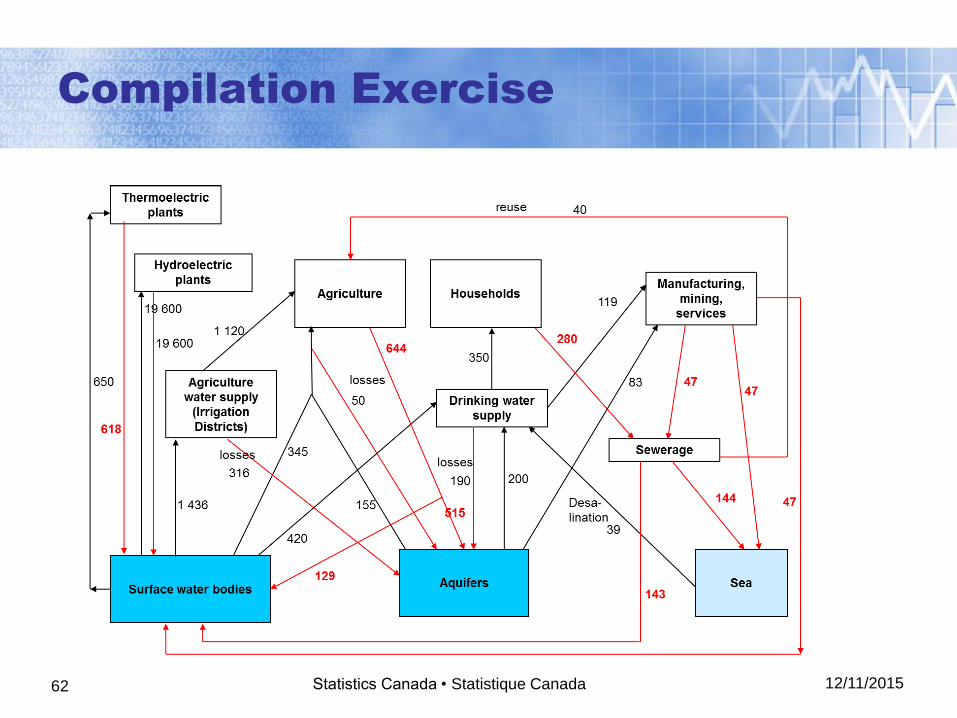
Compilation Exercise
12/11/2015 Statistics Canada • Statistique Canada 62
12/11/2015 Statistics Canada • Statistique Canada 63
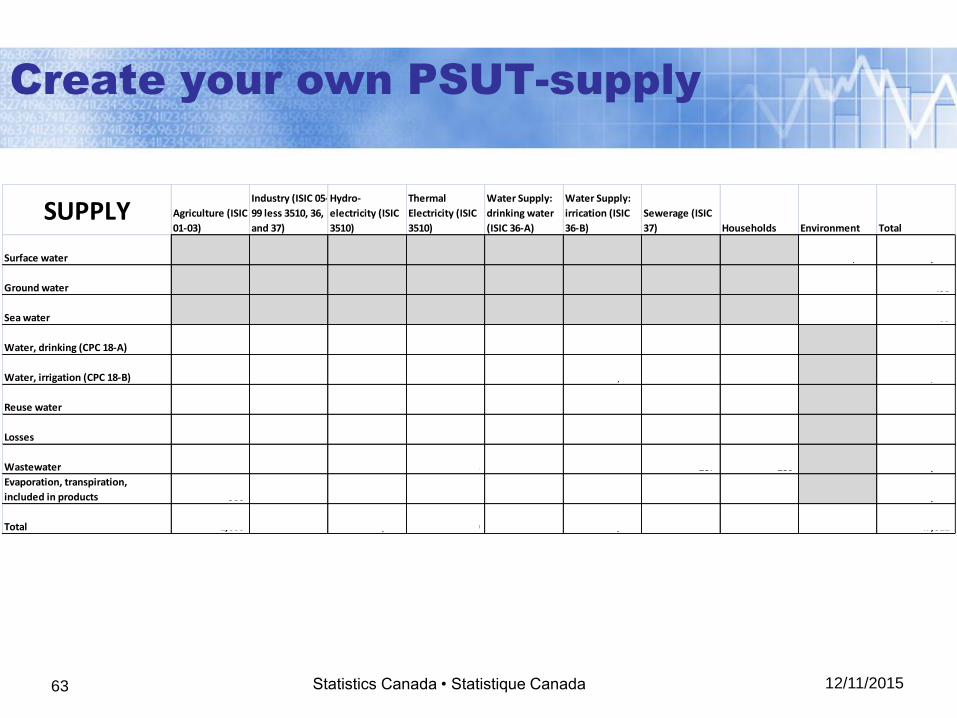
Create your own PSUT-supply
SUPPLY Agriculture (ISIC
01-03)
Industry (ISIC 05-
99 less 3510, 36,
and 37)
Hydro-
electricity (ISIC
3510)
Thermal
Electricity (ISIC
3510)
Water Supply:
drinking water
(ISIC 36-A)
Water Supply:
irrication (ISIC
36-B)
Sewerage (ISIC
37) Households Environment Total
Surface water 22,451 22,451
Ground water 438 438
Sea water 39 39
Water, drinking (CPC 18-A) 469 469
Water, irrigation (CPC 18-B) 1,120 1,120
Reuse water 40 40
Losses 50 190 316 556
Wastewater 644 141 19,600 618 287 280 21,570
Evaporation, transpiration,
included in products 966 61 32 70 1,129
Total 1,660 202 19,600 650 659 1,436 327 350 22,928 47,812
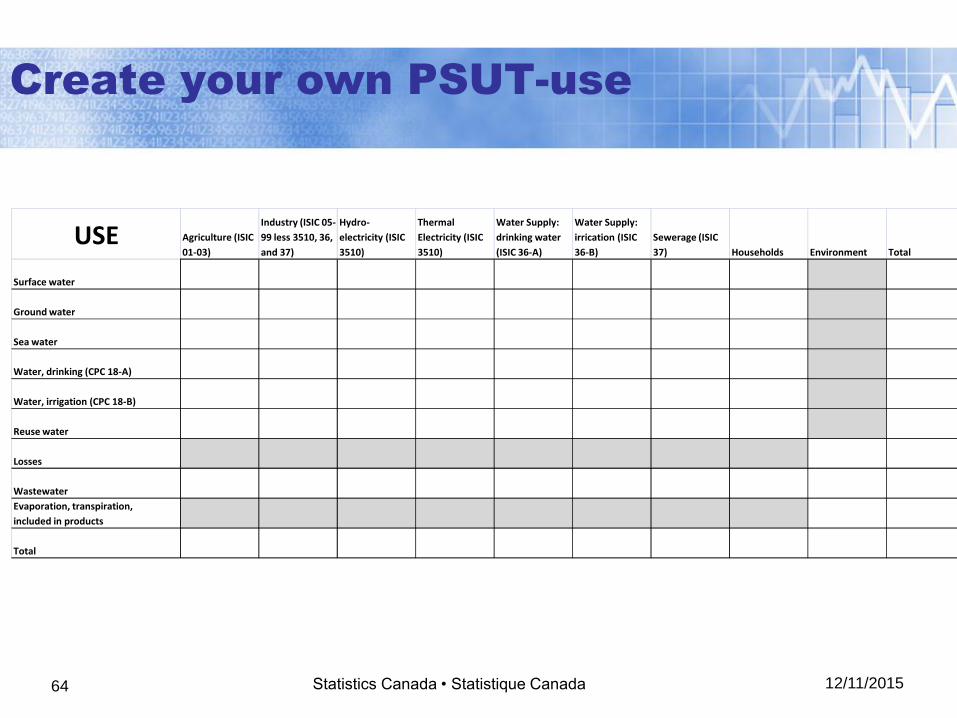
Create your own PSUT-use
12/11/2015 Statistics Canada • Statistique Canada 64
USE Agriculture (ISIC
01-03)
Industry (ISIC 05-
99 less 3510, 36,
and 37)
Hydro-
electricity (ISIC
3510)
Thermal
Electricity (ISIC
3510)
Water Supply:
drinking water
(ISIC 36-A)
Water Supply:
irrication (ISIC
36-B)
Sewerage (ISIC
37) Households Environment Total
Surface water
Ground water
Sea water
Water, drinking (CPC 18-A)
Water, irrigation (CPC 18-B)
Reuse water
Losses
Wastewater
Evaporation, transpiration,
included in products
Total
Data sources and compilation
Data sources:
Survey data
Administrative data
Modelled data Existing statistics
…
Issues:
Estimating for sectors not covered by surveys
Undertanding the impact of the C.V. on the analysis
Consistency with National Account concepts
Compiling time series
…
12/11/2015 Statistics Canada • Statistique Canada 65
Real world example - Canada
Data sources
Selected accounts results
12/11/2015 Statistics Canada • Statistique Canada 66
12/11/2015 67
Current Water Surveys
• Industrial Water Survey
• Survey of Drinking Water Plants
• Agricultural Water Survey
• Households and the Environment Survey
12/11/2015 68
Industrial Water Survey
• First conducted in 1972 by Statistics Canada for Environment
Canada, the survey was conducted every 5 years until 1996
when cancelled due to budget cuts.
• Funding revived in 2004 through the Canadian Environmental
Sustainability Indicators (CESI) project to provide data for a
national water quality indicator.
• Survey run every 2 years since 2005. 2013 data now being
processed and will be released by October this year. 2015
data collection will be in field by April 2016.
12/11/2015 69
Industrial Water Survey
• The Industrial Water Survey is composed of three
distinct questionnaires:
• Manufacturing
• Mining
• Thermal electric
12/11/2015 70
Industrial Water Survey
• The Industrial Water Survey collects information on:
• water intake and intake treatment/purpose
• water recirculation (reuse)
• water discharge and its treatment
• water acquisition/treatment costs
• water–related operating and maintenance expenses
• There are 36 data tables available through CANSIM:
153-0047 to 153-0051; and 153-0067 to 153-0097.
12/11/2015 71
Survey of Drinking Water Plants
• This survey is a census of drinking water plants serving
300 or more people.
• Funding was secured in 2004 as part of the Canadian
Environmental Sustainability Indicators (CESI) project to
provide data for national water quality indicators.
• Survey run every 2 years since 2007. 2013 data being
released on June 19, 2015. 2015 data collection will be
in field by early 2016.
12/11/2015 72
Survey of Drinking Water Plants
• The survey collects information on:
• Volumes of water production (monthly & annual)
• Source water type and source water quality (i.e. surface
water turbidity)
• Population served & sector uses (residential/ICI/losses)
• Type of of treatment
• Financial costs including capital expenditures and
operation and maintenance
• There are 9 data tables available through CANSIM: 153-0105
to 153-0108; and 153-0124 through 153-0128.
12/11/2015 73
Agricultural Water Survey (AWS)
• This survey is conducted to gather information on
irrigation water use, irrigation methods and practices,
and sources and quality of water used for agricultural
purposes on Canadian farms.
• Survey pilot was conducted in 2007 and has run every 2
years since 2010. 2014 data now being processed and
will be released September 9th this year. 2016 data
collection will be in field by October 2016.
12/11/2015 74
Agricultural Water Survey
• The main topics covered include:
• Volume of water used for irrigation
• Area irrigated by crop type, yield and irrigation system
• Sources of water: Groundwater/surface water, on-farm/off-
farm
• Irrigation methods and water management techniques
• Water quality: intake treatment
• Currently there are 2 tables of data available through
CANSIM (153-0099 and 153-0100). Will expand to 10 tables
with the release of the 2014 data in September.
12/11/2015 75
Households and the Environment
Survey
• The Households and the Environment Survey measures the
environmental practices and behaviours of Canadian
households.
• The survey was first conducted in 1991 and repeated in 1994,
2006 and 2007. Since 2007 it has been run every 2 years.
• Partial 2013 data were released on March 10, 2015. All
variables to be available in fall 2015. 2015 data collection will
be in field in October 2015.
12/11/2015 76
HES – select water-related content
• Related to consumption or conservation of water: Source of water supply, water metering
Primary type of drinking water at home
Low flow showerheads, low volume toilets
Frequency of lawn, garden watering, sprinkler systems
Devices used to water lawns and gardens, timers, rain barrels, cisterns
• Related to water quality Use of fertilizers, pesticides
Disposal of old medicines, old batteries
Septic system maintenance
Use of motor boats
• Related to impacts of water quality (and concerns) Use of bottled water, home treatment of water - reasons
Boil water advisories
Water testing by labs – results
Beach use
12/11/2015 Statistics Canada • Statistique Canada 77
Surveys: Current developments
1. Exploring use of administrative data for Industrial Water
Survey (Oil & Gas) and the Agricultural Water Survey
2. Survey of Drinking Water Plants currently has an
agreement with Quebec municipal affairs ministry to
collect Quebec information in order to reduce burden
3. Conducted a feasibility study on sewage treatment
statistics. We looked at gaps and user's data demands.
Then determined what could be fulfilled using existing
data and a new survey.
Selected accounts results
12/11/2015 Statistics Canada • Statistique Canada 78
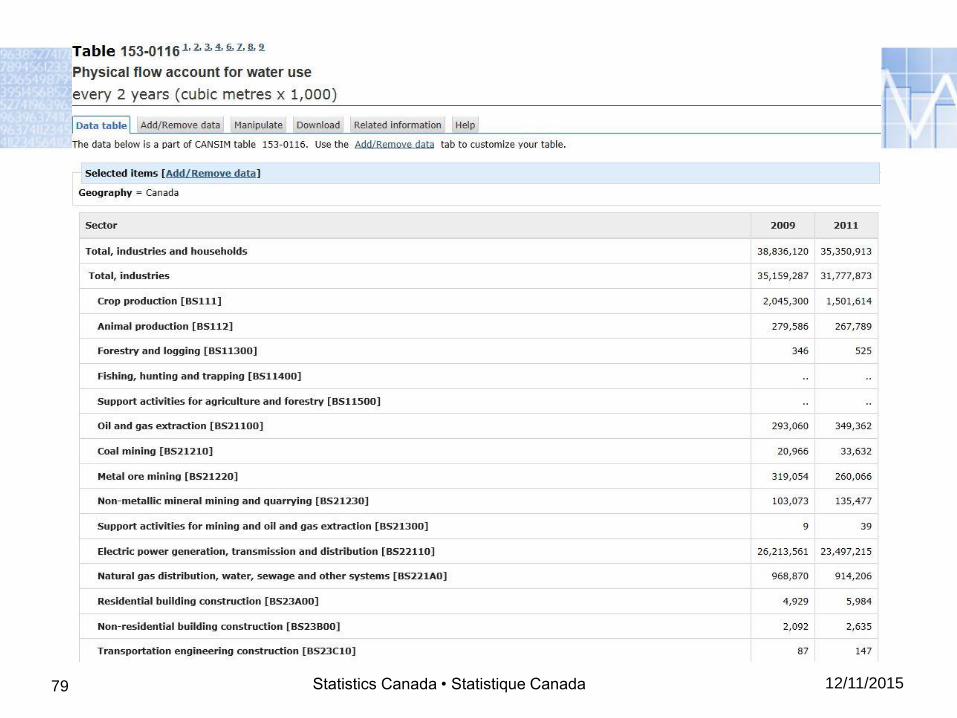
12/11/2015 Statistics Canada • Statistique Canada 79
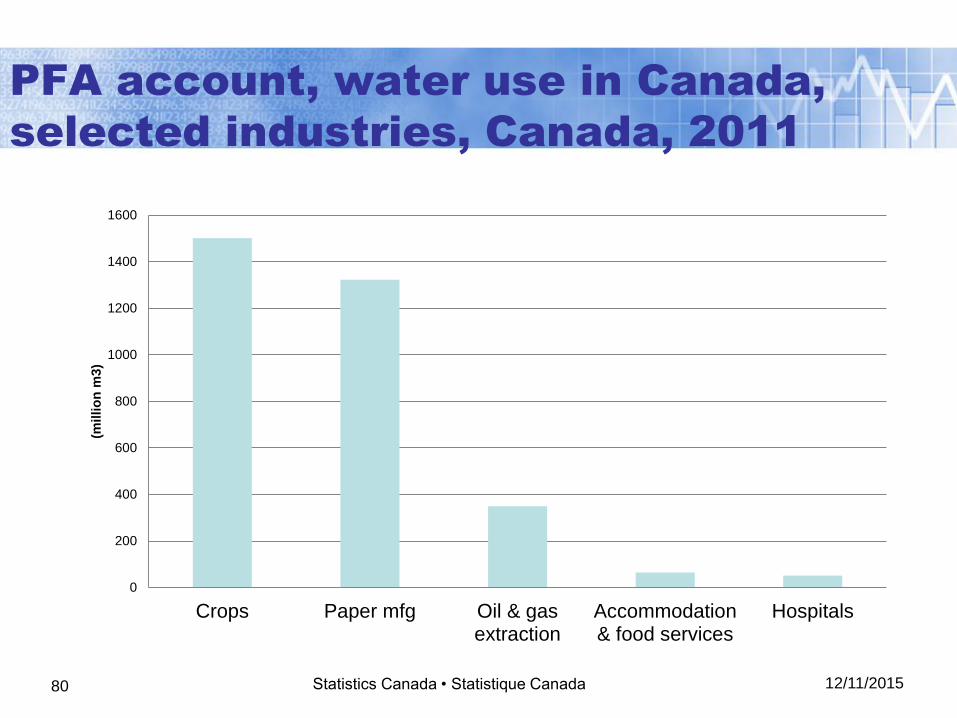
PFA account, water use in Canada,
selected industries, Canada, 2011
0
200
400
600
800
1000
1200
1400
1600
Crops Paper mfg Oil & gasextraction
Accommodation& food services
Hospitals
(millio
n m
3)
12/11/2015 Statistics Canada • Statistique Canada 80
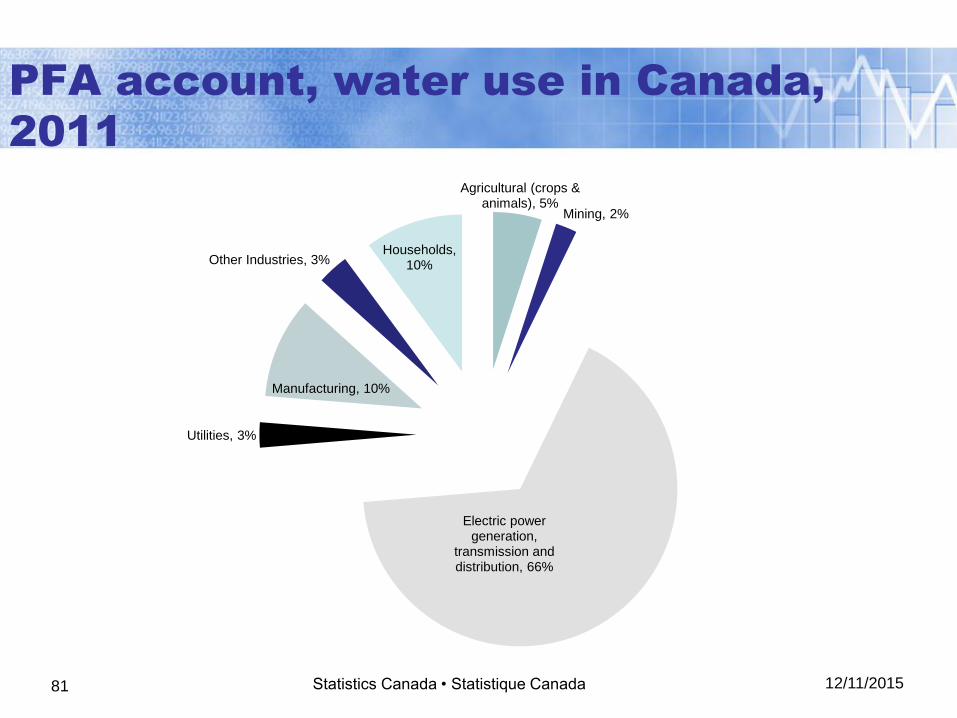
PFA account, water use in Canada,
2011
Agricultural (crops & animals), 5%
Mining, 2%
Electric power generation,
transmission and distribution, 66%
Utilities, 3%
Manufacturing, 10%
Other Industries, 3% Households,
10%
12/11/2015 Statistics Canada • Statistique Canada 81
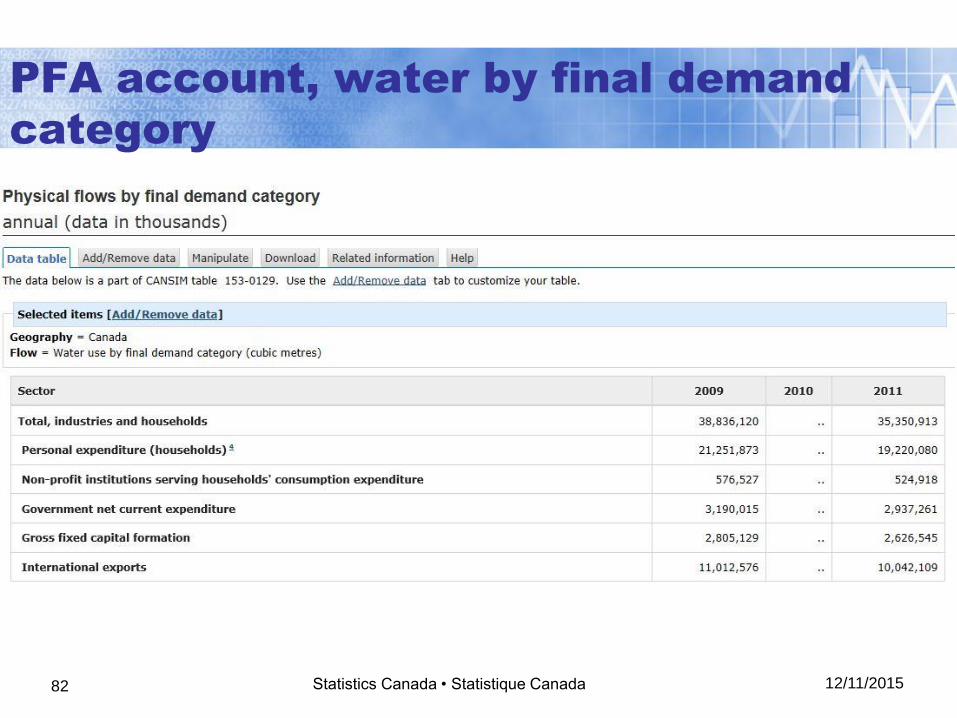
12/11/2015 Statistics Canada • Statistique Canada 82
PFA account, water by final demand
category
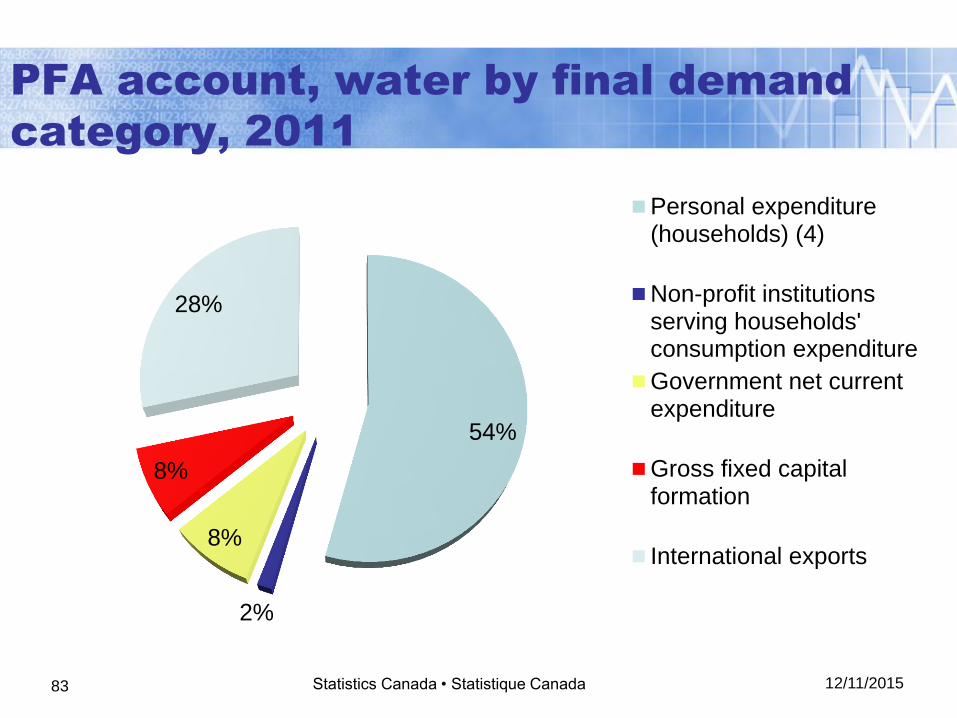
PFA account, water by final demand
category, 2011
12/11/2015 Statistics Canada • Statistique Canada 83
54%
2%
8%
8%
28%
Personal expenditure(households) (4)
Non-profit institutionsserving households'consumption expenditure
Government net currentexpenditure
Gross fixed capitalformation
International exports
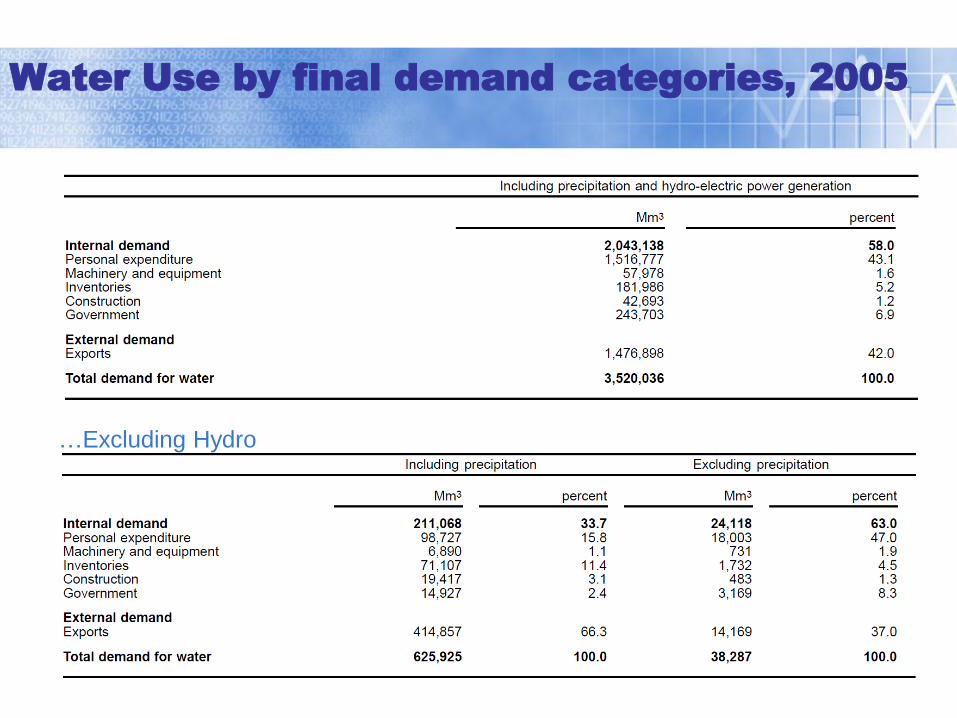
Water Use by final demand categories, 2005
…Excluding Hydro
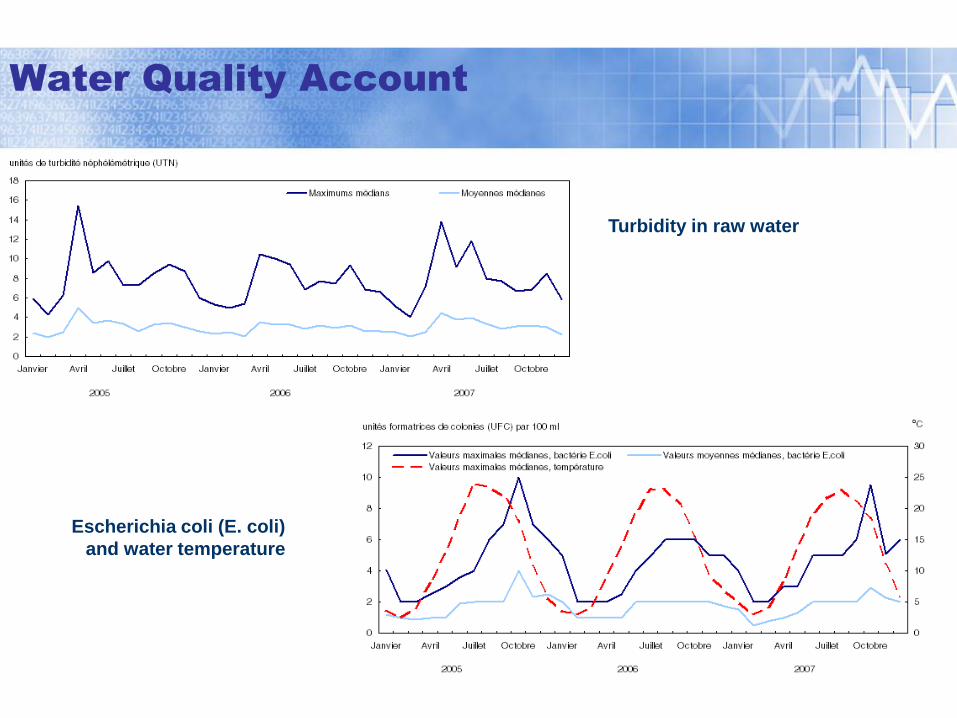
Water Quality Account
Escherichia coli (E. coli)
and water temperature
Turbidity in raw water
Thanks to the following individuals for sharing their ideas
and material …
• Murray Cameron
• Julian Chow
• Ricardo Martinez-Lagunes
• Joe St.-Lawrence
• Michael Vardon
And thanks to the NBS and UNSD for their kind invitation.
franç[email protected]
12/11/2015 Statistics Canada • Statistique Canada 86
Physical Flow Accounts for Water
12/11/2015 Statistics Canada • Statistique Canada 87
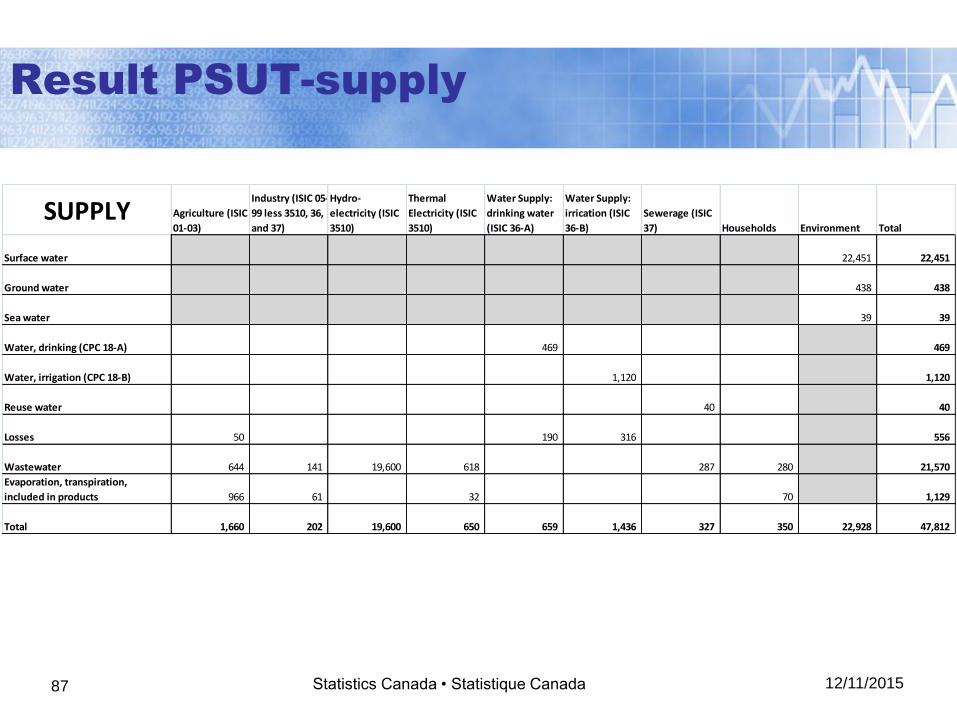
Result PSUT-supply
SUPPLY Agriculture (ISIC
01-03)
Industry (ISIC 05-
99 less 3510, 36,
and 37)
Hydro-
electricity (ISIC
3510)
Thermal
Electricity (ISIC
3510)
Water Supply:
drinking water
(ISIC 36-A)
Water Supply:
irrication (ISIC
36-B)
Sewerage (ISIC
37) Households Environment Total
Surface water 22,451 22,451
Ground water 438 438
Sea water 39 39
Water, drinking (CPC 18-A) 469 469
Water, irrigation (CPC 18-B) 1,120 1,120
Reuse water 40 40
Losses 50 190 316 556
Wastewater 644 141 19,600 618 287 280 21,570
Evaporation, transpiration,
included in products 966 61 32 70 1,129
Total 1,660 202 19,600 650 659 1,436 327 350 22,928 47,812
12/11/2015 Statistics Canada • Statistique Canada 88
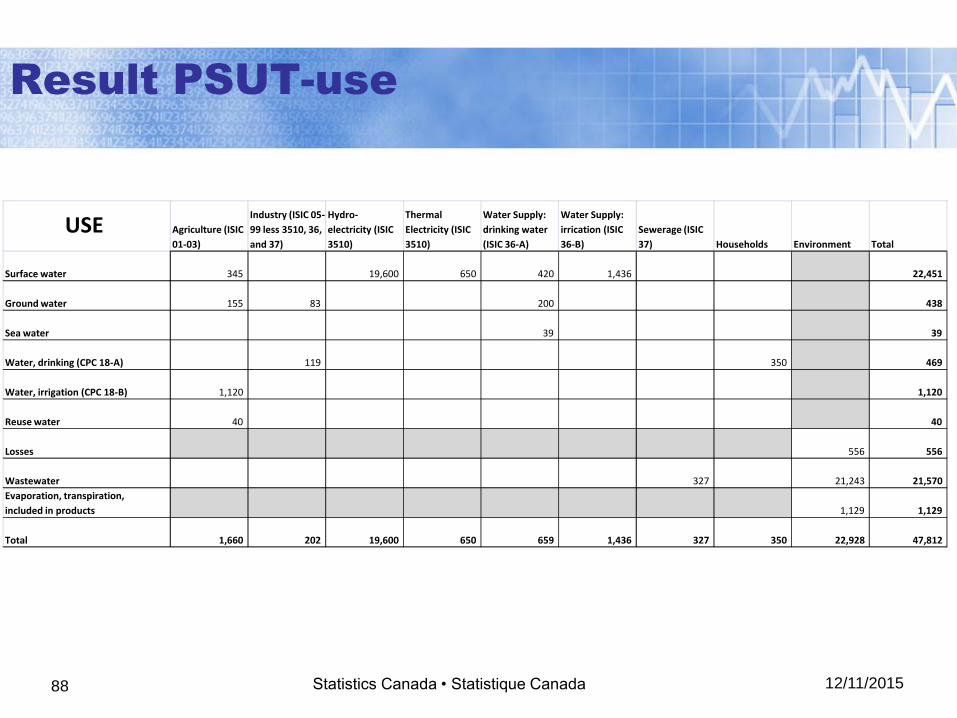
Result PSUT-use
USE Agriculture (ISIC
01-03)
Industry (ISIC 05-
99 less 3510, 36,
and 37)
Hydro-
electricity (ISIC
3510)
Thermal
Electricity (ISIC
3510)
Water Supply:
drinking water
(ISIC 36-A)
Water Supply:
irrication (ISIC
36-B)
Sewerage (ISIC
37) Households Environment Total
Surface water 345 19,600 650 420 1,436 22,451
Ground water 155 83 200 438
Sea water 39 39
Water, drinking (CPC 18-A) 119 350 469
Water, irrigation (CPC 18-B) 1,120 1,120
Reuse water 40 40
Losses 556 556
Wastewater 327 21,243 21,570
Evaporation, transpiration,
included in products 1,129 1,129
Total 1,660 202 19,600 650 659 1,436 327 350 22,928 47,812