Embed Size (px)
Citation preview
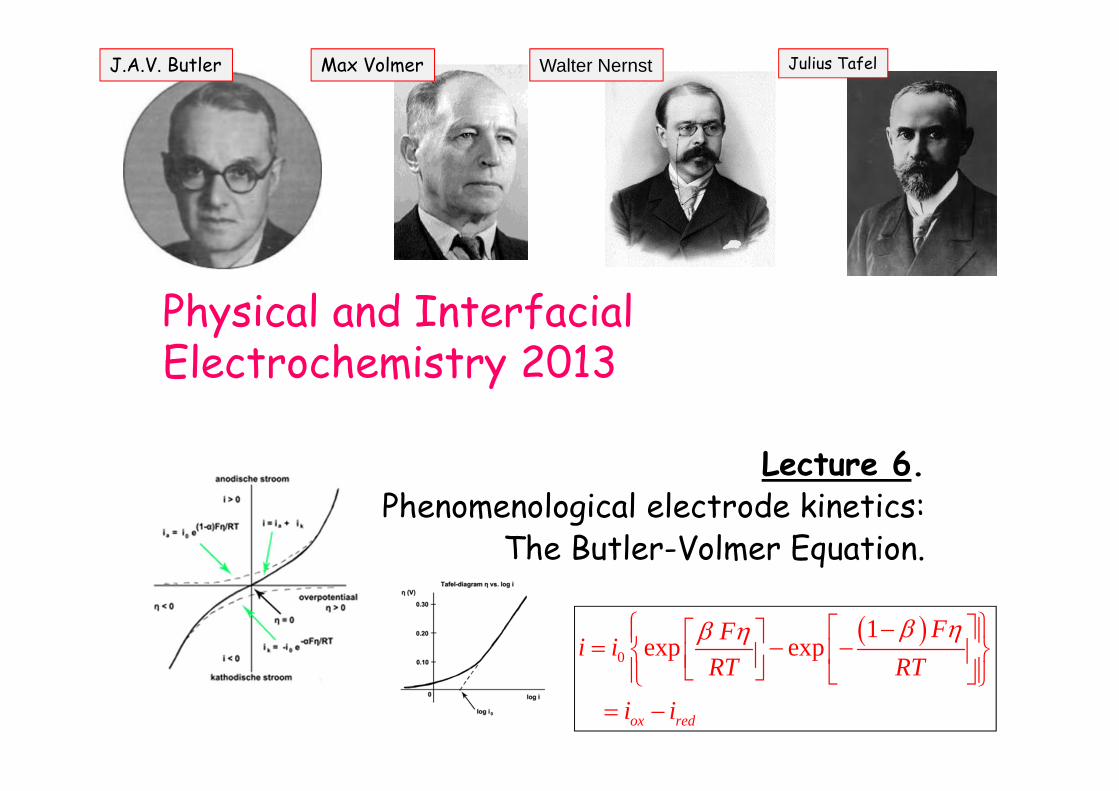
Physical and Interfacial Electrochemistry 2013
Lecture 6.Phenomenological electrode kinetics:
The Butler-Volmer Equation.
0
1exp exp
ox red
FFi iRT RT
i i
J.A.V. Butler Max Volmer Walter Nernst Julius Tafel
Kinetics of interfacial ET.• Estimation of equilibrium
redox potentials provides a quantitative measure for the tendency for a specific redox reaction to occur. Kinetic information is not derived.
• ET reactions at electrode/solution interfaces are activated processes.– ET rate effected by:
• Applied electrode potential• Temperature
– Activation energy barrier height can be effected by applied potential. This is in contrast to ordinary chemical reactions.
• We seek an answer to the following questions:– How can we quantitatively
model the rate of an ET process which occurs at the interface between a metallic electrode and an aqueous solution containing a redox active couple?
– How can kinetic information about ET processes be derived?
• We shall also investigate the influence of material transport, and double layer structure on interfacial ET processes.

Basic concepts of electrode kinetics.
• For an interfacial ET process:– current flow is
proportional to reaction flux (rate).
• Reaction rate is proportional to reactant concentration at interface.
• As in chemical kinetics:– the constant of
proportionality between reaction rate fS (molcm-2s-1) and reactant concentration c (molcm-3) is termed the rate constant k (cms-1).
• All chemical and electrochemical reactions are activated processes.
• An activation energy barrier exists which must be overcome in order that the chemical reaction may proceed.– Energy must be supplied
to surmount the activation energy barrier.
– This energy may be supplied thermally or also (for ET processes at electrodes) via the application of a potential to the metallic electrode.
The electrode potential drives ET processes at interfaces.• Application of a potential to an electrode
generates a large electric field at the electrode/solution interface which reduces the height of the activation energy barrier and thereby increases the rate of the ET reaction.
• Hence the applied potential acts as a driving force for the ET reaction.
• We intuitively expect that the current should increase with increasing driving force. This can be understood using a simple pictorial approach.

ne-
P
Q
Oxidation or de-electronation.P = reductant (electron donor)Q = Product
Electron sink electrode(Anode).
ne-
A
B
Electron source electrode(Cathode).
Reduction or electronation.A = oxidant (electron acceptor)B = Product
Interfacial electron transfer at electrode/solution interfaces:oxidation and reduction processes.
• In electrolysis we use an applied voltageto perform chemistry at a M/S interface.• The applied voltage drives the chemicalreaction which does not occur spontaneously.• The current flowing across the M/Sinterface is a measure of the rate ofthe chemical transformation at the interface.
• The greater the applied voltage, the larger the resulting currentflow, and the greater the rateof the chemical reaction.
• The rate at which charge ismoved across the M/S interface= the rate at which chemistryis accomplished at the M/Sinterface.
nFAfdtdNnFA
dtdqi
Current (A)
Charge(C)
# electrons transferred
FaradayConstant (Cmol-1)
Electrode area (cm2)
Amount ofMaterial (mol)
Reaction flux (rate)mol cm-2s-1
Time (s)
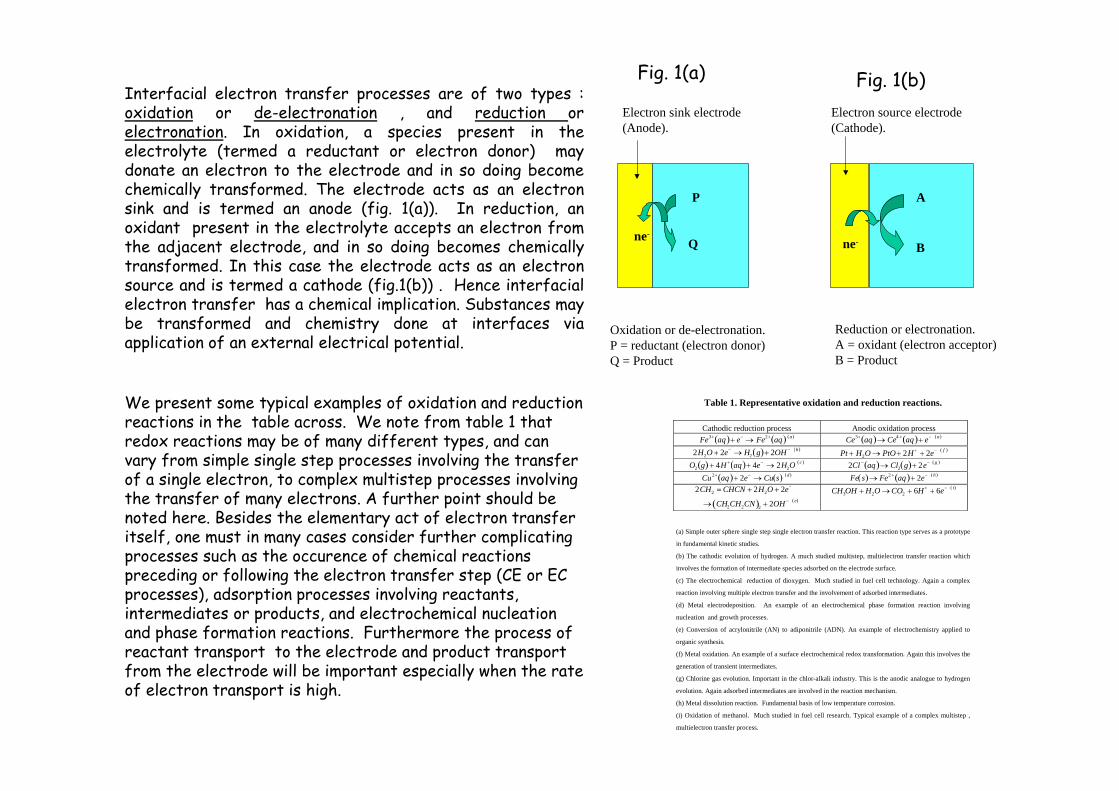
Interfacial electron transfer processes are of two types :oxidation or de-electronation , and reduction orelectronation. In oxidation, a species present in theelectrolyte (termed a reductant or electron donor) maydonate an electron to the electrode and in so doing becomechemically transformed. The electrode acts as an electronsink and is termed an anode (fig. 1(a)). In reduction, anoxidant present in the electrolyte accepts an electron fromthe adjacent electrode, and in so doing becomes chemicallytransformed. In this case the electrode acts as an electronsource and is termed a cathode (fig.1(b)) . Hence interfacialelectron transfer has a chemical implication. Substances maybe transformed and chemistry done at interfaces viaapplication of an external electrical potential.
ne-
P
Q
Oxidation or de-electronation.P = reductant (electron donor)Q = Product
Electron sink electrode(Anode).
ne-
A
B
Electron source electrode(Cathode).
Reduction or electronation.A = oxidant (electron acceptor)B = Product
Fig. 1(a) Fig. 1(b)
We present some typical examples of oxidation and reduction reactions in the table across. We note from table 1 that redox reactions may be of many different types, and can vary from simple single step processes involving the transfer of a single electron, to complex multistep processes involving the transfer of many electrons. A further point should be noted here. Besides the elementary act of electron transfer itself, one must in many cases consider further complicating processes such as the occurence of chemical reactions preceding or following the electron transfer step (CE or EC processes), adsorption processes involving reactants, intermediates or products, and electrochemical nucleation and phase formation reactions. Furthermore the process of reactant transport to the electrode and product transport from the electrode will be important especially when the rate of electron transport is high.
Table 1. Representative oxidation and reduction reactions.
Cathodic reduction process Anodic oxidation process Fe3 aq e Fe2 aq a Ce3 aq Ce4 aq e a
2H2O 2e H2 g 2OH b Pt H2O PtO 2H 2e f O2 g 4H aq 4e 2H2O
c 2Cl aq Cl2 g 2e g Cu 2 aq 2e Cu s d Fe s Fe2 aq 2e h
2CH2 CHCN 2H2O 2e
CH2CH2CN 2 2OH e CH3OH H2OCO2 6H 6e i
(a) Simple outer sphere single step single electron transfer reaction. This reaction type serves as a prototype
in fundamental kinetic studies.
(b) The cathodic evolution of hydrogen. A much studied multistep, multielectron transfer reaction which
involves the formation of intermediate species adsorbed on the electrode surface.
(c) The electrochemical reduction of dioxygen. Much studied in fuel cell technology. Again a complex
reaction involving multiple electron transfer and the involvement of adsorbed intermediates.
(d) Metal electrodeposition. An example of an electrochemical phase formation reaction involving
nucleation and growth processes.
(e) Conversion of acrylonitrile (AN) to adiponitrile (ADN). An example of electrochemistry applied to
organic synthesis.
(f) Metal oxidation. An example of a surface electrochemical redox transformation. Again this involves the
generation of transient intermediates.
(g) Chlorine gas evolution. Important in the chlor-alkali industry. This is the anodic analogue to hydrogen
evolution. Again adsorbed intermediates are involved in the reaction mechanism.
(h) Metal dissolution reaction. Fundamental basis of low temperature corrosion.
(i) Oxidation of methanol. Much studied in fuel cell research. Typical example of a complex multistep ,
multielectron transfer process.
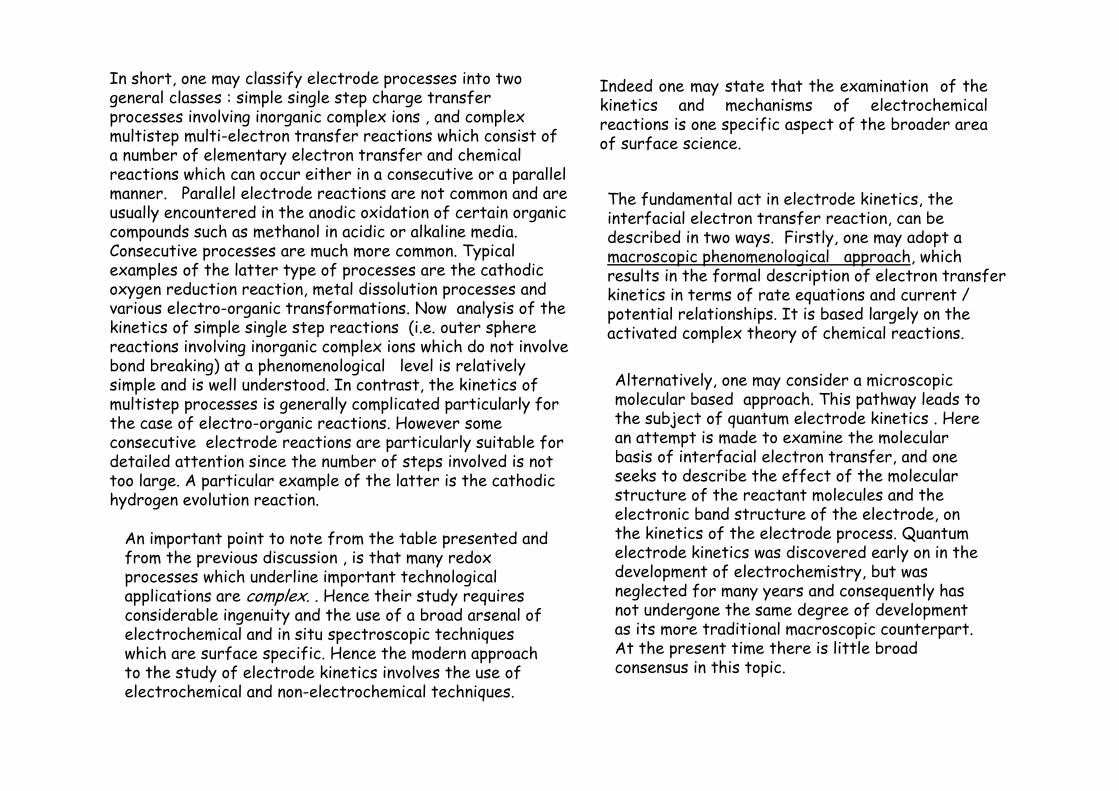
In short, one may classify electrode processes into two general classes : simple single step charge transfer processes involving inorganic complex ions , and complex multistep multi-electron transfer reactions which consist of a number of elementary electron transfer and chemical reactions which can occur either in a consecutive or a parallel manner. Parallel electrode reactions are not common and are usually encountered in the anodic oxidation of certain organic compounds such as methanol in acidic or alkaline media. Consecutive processes are much more common. Typical examples of the latter type of processes are the cathodicoxygen reduction reaction, metal dissolution processes and various electro-organic transformations. Now analysis of the kinetics of simple single step reactions (i.e. outer sphere reactions involving inorganic complex ions which do not involve bond breaking) at a phenomenological level is relatively simple and is well understood. In contrast, the kinetics of multistep processes is generally complicated particularly for the case of electro-organic reactions. However some consecutive electrode reactions are particularly suitable for detailed attention since the number of steps involved is not too large. A particular example of the latter is the cathodichydrogen evolution reaction.
An important point to note from the table presented and from the previous discussion , is that many redoxprocesses which underline important technological applications are complex. . Hence their study requires considerable ingenuity and the use of a broad arsenal of electrochemical and in situ spectroscopic techniques which are surface specific. Hence the modern approach to the study of electrode kinetics involves the use of electrochemical and non-electrochemical techniques.
The fundamental act in electrode kinetics, the interfacial electron transfer reaction, can be described in two ways. Firstly, one may adopt a macroscopic phenomenological approach, which results in the formal description of electron transfer kinetics in terms of rate equations and current / potential relationships. It is based largely on the activated complex theory of chemical reactions.
Alternatively, one may consider a microscopic molecular based approach. This pathway leads to the subject of quantum electrode kinetics . Here an attempt is made to examine the molecular basis of interfacial electron transfer, and one seeks to describe the effect of the molecular structure of the reactant molecules and the electronic band structure of the electrode, on the kinetics of the electrode process. Quantum electrode kinetics was discovered early on in the development of electrochemistry, but was neglected for many years and consequently has not undergone the same degree of development as its more traditional macroscopic counterpart. At the present time there is little broad consensus in this topic.
Indeed one may state that the examination of thekinetics and mechanisms of electrochemicalreactions is one specific aspect of the broader areaof surface science.

In this section we consider , in a very qualitative way, the kinetic description of a simple single step, single electron transfer process. A typical example might be the Fe2+(aq) / Fe3+(aq) redox reaction at a Pt electrode in an aqueous electrolyte solution . The latter type of reaction is termed an outer sphere electron transfer process since no bonds are broken or made during the course of the reaction. Consequently, we neglect complicating factors such as diffusional transport of reactants and products , and adsorption effects. How are the electron transfer kinetics examined experimentally ? It is obvious that one must do the measurement using an electrochemical cell containing at least two electrodes. Indeed it is conventional to use a three electrode arrangement as outlined across. The electrode of interest is termed the working or indicator electrode. The redox chemistry occurs at the interface between the working electrode and the electrolytic solution. A second electrode , termed the counter or auxiliary electrode, is required to complete the circuit . Current is passed in a circuit containing the working and the counter electrodes. Finally , one wishes to determine the potential difference across the working electrode / solution interface. The latter cannot be experimentally determined.
What one can do however, is to measure changes in the potential of the working electrode with respect to a third electrode, the reference electrode, placed in the solution near the working electrode. The latter will have a very high impedance to current flow and so the potential of the reference electrode can be considered to be constant, irrespective of the current passed through the working and counter electrodes. Thus, the measured change in potential between the working and reference electrodes will be equal to the change in potential at the working electrode / solution interface. Hence in a typical experiment a potential waveform is applied to the working electrode , chemistry is done, and the resultant current response is monitored using a suitable output device .
Workingelectrode
Referenceelectrode
Current is passed betweenworking and counterelectrodes. The potentialis measured betweenworking and referenceelectrodes/.
Counter (auxillary)Electrode.
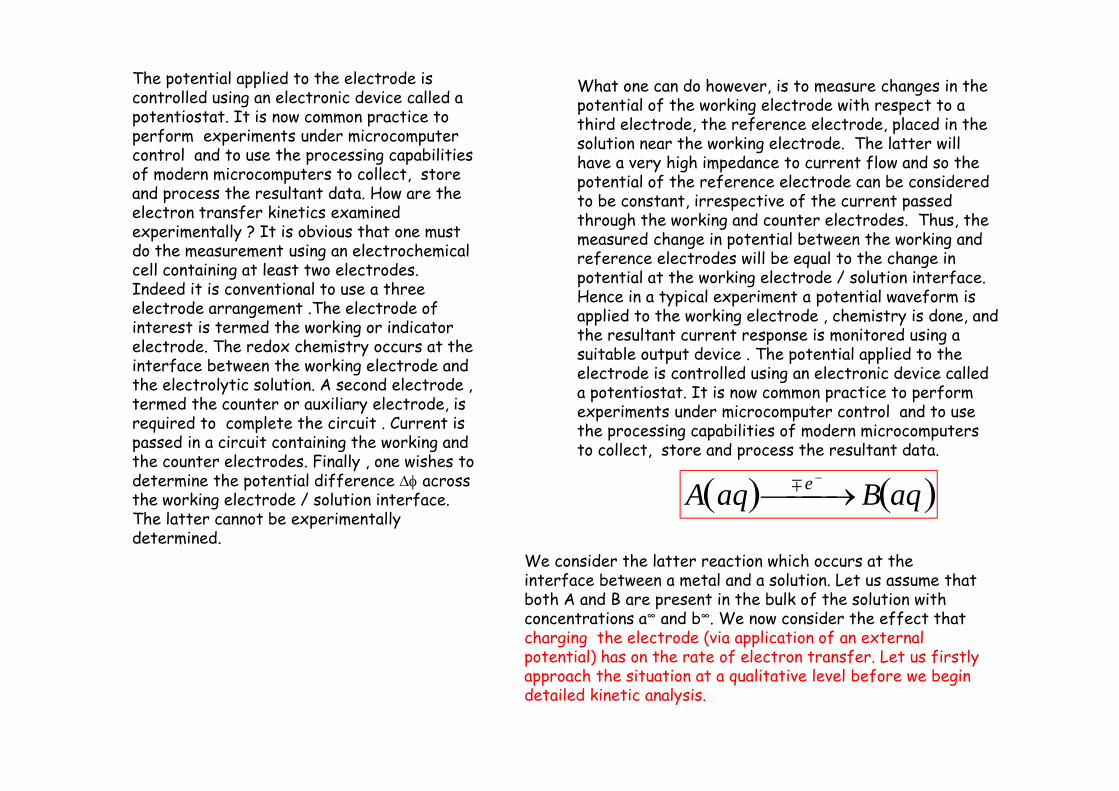
The potential applied to the electrode is controlled using an electronic device called a potentiostat. It is now common practice to perform experiments under microcomputer control and to use the processing capabilities of modern microcomputers to collect, store and process the resultant data. How are the electron transfer kinetics examined experimentally ? It is obvious that one must do the measurement using an electrochemical cell containing at least two electrodes. Indeed it is conventional to use a three electrode arrangement .The electrode of interest is termed the working or indicator electrode. The redox chemistry occurs at the interface between the working electrode and the electrolytic solution. A second electrode , termed the counter or auxiliary electrode, is required to complete the circuit . Current is passed in a circuit containing the working and the counter electrodes. Finally , one wishes to determine the potential difference across the working electrode / solution interface. The latter cannot be experimentally determined.
What one can do however, is to measure changes in the potential of the working electrode with respect to a third electrode, the reference electrode, placed in the solution near the working electrode. The latter will have a very high impedance to current flow and so the potential of the reference electrode can be considered to be constant, irrespective of the current passed through the working and counter electrodes. Thus, the measured change in potential between the working and reference electrodes will be equal to the change in potential at the working electrode / solution interface. Hence in a typical experiment a potential waveform is applied to the working electrode , chemistry is done, and the resultant current response is monitored using a suitable output device . The potential applied to the electrode is controlled using an electronic device called a potentiostat. It is now common practice to perform experiments under microcomputer control and to use the processing capabilities of modern microcomputers to collect, store and process the resultant data.
A aq e
B aq
We consider the latter reaction which occurs at the interface between a metal and a solution. Let us assume that both A and B are present in the bulk of the solution with concentrations a∞ and b∞. We now consider the effect that charging the electrode (via application of an external potential) has on the rate of electron transfer. Let us firstly approach the situation at a qualitative level before we begin detailed kinetic analysis.

-
EF
LUMO
HOMO
LUMO
HOMO
Redox couplein solution
Electronenergy
n e-
Metallic electrode
Energy of electronsin metal increasesupon application of apotential more negativethan the thermodynamicequilibrium value.
A net reduction (cathodic)current flows from metal toLUMO levels of redox activespecies in solution.
Pictorial explanation ofcurrent flow due to reduction.

Metallicelectrode
+
EF
LUMO
HOMO
LUMO
HOMO
Redox couplein solution
Electronenergy
n e-
Energy of electronsin metal decreases uponapplication of a potentialmore positive than thethermodynamic equilibriumvalue.
A net anodic (oxidation)current flows from theHOMO level of the redox species in solution to themetallic electrode.
Pictorial explanation of currentflow due to oxidation.
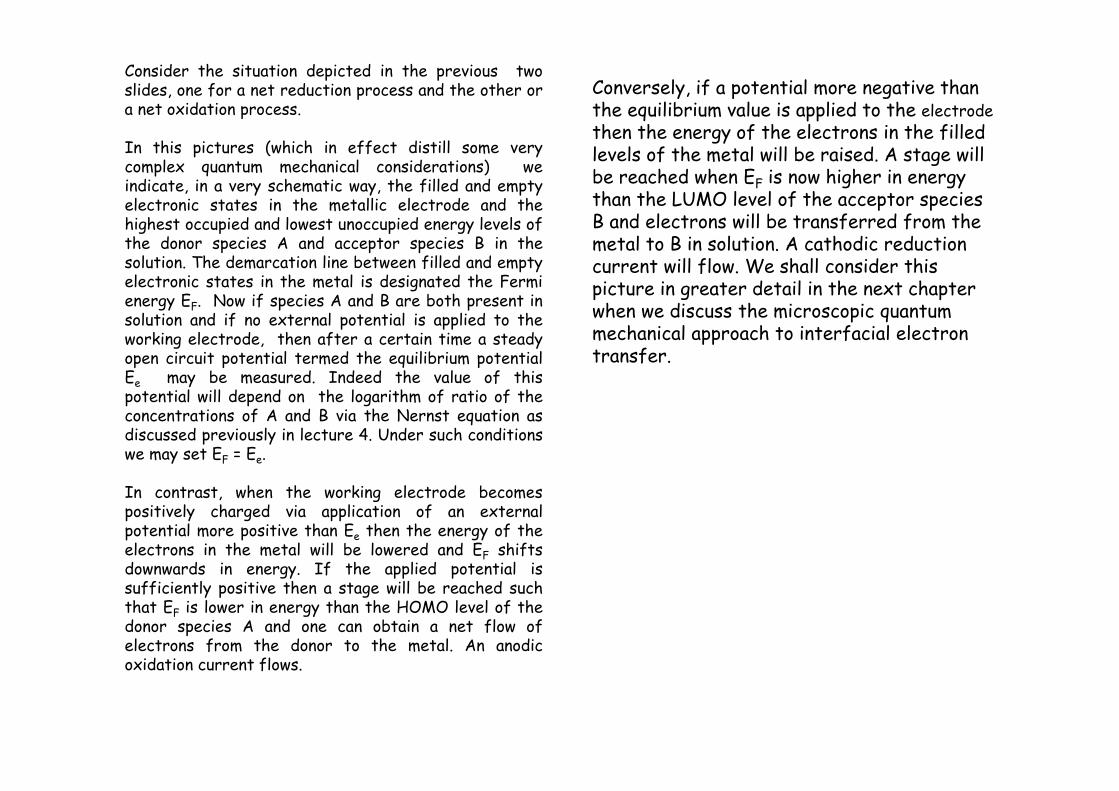
Consider the situation depicted in the previous twoslides, one for a net reduction process and the other ora net oxidation process.
In this pictures (which in effect distill some verycomplex quantum mechanical considerations) weindicate, in a very schematic way, the filled and emptyelectronic states in the metallic electrode and thehighest occupied and lowest unoccupied energy levels ofthe donor species A and acceptor species B in thesolution. The demarcation line between filled and emptyelectronic states in the metal is designated the Fermienergy EF. Now if species A and B are both present insolution and if no external potential is applied to theworking electrode, then after a certain time a steadyopen circuit potential termed the equilibrium potentialEe may be measured. Indeed the value of thispotential will depend on the logarithm of ratio of theconcentrations of A and B via the Nernst equation asdiscussed previously in lecture 4. Under such conditionswe may set EF = Ee.
In contrast, when the working electrode becomespositively charged via application of an externalpotential more positive than Ee then the energy of theelectrons in the metal will be lowered and EF shiftsdownwards in energy. If the applied potential issufficiently positive then a stage will be reached suchthat EF is lower in energy than the HOMO level of thedonor species A and one can obtain a net flow ofelectrons from the donor to the metal. An anodicoxidation current flows.
Conversely, if a potential more negative than the equilibrium value is applied to the electrodethen the energy of the electrons in the filled levels of the metal will be raised. A stage will be reached when EF is now higher in energy than the LUMO level of the acceptor species B and electrons will be transferred from the metal to B in solution. A cathodic reduction current will flow. We shall consider this picture in greater detail in the next chapter when we discuss the microscopic quantum mechanical approach to interfacial electron transfer.

•
A survey of electrochemicalreaction types.
• Electrochemical reactions are usually complex multistep processes involving the transfer of more than one electron.
• In this course we focus on simple single step ET processes involving the transfer of a single electron.
• The kinetics of simple ET processes can be understood using the activated complex theory of chemical kinetics (see SF Kinetics notes).
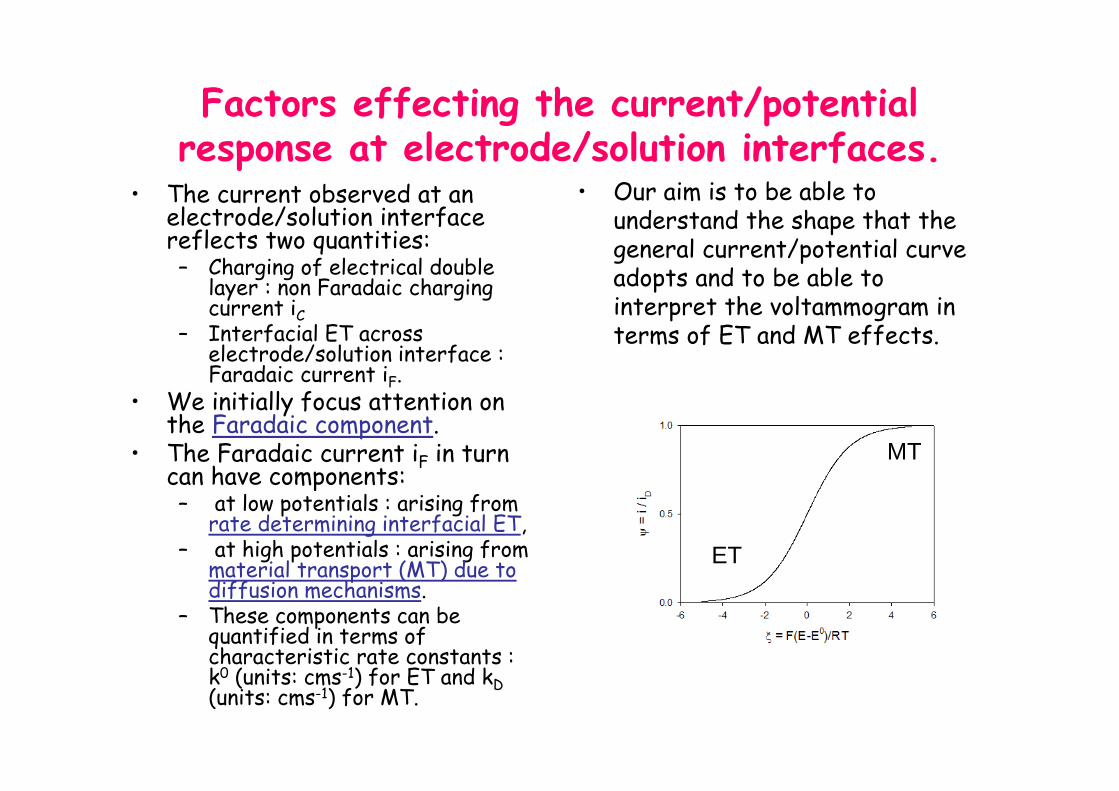
Factors effecting the current/potential response at electrode/solution interfaces.
• The current observed at an electrode/solution interface reflects two quantities:– Charging of electrical double
layer : non Faradaic charging current iC
– Interfacial ET across electrode/solution interface : Faradaic current iF.
• We initially focus attention on the Faradaic component.
• The Faradaic current iF in turn can have components:– at low potentials : arising from
rate determining interfacial ET, – at high potentials : arising from
material transport (MT) due to diffusion mechanisms.
– These components can be quantified in terms of characteristic rate constants : k0 (units: cms-1) for ET and kD(units: cms-1) for MT.
• Our aim is to be able to understand the shape that the general current/potential curve adopts and to be able to interpret the voltammogram in terms of ET and MT effects.
ET
MT

CDL
RCT
i
iC
iF
RS
Electrode
Solution
Simple equivalent circuit representation ofelectrode/solution interface region.
Faradaiccurrent
DL chargingcurrent
FC iii
Resistance ofsolution
Double layer chargingcurrent always presenin addition toFaradaic current inelectrochemicalmeasurements.
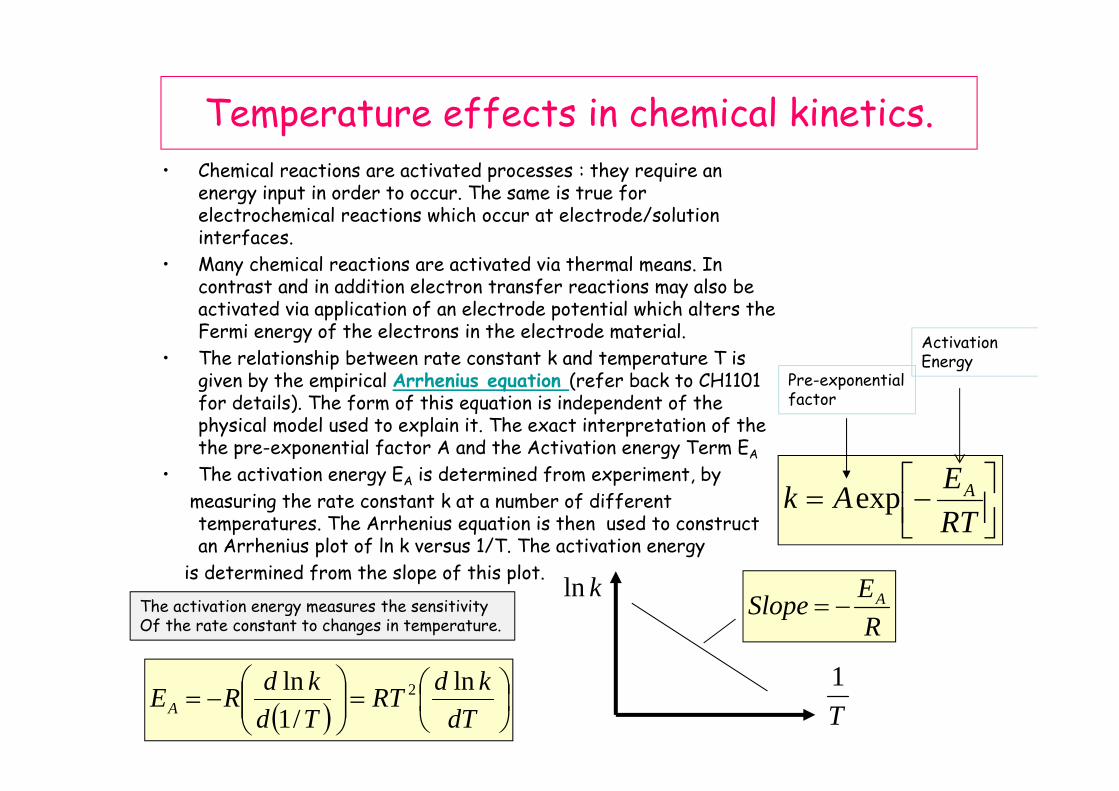
Temperature effects in chemical kinetics.• Chemical reactions are activated processes : they require an
energy input in order to occur. The same is true for electrochemical reactions which occur at electrode/solution interfaces.
• Many chemical reactions are activated via thermal means. In contrast and in addition electron transfer reactions may also be activated via application of an electrode potential which alters the Fermi energy of the electrons in the electrode material.
• The relationship between rate constant k and temperature T is given by the empirical Arrhenius equation (refer back to CH1101 for details). The form of this equation is independent of the physical model used to explain it. The exact interpretation of the the pre-exponential factor A and the Activation energy Term EA
• The activation energy EA is determined from experiment, bymeasuring the rate constant k at a number of different temperatures. The Arrhenius equation is then used to construct an Arrhenius plot of ln k versus 1/T. The activation energy
is determined from the slope of this plot.
RTEAk Aexp
Pre-exponentialfactor
dTkdRT
TdkdREA
ln/1
ln 2
kln
T1
RESlope A
Activation Energy
The activation energy measures the sensitivityOf the rate constant to changes in temperature.
Reaction coordinateEn
ergy
U0
E
E’
R
P
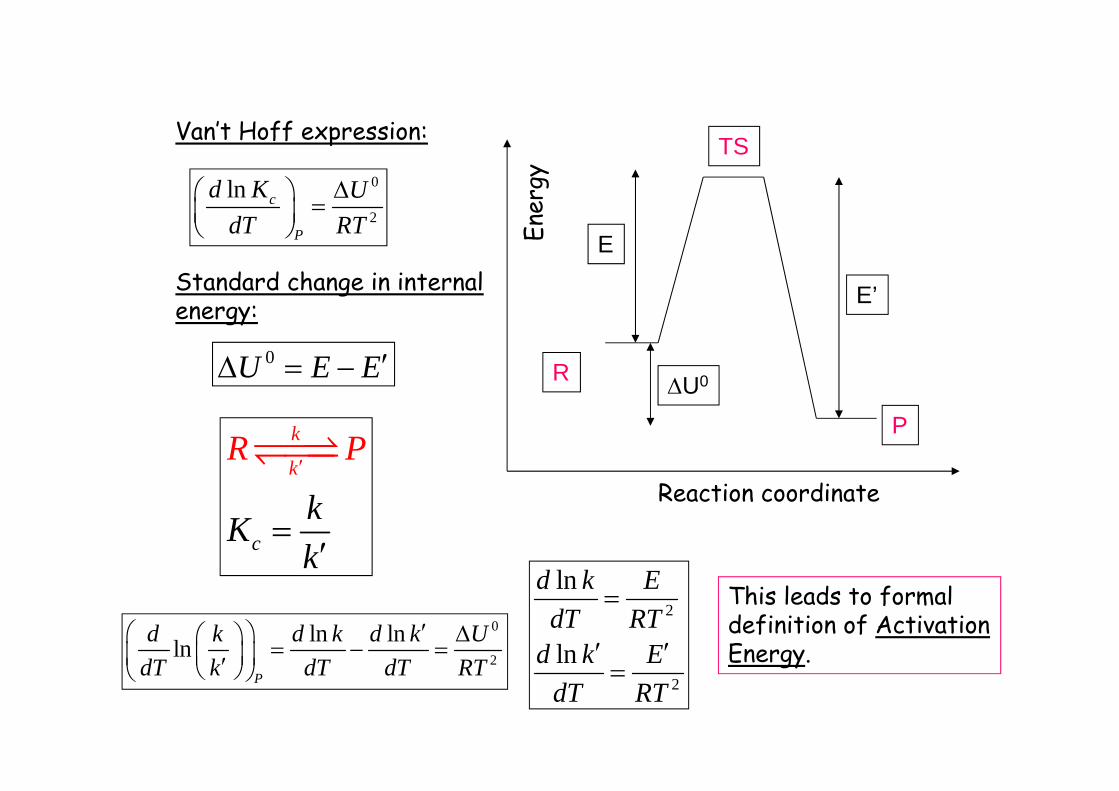
TSVan’t Hoff expression:
0
2
ln c
P
d K UdT RT
Standard change in internalenergy:
0U E E
k
k
c
R
kk
P
K
0
2
ln lnlnP
d k d k d k UdT k dT dT RT
2
2
ln
ln
d k EdT RT
d k EdT RT
This leads to formaldefinition of ActivationEnergy.
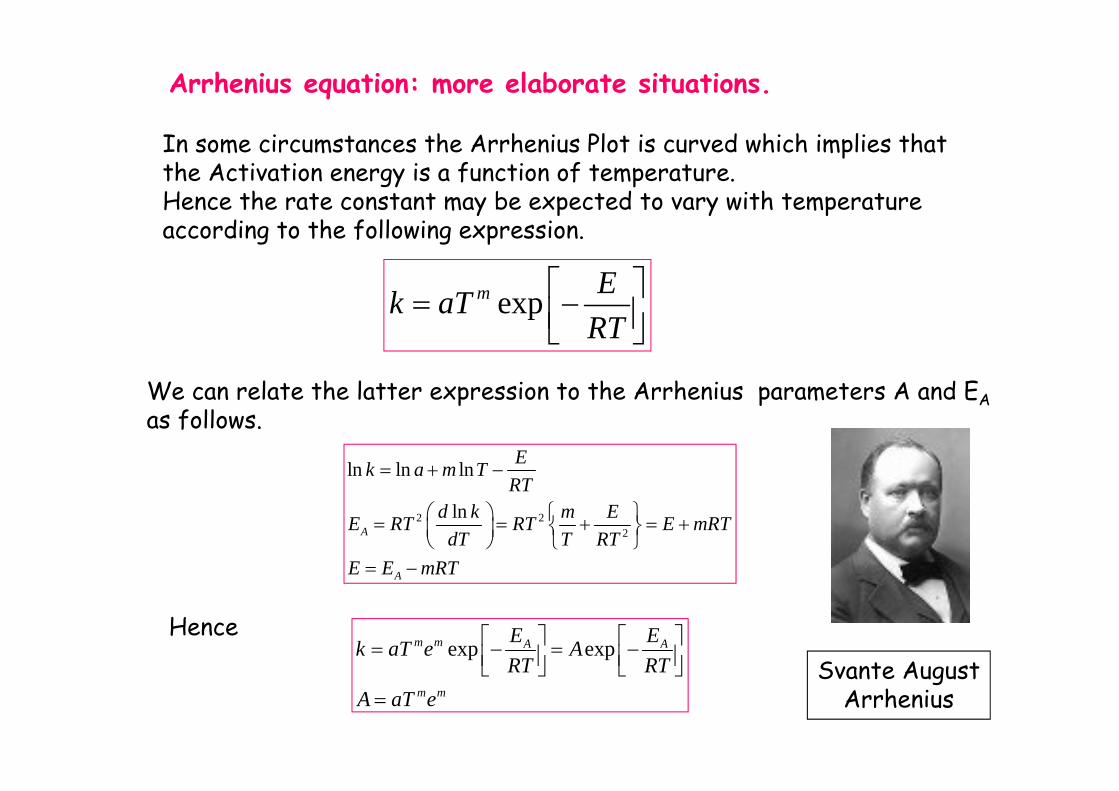
In some circumstances the Arrhenius Plot is curved which implies that the Activation energy is a function of temperature.Hence the rate constant may be expected to vary with temperatureaccording to the following expression.
expm Ek aTRT
2 22
ln ln ln
lnA
A
Ek a m TRT
d k m EE RT RT E mRTdT T RT
E E mRT
We can relate the latter expression to the Arrhenius parameters A and EAas follows.
Henceexp expm m A A
m m
E Ek aT e ART RT
A aT e
Svante AugustArrhenius
Arrhenius equation: more elaborate situations.

A more comprehensivePicture of chemical reactivity is given byTransition State Theory.
Refer to earlier lecturesPresented in thisModule by Prof. Bridge.
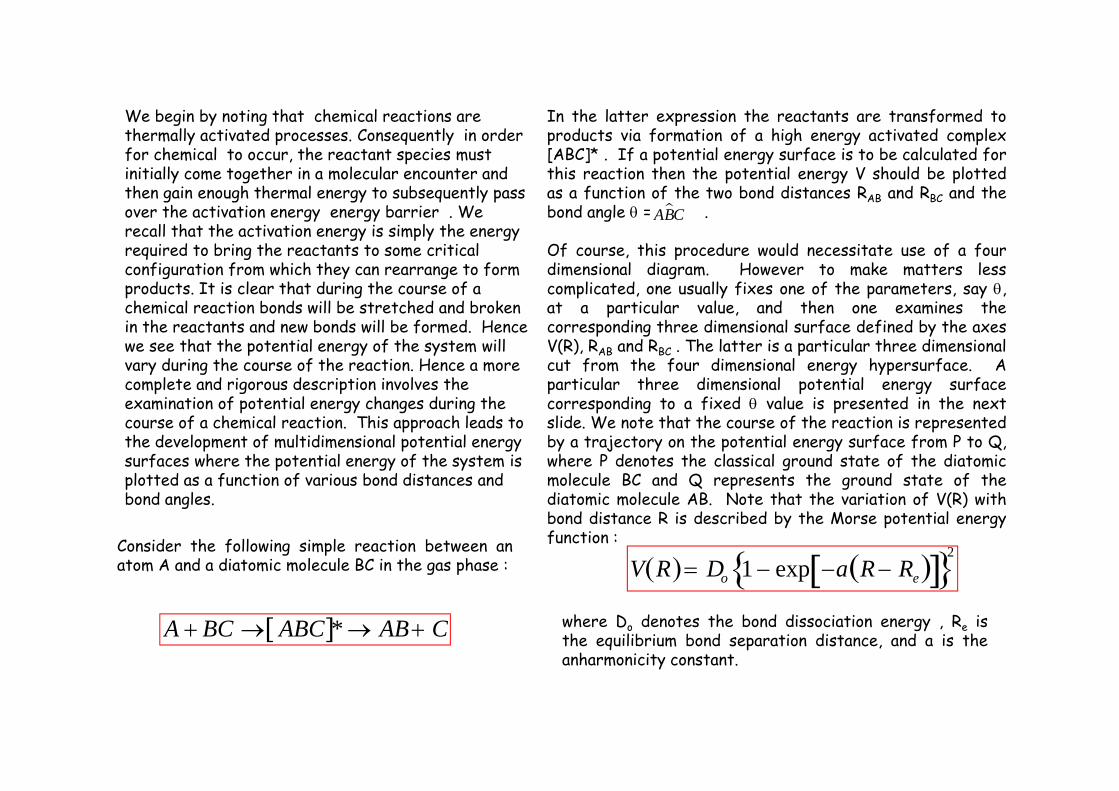
We begin by noting that chemical reactions are thermally activated processes. Consequently in order for chemical to occur, the reactant species must initially come together in a molecular encounter and then gain enough thermal energy to subsequently pass over the activation energy energy barrier . We recall that the activation energy is simply the energy required to bring the reactants to some critical configuration from which they can rearrange to form products. It is clear that during the course of a chemical reaction bonds will be stretched and broken in the reactants and new bonds will be formed. Hence we see that the potential energy of the system will vary during the course of the reaction. Hence a more complete and rigorous description involves the examination of potential energy changes during the course of a chemical reaction. This approach leads to the development of multidimensional potential energy surfaces where the potential energy of the system is plotted as a function of various bond distances and bond angles.
Consider the following simple reaction between anatom A and a diatomic molecule BC in the gas phase :
A BC ABC * AB C
In the latter expression the reactants are transformed toproducts via formation of a high energy activated complex[ABC]* . If a potential energy surface is to be calculated forthis reaction then the potential energy V should be plottedas a function of the two bond distances RAB and RBC and thebond angle = .
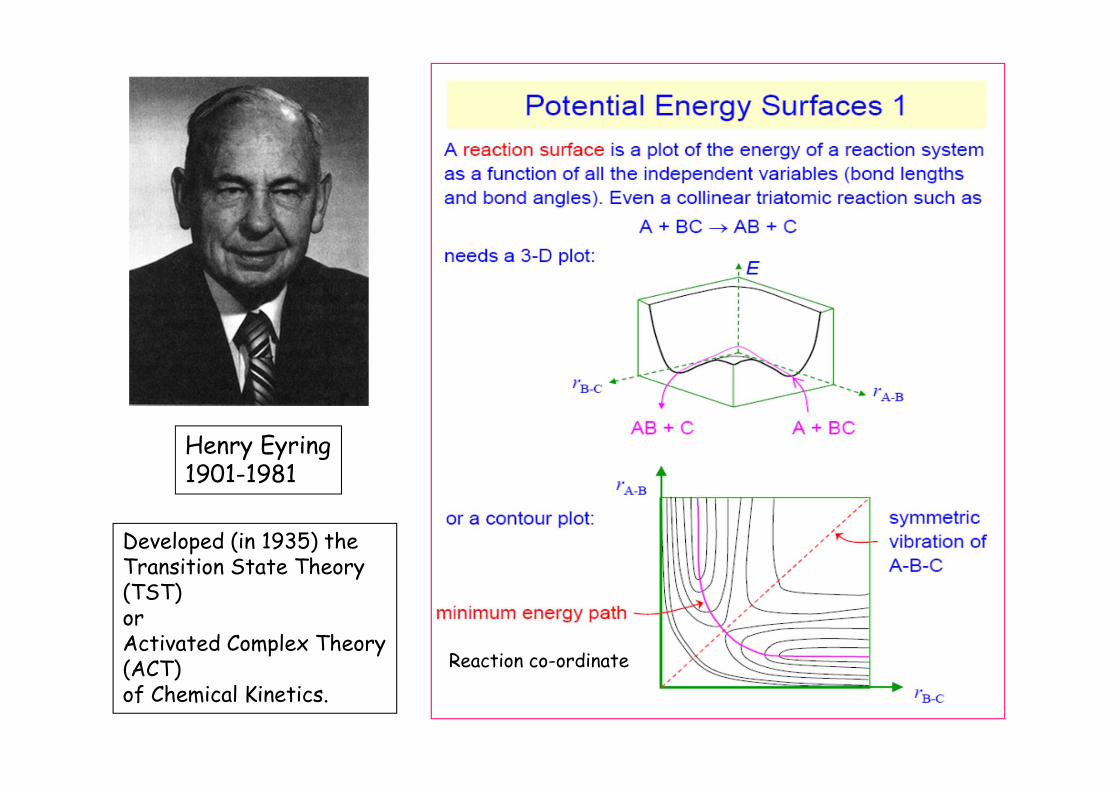
Of course, this procedure would necessitate use of a fourdimensional diagram. However to make matters lesscomplicated, one usually fixes one of the parameters, say ,at a particular value, and then one examines thecorresponding three dimensional surface defined by the axesV(R), RAB and RBC . The latter is a particular three dimensionalcut from the four dimensional energy hypersurface. Aparticular three dimensional potential energy surfacecorresponding to a fixed value is presented in the nextslide. We note that the course of the reaction is representedby a trajectory on the potential energy surface from P to Q,where P denotes the classical ground state of the diatomicmolecule BC and Q represents the ground state of thediatomic molecule AB. Note that the variation of V(R) withbond distance R is described by the Morse potential energyfunction :
ABC
V R Do 1 exp a R Re 2
where Do denotes the bond dissociation energy , Re isthe equilibrium bond separation distance, and a is theanharmonicity constant.

Now the system will tend to describe a trajectory ofrelatively low energy along the potential energy surface.Typically, this pathway involves two valleys meeting at asaddle point or col (labelled †) located in the interior of thepotential energy surface. This pathway is outlined in moredetail in the figure. Hence we see that in order for thesystem to pass from the reactant state to the product state,it will tend to travel along the bottom of the first valley(reactant region), over the col, and down into the secondvalley (product region). This minimum energy trajectory,termed the reaction coordinate , q, is illustrated as a dashedline in the figure presented across. This represents themost probable pathway along the three dimensional energysurface for the P / Q transformation. Finally, a cross sectionthrough this minimum energy path, known as a reactionprofile is illustrated in the fig. outlined below. We payparticular attention to the point at the top of the V(q)profile. This point corresponds to the saddle point on thepotential energy surface, and corresponds not only to aposition of maximum energy with respect to the reaction co-ordinate, but also defines a position of minimum energy withrespect to trajectories at right angles with respect to thereaction coordinate.
Transition state
Ea
Ener
gyReaction coordinate
Activated complex
Hence the activated complex or transition state theory focuses attention on the chemical species at the saddle point, i.e., at the point where the reactants are just about to transform into products. At this point one has the activated complex which is that special configuration of atoms of a system in transit between reactants and products.
Reaction co-ordinate
Henry Eyring1901-1981
Developed (in 1935) theTransition State Theory(TST)orActivated Complex Theory(ACT)of Chemical Kinetics.

Our presentation to date has been couched in qualitative terms. We can of course get more quantitative but this has already been covered adequately earlier on in the module by Prof. Bridge. Now we have stated that chemical activation occurs via collisions between molecules and that reaction involves formation of a discrete activated complex of transient existence. The latter species represents a configuration in which the reactant molecules have been brought to a degree of closeness and distortion, such that a small perturbation due to a molecular vibration in an appropriate direction will transform the complex to products. The overall rate of reaction is then equal to the rate of passage of the activated complex through the transition state.The Activated Complex Theory has been discussed earlier on but we will deal with a special case of a unimolecular reaction at an electrode surface. Since the reaction is heterogeneous we must include a characteristic reaction layer thickness which we label (the length of which is of the order of a molecular diameter).Hence for an interfacial electron transferreaction we have the following.
k
kBTh
exp G 0
RT
Where denotes the electrochemical Gibbs energy ofactivation. Note that the term has got units of s-1
and is expressed in cm.Hence k ' has got units of cm s-1 as it should.
0G
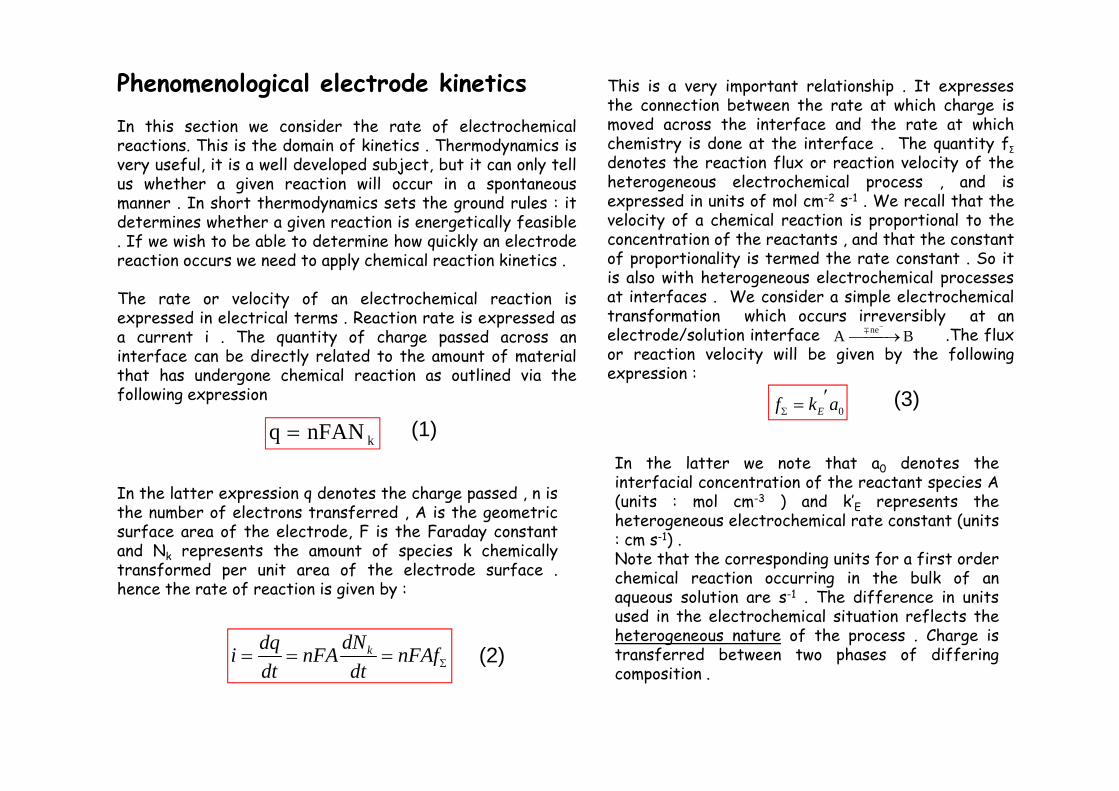
Phenomenological electrode kineticsIn this section we consider the rate of electrochemicalreactions. This is the domain of kinetics . Thermodynamics isvery useful, it is a well developed subject, but it can only tellus whether a given reaction will occur in a spontaneousmanner . In short thermodynamics sets the ground rules : itdetermines whether a given reaction is energetically feasible. If we wish to be able to determine how quickly an electrodereaction occurs we need to apply chemical reaction kinetics .
The rate or velocity of an electrochemical reaction isexpressed in electrical terms . Reaction rate is expressed asa current i . The quantity of charge passed across aninterface can be directly related to the amount of materialthat has undergone chemical reaction as outlined via thefollowing expression
q nFAN k
In the latter expression q denotes the charge passed , n isthe number of electrons transferred , A is the geometricsurface area of the electrode, F is the Faraday constantand Nk represents the amount of species k chemicallytransformed per unit area of the electrode surface .hence the rate of reaction is given by :
kdNdqi nFA nFAfdt dt
This is a very important relationship . It expressesthe connection between the rate at which charge ismoved across the interface and the rate at whichchemistry is done at the interface . The quantity fƩdenotes the reaction flux or reaction velocity of theheterogeneous electrochemical process , and isexpressed in units of mol cm-2 s-1 . We recall that thevelocity of a chemical reaction is proportional to theconcentration of the reactants , and that the constantof proportionality is termed the rate constant . So itis also with heterogeneous electrochemical processesat interfaces . We consider a simple electrochemicaltransformation which occurs irreversibly at anelectrode/solution interface .The fluxor reaction velocity will be given by the followingexpression :
0Ef k a
In the latter we note that a0 denotes theinterfacial concentration of the reactant species A(units : mol cm-3 ) and k’E represents theheterogeneous electrochemical rate constant (units: cm s-1) .Note that the corresponding units for a first orderchemical reaction occurring in the bulk of anaqueous solution are s-1 . The difference in unitsused in the electrochemical situation reflects theheterogeneous nature of the process . Charge istransferred between two phases of differingcomposition .
A Bne
(1)
(2)
(3)
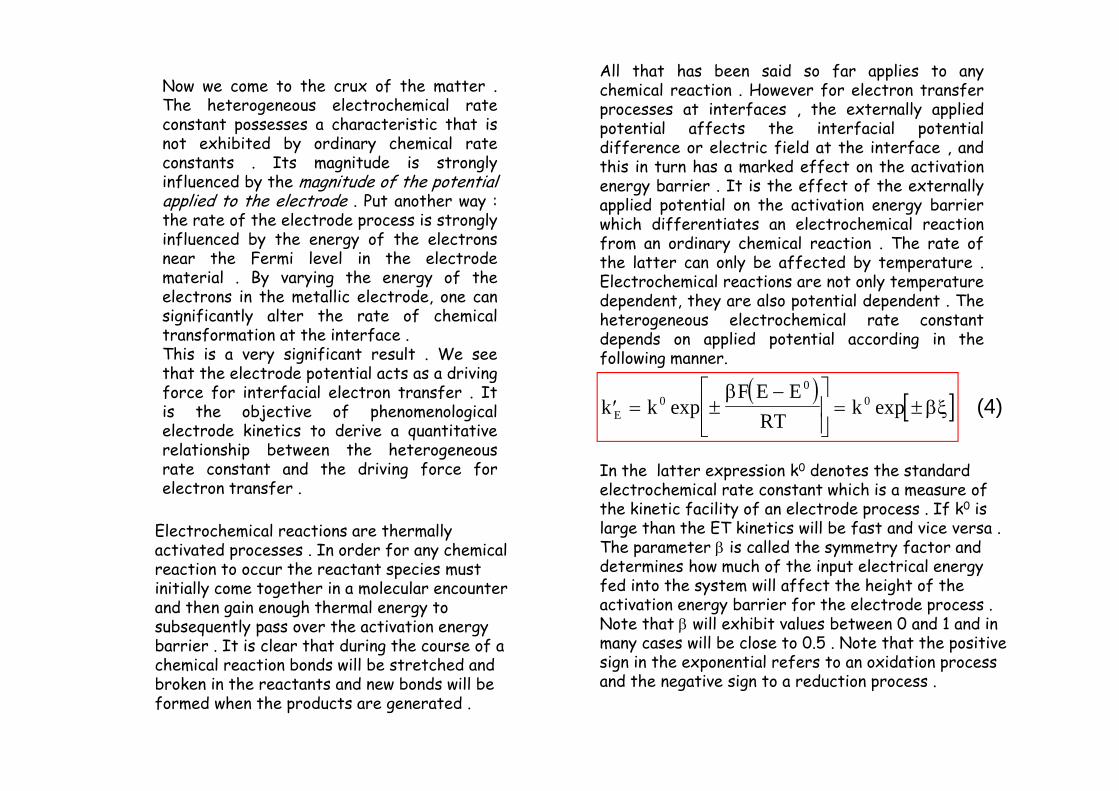
Now we come to the crux of the matter .The heterogeneous electrochemical rateconstant possesses a characteristic that isnot exhibited by ordinary chemical rateconstants . Its magnitude is stronglyinfluenced by the magnitude of the potentialapplied to the electrode . Put another way :the rate of the electrode process is stronglyinfluenced by the energy of the electronsnear the Fermi level in the electrodematerial . By varying the energy of theelectrons in the metallic electrode, one cansignificantly alter the rate of chemicaltransformation at the interface .This is a very significant result . We seethat the electrode potential acts as a drivingforce for interfacial electron transfer . Itis the objective of phenomenologicalelectrode kinetics to derive a quantitativerelationship between the heterogeneousrate constant and the driving force forelectron transfer .
All that has been said so far applies to anychemical reaction . However for electron transferprocesses at interfaces , the externally appliedpotential affects the interfacial potentialdifference or electric field at the interface , andthis in turn has a marked effect on the activationenergy barrier . It is the effect of the externallyapplied potential on the activation energy barrierwhich differentiates an electrochemical reactionfrom an ordinary chemical reaction . The rate ofthe latter can only be affected by temperature .Electrochemical reactions are not only temperaturedependent, they are also potential dependent . Theheterogeneous electrochemical rate constantdepends on applied potential according in thefollowing manner.
Electrochemical reactions are thermally activated processes . In order for any chemical reaction to occur the reactant species must initially come together in a molecular encounter and then gain enough thermal energy to subsequently pass over the activation energy barrier . It is clear that during the course of a chemical reaction bonds will be stretched and broken in the reactants and new bonds will be formed when the products are generated .
k k
F E ERT
kE0
00exp exp
In the latter expression k0 denotes the standard electrochemical rate constant which is a measure of the kinetic facility of an electrode process . If k0 is large than the ET kinetics will be fast and vice versa . The parameter is called the symmetry factor and determines how much of the input electrical energy fed into the system will affect the height of the activation energy barrier for the electrode process . Note that will exhibit values between 0 and 1 and in many cases will be close to 0.5 . Note that the positive sign in the exponential refers to an oxidation process and the negative sign to a reduction process .
(4)
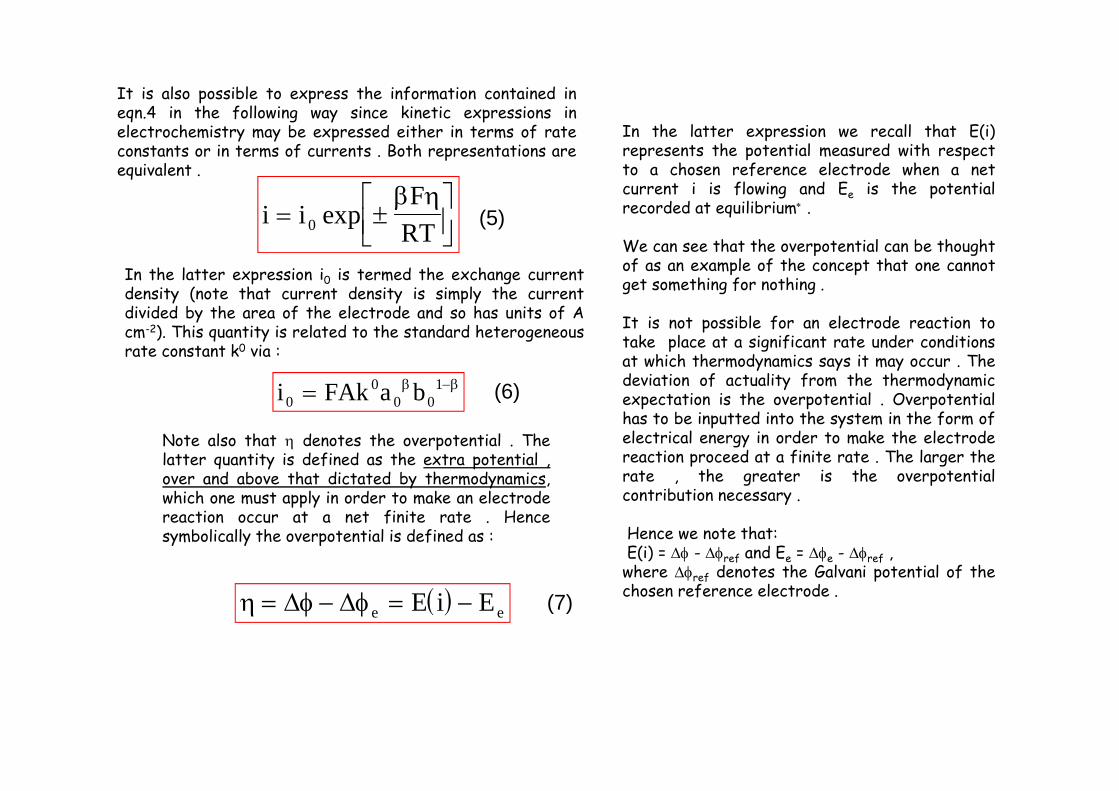
It is also possible to express the information contained ineqn.4 in the following way since kinetic expressions inelectrochemistry may be expressed either in terms of rateconstants or in terms of currents . Both representations areequivalent .
i iF
RT
0 exp
In the latter expression i0 is termed the exchange currentdensity (note that current density is simply the currentdivided by the area of the electrode and so has units of Acm-2). This quantity is related to the standard heterogeneousrate constant k0 via :
i FAk a b00
0 01
Note also that denotes the overpotential . Thelatter quantity is defined as the extra potential ,over and above that dictated by thermodynamics,which one must apply in order to make an electrodereaction occur at a net finite rate . Hencesymbolically the overpotential is defined as :
e eE i E
(5)
(6)
(7)
In the latter expression we recall that E(i)represents the potential measured with respectto a chosen reference electrode when a netcurrent i is flowing and Ee is the potentialrecorded at equilibrium .
We can see that the overpotential can be thoughtof as an example of the concept that one cannotget something for nothing .
It is not possible for an electrode reaction totake place at a significant rate under conditionsat which thermodynamics says it may occur . Thedeviation of actuality from the thermodynamicexpectation is the overpotential . Overpotentialhas to be inputted into the system in the form ofelectrical energy in order to make the electrodereaction proceed at a finite rate . The larger therate , the greater is the overpotentialcontribution necessary .
Hence we note that:E(i) = - ref and Ee = e - ref ,
where ref denotes the Galvani potential of thechosen reference electrode .

Let us now assume that the interfacial ETreaction is reversible . Hence we can write :
A Bk'E
k'-E
where we assume that the forward process is a de-electronation oxidation process and the reversereaction is an electronation reduction process .Both processes involve the transfer of a singleelectron . The net flux is given by :
0 0E Ef k a k b
and the heterogeneous electrochemical rateconstants are given by :
k k
k kE
E
0
0 1
exp
exp
In the latter expressions we introduce thenormalised potential as :
F E ERT
0
0
Alternatively we can state
i i
FRT
FRT
0
1exp exp
This is the Butler-Volmer equation which is thefundamental equation of electrochemical ET kinetics .
We recall that electrochemical equilibrium implied, on a microscopic level, that the electronation and de-electronation fluxes were in balance . No net currents passed across the electrode/electrolyte interface . Now if a net current is passed, this balanced situation is perturbed , a net current will flow in one specific direction . One has a departure from equilibrium . The greater the departure from equilibrium , the larger will be the observed net reaction rate and the larger will be the overpotential . Positive overpotentialscorrespond to oxidation processes , negative overpotentials to reduction processes . Zero overpotential corresponds to equilibrium . This can be summarised as follows.
Net oxidation : >Net reduction : <Equilibrium : =
e
e
e
000

Transport and kinetics at electrode/solution interface
• We consider two fundamental processes when considering dynamic events at electrode/solution interfaces:– Reactant /product transport
to/from electrode surface– Electron transfer (ET)
kinetics at electrode surface.
• We first consider the kinetics of interfacial ET from a classical, macroscopic and phenomenological (non quantum) viewpoint.
• This approach is based on classical Transition State Theory, and results in the Butler-Volmer Equation.
DMT
ETK

Reactant state Product
state
Transition stateActivated complex
*0G
Reaction coordinate
Ener
gy• In electrochemistry the rateconstant k varies withapplied potential E becausethe Gibbs energy of activationG* varies with applied potential.
nFAfdtdNnFA
dtdqi
0' ckf ETReactionFluxmol cm-2 s-1 Interfacial
reactantconcentrationmol cm-3
HeterogeneousET rate constantcm s-1
= 0
finite*G F
Total addedElectrical energy
F
Amount ofBarrier lowering
FGG ** 0
overpotentialSymmetryfactor
Application of a finite overpotential lowers the activation energy barrierby a fixed fraction .
NEE
ThermodynamicNernst potential
Appliedpotential
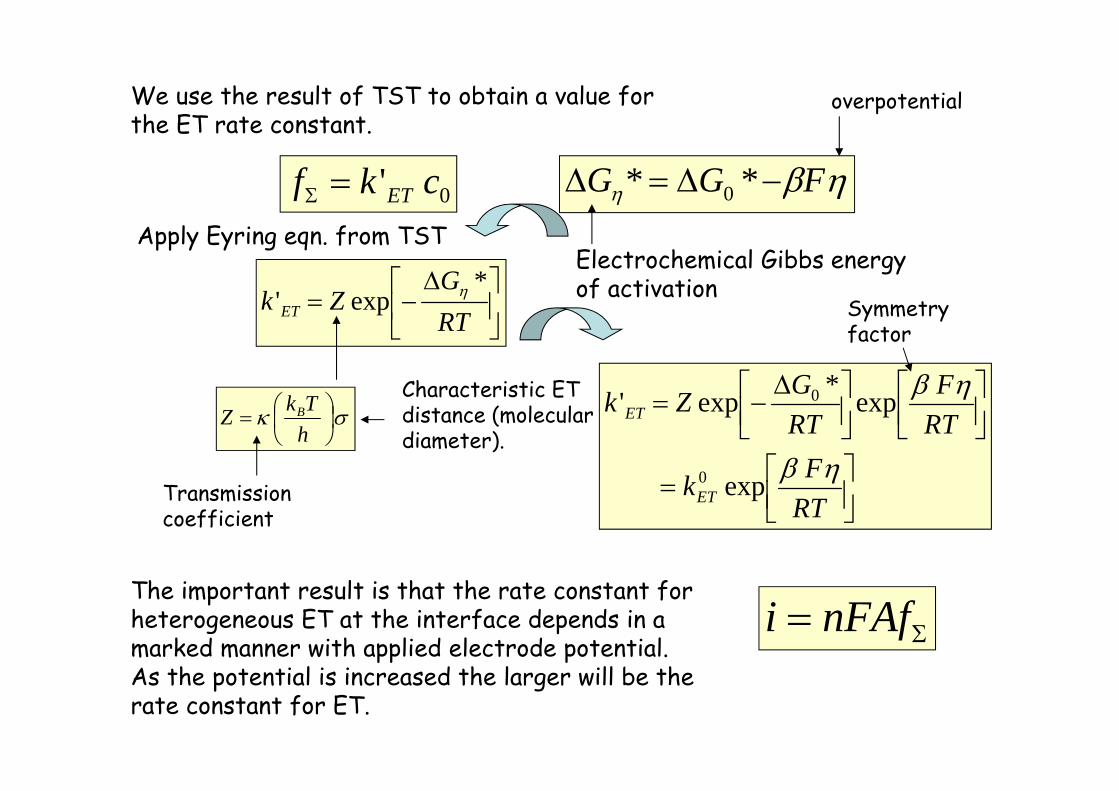
We use the result of TST to obtain a value forthe ET rate constant.
0' ckf ET
RTG
Zk ET
*exp'
hTkZ B
Transmissioncoefficient
Characteristic ETdistance (moleculardiameter).
FGG ** 0
Electrochemical Gibbs energyof activation
RTFk
RTF
RTGZk
ET
ET
exp
exp*exp'
0
0
The important result is that the rate constant forheterogeneous ET at the interface depends in amarked manner with applied electrode potential.As the potential is increased the larger will be therate constant for ET.
overpotential
Symmetryfactor
nFAfi
Apply Eyring eqn. from TST
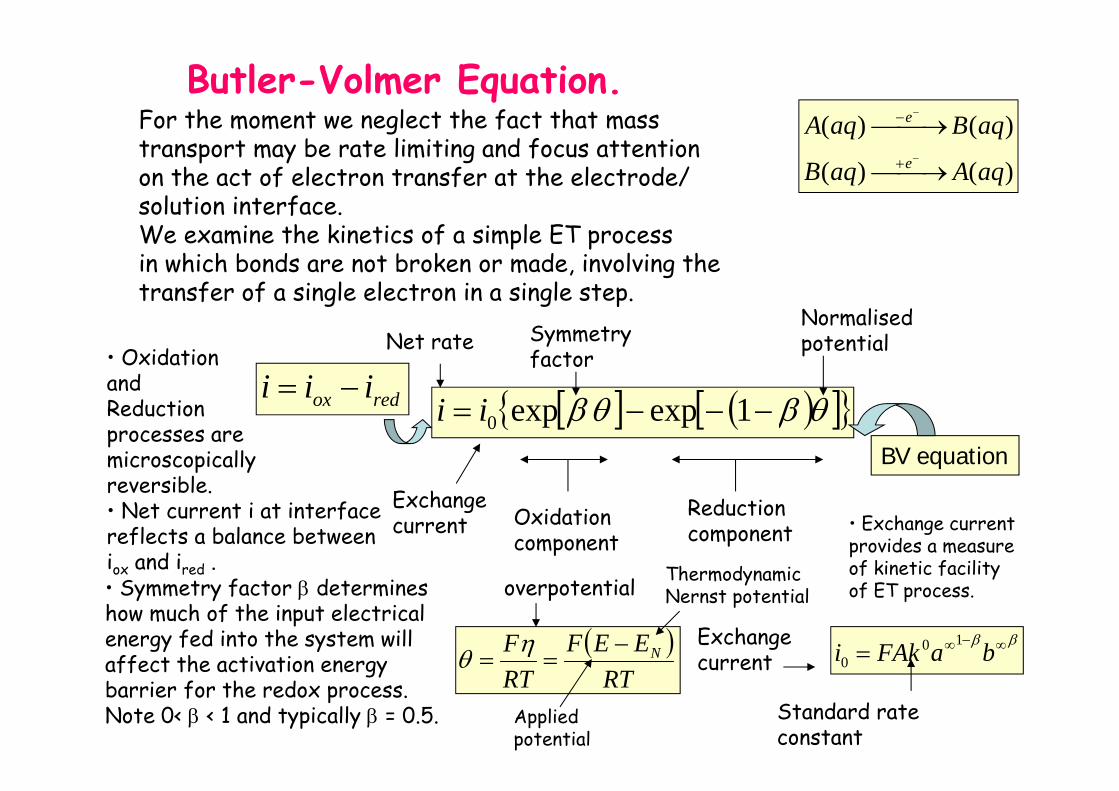
Butler-Volmer Equation.For the moment we neglect the fact that masstransport may be rate limiting and focus attentionon the act of electron transfer at the electrode/solution interface.We examine the kinetics of a simple ET processin which bonds are not broken or made, involving the transfer of a single electron in a single step.
)()(
)()(
aqAaqB
aqBaqAe
e
1expexp0ii
Oxidationcomponent
Reductioncomponent
Net rate
Exchangecurrent
Symmetryfactor
Normalisedpotential• Oxidation
andReductionprocesses aremicroscopicallyreversible.• Net current i at interfacereflects a balance betweeniox and ired .
BV equation
RT
EEFRTF N
overpotential ThermodynamicNernst potential
baFAki 100
Standard rateconstant
Exchangecurrent
Appliedpotential
• Exchange currentprovides a measureof kinetic facilityof ET process.
redox iii
• Symmetry factor determineshow much of the input electricalenergy fed into the system willaffect the activation energybarrier for the redox process.Note 0< < 1 and typically = 0.5.
F/RT
-6 -4 -2 0 2 4 6
=
i/i 0
-15
-10
-5
0
5
10
15
1expexp0ii
exp0iii ox
1exp0iii red
2sinh2
2/1
0
ii
Tafel Region
Linear Ohmicregion
Tafel Region
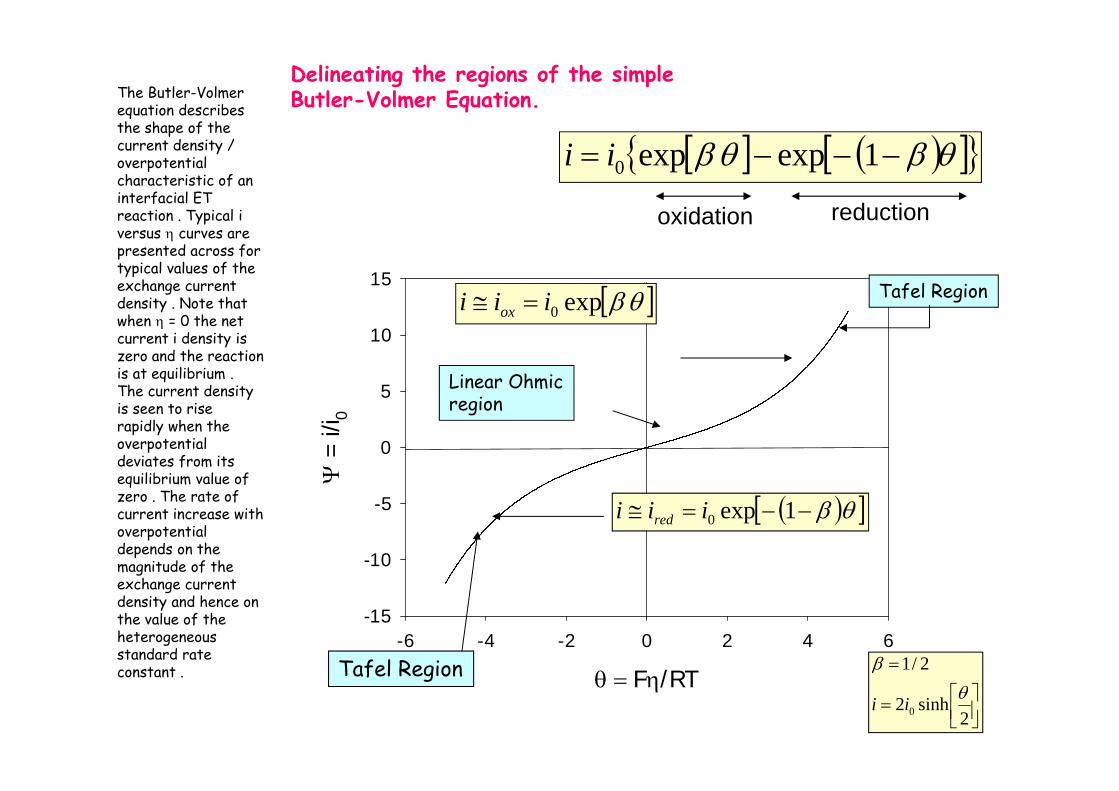
Delineating the regions of the simple Butler-Volmer Equation.
oxidation reduction
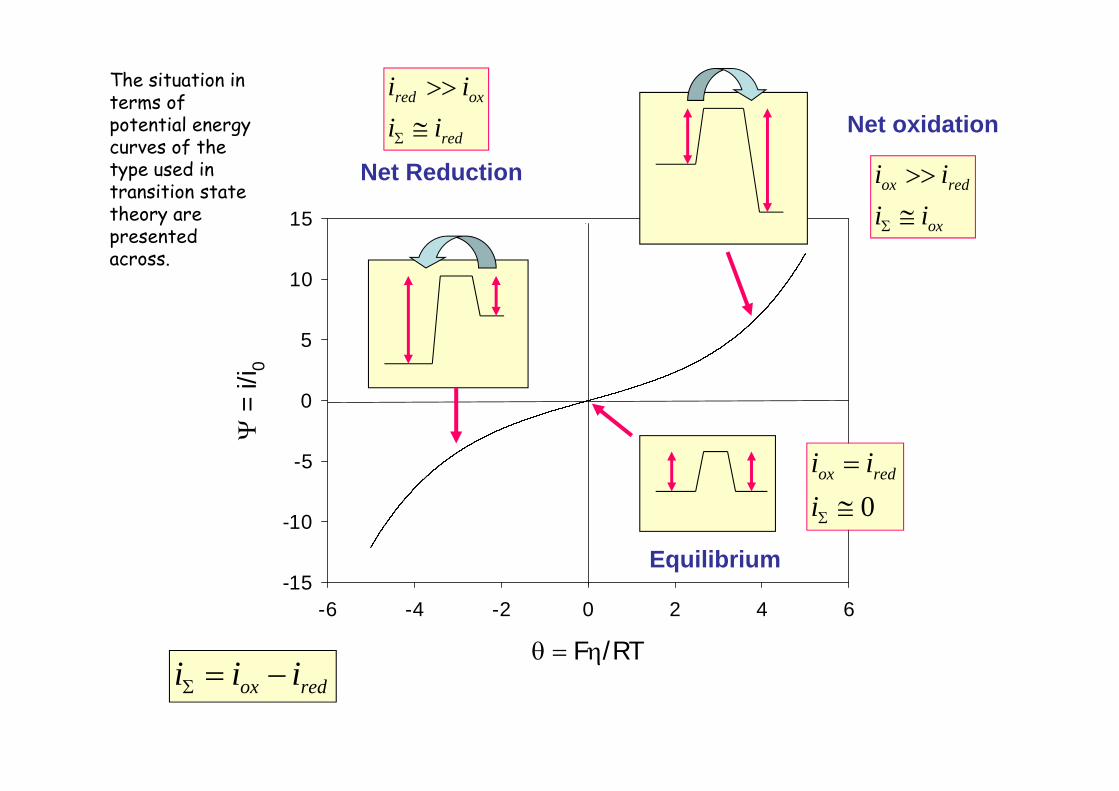
The Butler-Volmerequation describes the shape of the current density / overpotentialcharacteristic of an interfacial ET reaction . Typical iversus curves are presented across for typical values of the exchange current density . Note that when = 0 the net current i density is zero and the reaction is at equilibrium . The current density is seen to rise rapidly when the overpotentialdeviates from its equilibrium value of zero . The rate of current increase with overpotentialdepends on the magnitude of the exchange current density and hence on the value of the heterogeneous standard rate constant .
F/RT
-6 -4 -2 0 2 4 6
=
i/i 0
-15
-10
-5
0
5
10
15
redox iii
Net oxidation
Net Reduction
Equilibrium
ox
redox
iiii
red
oxred
iiii
0
iii redox
The situation in terms of potential energy curves of the type used in transition state theory are presented across.

F/RT
-6 -4 -2 0 2 4 6
=
i/i 0
-100
-80
-60
-40
-20
0
20
40
60
80
100
9.0
7.0
5.0
1.0
3.0 When differs from0.5 the i vs curvebecomes asymmetrical.
The shape of the current/potential curvedepends on the numerical value of the symmetry factor.
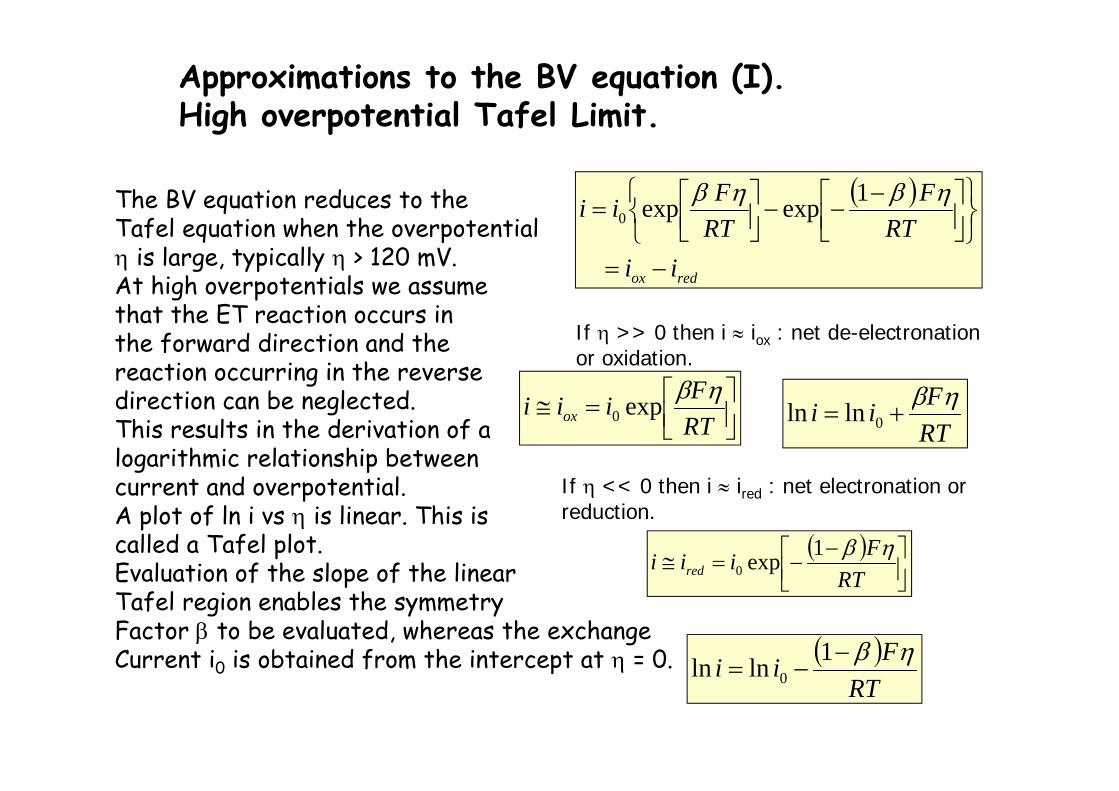
Approximations to the BV equation (I).High overpotential Tafel Limit.
redox iiRT
FRTFii
1expexp0
If >> 0 then i iox : net de-electronationor oxidation.
RTFiii oxexp0
RTFii
0lnln
If << 0 then i ired : net electronation or reduction.
RTFiii red1exp0
RT
Fii
1lnln 0
The BV equation reduces to the Tafel equation when the overpotential is large, typically > 120 mV.At high overpotentials we assumethat the ET reaction occurs inthe forward direction and thereaction occurring in the reversedirection can be neglected.This results in the derivation of alogarithmic relationship betweencurrent and overpotential.A plot of ln i vs is linear. This iscalled a Tafel plot.Evaluation of the slope of the linearTafel region enables the symmetryFactor to be evaluated, whereas the exchangeCurrent i0 is obtained from the intercept at = 0.

Tafel Plot Analysis
= F/RT
-8 -6 -4 -2 0 2 4 6 8
log
(i/i 0)
=log
0.001
0.01
0.1
1
10
100
Linear TafelRegion
Linear TafelRegion
Reduction
Oxidation
Tafel approximationnot valid at lowoverpotentialExchange
Current evaluatedAt = 0
ilog
FRT
iddb
FRT
iddb
C
A
1303.2
log
303.2log

Approximations to the BV equation (II).The low overpotential linear limit.
redox iiRT
FRTFii
1expexp0
Taylor expansion at small x.
!21exp
!21exp
2
2
xxx
xxx
RTF
RTF
RTF
RTF
RTF
RTF
1111exp
1exp
RTFii
RTF
RTF
RTFii
0
0 11
We note that the logarithmicTafel behaviour breaks down as 0.Tafel behaviour is characteristicof totally irreversible (hard driven)ET kinetics and will only be validif the driving force for theelectrode process is very largewhich will be the case at highoverpotentials.In the limit of low overpotentials( < 10 mV) the exponential termsin the BV equation may be simplifiedvia use of a Taylor expansion to producea linear relationship between currentand overpotential (Ohm’s Law).
Linearapproximation
= F/RT
-2 -1 0 1 2
=
i/i 0
-2
-1
0
1
2
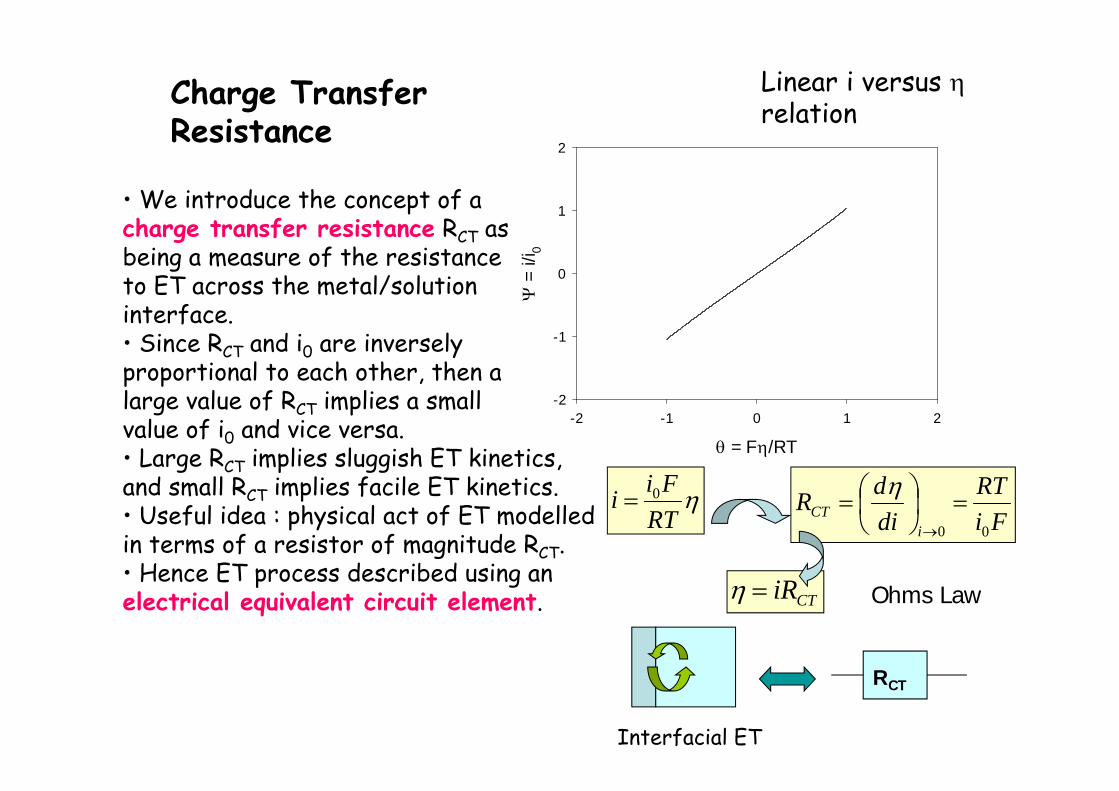
Linear i versus relation
• We introduce the concept of acharge transfer resistance RCT asbeing a measure of the resistanceto ET across the metal/solutioninterface.• Since RCT and i0 are inverselyproportional to each other, then alarge value of RCT implies a smallvalue of i0 and vice versa.• Large RCT implies sluggish ET kinetics,and small RCT implies facile ET kinetics.• Useful idea : physical act of ET modelledin terms of a resistor of magnitude RCT.• Hence ET process described using anelectrical equivalent circuit element.
RT
Fii 0Fi
RTdidR
iCT
00
CTiR
RCT
Interfacial ET
Ohms Law
Charge TransferResistance
Transport effects in electrode kinetics
• Influence of reactant transport (logistics) becomes important when the applied overpotential becomes very large.
• The current/potential curve “bends over” and a current plateau region is observed.
• This observation is explained in terms of rate control via diffusion of the reactant species to the electrode surface.
• We consider a two step sequence : diffusion to the site of ET at the electrode/solution interface followed by the act of ET itself.
• When the overpotential is very large, the driving force for interfacial ET is very large, and so ET becomes facile and hence no longer controls the rate.
• Matter transport via diffusion (i.e. getting the reactant species to the region of reaction) becomes rate limiting.

Transport and kinetics at electrode/solution interfaces
Bulk PhaseReactant
Reactant atelectrode
Product atelectrode
DMT
ETK
Bulk PhaseReactant
Reactant atelectrode
Product atelectrode
DMT
ETK
Bulk PhaseReactant
Reactant atelectrode
Product atelectrode
DMT
ETK
Bulk PhaseReactant
Reactant atelectrode
Product atelectrode
DMT
ETK
Slow rate determiningDiffusive mass transport,Fast interfacial ET kinetics
Fast diffusive masstransport, slow ratedetermining interfacialET kinetics
Large overpotentialsituation :Mass TransportControl
Low overpotentialsituation:Charge TransferControl
0ckf ET
Dkcc
ET
10
= F(E-E0)/RT
-6 -4 -2 0 2 4 6
=
i / i
D
0.0
0.5
1.0
ETD
DET
kkckkf
ckckf DET
111
ET
MT
ET & MT
exp0kkET
Normalisedpotential
DkD
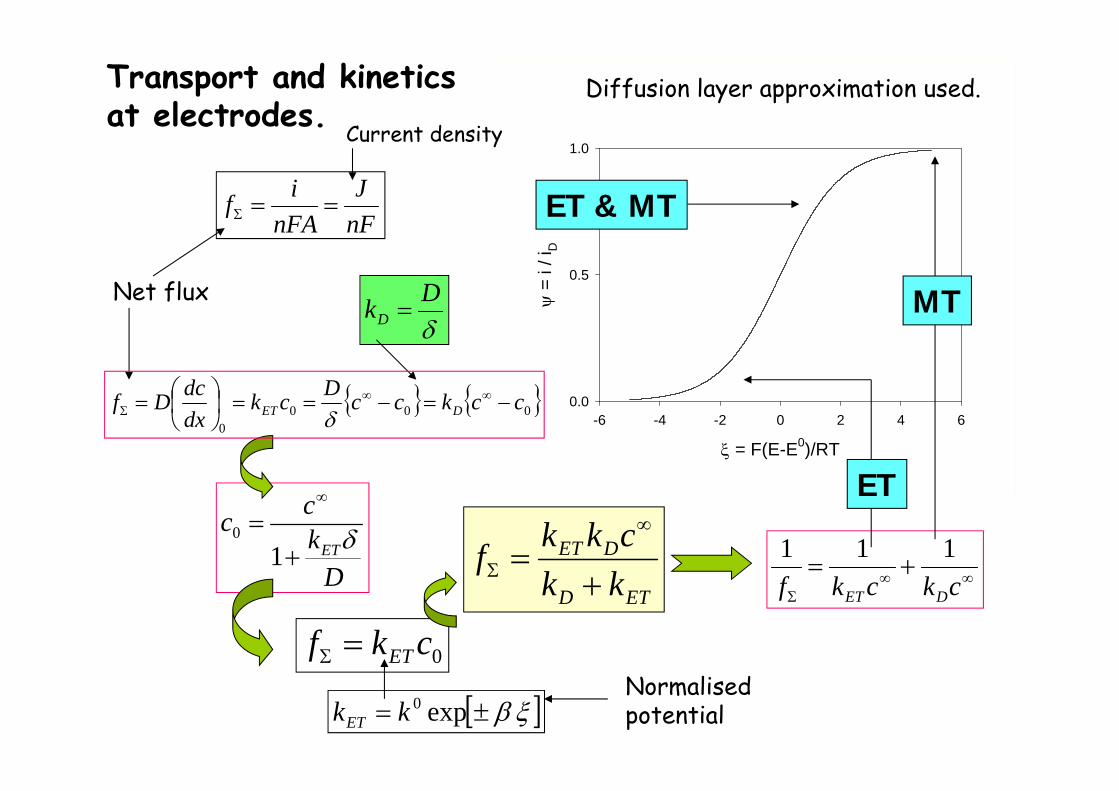
Transport and kineticsat electrodes.
Net flux
nFJ
nFAif
Current density
Diffusion layer approximation used.
0000
cckccDckdxdcDf DET

1 1ET D D D
D DET D
ET ET
k k c k c fi f k knFA k kk k
1D D
ET
f kf k
0
01 1 expD D D DF E Ei f f f k
i f f k RT
00 expET
F E Ek k
RT
cknFAif DD
D
0
0 0ln ln ln lnD D D DF E Ef f i i k k
f i k RT k
This is one form of the mass transport corrected Tafel equation. We see that a plot of ln (iD-i/i)vs – is linear . The slope of this plot yields - F/RT whereas the intercept directlyyields ln (kD/k0). Since kD may be readily evaluated, then the standard rate constant k0 maybe determined. This form of Tafel plot has been much used in the literature.
0EE
)ln( 0kkD
iiiDln
RTFS
MT correctedTafel plot
Mass transport corrected Tafel Equation
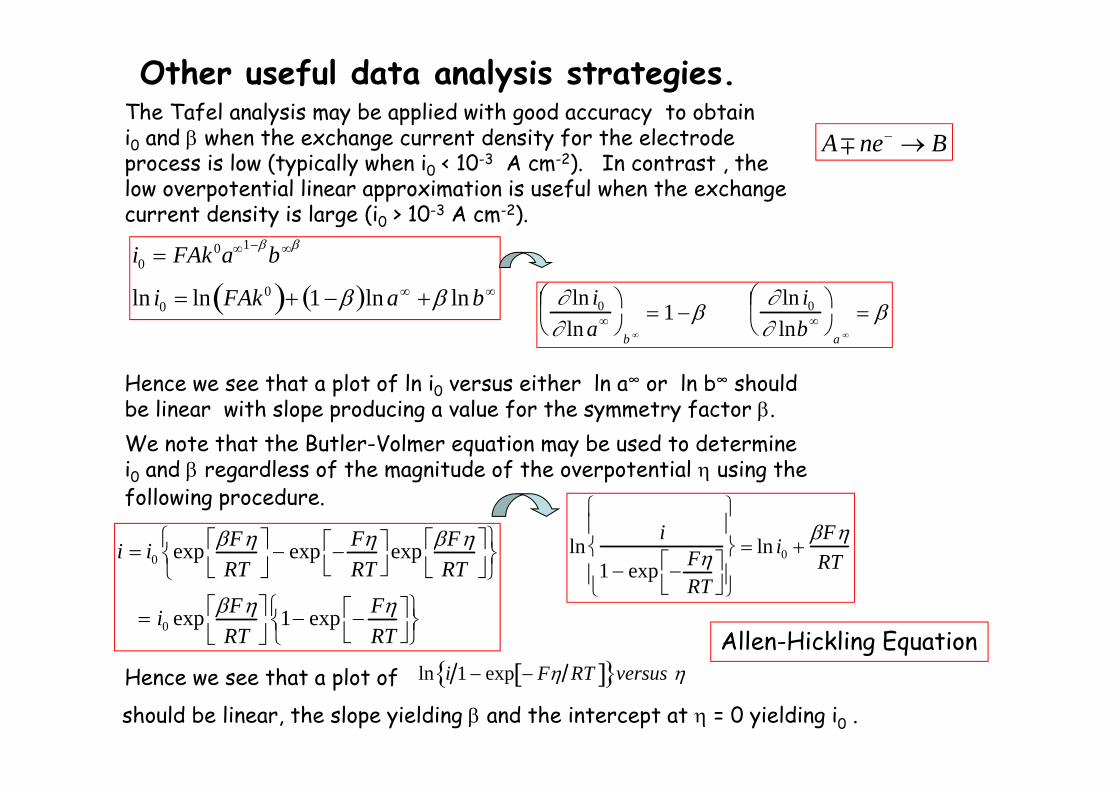
Other useful data analysis strategies.The Tafel analysis may be applied with good accuracy to obtain i0 and when the exchange current density for the electrode process is low (typically when i0 < 10-3 A cm-2). In contrast , the low overpotential linear approximation is useful when the exchange current density is large (i0 > 10-3 A cm-2).
i0 FAk0a1b
ln i0 ln FAk0 1 ln a ln b
Hence we see that a plot of ln i0 versus either ln a∞ or ln b∞ shouldbe linear with slope producing a value for the symmetry factor .
ln i0
ln a
b
1 ln i0
lnb
a
BneA
We note that the Butler-Volmer equation may be used to determine i0 and regardless of the magnitude of the overpotential using the following procedure.
i i0 exp FRT
exp F
RT
exp FRT
i0 exp FRT
1 exp FRT
lni
1 exp FRT
ln i0
FRT
Hence we see that a plot of ln i 1 exp F RT versus
should be linear, the slope yielding and the intercept at = 0 yielding i0 .
Allen-Hickling Equation

The molecular interpretation of electron transfer.
We have presented a brief analysis of thefundamentals of electrode kinetics in terms ofcurrent/overpotential relationships . Theanalysis was based on macroscopic orphenomenological considerations . However aproper understanding of interfacial electrontransfer requires the adoption of amicroscopic perspective . This requiresquantum mechanics .
The sharp rise in current density with increasingoverpotential as presented in the current vsoverpotential curve can be understood as follows .Here we present a molecular interpretation ofinterfacial electron transfer . It is a quantummechanical process and a quantitative developmentrequires some sophisticated mathematics .Consequently we shall adopt the lazy mansapproach and present a qualitative pictorialpresentation of the essentials . Consider thesituation depicted in the next two slides which wehave shown previously.
In these pictures we indicate , in a very schematic manner, the filled and empty electronic states in the metallic electrode and the highest occupied and lowest unoccupied energy levels of the donor species A and acceptor species B in the solution . The demarcation line between filled and empty electronic states in the metal is designated the Fermi energy EF . Now if the redox species A and B are both present in the solution and if no external potential is applied to the metal, then as previously noted, an equilibrium potential Dfe or Ee will be set up reflecting the balanced Faradaic activity across the interface . The value of the latter potential will depend on the logarithm of the ratio of the activities of A and B via the Nernst equation as previously discussed . Under such conditions we may set EF = Ee . In contrast, when the electrode becomes positively charged via application of an external potential more positive than Ee , then the energy of the electrons in the metal is lowered and EF shifts downward in energy . If the applied potential is sufficiently positive then a stage will be reached such that EF is lower in energy than the HOMO level of the donor species A and one obtains a net flow of electrons from donor species to metal . An anodic oxidation current flows . Conversely, if a potential more negative than the equilibrium value is applied to the electrode, then the energy of the electrons in the filled levels of the metal will be raised . A stage will be reached when EF is now higher in energy than the LUMO level of the acceptor species B and electrons will be transferred from the metal to species B in solution . A cathodic reduction current will flow .

Metallicelectrode
+
EF
LUMO
HOMO
LUMO
HOMO
Redox couplein solution
Electronenergy
n e-
Energy of electronsin metal decreases uponapplication of a potentialmore positive than thethermodynamic equilibriumvalue.
A net anodic (oxidation)current flows from theHOMO level of the redox species in solution to themetallic electrode.
Pictorial explanation of currentflow due to oxidation.

-
EF
LUMO
HOMO
LUMO
HOMO
Redox couplein solution
Electronenergy
n e-
Metallic electrode
Energy of electronsin metal increasesupon application of apotential more negativethan the thermodynamicequilibrium value.
A net reduction (cathodic)current flows from metal toLUMO levels of redox activespecies in solution.
Pictorial explanation ofcurrent flow due to reduction.
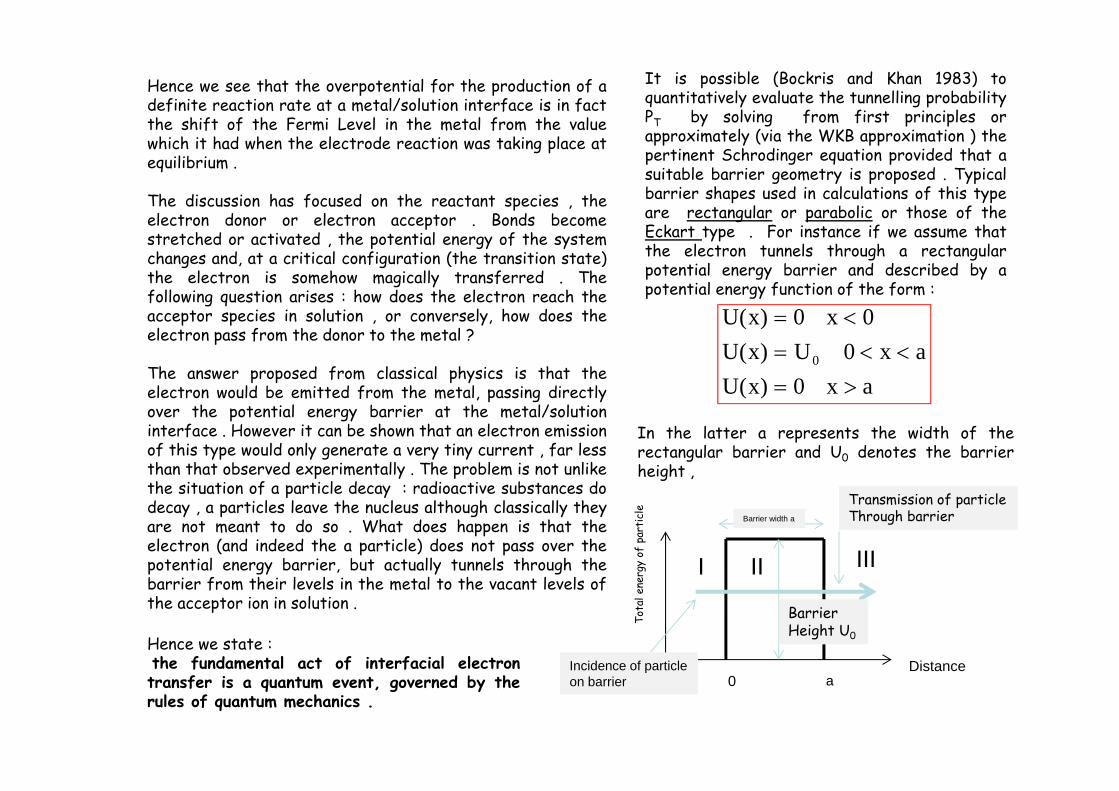
Hence we see that the overpotential for the production of adefinite reaction rate at a metal/solution interface is in factthe shift of the Fermi Level in the metal from the valuewhich it had when the electrode reaction was taking place atequilibrium .
The discussion has focused on the reactant species , theelectron donor or electron acceptor . Bonds becomestretched or activated , the potential energy of the systemchanges and, at a critical configuration (the transition state)the electron is somehow magically transferred . Thefollowing question arises : how does the electron reach theacceptor species in solution , or conversely, how does theelectron pass from the donor to the metal ?
The answer proposed from classical physics is that theelectron would be emitted from the metal, passing directlyover the potential energy barrier at the metal/solutioninterface . However it can be shown that an electron emissionof this type would only generate a very tiny current , far lessthan that observed experimentally . The problem is not unlikethe situation of a particle decay : radioactive substances dodecay , a particles leave the nucleus although classically theyare not meant to do so . What does happen is that theelectron (and indeed the a particle) does not pass over thepotential energy barrier, but actually tunnels through thebarrier from their levels in the metal to the vacant levels ofthe acceptor ion in solution .
Hence we state :the fundamental act of interfacial electrontransfer is a quantum event, governed by therules of quantum mechanics .
It is possible (Bockris and Khan 1983) toquantitatively evaluate the tunnelling probabilityPT by solving from first principles orapproximately (via the WKB approximation ) thepertinent Schrodinger equation provided that asuitable barrier geometry is proposed . Typicalbarrier shapes used in calculations of this typeare rectangular or parabolic or those of theEckart type . For instance if we assume thatthe electron tunnels through a rectangularpotential energy barrier and described by apotential energy function of the form :
U x xU x U x aU x x a
( )( )( )
0 00
00
In the latter a represents the width of therectangular barrier and U0 denotes the barrierheight ,
Tota
l ene
rgy
of p
arti
cle
I IIIII
Barrier Height U0
Transmission of particleThrough barrier
Incidence of particleon barrier
Barrier width a
Distance0 a

In particular when the barrier isvery high (U0 / E >> 1) and wide(so that ka >> 1) we can writethat
and so the tunnelling probabilityPT reduces to :
sinh expka ka 2
The latter expressions lead to the remarkable predictionthat a quantum particle exhibits a certain finite (althoughsmall) probability of leaking through a potential energybarrier which is completely opaque from the viewpoint ofclassical physics (since E < U0) . Indeed the parameter
provides a measure of the ‘opacity’ of the barrier , and inthe classical limit PT will be very small due to the fact thatthe opacity parameter will be very large .
2 02 2m U a
Pka
EU
EU
T
14
1
2
0 0
1
sinh k
m U E
2 02
Now if the energy E of the transferring electron is less than U0 , detailed solution of the pertinent Schrodinger equation results in the following expression for the tunnelling probability which we label PT :
Barrier Type Barrier Heigth (wrtFermi Level /eV
Barrier Width/Å TunnelingProbability
Parabolic Barrier 5 5 1.2 x10⁻⁴
10 10 9.1 x10⁻¹²
15 15 5.2 x10⁻²¹
20 20 6.0 x10⁻³²
RectangularBarrier
5 5 1.0x10⁻⁵
10 10 8.8x10⁻¹⁵
15 15 1.5x10⁻²⁶
20 20 1.7x10-40
PE
UE
Uka
EU
kaT
16
1 216
20 0 0
exp exp
We note that the tunneling probability is very sensitive to the barrier parameter.
For a parabolic barrier one can show thatThe tunneling probability takes the following formWhere L = barrier width and U0 is barrier maximum.
2
1/20exp 2T
LP m U Eh

A further consideration must be noted . In order forelectron tunnelling to occur, the electron must move toan acceptor energy level exactly equal in energy tothat of the electron in the metal . In other words theelectron transfer process is said to be radiationless .These acceptor states are of a special kind : they aresaid to be vibrationally excited . We can quote aconcrete example at this point . In the electronationof a hydrated proton, which is one of the constituentsteps in the multistep hydrogen evolution reaction,The latter reaction is often used as a prototype in thefundamental investigation of electrode processes .
In the latter expression M denotes a vacant metal siteand MH an adsorbed hydrogen atom , one supposesthat the O-H bonds which receive electrons are inexcited vibrational states . The degree to which thisexcitation energy exceeds the ground state energy ofthe reaction is a contribution to the activation energy .Hence molecular activation via bond stretching is avery important contribution to the net activationenergy . One can also show that the solvation of theion also plays an important role . The ion in solution hasassociated with it a solvation shell .The solvation state of the reduced and oxidised formof a redox couple is different . Hence the solvationshell of the reactant species must be configured in acertain way to allow the electron transfer reaction tooccur . This re-organization of the solvation shell alsorequires energy and so will also be a contributor to theenergy of activation .
These ideas form the basis for theMarcus theory of interfacial electron transfer.
H3O+ + e- + M MH + H2O
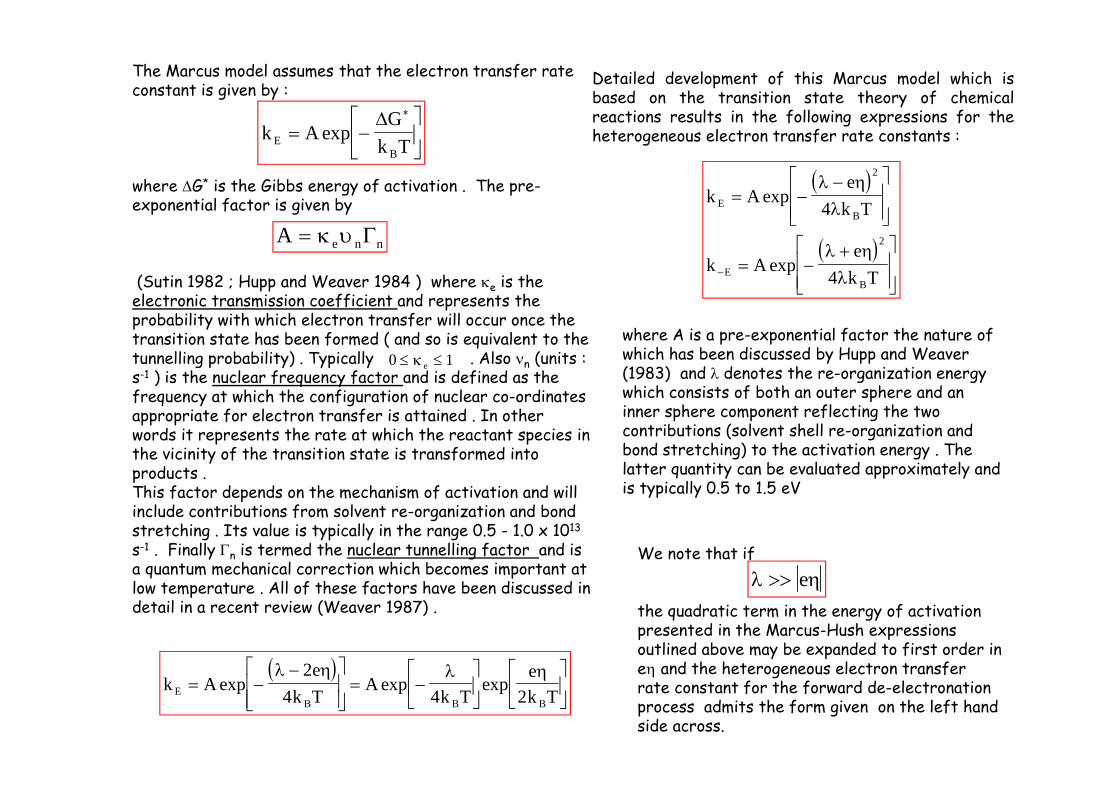
The Marcus model assumes that the electron transfer rate constant is given by :
where G* is the Gibbs energy of activation . The pre-exponential factor is given by
(Sutin 1982 ; Hupp and Weaver 1984 ) where e is the electronic transmission coefficient and represents the probability with which electron transfer will occur once the transition state has been formed ( and so is equivalent to the tunnelling probability) . Typically . Also n (units : s-1 ) is the nuclear frequency factor and is defined as the frequency at which the configuration of nuclear co-ordinates appropriate for electron transfer is attained . In other words it represents the rate at which the reactant species in the vicinity of the transition state is transformed into products . This factor depends on the mechanism of activation and will include contributions from solvent re-organization and bond stretching . Its value is typically in the range 0.5 - 1.0 x 10¹³
s-1 . Finally n is termed the nuclear tunnelling factor and is a quantum mechanical correction which becomes important at low temperature . All of these factors have been discussed in detail in a recent review (Weaver 1987) .
k AG
k TEB
exp
A e n n
0 1 e
Detailed development of this Marcus model which isbased on the transition state theory of chemicalreactions results in the following expressions for theheterogeneous electron transfer rate constants :
k Ae
k T
k Ae
k T
EB
EB
exp
exp
2
2
4
4
where A is a pre-exponential factor the nature of which has been discussed by Hupp and Weaver (1983) and denotes the re-organization energy which consists of both an outer sphere and an inner sphere component reflecting the two contributions (solvent shell re-organization and bond stretching) to the activation energy . The latter quantity can be evaluated approximately and is typically 0.5 to 1.5 eV
We note that if
the quadratic term in the energy of activation presented in the Marcus-Hush expressions outlined above may be expanded to first order in e and the heterogeneous electron transfer rate constant for the forward de-electronationprocess admits the form given on the left hand side across.
e
k A
ek T
Ak T
ek TE
B B B
exp exp exp
24 4 2

This expression is just the simple Butler-Volmer equationwith the symmetry factor having a numerical value of ½ .More generally according to the Marcus formulation thesymmetry factor or transfer coefficient is given by :
GG
G0
012
12
where we note that G* is the activation energy for electrontransfer and G0 represents the standard Gibbs energychange on proceeding from the reactant to the product statewhich for an electrochemical reaction is given by - e . TheGibbs energy of activation is given by (Albery 1975) :
G
G G*
41
4
0 2 0 2
The expression for the symmetry factor presented in theexpression above contains some important information . Ingeneral the latter quantity is a measure of the location ofthe transition state along the reaction co-ordinate .
As outlined in figure 2.23 we can consider a numberof simple situations . If, for example the transitionstate is symmetric then G0 = 0 and = ½ .Alternatively when G0 is negative the electrontransfer proceeds in an energetically downhill mannerand < ½ and the transition state is “reactant like” .Finally when G0 is positive , the electron transferreaction is uphill and > ½ and the transition state is“product like” .
The latter statements are a quantitative way ofexpressing the so called Hammond Postulate.
Note also that the facility of electron transfer willdepend on the magnitude of the re-organizationenergy . When
the electron transfer kinetics are slow and as notedin eqn.2.52. On the other hand when l is small and onehas fast electron transfer then the following threecases must be considered . When then .Alternatively, if
then 1 . Finally, if
then 0 .
G e0
G 0
G 0


![Journal of Electroanalytical Chemistry and Interfacial Electrochemistry Volume 252 issue 2 1988 [doi 10.1016%2F0022-0728%2888%2980226-2] Fernando Silva; Salomé Rodrigues -- The adsorption](https://img.dokumen.tips/doc/110x75/55cf9c50550346d033a966e0/journal-of-electroanalytical-chemistry-and-interfacial-electrochemistry-volume-565c6027c2c0f.jpg)


![1 Interfacial Rheology System. 2 Background of Interfacial Rheology Interfacial Shear Stress Interfacial Shear Viscosity = [ ]](https://img.dokumen.tips/doc/110x75/56649d1f5503460f949f3d29/1-interfacial-rheology-system-2-background-of-interfacial-rheology-interfacial.jpg)