Embed Size (px)
Citation preview

Physical activity patterns of adults in the ACT, 2000
Health Series Number 29
Population Health Research Centre ACT Health
November 2002

2
ACKNOWLEDGEMENTS This publication has been prepared by the Population Health Research Centre of ACT Health. Data analyses and background text were provided by the Cardiovascular Disease, Diabetes and Risk Factor Monitoring Unit of the AIHW. The contributions of Dr Tim Armstrong, Tracy Dixon and Anne-Marie Waters in particular are acknowledged. The Population Research Centre is grateful to the Australian Sports Commission for granting permission to use the Australian data from the 2000 Physical Activity Survey. Australian Capital Territory, Canberra 2002 This work is copyright. Apart from any use as permitted under the Copyright Act 1968, no part may be reproduced without written permission from the Director, Publishing Services, Department of Urban Services, ACT Government, GPO Box 158, Canberra ACT 2601. Published by Publishing Services for ACT Health's Population Health Research Centre and printed by the Authority of the ACT Government Printer. Publication Number 02-1931 Suggested citation: Physical activity patterns of adults in the ACT, 2000, Population Health Research Centre, ACT Health, 2002, ACT Government Printer, Canberra ACT. The ACT Government Homepage address is: http://www.act.gov.au This publication is on the Internet at: http://www.health.act.gov.au/healthinfo/index.html Inquiries regarding this report should be directed to the: Population Health Research Centre Phone: (02) 6244 4276 Fax: (02) 6244 4138 Email: [email protected]

3
Foreword Canberra is, on the whole, a highly educated community and the results of the 2000 National Physical Activity Survey would indicate that this translates into a heightened awareness of the issues surrounding physical activity. We in the ACT are better informed and more likely to participate in physical activity than much of Australia but, as always, we can’t afford to rest on our laurels. Alarming increases over recent years in overweight and obesity and the resulting diabetes epidemic are cause for tremendous concern, as is the ongoing incidence of heart and circulatory disease. Conditions such as depression too, can be combated with a combination of treatment and physical activity. Canberra has an enviable wealth of facilities and infrastructure to support people taking on physical activity and we need to make sure that we are putting those to good use. We also need to remember that physical activity is not limited to organised sport but can be as simple as walking with friends and family or a pet. It can also consist of incidental movement like taking the stairs instead of the lift, walking down to the shops instead of driving, or getting off the bus a stop early and walking the rest of the way to your destination. We also need to work to reduce smoking, improve nutrition and address unhealthy alcohol consumption, as well as encouraging physical activity. It’s time to combine our knowledge with our fantastic facilities and beautiful environment to put the ACT in the very top echelon of active Australian cities. [signed] Dr Paul Dugdale ACT Chief Health Officer

4
Contents ACKNOWLEDGEMENTS.................................................................................................................................2
FOREWORD .......................................................................................................................................................3
CONTENTS .........................................................................................................................................................4
LIST OF TABLES ...............................................................................................................................................6
LIST OF FIGURES .............................................................................................................................................7
LIST OF ABBREVIATIONS .............................................................................................................................8
EXECUTIVE SUMMARY .................................................................................................................................9
1. INTRODUCTION.....................................................................................................................................11
1.1 PHYSICAL ACTIVITY AND HEALTH OUTCOMES ............................................................................11 1.1.1 Premature death.............................................................................................................................11 1.1.2 Cardiovascular disease..................................................................................................................12 1.1.3 Type 2 diabetes mellitus .................................................................................................................13 1.1.4 Cancer............................................................................................................................................13 1.1.5 Musculoskeletal conditions ............................................................................................................14 1.1.6 Mental health .................................................................................................................................15 1.1.7 Obesity ...........................................................................................................................................15
2. SURVEY METHODOLOGY ..................................................................................................................16
2.1 SAMPLE SIZE .....................................................................................................................................16 2.2 SAMPLE SELECTION .........................................................................................................................16 2.3 RESPONSE RATE................................................................................................................................17 2.4 QUESTIONNAIRE...............................................................................................................................17 2.5 DEFINING AND MEASURING PHYSICAL ACTIVITY........................................................................18
2.5.1 Physical activity .............................................................................................................................18 2.5.2 Duration of physical activity ..........................................................................................................18 2.5.3 Frequency of physical activity .......................................................................................................18 2.5.4 Intensity of physical activity...........................................................................................................19 2.5.5 Type of physical activity.................................................................................................................19 2.5.6 Context of physical activity ............................................................................................................19 2.5.7 Physical inactivity ..........................................................................................................................19 2.5.8 Total sessions per week..................................................................................................................19 2.5.9 Total time per week ........................................................................................................................19 2.5.10 ‘Sufficient’ physical activity to confer a health benefit ...................................................................19
2.6 WEIGHTING .......................................................................................................................................21 2.7 METHOD OF SIGNIFICANCE TESTING.............................................................................................21 2.8 PREDICTOR VARIABLES OF PARTICIPATION..................................................................................21

5
3. DEMOGRAPHIC PROFILE OF SURVEY RESPONDENTS ............................................................22
3.1 AGE AND SEX ....................................................................................................................................22 3.2 CHILDREN IN THE HOUSEHOLD ......................................................................................................23 3.3 LANGUAGE SPOKEN, MARITAL STATUS, EDUCATION LEVEL, OCCUPATION STATUS ..............23 3.4 BODY MASS INDEX...........................................................................................................................24
4. PHYSICAL ACTIVITY PATTERNS OF ADULTS IN THE ACT .....................................................27
4.1 TOTAL SESSIONS SPENT IN ACTIVITIES..........................................................................................27 4.2 TOTAL TIME SPENT IN ACTIVITIES .................................................................................................30 4.3 MEASURES OF PHYSICAL ACTIVITY...............................................................................................31
4.3.1 Physical inactivity ..........................................................................................................................31 4.3.2 Physical activity to confer a health benefit ....................................................................................32
5. AWARENESS AND UNDERSTANDING OF PHYSICAL ACTIVITY MEDIA MESSAGES .......37
5.1 MESSAGE RECALL ............................................................................................................................37 5.1.1 Recall of generic messages about physical activity and exercise ..................................................37 5.1.2 Recall of the Active Australia campaign........................................................................................38 5.1.3 Recall of the Active Australia tagline ............................................................................................39
5.2 UNDERSTANDING OF PHYSICAL ACTIVITY MESSAGES ................................................................40 5.4 FACTORS ASSOCIATED WITH PARTICIPATION ..............................................................................43
5.4.1 ‘Sufficient’ physical activity ...........................................................................................................43 5.4.2 ‘Sufficient’ time and sessions .........................................................................................................45
6. DISCUSSION ............................................................................................................................................46
APPENDIX 1......................................................................................................................................................48
2000 NATIONAL PHYSICAL ACTIVITY SURVEY .........................................................................................48 Introduction.................................................................................................................................................48 Questions.....................................................................................................................................................48
APPENDIX 2......................................................................................................................................................51
REFERENCES...................................................................................................................................................54

6
List of tables TABLE 1: AGE AND SEX OF SURVEY RESPONDENTS (PER CENT), ACT, 2000............................................. 22 TABLE 2: PERCENTAGE OF CHILDREN IN THE HOUSEHOLD, ACT AND AUSTRALIA, 2000. ..................... 23 TABLE 3: LANGUAGE SPOKEN, MARITAL STATUS, EDUCATION LEVEL AND OCCUPATION OF SURVEY
RESPONDENTS, ACT AND AUSTRALIA, 2000 ................................................................................ 24 TABLE 4: BMI CATEGORIES OF SURVEY RESPONDENTS BY AGE, SEX, EDUCATION LEVEL (PER CENT),
ACT AND AUSTRALIA, 2000 ........................................................................................................... 25 TABLE 5: SESSIONS OF PHYSICAL ACTIVITY IN THE PREVIOUS WEEK BY SEX (PER CENT), ACT AND
AUSTRALIA, 2000 ............................................................................................................................. 27 TABLE 6: SESSIONS OF PHYSICAL ACTIVITY IN THE PREVIOUS WEEK, BY AGE GROUP (PER CENT), ACT
AND AUSTRALIA, 2000 .................................................................................................................... 29 TABLE 7: TOTAL TIME (MINUTES) FOR PHYSICAL ACTIVITY DURING THE PREVIOUS WEEK, ACT AND
AUSTRALIA, 2000 ............................................................................................................................. 30 TABLE 8: MEAN MINUTES FOR PHYSICAL ACTIVITY DURING THE PREVIOUS WEEK, BY AGE GROUP AND
SEX, ACT, 2000................................................................................................................................. 30 TABLE 9: MEAN MINUTES FOR PHYSICAL ACTIVITY DURING THE PREVIOUS WEEK, BY AGE GROUP AND
SEX, AUSTRALIA, 2000 .................................................................................................................... 31 TABLE 10: PERCENTAGE OF RESPONDENTS REPORTING NO PHYSICAL ACTIVITY DURING THE WEEK
PRECEDING THE SURVEY INTERVIEW, ACT AND AUSTRALIA, 2000.......................................... 32 TABLE 11: PERCENTAGE OF RESPONDENTS UNDERTAKING PHYSICAL ACTIVITY FOR A ‘SUFFICIENT’
TIME DURING THE WEEK PRECEDING THE SURVEY INTERVIEW, BY SEX, AGE GROUP AND EDUCATION LEVEL, ACT AND AUSTRALIA, 2000 ........................................................................ 33
TABLE 12: PERCENTAGE OF RESPONDENTS UNDERTAKING PHYSICAL ACTIVITY FOR A ‘SUFFICIENT’ TIME AND SESSIONS, DURING THE WEEK PRIOR TO THE SURVEY INTERVIEW, BY SEX, AGE GROUP AND EDUCATION LEVEL, ACT AND AUSTRALIA, 2000................................................... 36
TABLE 13: PERCENTAGE OF RESPONDENTS RECALLING GENERIC MESSAGES ABOUT EXERCISE AND PHYSICAL ACTIVITY, ACT AND AUSTRALIA, 2000 ...................................................................... 37
TABLE 14: PERCENTAGE OF RESPONDENTS RECALLING THE UNPROMPTED ACTIVE AUSTRALIA CAMPAIGN, ACT AND AUSTRALIA, 2000 ...................................................................................... 38
TABLE 15: PERCENTAGE OF RESPONDENTS RECALLING THE PROMPTED ACTIVE AUSTRALIA TAGLINE ‘EXERCISE — YOU ONLY HAVE TO TAKE IT REGULARLY, NOT SERIOUSLY’, ACT AND AUSTRALIA, 2000 ............................................................................................................................. 39
TABLE 16: PERCENTAGE OF RESPONDENTS AGREEING (COMBINED ‘STRONGLY AGREE’ AND ‘AGREE’) WITH KNOWLEDGE STATEMENTS, ACT AND AUSTRALIA, 2000 ................................................ 41
TABLE 17: PERCENTAGE OF RESPONDENTS INTENDING TO BE MORE PHYSICALLY ACTIVE, ACT AND AUSTRALIA, 2000 ............................................................................................................................. 42
TABLE 18: FACTORS ASSOCIATED WITH PARTICIPATION IN ‘SUFFICIENT’ TIME AND TIME AND SESSIONS IN PHYSICAL ACTIVITY, ACT AND AUSTRALIA, 2000.................................................................. 44

7
List of figures FIGURE 1: PERCENTAGE OF FEMALE RESPONDENTS ENGAGED FOR A ‘SUFFICIENT’ TIME IN PHYSICAL
ACTIVITIES DURING THE WEEK PRIOR TO THE SURVEY INTERVIEW, BY AGE, ACT AND AUSTRALIA, 2000. ............................................................................................................................ 34
FIGURE 2: PERCENTAGE OF MALE RESPONDENTS ENGAGED FOR A ‘SUFFICIENT’ TIME IN PHYSICAL ACTIVITIES DURING THE WEEK PRIOR TO THE SURVEY INTERVIEW, BY AGE, ACT AND AUSTRALIA, 2000. ............................................................................................................................ 35
FIGURE 3: ANY INTENTION TO BE MORE ACTIVE (NEXT MONTH AND IN THE NEXT SIX MONTHS), ACT, 2000. .................................................................................................................................................. 43

8
List of abbreviations ABS Australian Bureau of Statistics ACSM American College of Sports Medicine ACT Australian Capital Territory AIHW Australian Institute of Health and Welfare Aust. Australia BMI body mass index CATI Computer-Assisted Telephone Interview CI confidence interval CVD cardiovascular disease DHAC Department of Health and Aged Care DHFS Department of Health and Family Services HSC Higher School Certificate NSW New South Wales HVRF Hunter Valley Research Foundation MET metabolic equivalent PSG Population Statistics Group US United States

9
Executive Summary This report presents the ACT results from the national physical activity survey of Australian adults, conducted in 2000. The 2000 National Physical Activity Survey was undertaken to assess the impact of the 2000 Olympic Games on adult activity levels and awareness of physical activity campaign messages. This was the third in the Active Australia series of surveys, focussing specifically on leisure time physical activity. The first survey was undertaken in 1997 and the second survey was undertaken in 1999. The 2000 National Physical Activity Survey was the only survey in the series to include an ACT sample large enough to provide reliable ACT estimates. The following is a summary of key findings from the 2000 survey.
More than half of ACT adults participated in ‘sufficient’ physical activity to confer a health benefit. Over half (52%) of the ACT adults surveyed in 2000 participated in physical activity for a ‘sufficient’ time, and in ‘sufficient’ sessions, to confer a health benefit. However, this rate of participation decreased with increasing age, up to 60 years. Participation at a ‘sufficient’ level was most common amongst those who had a tertiary education. Almost a quarter (24%) of the ACT adults surveyed were undertaking some form of physical activity in 2000, but not enough to be considered ‘sufficient’, in terms of time spent, to confer a health benefit. The percentage of ACT adults engaged in activity for an ‘insufficient’ time increased with age to 60 years, and was most common amongst those who had attained their HSC, or equivalent. Thirteen per cent of ACT adults reported undertaking no leisure-time physical activities and were classified as ‘sedentary’ according to survey definitions. The survey indicated that sedentary behaviour increased with age, but decreased with increasing education levels. ACT adults reported walking as their preferred physical activity. The survey results indicated that more adults in the ACT spent time walking, on average, than any other form of physical activity in 2000. Indeed, approximately 37% of adults in the ACT walked at least five times per week for recreation/exercise. Results from the survey suggest males in the ACT were more willing to participate in vigorous-intensity physical activity than females in 2000, but their willingness to participate decreased as age increased. Older people in the ACT spent more time walking, on average, than any other form of activity and vigorous-intensity gardening/yard-work was more common among adults aged 45 years or more. More than half of ACT adults had a healthy weight in 2000. A higher proportion of adults in the ACT (54%) reported a healthy weight (BMI 18.5 – 24.9) compared to adults nationally (51%), average BMIs were lower for the ACT (24.7) than for the national sample (25.2).

10
Awareness of physical activity messages in the ACT was much higher than the national average. Three-quarters (75%) of the ACT adults surveyed recalled that they had seen, or heard, generic messages about physical activity in the month preceding the interview, with the highest recall rates amongst the youngest (18 – 29 years), and oldest (60 – 75 years) age groups surveyed. Almost 70% of the ACT adults surveyed were able to recall the Active Australia tagline ‘Exercise – you only have to take it regularly, not seriously’, compared to 41% of adults surveyed nationally. Interestingly, the age group 30 – 44 years and people with HSC, or an equivalent education level, had the highest recall rates in the ACT.
Most of the ACT adults that were surveyed understood the health benefits of physical activity and were intent on increasing their participation levels. Approximately 90% of ACT adults agreed strongly with the statements in the survey about moderate activity, indicating a high level of comprehension about the health benefits of physical activity. However, approximately 60% agreed with the ‘old’ public health message that vigorous activity, three times per week, for twenty minutes, was essential to obtain a health benefit. The survey results indicated that more than two-thirds (68%) of ACT adults intended to be more physically active in the near future. Females were more likely than males to report an intention to increase activity levels, although this intention decreased as age increased.
Married and blue-collar workers were less likely to undertake ‘sufficient’ leisure time physical activity to confer a health benefit. Blue collar workers were 81% less likely to achieve a ‘sufficient’ level of physical activity compared to managers and the odds of ‘sufficient’ time participation among single or never married persons, was four times greater than amongst those who were married or in de facto relationships. The major factors that affected ‘sufficient‘ time and sessions engaged in physical activity to confer a health benefit were occupation, marital status and recall of the Active Australia tagline. Blue collar workers were 69% less likely to achieve ‘sufficient’ time levels and sessions engaged in physical activity compared to managers and the odds of ‘sufficient’ time and session participation amongst those who were single, or never married, was more than twice the rate of those who were married, or in de facto relationships.

11
1. Introduction Participation in physical activity can have significant benefits for the health and wellbeing of individuals in the community. However, it is only relatively recently that physical activity has been recognised as an important public health issue. The Report of the US Surgeon General (USDHHS 1996), which collated the evidence available at the time to support the role of physical activity in improving health, endorsed and further expanded existing levels of acceptance of physical activity as an area of major concern to public health. Initiatives designed to promote the benefits of physical activity and to increase participation at the population level are now commonplace throughout Australia and on the increase internationally. The 2000 National Physical Activity Survey was undertaken to assess the impact of the 2000 Olympic Games on adult activity levels and awareness of physical activity campaign messages. The Commonwealth Department of Health and Ageing and the Australian Institute of Health and Welfare jointly funded the survey. A baseline physical activity survey (Active Australia Baseline Survey) was conducted in November 1997, as a benchmark for the Active Australia initiative and a second national survey was conducted in 1999, providing information on physical activity trends, patterns of public perception and awareness of physical activity campaigns. However, the ACT samples in the 1997 and 1999 surveys were too small to provide reliable results for the ACT. ACT Health provided additional funding for the third survey in 2000 to increase the number of respondents from the ACT. The increase in sample size for the ACT was necessary to obtain robust ACT estimates and enable the production of this ACT-specific report on physical activity.
1.1 Physical activity and health outcomes Physical activity is an important factor in the prevention of many chronic diseases. Indeed, participation in physical activity can reduce the risk of mortality and morbidity from cardiovascular disease, type 2 diabetes, breast and colon cancers, and morbidity from some injuries. It has also been shown to have a beneficial effect on mental health, reducing the symptoms of depression, anxiety and stress.
1.1.1 Premature death At all ages, people who participate in moderate to vigorous levels of physical activity have lower mortality rates than those with sedentary lifestyles. The effects of physical activity on reducing premature mortality have been shown to be both strong, and consistent, across studies and diverse populations (Lee & Skerrett 2001; Stessman et al. 2000; Villeneuve et al. 1998).

12
Evidence is also strong for a reduction in the risk of premature death among the physically active. Participation in moderate types of self-reported physical activity, such as climbing at least 20 flights of stairs per week confers health benefits (Lee & Paffenbarger 1997; Paffenbarger et al. 1993), as does transport-related activity, such as bicycling to work on a regular basis (Andersen et al. 2000). Participation in more vigorous physical activity confers an even greater benefit, in terms of overall risk of early death (Lee & Paffenbarger 2000).
1.1.2 Cardiovascular disease The strongest evidence for the benefits of physical activity is in reducing the risk of mortality and morbidity from cardiovascular disease (CVD), particularly coronary heart disease and ischaemic stroke.
Coronary heart disease Extremely robust evidence exists to support a relationship between physical activity and decreased risk of coronary heart disease (Manson 2002; Williams 2001; USDHHS 1996; Berlin & Colditz 1990; Powell et al 1987). Participation in moderate levels of physical activity, equivalent to 150 minutes per week, are ‘sufficient’ to reduce risk of coronary heart disease by up to 40% (Bull et al in prep; Williams 2001). Participation in more sustained, or more vigorous activities, may further reduce risk. The biological pathways of coronary heart disease support a causal association between physical activity and reduced risk of coronary heart disease. Studies have shown that physical activity has beneficial impacts on blood pressure (Fagard 2001; Mensink et al 1999), lipid profiles (Kraus et al 2002; Leon & Sanchez 2001; Moore 1994), ischaemia (Laughlin 1994), atherosclerosis (Haskell et al 1994), thrombosis and fibrinolytic activity (Howell 1996; Leon 1991).
Ischaemic stroke The evidence for an association between physical activity and stroke is less clear. In some cases, the existence of such a relationship has been questioned (Kohl 2001; Kohl & McKenzie 1994). However, many studies do not differentiate between the two major subtypes of stroke, namely ischaemic and haemorrhagic. The differing biological mechanisms for the two types of stroke mean that physical activity may not affect both in the same way. Generally, where separate data are available for both types of stroke, studies show a decrease in the risk of ischaemic stroke with increasing physical activity (Ellekjaer et al. 2000; Hu et al. 2000; Wannemethee & Shaper 1999). A meta-analysis of published studies showed that participation in moderate levels of physical activity can reduce the risk of ischaemic stroke by up to 35% (Bull et al, in prep). The similarity to the biological mechanism for coronary heart disease provides plausibility for a causal association between physical activity and ischaemic stroke.
13
1.1.3 Type 2 diabetes mellitus Reviews show that the benefits of physical activity in the prevention and treatment of type 2 diabetes are strongly supported by current research (Kelley & Goodpaster 2001; Ivy et al. 1999). Cohort studies have demonstrated that the risk of developing type 2 diabetes is reduced in those who are physically active compared to those who are sedentary (Folsom et al 2000; Helmrich et al 1994). The benefits of physical activity in the prevention of type 2 diabetes are also seen amongst those at high risk of type 2 diabetes, such as those who are obese, have impaired glucose tolerance, or a family history of diabetes (Diabetes Prevention Program Research Group 2002; Kelley & Goodpaster 2001; Tuomiletho 2001). Meta-analysis shows that participation in moderate levels of physical activity reduces the risk of type 2 diabetes by up to 30% (Bull et al in prep). It has been estimated that 30 – 50% of new cases of type 2 diabetes could be prevented by appropriate levels of physical activity (Manson & Spelsberg 1994). Increasingly, physical activity is being recognised as an important component in the management and treatment of type 2 diabetes (Dunstan 2002; Ivy et al 1999). It is suggested that physical activity may improve glucose metabolism and increase insulin sensitivity among people with type 2 diabetes, decreasing the severity of the condition and reducing the risk of complications. Physical activity may also have benefits in helping to reduce abdominal fat, thereby lessening the severity of type 2 diabetes and decreasing the risk of its development in those not already affected. However, the benefits of physical activity for preventing and treating diabetes only occur from regular sustained physical activity patterns. The physiological adaptations that are responsible for the protective effects of physical activity subside within a short period of the cessation of physical activity (Arciero et al. 1999; Dela et al. 1993; Rogers et al. 1990).
1.1.4 Cancer A large number of cohort and case-control studies provide evidence for a relationship between physical activity and reduced risk of developing some forms of cancer. Reviews demonstrate that participation in at least moderate levels of activity results in a decrease in the risk of certain site-specific cancers among men and women, and a reduced risk of the incidence of cancer among men (Thune & Furberg 2001; McTiernan et al 1998). The evidence for the protective effect of physical activity is strongest for colon cancer in both men and women (Colditz et al. 1997; Slattery et al 1997; Longnecker et al 1995), and for breast cancer among women (Verloop et al. 2000; Gammon et al. 1998; Latikka et al. 1998). Biologically plausible mechanisms exist to support a causal relationship between physical activity and a reduction in risk for both these types of cancer. The evidence relating to physical activity and other cancers is less conclusive. There is some evidence for vigorous activity providing a protective effect for prostate cancer in men (Giovannucci et al. 1998), although some researchers have not found such a relationship (Liu et al. 2000). There is also evidence suggesting that physically active women have a reduced risk of endometrial cancer (Moradi et al 1998; Kalandidi et al 1996; Levi et al 1993). There are too few studies to enable clear statements to be made on the associations between physical activity and uterine and ovarian cancer in women, testicular cancer in men, and lung cancer. However, a recent study showed a promising reduction in risk of lung cancer in physically active men (Lee & Paffenbarger 2000).

14
Colon cancer There is excellent evidence to indicate that participation in moderate to vigorous levels of physical activity results in decreased risk of colon cancer (Slattery at al 1997; White et al 1996; Giovannucci et al 1995; Severson et al 1989) and precancerous polyps in the large bowel (Neugut et al. 1996; Slattery et al. 1997). Meta-analysis shows that the relative risk of colon cancer among inactive men and women is around 1.7 times that of physically active men and women (Bull et al, in prep). Breast cancer Meta-analysis has also shown that women who are moderately physically active can reduce their risk of breast cancer by over 20% (Bull et al in prep). Clinical and observational studies demonstrate that a relationship between physical activity and decreased risk of breast cancer exists in pre-, peri- and post-menopausal women (Verloop et al 2000; Wyshak & Frisch 2000; Levi et al 1999; Fraser & Shavlik 1997).
1.1.5 Musculoskeletal conditions The nature of the association between physical activity and musculoskeletal conditions is difficult to clarify. Participation in physical activity throughout the lifespan can increase, maintain, or reduce the decline of musculoskeletal health that generally occurs with ageing in sedentary people (Brill et al. 2000). Among older adults, participation in physical activity can help maintain strength and flexibility, increasing the ability to continue to perform daily activities (Brill et al. 2000; Huang et al. 1998; Simonsick et al. 1993), and can reduce the risk of falling and hip fractures (Grisso et al. 1997; Lord 1995). A review of the literature concluded that long-term physical activity participation is related to postponed disability, enhanced physical function and independent living amongst the very elderly (Spirduso & Cronin 2001).
Osteoporosis Biologically plausible mechanisms exist to explain an association between physical activity and bone density, which supports the relationship between physical activity and the development of osteoporosis (Drinkwater 1994). Cross-sectional studies show that participation in physical activity is positively associated with bone density (Gutin & Kasper 1992), however the specific types of activities required for increases in bone density and bone mass are still not clear (Vuori 2001; ACSM 1995). Weight-bearing activity is important in the development of peak bone density for adolescents (Welten et al. 1994) and for middle-aged women (Zhang et al. 1992). While there is only weak evidence that moderate-intensity physical activities such as walking, swimming and cycling can improve bone density, studies have shown that high impact and high loading activities (e.g. jogging, aerobics, weight training) are likely to be beneficial (Bassey 2001; Vuori 2001).

15
Falls Systematic reviews of the literature have identified the beneficial role of physical activity in reducing the risks of falls in the elderly (Kujala et al 2000; Gillespie & McMurdo 1998). However, it is difficult to determine the precise nature, or strength of this effect, as physical activity is often only one component of a larger program, which may include reviewing medications and improving the safety of the domestic environment (Gillespie et al. 1998). Physical activity may assist in reducing the risk of falls by improving balance, coordination, bone and muscle strength (Gregg et al 2000), however the types of activities that provide such benefits, are yet to be clearly defined.
1.1.6 Mental health The benefits of physical activity with regard to mental health have been reported for some time. Studies consistently show that participation in physical activity reduces symptoms of stress, anxiety and depression (Hassmén et al. 2000; Glenister 1996; Paffenbarger et al. 1994; Petruzello et al. 1991). Physical activity is associated with increased mental health in population studies (Simonsick 1991; Stephens 1988) and is recognised as an evidence-based treatment for clinical anxiety and depression (Bauman & Owen 1999). However, the causal pathways of the positive effect of physical activity on symptoms of mental health conditions, and the precise nature of this effect, are unclear. There is limited evidence to support a relationship between participation in physical activity and a reduction in the risk of developing mental health conditions, and even less to suggest that there may be a causal effect. Participation in physical activity may also confer other psychological and social benefits that impact on health and wellbeing. Participation by individuals can help improve quality of life in children and adults (Hassmén et al. 2000; Laforge et al. 1999; Morans & Mohai 1991), promote positive self-image among women (Maxwell & Tucker 1992), enhance social skills in children (Evans & Roberts 1987), and build self-esteem (Sonstroem 1984). These benefits are probably due to a combination of participation in the activity itself and from the socio-cultural aspects that can accompany physical activity. Among young people, participation in physical activity may also reduce self-destructive and antisocial behaviour (Mutrie & Parfitt 1998).
1.1.7 Obesity The basic premise underlying the relationship between physical activity and obesity is that weight gain results when energy consumed through diet exceeds the energy expended through physical activity. Biologically plausible mechanisms support this theory (Hill & Melanson 1999). The benefits to be achieved through a combination of regular physical activity and good nutrition are considerable. The rising prevalence of obesity and the associations between obesity and increased risk of a number of chronic diseases, particularly type 2 diabetes, make this important from a public health perspective. In general, increasing age is associated with an increase in body weight, but substantial research suggests that this increase may be attenuated through regular participation in physical activity over the life course. Participation in suitable amounts of activity can result in weight maintenance or even weight loss, particularly when combined with a reduced caloric intake or a more appropriate diet (Grundy et al 1999).

16
2. Survey methodology The Hunter Valley Research Foundation (HVRF), via computer assisted telephone interview (CATI), collected data for the 2000 National Physical Activity Survey. Details of the survey methodology are presented in a technical report (HVRF 2001), however, a summary of the methodology is provided below.
2.1 Sample size The scope of the survey included Australian adults aged 18 – 75 years. The national survey sample size required for the 2000 survey was estimated to be at least 2,500 and was distributed proportionally by population across States and Territories. An age range of 18 – 75 years was used to ensure data were collected for the entire age range for which public health messages on physical activity were targeted, and to maintain consistency with the 1997 and 1999 surveys (Armstrong et al 2000; ASC 1998). The (then) ACT Department of Health & Community Care contracted the HVRF to increase the sample size in the ACT to 450. The final ACT sample consisted of 512 completed interviews. An increased sample size in New South Wales was also requested by the NSW Health Department. The final national sample was 3,590.
2.2 Sample selection Respondents were selected using a two-stage sampling process. Firstly, households were randomly selected using the electronic White Pages telephone directory. Then, once contact with the household was established, the person aged between 18 and 75 years who had the most recent birthday in the household was asked to participate. Once identified, the respondent was not substituted with other members of the household for any reason. A small pilot test conducted by the HVRF in early November 2000 tested the wording and flow of the survey. More extensive pilot testing was not considered necessary as comparable questions were successfully used in the 1997 and 1999 surveys. Interviewers were trained using the CATI system. The 2000 survey was conducted in November and December 2000 to ensure comparability with the 1997 and 1999 surveys, which were conducted during November – December 1997 and 1999. Conducting the surveys at the same time of year helped to ensure participation rates were not affected by seasonal conditions. The CATI system directed all wording used by the interviewers for the introduction, and for all of the survey questions. Survey answers were entered by the interviewers during the interview and automatically checked for validity by the CATI system. The interviewer transcribed all open-ended responses verbatim.

17
2.3 Response rate A potential respondent was defined as a person currently living in the household aged between 18 and 75 years. If there was more than one person in this category, the person with the most recent birthday was selected. Several methods were used by HVRF to improve response rates. A minimum of six call attempts was made to establish contact with a survey respondent. A further five attempts were undertaken once contact had been made, to obtain either a completed interview, or a refusal. Respondents were able to make appointments to complete the interview at a more convenient time, if required, and interviewers left messages on answering machines, as well as providing a toll-free number for potential respondents to call. Telephone contact was made with 4,705 households nationally, resulting in 3,590 completed interviews. This represented a national household response rate of 76%. Of the eligible individuals contacted, the individual response rate was 93%. In the ACT, the household response rate was 80% and the individual response rate was 95%. The national response rate in 2000 was higher than in 1997 and 1999, where household response rates were 61% and 65%, and individual response rates were 81% and 89%, respectively.
2.4 Questionnaire Questions were asked about respondents’ awareness and understanding of the moderate-intensity physical activity messages, their intentions to become more active in the future, their participation in predominantly leisure-time physical activities (including walking for transport) during the previous week and their usual physical activity patterns over the last six months (i.e. a ‘usual’ week) (see Appendix 1). Specific information was collected on: • walking continuously for at least 10 minutes, for recreation, exercise or transport; • other moderate - intensity physical activities, e.g. gentle swimming, social tennis; • vigorous - intensity physical activities, e.g. jogging, cycling, aerobics, competitive tennis;
and • vigorous - intensity gardening or heavy yard work. Participants were asked to report the frequency and duration of each activity. Prescriptive definitions of the terms ‘vigorous’ and ‘moderate’ were not provided, and thus respondents interpreted these terms in the context of the questions and examples provided. Perceptions of intensity may therefore vary, and are likely to be influenced by factors such as fitness level and age.

18
2.5 Defining and measuring physical activity Physical activity for health benefit comprises several components (e.g. intensity, frequency, duration and type) that can be carried out in different settings or contexts (e.g. leisure-time, occupational, incidental and transport). Measurement can be complicated because there are several dimensions of physical activity related to health (e.g. energy expenditure, fitness, strength and flexibility) and methods for measuring activity range from self-reported instruments to more objective assessments of movement, fitness or energy balance. In the 2000 National Physical Activity Survey a self-report survey was used to measure activity levels. The survey questionnaire is included in Appendix 1. One of the issues surrounding measurement relates to the quantum of activity required for different health outcomes. For example, the primary type of physical activity required to prevent cardiovascular disease (i.e. moderate-intensity regular physical activity) is not the same as that required to prevent falls in the elderly (i.e. weight-bearing and strength-training activity). Different intensities and duration of activity are needed for different purposes — for example, more vigorous and sustained activity may confer additional benefits for disease prevention, but may be required for weight loss or improvements in lipid profiles. The report Physical activity patterns of Australian adults (Armstrong et al 2000) provides a more detailed discussion of physical activities and the development of measurement standards in Australia. The key concepts used to measure physical activity in this report are defined below.
2.5.1 Physical activity ‘Physical activity’ is defined as ‘any bodily movement produced by skeletal muscles that results in energy expenditure’ (Caspersen et al. 1985). Examples of physical activity include walking, walking up stairs, gardening, playing sport and work-related activity. Exercise is a subset of physical activity and is defined as planned, structured and repetitive bodily movement undertaken to improve, or maintain, one or more components of physical fitness. Physical activity comprises duration, frequency, intensity, type and context.
2.5.2 Duration of physical activity ‘Duration’ is defined as the length of time spent participating in physical activity, as self-reported by the respondent, within a reporting period. The 2000 National Physical Activity Survey used a reporting period of one week, designated as the seven days prior to interview.
2.5.3 Frequency of physical activity ‘Frequency’ is defined as the number of times a respondent self-reported participating in physical activity, within a reporting period.

19
2.5.4 Intensity of physical activity ‘Intensity’ is defined as the self-perceived and self-reported intensity at which a respondent participated in physical activity, for example ‘moderate’ or ‘vigorous’. Examples of ‘moderate’ intensity activities include brisk walking, social tennis, and gentle swimming. ‘Vigorous’ intensity activities include running, aerobics and squash.
2.5.5 Type of physical activity ‘Type’ is defined as specific physical activities undertaken and self-reported by respondents, for example, walking, gardening and yard-work.
2.5.6 Context of physical activity ‘Context’ refers to the wider circumstances in which a person participates in physical activity, for example ‘incidental activity’, ‘transport’, ‘leisure-time’, or ‘occupational’. The majority of the data in this report refer to ‘leisure-time’ physical activity, which refers to activity performed during an individual’s discretionary time. An element of personal choice is inherent to this definition (Bouchard & Shephard 1994).
2.5.7 Physical inactivity Respondents reporting no participation in physical activity have been classified as being physically ‘inactive’, or ‘sedentary’.
2.5.8 Total sessions per week The number of times a respondent reported participating in a physical activity has been presented in the report. This is of interest because, the majority of participants report fewer than six sessions per week and it is assumed that sessions relate to ‘days’ of activity. Hence, the number of sessions could be related to the current recommendations, which are to participate in activities on most, if not all, days of a week, i.e. five sessions or more in one week.
2.5.9 Total time per week The total time spent participating in physical activity has been calculated from the sum of total time spent in walking, moderate-intensity physical activity and vigorous - intensity physical activity during the previous week.
2.5.10 ‘Sufficient’ physical activity to confer a health benefit ‘Sufficient’ leisure-time physical activity for health results from participation in regular physical activity of ‘sufficient’ duration and intensity. The National Physical Activity Guidelines for Australians (DHAC 1999) recommend that the ‘accumulation of 30 minutes of moderate physical activity on most days of the week’ is beneficial for health. Two definitions of ‘sufficient’ activity for health benefit are used in this report:
20
• The first definition is based on a duration of at least 150 minutes of walking and/or moderate-intensity physical activity, and/or vigorous-intensity physical activity per week (where vigorous-intensity physical activity is weighted by a factor of two to reflect its greater intensity).
• The second definition is a refinement of the first, which takes into account the number of sessions undertaken. This second definition requires that 150 minutes of moderate-intensity activity (at least) be accrued over at least five sessions. The rationale for this is that, for most people, each session would be undertaken on a separate day.
Physical activity related to gardening and yard work is not accepted as a contributor to ‘sufficient’ physical activity because there is currently limited research on the validity of the self-reported intensity of these activities. Gardening and yard work were commonly reported activities and hence were collected specifically to allow for exclusion from the calculations of ‘sufficient’ activity. ‘Insufficient’ physical activity has been defined as some reported physical activity, but not meeting either of the ‘sufficient’ criteria defined below. To avoid measurement error due to over-reporting (Bauman 1987), data were truncated using the following criteria:
• Maximum ‘allowable’ recorded time doing any of the three types of physical activity was 14 hours per week (any reported time spent greater than 14 hours was re-coded to 14 hours); and a
• Maximum ‘allowable’ recorded total hours per week was 28 hours per week (any total hours greater than 28 were re-coded to equal 28 hours).
Less than 1% of the data required truncation and two working definitions of ‘sufficient’ physical activity have been used in this report, derived from the information collected on total time and total sessions.
‘Sufficient’ time The first definition of ‘sufficient’ physical activity was based on the sum of the total minutes of walking, moderate-intensity and/or vigorous-intensity physical activity. ‘Sufficient’ health benefit was believed to be conferred if minutes walking, plus minutes moderate plus (twice vigorous minutes) is greater than, or equal to, 150 minutes. Vigorous - intensity physical activity was weighted by a factor of two, to account for its greater intensity. This definition is used to provide estimates of participation in the previous week and in the past six months (i.e. ‘usual’ week).
‘Sufficient’ time and sessions A second definition of ‘sufficient’ activity to confer a health benefit used in this report takes into account the frequency of participation. For this definition, ‘sufficient’ activity was only achieved when 150 minutes of activity (when vigorous - intensity activity is weighted by a factor of two) was accrued in at least five separate sessions of activity. This definition has been applied only to participation over the previous week.

21
2.6 Weighting The data collected in the survey were provided with weights that were used to obtain estimates representative of the national population. The age groups used for weighting were the standard age groups, except for the age group 70 – 74, which was replaced by 70 – 75. To allow for the impact of a greater proportion of interviews in New South Wales and the Australian Capital Territory, compared to the number of interviews in other States and Territories, data were down-weighted to an effective sample size of 3,000. This weighting was used when estimating the proportion of people who are physically active, and for statistical tests of significance at the national level. Additional details of the weights used are provided in Appendix 2.
2.7 Method of Significance Testing The level of significance (i.e. p) is the probability of rejecting the null hypothesis in a hypothesis test when it is actually true. Generally, a significance level of 5% is used with this type of analysis (i.e. we don’t want more than a 5% chance of rejecting the null hypothesis when it is actually true). The statistical testing undertaken for the ACT compared proportions (and means for time spent in activities) in the ACT with those for all of Australia. That is, the difference between two proportions, or two means, was tested to see if they were statistically significantly different, using a significance level of 5%. This was achieved by calculating 95% confidence intervals for each ACT proportion and for each Australian proportion to see whether confidence intervals overlapped or not. If the 95% confidence intervals did not overlap then there was a statistically significant difference at the 5% level. Conversely, if the confidence intervals did overlap, then the difference was not statistically significant, at the 5% level.
2.8 Predictor variables of participation Logistic regression was used to summarise associations between the socio-demographic predictor variables and participation in ‘sufficient’ physical activity. Adjusted odds ratios and 95% confidence intervals have been presented in the report, expressing the relationship between socio-demographic variables and various levels of participation in physical activity.

22
3. Demographic profile of survey respondents This section provides a demographic profile of ACT respondents who participated in the survey. The Australian Bureau of Statistics (ABS) Population Statistics Group (PSG) standards were used for the demographic categories of ‘age’, ‘sex’ and ‘main language spoken at home’. For the other demographic categories listed below, definitions used in the 1997 and 1999 surveys were adopted for comparability. The following demographic characteristics of respondents have been provided for both the ACT and Australia: • Age • Sex • Number of children under 18 years living in the household • Number of children aged 5 and under living in the household • Main language spoken at home • Marital status • Education level • Occupation • Body Mass Index (BMI).
3.1 Age and sex
Table 1: Age and sex of survey respondents (per cent), ACT, 2000.
Males Females Total
Age group (years)
ACT
2000 survey
ACT
Population
ACT
2000 survey
ACT
population
ACT
2000 survey
ACT
Population
18–29 30.5 29.6 29.5 27.8 30.0 28.7
30–44 34.2 31.9 35.4 33.1 34.8 32.5
45–59 24.9 26.8 24.2 27.0 24.5 26.9
60–75 10.4 11.7 10.9 12.2 10.7 11.9
Total 100.0 100.0 100.0 100.0 100.0 100.0
Note: ACT population data are for 2000.
A weighted sample for the ACT was derived using the actual sample of 512 respondents from the ACT. Table 1 shows that the distribution by age and sex of survey respondents from the ACT was comparable with the ACT population in 2000. Indeed, males comprised just under half (49%) of the total weighted sample and females comprised the remaining 51% of the sample. The distribution of the national sample was very similar, with males comprising 50% and females comprising 50% of the sample. The mean age of respondents in the ACT sample was 39.4 years, which was also very similar to the mean age in the national sample (41.8 years).

23
3.2 Children in the household
Table 2: Percentage of children in the household, ACT and Australia, 2000.
Household composition ACT Australia
Percentage of respondents Percentage of respondents
Children (aged 5 years or under)
Nil 82.3 81.7
1 or more 17.7 18.3
Total 100.0 100.0
Children (less than 18 years)
Nil 54.9 57.5
1 or more 45.1 42.5
Total 100.0 100.0
Note: Components may not add to totals due to rounding.
Table 2 shows that a slightly higher percentage of households in the ACT (45%) had at least one child aged under 18 years of age in 2000, compared to the national average (43%).
3.3 Language spoken, marital status, education level, occupation status
Table 3 shows that almost seven per cent of ACT respondents used a main language other than English at home in 2000, which was very similar to the national figure (7%). Table 3 also indicates that just over two-thirds of ACT respondents (67%) were married, or in a de facto relationship in 2000, which was also similar to the national figure (68%). The proportion of ACT respondents who were single, or had never married (31%) was slightly higher than the national average of 29% and the proportion of ACT respondents who were widowed (1.5%) was half that observed for the national sample (3%). Slightly less than one quarter of ACT respondents (23%) had had less than 12 years of education, while 37% had attained Higher School Certificate (HSC) or equivalent, and 40% had a tertiary education. Table 3 also shows that the distribution of ACT respondents by level of education was quite different to the national distribution. More than a third (34.8%) of respondents at the national level had had less than 12 years of education and only a quarter (26%) had a tertiary education. In terms of occupation, nearly 45% of ACT respondents were managers or administrators, 24% were in white collar professions, 5% worked in blue collar occupations, 9% were retired, 8% did home duties, 8% were students and 2% were unemployed. The distribution of ACT respondents by occupation was also different to the national distribution. For instance, there was a smaller proportion of managers or administrators at the national level (30%), more blue-collar workers (11%), more retirees (13%) and fewer students (5%).

24
Table 3: Language spoken, marital status, education level and occupation of survey respondents, ACT and Australia, 2000
ACT Australia
Percentage of respondents Percentage of respondents
Main language spoken at home
English 93.1 93.4
Other 6.9 6.6
Total 100.0 100.0
Marital status
Never married/single 31.3 28.7
Married/de facto 67.2 68.1
Widowed 1.5 3.2
Total 100.0 100.0
Education level
Less than 12 years 23.1 34.8
HSC or equivalent 36.8 39.5
Tertiary 40.1 25.7
Total 100.0 100.0
Occupation status
Manager/administrator 44.4 29.9
White collar 23.8 26.6
Retired 8.9 12.9
Home duties 7.7 12.8
Blue collar 5.0 10.6
Student 7.7 4.5
Unemployed 2.4 2.6
Total 100.0 100.0
HSC = Higher School Certificate. White collar = professional, para-professional. Blue collar = tradesperson, clerk, salesperson and personal service worker, plant and machine operator/driver, labourer.
Note: Components may not add to totals due to rounding.
3.4 Body mass index Body mass index (BMI) is a measure of an individual’s weight in relation to their height, calculated as weight in kilograms, divided by height in metres squared. Physical measurement of overweight and obesity was beyond the scope of this survey, but data were collected on self-reported height and weight for calculation of BMI. It has been shown that survey respondents generally are likely to overestimate their height and underestimate their weight, resulting in an underestimate of BMI.

25
The BMI categories are: • underweight: BMI less than 18.5 • healthy weight: BMI from 18.5 to less than 25 • overweight: BMI from 25 to less than 30 • obese: BMI greater than or equal to 30. Note that the previous cut-off point for BMI underweight from the National Health Medical Research Council was less than 20. However, the National Data Dictionary definition (based on the WHO criteria) cut-off point for the BMI underweight category is less than 18.5. This is the threshold that has been used in this report and it is used by AIHW for all Physical Activity reports and work related to BMI. The mean BMI of adults in the ACT in 2000 was 24.7, which was slightly lower than the national average of 25.2. Table 4 shows that 42% of ACT respondents were above a healthy weight (31% overweight and 11.5% obese) in 2000, which is of concern. In comparison, 45% of Australians were overweight (33%) or obese (12%) in 2000. Table 4 also shows that 54% of people in the ACT were within the healthy weight range, although 4% of the population was underweight.
Table 4: BMI categories of survey respondents by age, sex, education level (per cent), ACT and Australia, 2000
Underweight Healthy weight Overweight Obese
ACT Aust. ACT Aust. ACT Aust. ACT Aust.
Sex
Males 2.6 1.3 44.8 42.1 40.6 43.7 12.0 13.0
Females 4.7 5.6 63.5 61.0 20.8 22.4 11.0 11.0
Total 3.7 3.4 54.2 51.4 30.7 33.2 11.5 12.0
Age group (years)
18–29 7.1 7.2 68.3 62.5 19.1 24.2 5.5 6.1
30–44 2.2 2.4 48.6 53.4 36.0 32.3 13.1 11.9
45–59 3.1 1.5 50.6 43.1 30.0 39.2 16.4 16.2
60–75 0.0 2.5 39.8 43.0 48.2 39.6 12.0 14.9
Education level
Less than 12 years 3.0 2.9 44.8 46.5 38.0 34.2 14.3 16.5
HSC or equivalent 5.6 3.7 56.5 50.6 25.9 35.3 12.1 10.4
Tertiary 2.4 3.8 57.4 59.3 30.7 28.7 9.5 8.2
HSC = Higher School Certificate.

26
In the ACT, females were more likely to have a healthy weight (64%) compared to males (45%). A similar pattern was observed nationally, with 61% of females and 42% of males within the healthy weight range. With the exception of 45 – 59 year olds, the proportion of people in the healthy weight category in the ACT decreased with increasing age. Nationally, the prevalence of healthy weight also decreased with increasing age. The prevalence of healthy weight in the ACT also increased with increasing levels of education. This pattern was also observed nationally. Table 4 indicates that being underweight was more common among females (5%) in the ACT than males (3%). Nationally six per cent of females at the national level were underweight, compared with one per cent of males. The trends in obesity were very similar between the ACT and the national population. For instance, levels of obesity in the ACT and Australia were similar between males and females and increased with age, peaking in the 45 – 59 year age group. Obesity levels decreased with increasing levels of education.
27
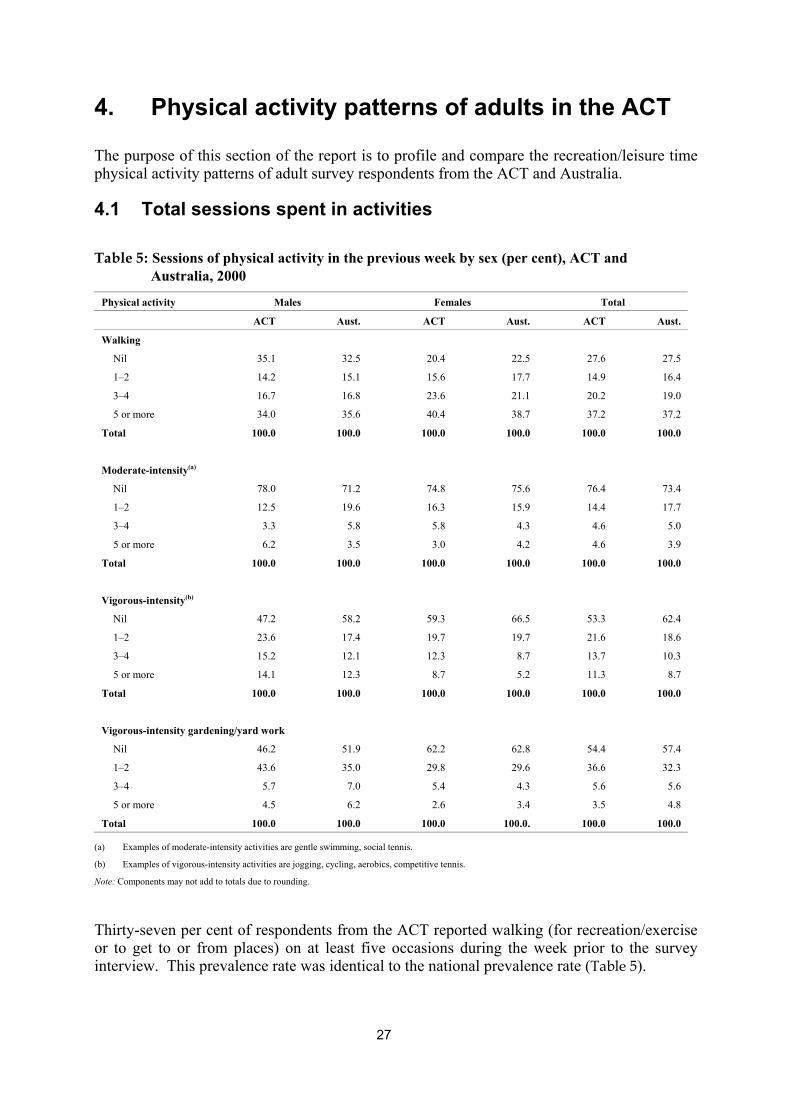
4. Physical activity patterns of adults in the ACT The purpose of this section of the report is to profile and compare the recreation/leisure time physical activity patterns of adult survey respondents from the ACT and Australia.
4.1 Total sessions spent in activities Table 5: Sessions of physical activity in the previous week by sex (per cent), ACT and
Australia, 2000
Physical activity Males Females Total
ACT Aust. ACT Aust. ACT Aust.
Walking
Nil 35.1 32.5 20.4 22.5 27.6 27.5
1–2 14.2 15.1 15.6 17.7 14.9 16.4
3–4 16.7 16.8 23.6 21.1 20.2 19.0
5 or more 34.0 35.6 40.4 38.7 37.2 37.2
Total 100.0 100.0 100.0 100.0 100.0 100.0
Moderate-intensity(a)
Nil 78.0 71.2 74.8 75.6 76.4 73.4
1–2 12.5 19.6 16.3 15.9 14.4 17.7
3–4 3.3 5.8 5.8 4.3 4.6 5.0
5 or more 6.2 3.5 3.0 4.2 4.6 3.9
Total 100.0 100.0 100.0 100.0 100.0 100.0
Vigorous-intensity(b)
Nil 47.2 58.2 59.3 66.5 53.3 62.4
1–2 23.6 17.4 19.7 19.7 21.6 18.6
3–4 15.2 12.1 12.3 8.7 13.7 10.3
5 or more 14.1 12.3 8.7 5.2 11.3 8.7
Total 100.0 100.0 100.0 100.0 100.0 100.0
Vigorous-intensity gardening/yard work
Nil 46.2 51.9 62.2 62.8 54.4 57.4
1–2 43.6 35.0 29.8 29.6 36.6 32.3
3–4 5.7 7.0 5.4 4.3 5.6 5.6
5 or more 4.5 6.2 2.6 3.4 3.5 4.8
Total 100.0 100.0 100.0 100.0. 100.0 100.0
(a) Examples of moderate-intensity activities are gentle swimming, social tennis.
(b) Examples of vigorous-intensity activities are jogging, cycling, aerobics, competitive tennis.
Note: Components may not add to totals due to rounding.
Thirty-seven per cent of respondents from the ACT reported walking (for recreation/exercise or to get to or from places) on at least five occasions during the week prior to the survey interview. This prevalence rate was identical to the national prevalence rate (Table 5).

28
Lower rates of regular vigorous-intensity or moderate-intensity activities were reported, with 11% of ACT respondents reporting they participated in vigorous-intensity activity at least five times, and only 5% of ACT respondents reporting that they participated in moderate-intensity physical activity on at least five occasions during the week prior to the survey interview. The national prevalence rates were slightly lower, with 9% of people undertaking vigorous-intensity activity at least five times during the week prior to the survey interview, and 4% undertaking moderate-intensity physical activity on at least five occasions during the previous week. Participation in regular (i.e. 5+ times) vigorous-intensity physical activity was more common among males (14%) in the ACT compared to females (9%) in 2000 (Table 5). Although the trend was similar for the national population, the rates were slightly lower (12% for males and 5% for females). Approximately 40% of people aged 18 – 29 years in the ACT reported doing vigorous-intensity activity on at least three occasions during the week preceding interview. In contrast, only 31% of people aged 18 – 29 years at the national level reported having exercised vigorously on at least three occasions in the previous week (Table 6). Walking was the most popular form of activity across all age groups and the most popular form of activity for both ACT and national respondents in 2000. Almost 45% of respondents aged 60 – 75 years in the ACT reported walking five or more times during the week preceding interview. In comparison, approximately 41% of 60 – 75 year olds at the national level reported walking five or more times in the previous week. Almost 40% of respondents aged 18 – 29 years in the ACT reported walking five or more times during the previous week, which was slightly higher than the national average of 38%. Undertaking vigorous-intensity gardening and yard-work, on at least three occasions, was more common among older age groups (i.e. 45+ years) in the ACT. This was also true for respondents from the national sample.

29
Table 6: Sessions of physical activity in the previous week, by age group (per cent), ACT and Australia, 2000
Age group (years)
Physical activity 18–29 30–44 45–59 60–75
ACT Aust. ACT Aust. ACT Aust. ACT Aust.
Walking
Nil 22.3 26.0 32.3 27.7 27.1 27.3 28.2 29.4
1–2 10.5 17.1 16.0 17.9 19.8 17.5 12.8 10.5
3–4 27.3 18.8 18.2 19.3 16.9 18.8 14.5 18.8
5 or more 39.9 38.1 33.5 35.1 36.2 36.3 44.4 41.3
Total 100.0 100.0 100.0 100.0 100.0 100.0 100.0 100.0
Moderate-intensity(a)
Nil 75.1 68.9 79.7 736. 76.3 79.4 69.7 71.0
1–2 16.4 20.8 11.6 19.0 16.4 12.7 13.8 17.9
3–4 4.3 6.8 4.0 4.0 3.7 4.0 9.4 5.8
5 or more 4.2 3.5 4.8 3.4 3.6 3.9 7.1 5.3
Total 100.0 100.0 100.0 100.0 100.0 100.0 100.0 100.0
Vigorous-intensity(b)
Nil 40.6 42.1 54.4 60.2 56.2 71.1 79.3 85.4
1–2 19.9 26.6 24.4 21.4 23.5 13.8 13.2 7.6
3–4 25.3 16.6 9.7 10.8 10.1 8.4 2.5 2.7
5 or more 14.3 14.8 11.6 7.7 10.2 6.7 5.0 4.2
Total 100.0 100.0 100.0 100.0 100.0 100.0 100.0 100.0
Vigorous-intensity gardening/yard work
Nil 68.2 70.0 50.1 52.1 44.6 53.1 52.1 54.7
1–2 28.9 21.9 40.7 39.5 41.6 34.8 33.2 30.1
3–4 2.0 3.7 7.4 5.2 7.7 6.9 4.9 7.6
5 or more 1.0 4.4 1.9 3.3 6.1 5.2 9.7 7.6
Total 100.0 100.0 100.0 100.0 100.0 100.0 100.0 100.0
(a) Examples of moderate-intensity activities are gentle swimming, social tennis; (b) Examples of vigorous-intensity activities are jogging, cycling, aerobics, competitive tennis.
Note: Components may not add to totals due to rounding.

30
4.2 Total time spent in activities Table 7 further illustrates that walking was the most popular physical activity undertaken by respondents in 2000. The next most popular activity was vigorous-intensity activity, followed by vigorous-intensity gardening. The least amount of time was spent in undertaking moderate-intensity activity.
Table 7: Total time (minutes) for physical activity during the previous week, ACT and Australia, 2000
Walking Moderate-intensity Vigorous-intensity Vigorous gardening(a)
ACT Australia ACT Australia ACT Australia ACT Australia
Mean 127 124 49 48 91 68 73 76
75th percentile 180 180 0 20 120 70 90 90
95th percentile 420 420 240 270 420 360 360 360
(a) Vigorous-intensity gardening and yard work.
While walking was also the most popular time spending activity reported nationally, vigorous-intensity gardening was the second most popular time spending activity. Vigorous-intensity activity was the third most popular time spending activity reported nationally. Table 8 and Table 9 show that walking was also the most popular form of physical activity for both males and females in the ACT and national samples.
Table 8: Mean minutes for physical activity during the previous week, by age group and sex, ACT, 2000
Walking Moderate-intensity Vigorous-intensity Vigorous gardening(a)
Age group (years) Males Females Males Females Males Females Males Females
18–29 115.5 175.6 79.2 53.4 175.8 163.3 38.3 36.4
30–44 108.6 115.0 31.1 33.5 94.0 55.8 96.6 63.9
45–59 108.1 121.0 49.0 26.4 58.1 42.2 126.5 54.0
60–75 167.6 130.6 67.2 88.3 22.5 11.3 110.1 115.4
All ages 116.7 136.0 54.0 43.6 102.6 79.3 87.7 59.0
(a) Vigorous-intensity gardening and yard work.
In each age group, males in both the ACT and national samples spent more time, on average, undertaking vigorous-intensity physical activity than females. Males in the ACT also spent more time, on average, doing vigorous-intensity gardening and yard-work than females. This pattern was observed in all age groups, except the 60 – 75 years age group.

31
Table 9: Mean minutes for physical activity during the previous week, by age group and sex, Australia, 2000
Walking Moderate-intensity Vigorous-intensity Vigorous gardening(a)
Age group (years) Males Females Males Females Males Females Males Females
18–29 124.8 128.3 68.3 31.0 157.5 79.4 69.1 23.0
30–44 98.8 125.8 44.7 31.4 84.1 51.2 96.7 61.1
45–59 120.5 136.0 47.3 36.1 51.0 35.6 122.1 71.2
60–75 132.4 136.1 81.1 73.5 38.9 15.5 104.9 70.8
All ages 116.4 130.7 57.3 39.6 87.6 48.5 97.2 55.5
(a) Vigorous-intensity gardening and yard work.
On average, males aged 18 – 29 years in the ACT spent most of their time in the week preceding interview undertaking vigorous-intensity activity, while males aged 30 – 44 years spent most of their time walking and males aged 45 – 69 years spent most of their time undertaking vigorous gardening and walking. Older males in the ACT reported the highest average time for walking per week. On average, female respondents in the ACT aged 18 – 44 years, and those aged 60 – 75 years, spent most of their time walking in the week preceding interview, while females aged 45 – 59 years spent most of their time undertaking vigorous gardening. Finally, the tables above also indicate that younger female and older male respondents in the ACT spent more time walking on average than did their national counterparts (176 minutes in the ACT compared with 128 minutes nationally for females aged 18 – 29 years; and 168 minutes in the ACT compared with 132 minutes nationally for males aged 60 – 75 years).
4.3 Measures of physical activity This section describes patterns of inactivity and physical activity to confer a health benefit in the ACT and Australia. Physical activity to confer a health benefit is defined in two ways:
− ‘sufficient’ time (150 minutes per week, using the sum of walking, moderate activity and vigorous activity (weighted by two));
− ‘sufficient’ time and sessions (150 minutes and five sessions of activity per week).
4.3.1 Physical inactivity In 2000, approximately 13% of respondents in the ACT reported undertaking no leisure-time physical activity during the week preceding the survey interview. In comparison, a slightly greater proportion of adults (15%) reported being sedentary, at the national level (Table 10). Sedentary behaviour, or inactivity, increased with age, from 9% in people 18 – 29 years to 21% in those aged 60 years and over. With the exception of 60 – 75 year olds, respondents in the ACT were less likely to be inactive than respondents of the same age nationally.

32
The prevalence of sedentary behaviour in respondents from the ACT with less than 12 years of education (18%), was more than twice that of respondents with a tertiary education (7%). The results from the national sample were again, very similar. Table 10: Percentage of respondents reporting no physical activity during the week preceding the survey interview, ACT and Australia, 2000
ACT Australia
Sex
Males 14.3 17.5
Females 11.8 13.2
Total 13.0 15.3
Age group (years)
18–29 8.7 10.2
30–44 13.7 15.6
45–59 13.9 18.2
60–75 21.0 18.4
Education
Less than 12 years 17.8 20.2
HSC or equivalent 16.7 13.9
Tertiary 6.9 10.8
HSC = Higher School Certificate.
4.3.2 Physical activity to confer a health benefit
‘Sufficient’ time Table 11 indicates that almost two-thirds (63%) of ACT respondents were undertaking ‘sufficient’ time in physical activity to obtain a health benefit in 2000, which was slightly higher than the national average (57%). In addition, there was little difference in the proportion of males and females, in both samples, participating for a ‘sufficient’ time in activity. However, participation for a ‘sufficient’ time in physical activity decreased with age in the ACT sample, whilst at the national level, respondents aged 60 – 75 years were as likely as those aged 30 – 44 years to be undertaking physical activity for a ‘sufficient’ time to confer a health benefit. In the ACT, participation for a ‘sufficient’ time in physical activity was greater among those with a tertiary education (73%). In contrast, only 62% of the national sample, with a tertiary education, participated for a ‘sufficient’ time in activity. Participation for a ‘sufficient’ time was slightly less common among respondents living in the ACT with a HSC (or equivalent) level of education (56%), compared to those with less than 12 years of education (58%). However, the reverse was observed at the national level (i.e. 51% among those with less than 12 years education and 59% for those with HSC).

33
Approximately one in four respondents (24%) from the ACT had undertaken some form of physical activity in the week preceding interview, but their activity levels were too low to be categorised as ‘sufficient’ in terms of time spent. In comparison, 28% of the national sample participated in some form of physical activity that was ‘insufficient’ to obtain a health benefit in 2000. Table 11: Percentage of respondents undertaking physical activity for a ‘sufficient’ time
during the week preceding the survey interview, by sex, age group and education level, ACT and Australia, 2000
Sedentary ‘Insufficient’ ‘Sufficient’(a)
ACT Aust. ACT Aust. ACT Aust.
Sex
Males 14.3 17.5 22.2 24.9 63.6 57.6
Females 11.8 13.2 25.7 30.8 62.5 56.0
Total 13.0 15.3 24.0 27.9 63.0 56.8
Age group (years)
18–29 8.7 10.2 18.2 21.3 73.2 68.5
30–44 13.7 15.6 25.1 30.2 61.2 54.2
45–59 13.9 18.2 29.7 32.0 56.4 49.8
60–75 21.0 18.4 23.5 27.2 55.5 54.4
Education
Less than 12 years 17.8 20.2 24.4 29.2 57.9 50.6
HSC or equivalent 16.7 13.9 27.6 27.4 55.7 58.8
Tertiary 6.9 10.8 20.5 26.9 72.7 62.3
HSC = Higher School Certificate.
(a) ‘Sufficient’ time is defined as 150 minutes per week, using the sum of walking, moderate activity and vigorous activity weighted by two).
‘Insufficient’ levels of participation were more common among females (26%) in the ACT than males (22%). The corresponding national proportions were slightly higher - 31% for females and 25% for males. ‘Insufficient’ levels of participation increased with age, until age 60, in both the ACT and national samples. An analysis of eduction levels indicates insufficient’ participation was most common in the ACT among respondents who had attained their HSC or equivalent (28%). In contrast, at the national level, respondents that had completed less than 12 years of school were more likely to have engaged in physical activity at a level that was not ‘sufficient’ to obtain a health benefit (29%).

34
‘Sufficient’ time in physical activity by age and sex In the ACT, participation for a ‘sufficient’ time in physical activity decreased with age in females, although there was little difference in prevalence rates in the three older age groups (Figure 1). Among males (Figure 2), prevalence also decreased with age until 60 years.
Figure 1: Percentage of female respondents engaged for a ‘sufficient’ time in physical activities during the week prior to the survey interview, by age, ACT and Australia, 2000.
0
10
20
30
40
50
60
70
80
18–29 30–44 45–59 60–75 All agesAge Group (Years)
Per cent
ACT
Australia
Note: 'Suf f icient ' t ime is def ined as 150 mins. per week, using the sum of walking, moderate act ivity and vigorous act ivity (weighted by two).
At the national level, the pattern observed for males was the same as that observed for the ACT, however, the pattern for females differed, in that Australian females aged 60 – 75 years had a higher prevalence of ‘sufficient’ time engaged in physical activity compared to those aged 45 – 59 years.

35
Figure 2: Percentage of male respondents engaged for a ‘sufficient’ time in physical activities during the week prior to the survey interview, by age, ACT and Australia, 2000.
0
10
20
30
40
50
60
70
80
18–29 30–44 45–59 60–75 All agesAge Group (Years)
Per cent
ACT
Australia
Note: 'Suff icient ' t ime is def ined as 150 mins. per week, using the sum of walking, moderate act ivity and vigorous act ivity (weighted by two).
‘Sufficient’ time and sessions
Table 12 suggests that more than half (52%) of the ACT respondents had participated in a level of physical activity, during the week preceding interview, that was ‘sufficient‘ in terms of the time and sessions required to confer a health benefit (i.e. 150 minutes and five sessions per week). This was slightly greater than the proportion participating for ‘sufficient’ time and sessions at the national level (46%) in 2000. The prevalence of ‘sufficient’ time and sessions engaged in physical activity in the week preceding interview was higher among younger (i.e. 18 – 29 years) ACT respondents (64%) and lower among respondents between 45 – 59 years (46%). These prevalence rates were higher than the corresponding national rates (58% for those between 18 – 29 years and 41% for those between 45 – 59 years). ACT adults with tertiary qualifications had the highest prevalence of ‘sufficient’ time and sessions engaged in physical activity (58%), by level of education. Adults with less than 12 years of education had a higher prevalence (51%) than those with HSC or equivalent (47%). In contrast, at the national level, only 39% of adults, with less than 12 years at school, had undertaken activity for a ‘sufficient’ time and ‘sufficient’ sessions in the week prior to the survey interview.

36
Table 12: Percentage of respondents undertaking physical activity for a ‘sufficient’ time and sessions, during the week prior to the survey interview, by sex, age group and education level, ACT and Australia, 2000
Sedentary ‘Insufficient’ ‘Sufficient’(a)
ACT Aust. ACT Aust. ACT Aust.
Sex
Males 14.3 17.5 34.6 35.7 51.2 46.8
Females 11.8 13.2 35.3 41.3 52.9 45.5
Total 13.0 15.3 34.9 38.5 52.1 46.1
Age group (years)
18–29 8.7 10.2 27.8 32.0 63.6 57.8
30–44 13.7 15.6 39.3 42.4 47.1 42.0
45–59 13.9 18.2 39.7 40.5 46.4 41.3
60–75 21.0 18.4 29.9 38.0 49.1 43.6
Education
Less than 12 years 17.8 20.2 31.4 40.9 50.8 38.9
HSC or equivalent 16.7 13.9 36.8 37.6 46.5 48.5
Tertiary 6.9 10.8 35.2 36.8 57.9 52.5
HSC = Higher School Certificate.
(a) ‘Sufficient’ time and sessions is defined as 150 minutes (using the sum of walking, moderate activity and vigorous activity (weighted by two)) and five sessions of activity per week.

37
5. Awareness and understanding of physical activity media messages
5.1 Message recall To assess the impact of the Active Australia campaign, respondents were asked if they recalled any generic messages about exercise and physical activity. They were also asked whether they had heard of the Active Australia campaign and whether they could recall the 1998–99 campaign tagline.
5.1.1 Recall of generic messages about physical activity and exercise Table 13 shows a greater proportion of respondents from the ACT (75%) recalled that they had heard, or seen messages about physical activity in the month preceding the survey interview, compared to respondents from the national sample (66%). The difference in recall rates between population samples was statistically significant at the 5% level. Table 13: Percentage of respondents recalling generic messages about exercise and
physical activity, ACT and Australia, 2000
ACT Australia
Sex
Males 73.4 64.7
Females 77.2 68.0
Total 75.3 66.4
Age group (years)
18–29 79.7 68.1
30–44 74.1 67.3
45–59 69.8 65.8
60–75 80.0 62.6
Education
Less than 12 years 65.2 62.6
HSC or equivalent 77.8 69.1
Tertiary 78.9 67.6
HSC = Higher School Certificate.
Recall of generic physical activity messages was more common among females (77%) compared to males (73%) in the ACT. This pattern was also observed nationally and the rate of recall among ACT females (77%) was significantly higher (at the 5% level) than the level of recall among females from the national sample (68%).

38
The highest rates of recall for generic physical activity messages were observed in the youngest and oldest age groups in the ACT, while nationally the oldest age group had the lowest prevalence rate. The difference in rates for respondents between 60 – 75 years in the ACT (80%) and Australia (63%) was statistically significant at the 5% level. Recall rates also varied with education levels. For instance, ACT adults with HSC or tertiary educations had the highest recall rates (78% and 79% respectively). This was also observed in the national sample, although recall rates were lower than the ACT rates. The recall rate among ACT adults with a tertiary education was significantly higher (at the 5% level) than the rate for Australia (68%).
5.1.2 Recall of the Active Australia campaign In 2000, approximately 58% of ACT adult respondents reported having heard of the Active Australia campaign, while only 23% of national respondents had heard of the campaign (Table 14). The difference in recall between the two population samples was statistically significant at the 5% level. Recall of the Active Australia campaign was also higher among females, compared to males, in both the ACT and national samples. Table 14: Percentage of respondents recalling the unprompted Active Australia
campaign, ACT and Australia, 2000
ACT Australia
Sex
Males 55.2 22.6
Females 60.8 24.1
Total 58.1 23.3
Age group (years)
18–29 65.2 25.4
30–44 64.5 24.0
45–59 50.9 22.2
60–75 33.4 20.5
Education
Less than 12 years 45.2 20.7
HSC or equivalent 64.4 23.5
Tertiary 59.6 26.5
HSC = Higher School Certificate.

39
In the ACT, recall of the Active Australia campaign decreased as age increased. A similar pattern was observed nationally, although national rates were markedly lower than those observed for the ACT. Recall rates for the Active Australia campaign were higher among adult respondents in the ACT with an HSC (or equivalent) level of education (64%), followed by those with a tertiary education (60%). This differed from the pattern nationally, where those with a tertiary education had a higher recall rate (27%) than those with an HSC (or equivalent) level of education (24%). With the exception of ACT adults aged 60 – 75 years, ACT recall rates for the Active Australia campaign were significantly higher (at the 5% level) than rates from the national sample, by sex, age group and level of education.
5.1.3 Recall of the Active Australia tagline With the exception of ACT respondents aged 60 – 75 years, rates of recall for the Active Australia tagline ‘Exercise — you only have to take it regularly’, were also significantly higher (at the 5% level) among ACT respondents, compared to national respondents, by sex, age group and level of education. Table 15: Percentage of respondents recalling the prompted Active Australia tagline
‘Exercise — you only have to take it regularly, not seriously’, ACT and Australia, 2000
ACT Australia
Sex
Males 67.6 35.4
Females 70.6 41.8
Total 69.2 38.6
Age group (years)
18–29 71.9 38.6
30–44 74.0 36.9
45–59 65.3 40.1
60–75 54.4 40.0
Education
Less than 12 years 61.4 38.6
HSC or equivalent 76.7 38.3
Tertiary 66.7 39.2
HSC = Higher School Certificate.

40
Almost 70% of ACT adults recalled the prompted Active Australia tagline (Table 15). The overall recall rate for the ACT was significantly higher (at the 5% level) than the national rate (39%). Recall was higher among females in the ACT, compared to males. It was higher among respondents between 18 – 44 years compared to those between 45 – 75 years, and higher among those with an HSC (or equivalent) level of education, compared to those with a tertiary education, or those with less than 12 years of education at school. At the national level, females had higher tagline recall rates than males, however, there was little difference in recall rates across age groups, or education levels.
5.2 Understanding of physical activity messages It is generally accepted that individuals in society need to be able to recognise and understand public health messages in order to modify existing patterns of behaviour. To assess whether individuals remembered particular messages about physical activity, respondents were asked to rate (on a five-point Likert scale) the extent to which they agreed with the statements below: Message 1: Taking the stairs at work or generally being more active for at least 30 minutes
each day is enough to improve your health. Message 2: Half an hour of brisk walking on most days is enough to improve your health. Message 3: To improve your health it is essential for you to do vigorous exercise for at
least 20 minutes each time, three times a week. Message 4: Exercise doesn’t have to be done all at one time — blocks of 10 minutes are
okay. Table 16 shows ACT respondent’s levels of agreement with these statements, using combined ‘strongly agree’ and ‘agree’ categories versus other categories (i.e. ‘neutral’, ‘disagree’, ‘strongly disagree’). In the ACT, there was a very strong level of agreement (85% and 92% respectively) to statements about moderate activity (i.e. Messages 1 and 2). At the national level, approximately 88% of adults agreed with Message 1 and 92% agreed with Message 2 (Table 16). Message 3, that ‘vigorous activity three times per week for 20 minutes each time was essential’ to obtain a health benefit is an outdated public health message, suggesting that only participation in vigorous physical activity is beneficial for health. Sixty per cent of respondents from both the ACT and national samples agreed with this message. Similar results were obtained for both the ACT and national population for Message 4. Indeed, just over three-quarters (76%) of respondents from the ACT and 79% of respondents from the national sample agreed that ‘exercise doesn’t have to be done all at one time’.

41
Table 16: Percentage of respondents agreeing (combined ‘strongly agree’ and ‘agree’) with knowledge statements, ACT and Australia, 2000
Message 1 Message 2 Message 3 Message 4
ACT Aust. ACT Aust. ACT Aust. ACT Aust.
Sex Males 86.3 86.5 89.2 90.4 64.4 63.6 72.0 77.5 Females 84.1 89.6 95.3 93.7 56.5 56.4 79.9 80.3 Total 85.2 88.0 92.3 92.0 60.4 59.9 76.1 78.9
Age group (years)
18–29 81.1 88.4 90.2 92.5 67.1 65.2 76.4 75.4 30–44 88.3 89.2 93.6 92.3 54.0 63.0 76.1 77.7 45–59 88.0 87.7 92.7 93.2 62.7 58.2 73.1 81.3 60–75 80.3 85.6 93.1 89.1 56.5 48.1 82.2 83.3
Education
Less than 12 years 82.0 88.1 88.4 91.0 58.8 57.6 68.3 81.6 HSC or equivalent 85.7 87.2 93.2 92.3 63.2 63.1 78.2 79.1 Tertiary 86.6 89.6 93.7 93.4 58.6 58.4 78.6 75.2
Message 1: Taking the stairs at work or generally being more active for at least 30 minutes each day is enough to improve your health.
Message 2: Half an hour of brisk walking on most days is enough to improve your health.
Message 3: To improve your health it is essential for you to do vigorous exercise for at least 20 minutes each time, three times a week.
Message 4: Exercise doesn’t have to be done all at one time—blocks of 10 minutes are okay. HSC = Higher School Certificate.
Adult respondents from the ACT, with less than 12 years education at school, were significantly (at the 5% level) less likely to agree with Message 4 compared to their national counterparts (68% in the ACT compared with 82% at the national level).
5.3 Intentions to become more active The intention to become more active, at the population level, is an intermediate outcome; a precursor to a change in behaviour and an actual increase in physical activity levels. The question that was asked in the survey was designed to monitor this intermediate outcome by asking respondents whether they a) did not intend to increase their activity levels, b) intended to increase activity levels in the short term (over the next month), or c) intended to increase activity levels in the longer term (over the next six months). In 2000, almost one-third (32%) of ACT respondents indicated that they did not intend to become more physically active, which is of concern, especially since this proportion was lower than the national average of 37% (Table 17). However, 44% of respondents from the ACT indicated that they intended to become more physically active in the next month compared to 37% from the national sample. The proportion of ACT respondents intending to become more physically active in the next month was significantly higher (at the 5% level) than the corresponding national sample. Almost one-quarter (23%) of ACT adults indicated that they intended to become more physically active over the next six months compared to 26% nationally.

42
Table 17: Percentage of respondents intending to be more physically active, ACT and Australia, 2000
Do not intend Intend next month Intend next 6 months
ACT Aust. ACT Aust. ACT Aust.
Sex
Males 34.2 39.8 43.9 37.5 21.9 22.8
Females 30.6 34.8 44.5 36.4 24.9 28.8
Total 32.4 37.3 44.2 36.9 23.4 25.8
Age group (years)
18–29 20.1 28.1 50.7 43.0 29.3 28.9
30–44 34.2 31.4 43.7 37.3 22.2 28.6
45–59 34.9 36.0 45.3 38.2 19.8 25.8
60–75 55.5 59.8 25.3 24.9 19.1 15.4
Education
Less than 12 years 41.8 43.5 35.9 34.0 22.3 22.4
HSC or equivalent 28.4 32.9 48.9 38.1 22.7 29.0
Tertiary 30.6 34.9 44.8 39.4 24.6 25.7
HSC = Higher School Certificate.
Figure 3 shows ‘any intention to be active’ (combined intention in the next month and next six months) by sex and age group. As can be seen, females from the ACT were more likely to report an intention to become more active than males, across all age groups, except for the 60 – 75 years age group. Nationally, females in all age groups were more likely to indicate an intention to become more active, compared to males.

43
Figure 3: Any intention to be more active (next month and in the next six months), ACT, 2000.
5.4 Factors associated with participation Logistic regression was used to identify the characteristics of respondents that were associated with participation in sufficient physical activity. Forced entry regression models, which include non-significant variables, are shown in Table 18 with adjusted odds ratios and 95% confidence intervals (CIs). The odds ratios in the tables present the ratio of the odds of participation in physical activity. The odds ratios have been adjusted (de-confounded) for the effect of other variables, to the extent that is possible. Therefore, the odds ratios represent the independent effect of each variable concerned. An odds ratio range (in brackets), which does not include the ‘reference’ value of 1.00, indicates statistical significance.
5.4.1 ‘Sufficient’ physical activity The data in Table 18 indicate that occupation and marital status were the two major factors significantly associated with an increased likelihood of participation in ‘sufficient’ time in physical activity, after adjusting for all other factors. Indeed, the table shows that blue-collar workers were 81% less likely to achieve a ‘sufficient’ time level of physical activity, compared to managers, while the unemployed were 78% more likely to achieve the same level as managers. ‘Sufficient’ time participation among those who were single, or never married, was four times greater than that of those who were married or in de facto relationships.
0
10
20
30
40
50
60
70
80
90
100
18–29 30–44 45–59 60–75 All ages
MalesFemales
Percent
Age group (years)

44
Table 18: Factors associated with participation in ‘sufficient’ time and time and sessions in physical activity, ACT and Australia, 2000
Other results of interest were that respondents with a tertiary education were more likely (77%) than respondents with less than 12 years education at school to participate in physical activity for a ‘sufficient’ time to confer a health benefit; the odds of ‘sufficient’ time participation was significantly lower (49%) among respondents aged 60 – 75 compared to those aged 18 – 29 years; and respondents speaking English at home were twice as likely as those whose main language was not English to participate in physical activity for a ‘sufficient’ time.
ACT Australia
‘Sufficient’ time (a) ‘Sufficient’ time ‘Sufficient’ time (a) ‘Sufficient’ time and sessions (b) and sessions (b) Adj.Odds 95% Adj.Odds 95% Adj.Odds 95% Adj.Odds 95% Ratio CIs Ratio CIs Ratio CIs Ratio CIs Sex Males 1.00 - 1.00 - 1.00 - 1.00 - Females 0.91 (0.60-1.40) 1.14 (0.6-1.71) 0.97 (0.82-1.15) 0.96 (0.81-1.13) Age group (years) 18-29 1.00 - 1.00 - 1.00 - 1.00 - 30-44 0.86 (0.46-1.63) 0.66 (0.37-1.17) 0.64 (0.50-0.81) 0.63 (0.50-0.79) 45-59 0.65 (0.31-1.33) 0.68 (0.35-1.34) 0.49 (0.37-0.64) 0.57 (0.44-0.74) 60-75 0.51 (0.18-1.40) 0.59 (0.23-1.57) 0.52 (0.36-0.76) 0.54 (0.37-0.78) Education Less than 12 years 1.00 - 1.00 - 1.00 - 1.00 - HSC or equivalent 0.76 (0.45-1.29) 0.72 (0.43-1.21) 1.16 (0.96-1.39) 1.25 (1.04-1.50) Tertiary 1.77 (0.97-3.21) 1.17 (0.67-2.06) 1.30 (1.04-1.63) 1.42 (1.14-1.78) Occupation Manager 1.00 - 1.00 - 1.00 - 1.00 - White collar 0.84 (0.48-1.48) 0.69 (0.40-1.18) 0.82 (0.66-1.02) 0.84 (0.67-1.04) Blue collar 0.19 (0.07-0.54) 0.31 (0.11-0.84) 0.63 (0.47-0.85) 0.62 (0.46-0.83) Unemployed 1.78 (0.39-8.23) 2.33 (0.59-9.30) 0.78 (0.47-1.28) 0.64 (0.39-1.04) Home duties 1.41 (0.62-3.20) 1.01 (0.46-2.24) 0.77 (0.58-1.02) 0.79 (0.59-1.05) Student 0.57 (0.21-1.56) 1.48 (0.58-3.78) 0.82 (0.53-1.26) 0.98 (0.65-1.47) Retired 1.57 (0.64-3.84) 1.59 (0.67-3.76) 1.22 (0.88-1.71) 1.28 (0.92-1.79) Main language spoken at home English 1.00 - 1.00 - 1.00 - 1.00 - Other 0.55 (0.25-1.18) 0.60 (0.29-1.27) 0.75 (0.55-1.02) 0.66 (0.49-0.90) Marital status Married/de facto 1.00 - 1.00 - 1.00 - 1.00 - Never married/single 3.96 (1.96-7.99) 2.17 (1.18-3.97) 1.21 (0.96-1.51) 1.19 (0.95-1.48) Widow 0.60 (0.12-3.00) 0.39 (0.07-2.18) 0.68 (0.44-1.07) 0.79 (0.50-1.25) Children (less than 5 years) Nil 1.00 - 1.00 - 1.00 - 1.00 - One or more 0.61 (0.33-1.13) 0.89 (0.49-1.63) 0.71 (0.56-0.91) 0.79 (0.62-1.00) Children (less than 18 years) Nil 1.00 - 1.00 - 1.00 - 1.00 - One or more 1.24 (0.74-2.07) 1.33 (0.81-2.18) 0.97 (0.80-1.19) 0.94 (0.77-1.14) BMI categories Healthy weight 1.00 - 1.00 - 1.00 - 1.00 - Underweight 0.52 (0.17-1.58) 0.47 (0.16-1.39) 0.78 (0.51-1.19) 0.92 (0.60-1.40) Overweight 0.77 (0.49-1.23) 1.08 (0.70-1.68) 1.00 (0.84-1.18) 0.96 (0.81-1.14) Obese 0.61 (0.33-1.16) 0.63 (0.34-1.18) 0.64 (0.50-0.82) 0.64 (0.50-0.83) Recall of Active Australia tagline ‘Exercise – you only have to take it regularly, not seriously’ Yes 1.00 - 1.00 - 1.00 - 1.00 - No 1.54 (0.98-2.44) 1.73 (1.13-2.65) 0.95 (0.81-1.10) 0.97 (0.83-1.13)
HSC = Higher School Certificate. White collar = professional, para-professional. Blue collar = tradesperson, clerk, salesperson and personal service worker, plant and machine operator/driver, labourer. BMI= body mass index.
BMI categories are: underweight = BMI less than 18.5; healthy weight = BMI from 18.5 to less than 25; overweight = BMI from 25 to less than 30; obese = BMI greater than or equal to 30.
(a) ‘Sufficient’ time is defined as 150 minutes per week, using the sum of walking, moderate activity and vigorous activity (weighted by two).
(b) ‘Sufficient’ time and sessions is defined as 150 minutes (using the sum of walking, moderate activity and vigorous activity (weighted by two)) and five sessions of activity per week.

45
In comparison, analysis at the national level shows an association between age and participation, with the odds of ‘sufficient’ time participation significantly lower among the ‘older’ age groups (aged 30 – 75 years) compared to those aged 18 – 29 years. As in the ACT, blue-collar workers were 37% less likely than managers to participate in physical activity for a ‘sufficient’ time to confer a health benefit. The table also shows that nationally respondents with one or more children under the age of five years were 29% less likely than those with no children under five years to participate in ‘sufficient’ time physical activity. ACT respondents with one or more child under the age of five years were 39% less likely to participate in ‘sufficient’ time physical activity, however this was not statistically significant. Finally, nationally respondents who were obese at the time of interview were 36% less likely than those with a healthy weight to participate in ‘sufficient’ time physical activity.
5.4.2 ‘Sufficient’ time and sessions The factors associated with sufficient physical activity in time and sessions were similar. After adjusting for all other factors, occupation, marital status and recall of the Active Australia tagline were the only factors significantly associated with an increased likelihood of participation by ACT respondents in ‘sufficient’ time and sessions engaged in physical activity. Blue collar workers, from the ACT sample were 69% less likely to have undertaken physical activity for a ‘sufficient’ time and a ‘sufficient’ number of sessions, compared to managers, however, unemployed respondents were more than twice as likely to achieve ‘sufficient’ time and session levels, compared to managers. The odds of ‘sufficient’ time and sessions participation among ACT respondents who were single or never married was just over twice that of those who were married or in de facto relationships. ACT respondents who did not recall the Active Australia tagline were significantly more likely to participate in ‘sufficient’ time and sessions physical activity (odds ratio of 1.7) than those who did recall the tagline. In comparison, analysis at the national level shows that the odds of ‘sufficient’ time and sessions participation was significantly lower among respondents aged over 30 years, compared to those aged 18 – 29 years. Blue-collar workers from the national sample were 38% less likely than managers to participate in ‘sufficient’ time and sessions physical activity. However, the unemployed were similar to the blue-collar workers, as they were 36% less likely than managers to participate in ‘sufficient’ time and sessions physical activity. Respondents whose main language was not English were 34% less likely than those whose main language was English to participate in ‘sufficient’ time and sessions physical activity, and those who were obese were 36% less likely than those of healthy weight to participate in ‘sufficient’ time and sessions physical activity.

46
6. Discussion This report presents the ACT results from the 2000 National Physical Activity Survey. The survey provides a reliable, detailed baseline for future monitoring and surveillance of adult physical activity levels in the ACT. Overall, the results show that ACT residents reported higher levels of leisure time physical activity and higher levels of awareness of the importance of physical activity to health among adults in 2000, compared to adults at the national level. The higher activity levels reflect in part the demographic profile of the ACT, as blue-collar workers were significantly less likely to engage in ‘sufficient’ leisure time physical activity and only 5% of ACT respondents were employed in blue-collar occupations, compared with 11% of respondents nationally. It is important to note that occupational and incidental physical activities people undertake were not captured in this survey. Methods to accurately assess these types of activities and to relate them to health are yet to be fully developed and validated. The results of the survey indicate that a higher proportion of adults in the ACT (54%) had a healthy weight (BMI 18.5 – 24.9) in 2000, compared to adults nationally (51%) and average BMIs were lower for the ACT (24.7) than for Australia (25.2). However, the data are likely to overestimate the true prevalence of healthy weight in the population, as the survey relied upon self-reporting of weight and height information by telephone interview. The results therefore suggest that at least 46% of the ACT population had an unhealthy weight in 2000. Current public health guidelines in Australia indicate that ‘sufficient’ participation in physical activity comprises at least 150 minutes of moderate-intensity activity accrued over at least five sessions per week. According to this definition 52% of ACT residents were participating in ‘sufficient’ physical activity to obtain a health benefit. This was slightly higher than reported nationally (46%). There is also evidence that participation in at least 150 minutes of walking and/or moderate-intensity physical activity, and/or vigorous-intensity physical activity per week may be of benefit, regardless of the number of sessions of activity. According to this less conservative definition, 63% of ACT residents were obtaining a health benefit from physical activity in 2000, compared with 57% nationally. The results show that ACT adults preferred walking as their leisure time physical activity of choice. They were more inclined to walk for a longer period, and to walk more often, than any other form of activity included in the survey. Results were very similar at the national level. The results of the survey also showed that a smaller proportion of respondents from the ACT (13%) were sedentary than observed nationally (15%). Awareness of physical activity messages was higher in the ACT than reported nationally. ACT respondents recalled generic physical activity messages, the Active Australia campaign and its tagline at much higher rates than respondents nationally. ACT adults also had a reasonable level of understanding about the health benefits of physical activity. Indeed, almost 90% of adults agreed strongly with statements about moderate activity, indicating a high level of comprehension about the health benefits of physical exercise, although, 60% agreed with the ‘old’ public health message that vigorous activity, three times a week, for twenty minutes, was essential to obtain a health benefit.

47
The results of the survey showed that respondents who were married or de facto and blue collar workers in the ACT were significantly less likely to undertake ‘sufficient’ physical activity to confer a health benefit, compared (respectively) to single adults and individuals in other occupations. ACT respondents who spoke a language other than English at home were also less likely to participate in ‘sufficient’ physical activity, as were parents with children aged 5 years or less; and obese, overweight and underweight respondents. Approximately two-thirds (68%) of ACT adults were intent on becoming more active at the time the survey was undertaken. Further analysis is planned to examine the relationship between levels of activity and intentions to become more active. Although the ACT results are favourable relative to Australia, the levels of inactivity and levels of ‘insufficient’ activity in the ACT are of concern. It is essential to engage in ‘sufficient’ levels of physical activity in order to maintain and improve health and wellbeing. A lack of physical activity is a risk factor for a number of conditions, including cardiovascular disease and premature death. Indeed, physical inactivity has been estimated to contribute to approximately seven per cent of the total burden of disease in Australia (Mathers et al. 1999). The likely ‘downstream’ health effects and the burden of disease resulting from a considerable proportion of the population failing to undertake sufficient physical activity to confer a health benefit needs to be considered by health promotion and health service planners.

48
Appendix 1
2000 National Physical Activity Survey
Introduction Hello, are you (RESPONDENT’S NAME)? My name is……, I’m calling on behalf of the NSW Health Department / Australian Sports Commission (dependent on state/territory) about a health and exercise study being conducted across Australia. The research results will be important for the planning of future health and exercise programs. All that is involved is answering a few questions over the phone. Your answers will be kept confidential. We don’t need to know your name and no individuals will be identified or described in any reports. (If there are any questions you prefer not to answer just say so). The survey should take NO MORE THAN 15 minutes. Can you help us with this study?
Questions • Have you heard or seen any messages about exercise or physical activity IN THE
PAST MONTH? What is one message that you remember? • Have you heard of the Active Australia campaign? What is it? • Did you participate in Active Australia Day on October 29? What did you do? • Have you heard of the exercise and physical activity campaign ‘Exercise—you only
have to take it regularly not seriously’? What messages do you remember?
We would like to ask you about the physical activity you did IN THE LAST WEEK: • IN THE LAST WEEK how many times have you walked continuously, for at least
10 minutes, for recreation/exercise or to get to or from places? • What do you estimate was the total time that you spent walking in this way IN THE
LAST WEEK? • IN THE LAST WEEK how many times did you do any vigorous gardening or heavy
work around the yard which made you breathe harder or puff and pant? • What do you estimate was the total time that you spent doing vigorous gardening or
heavy work around the yard IN THE LAST WEEK?

49
The next question excludes household chores or gardening or yard work • IN THE LAST WEEK, how many times did you do any vigorous physical activity
which made you breathe harder or puff and pant? (e.g. jogging, cycling, aerobics, competitive tennis, etc.)
• What do you estimate was the total time that you spent doing this vigorous physical
activity IN THE LAST WEEK?
The next question excludes household chores or gardening or yard work • IN THE LAST WEEK how many times did you do any other more moderate physical
activity that you haven't already mentioned? (e.g. gentle swimming, social tennis, golf, etc.)
• What do you estimate was the total time that you spent doing these activities IN THE
LAST WEEK?
The following statements are about the amount of exercise you intend to do in the near future • Which one best describes how you feel at present?
− You do NOT intend to be more active than you have been over the last week − You intend to be more active over the NEXT MONTH than you have been over the
last week − You intend to become more active sometime over the NEXT SIX MONTHS than
you have been over the last week • To what extent do you agree or disagree with the following statements about physical
activity and health? − Taking the stairs at work or generally being more active for at least 30 minutes each
day is enough to improve your health − Half an hour of brisk walking on most days is enough to improve your health − To improve your health it is essential for you to do vigorous exercise for at least 20
minutes each time, 3 times a week − Exercise doesn’t have to be done all at one time—blocks of 10 minutes are okay − Moderate exercise that increases your heart rate slightly can improve your health
• Compared to one year ago, are you: much more physically active; more physically active;
about the same; less physically active; much less physically active? • Have you changed your own participation in physical activity or sport in response to the
Olympics? What have you done?

50
Finally a few questions to make sure we’ve spoken to a wide range of people • What is your sex? • Could I ask your age please? • What is your MARITAL STATUS? • What is your approximate weight in pounds, stones, or kilograms? • What is your approximate height in feet & inches or cms? • How MANY people UNDER 18 reside at your home? • How many children AGED 5 AND UNDER reside at your home? • How many adults aged between 18 and 75 years, including yourself, live in your
household? • What is the highest level of education you have COMPLETED? • What is your current occupation? • What language do you USUALLY speak at home? • What is your postcode? That ends our survey. Thanks very much for your help.

51
Appendix 2 The formulas used to calculate the weights were: To estimate numbers for total and regional populations,
ras
rasras n
NWPOP =
where ‘WPOPras’ is the weight used to estimate numbers applied to each respondent in region ‘r’, age group ‘a’, with sex ‘s’, ‘Nras’ is the population in region ‘r’, age group ‘a’, with sex ‘s’, and ‘nras’ is the sample size (i.e. number of respondents) in region ‘r’, age group ‘a’, with sex ‘s’. To estimate proportions and to perform statistical tests at the national level:
NnWPOPWSAMP rasras ×=
where ‘WSAMPras’ is the weight used to estimate proportions applied to each respondent in region ‘r’, age group ‘a’, with sex ‘s’, ‘WPOPras’ is the weight used to estimate numbers applied to each respondent in region ‘r’, age group ‘a’, and with sex ‘s’, ‘N’ is the total national population (aged 18 to 75 years), and ‘n’ is the total national sample size (i.e. number of respondents). To estimate proportions at the ACT level and to perform statistical tests between the ACT and the rest of Australia, data were weighted to a sample size of 512 for the ACT, 1,401 for NSW and 1,677 for the rest of Australia.

52
Glossary Body mass index (BMI) is a measure of a person’s weight in relation to their height, calculated as weight in kilograms divided by height in metres squared. The previous cut-off point for BMI underweight from the National Health Medical Research Council was less than 20. However, the National Data Dictionary definition (based on the WHO criteria) cut-off point for BMI underweight is less than 18.5. This is used by AIHW for all Physical Activity reports and work related to BMI. Context is the context in which a person participates in physical activity, e.g. leisure-time, incidental, and occupational. Duration is the length of time an individual spent participating in physical activity, as self-reported by the individual concerned. Energy expenditure is an estimate of the energy costs of physical activity derived from reports, observation, or indirect objective assessments of people’s activity levels. Exercise is a subset of physical activity and is defined as planned, structured and repetitive bodily movement undertaken to improve or maintain one or more components of physical fitness. Frequency is the number of times an individual self-reported participating in physical activity, within a reporting period. Health, as defined by the World Health Organization, is a state of complete physical, mental and social wellbeing, and not merely the absence of disease or infirmity. Health benefit results from participation in leisure-time physical activity of ‘sufficient’ intensity and duration. The accrual of 150 minutes of moderate-intensity physical activity over a period of one week is thought to confer a health benefit. Participation in vigorous-intensity leisure-time physical activity for 60 to 90 minutes over a period of a week is thought to also confer a health benefit. Incidental physical activity/unplanned physical activity includes the forms of physical activity undertaken at work and home, and activity in which people take part as they go about their day-to-day lives, generally using large skeletal muscle groups, for example, when using stairs, or undertaking domestic tasks. Intensity is the self-perceived and self-reported intensity at which an adult person participated in physical activity, e.g. moderate, vigorous.

53
Leisure-time physical activity refers to sport and recreational physical activity, including a range of activities conducted specifically for enjoyment, social, competitive or fitness purposes, performed in leisure, or discretionary time. METs (metabolic equivalents) is a unit used to estimate the metabolic cost (oxygen consumption) of physical activity. One MET is defined as the energy expenditure for sitting quietly, which for the average adult is 1 kilocalorie body weight in kg-1 hr-1 or 3.5 ml of oxygen body weight in kg-1 min-1. METs are used as an index of the intensity of activities. Moderate-intensity physical activity is physical activity requiring 3–4 times as much energy as at rest or intensity of 3–4 METs, e.g. brisk walking. Physical activity is any bodily movement produced by skeletal muscles that results in energy expenditure. Physical inactivity is conceptualised in population surveys as no reported physical activity. Risk factor is an exposure or characteristic that increases the rate of disease relative to those unexposed or without the characteristic of interest. Sedentary denotes people who are physically inactive, in this case survey respondents who reported no participation in walking, moderate-intensity or vigorous-intensity activity during the previous week, resulting in an estimated energy expenditure of less than 50 kilocalories per week. Sufficient (see health benefit) Type is the specific physical activity self-reported by adults, e.g. walking, gardening or yard work. Vigorous-intensity physical activity is physical activity requiring 7–9 times as much energy as at rest, or intensity of 7–9 METs, e.g. running.

54
References Armstrong T, Bauman A & Davies J 2000. Physical activity patterns of Australian adults. Canberra: Australian Institute of Health and Welfare. American College of Sports Medicine (ACSM) 1995. ACSM position stand on osteoporosis and exercise. Medicine and Science in Sports and Exercise 27: i–vii. Andersen LB, Schnohr P, Schroll M & Hein HO 2000. All cause mortality associated with physical activity during leisure time, work, sports, and cycling to work. Archives of Internal Medicine 160: 1621–8. Arciero P, Vukovich M, Holloszy J, Racette S et al 1999. Comparison of short-term diet and exercise on insulin action in individuals with abnormal glucose tolerance. Journal of Applied Physiology 86(6): 1930–1935. Australian Bureau of Statistics (ABS) 1999. Population by age and sex: Australian States and Territories. ABS Cat. No. 3201.0. Canberra: ABS. Australian Sports Commission (ASC) 1998. Active Australia national physical activity survey 1997. Canberra: ASC. Bauman A & Owen N 1999. Physical activity of adult Australians: epidemiological evidence and potential strategies for health gain. Journal of Science, Medicine and Sport 2(1): 30–41. Berlin JA & Colditz GA 1990. The meta-analysis of physical activity in the prevention of coronary heart disease. American Journal of Epidemiology 132(4): 612–627. Brill P, Macera C, Davis D, Blair S et al 2000. Muscular strength and physical function. Medicine and Science in Sports and Exercise: 412–416. Bull FC, Armstrong T, Dixon T, Ham S et al. Physical Inactivity. In: Ezzati M, Lopez A, Rodgers A, Murray C, editors. Comparative Quantification of Health Risks: Global and Regional Burden of Disease due to Selected Major Risk Factors. Geneva: World Health Organization, 2003. Caspersen CJ, Powell KE & Christenson GM 1985. Physical activity, exercise, and physical fitness: definitions and distinctions for health-related research. Public Health Report 100: 126–131. Colditz G, Cannuscio C & Frazier A 1997. Physical activity and reduced risk of colon cancer: implications for prevention. Cancer Causes and Control 8: 649–667. Commonwealth Department of Health and Aged Care (DHAC) 1999. National physical activity guidelines for Australians. DHAC: Canberra. Commonwealth Department of Health and Family Services (DHFS) 1998. Developing an Active Australia: a framework for action for physical activity and health. DHFS: Canberra. Drinkwater B 1994. 1994 CH McCloy research lecture: does physical activity play a role in preventing osteoporosis? Research Quarterly for Exercise and Sport 65(3): 197–206. Ellekjaer H, Holmen J, Ellekjaer E & Vatten L 2000. Physical activity and stroke mortality in women—ten year follow up of the Nord-Trondelag Health Survey 1984-86. Stroke 31: 14–18. Evans J & Roberts G 1987. Physical competence and the development of children‘s peer relations. Quest 39: 23–25. Fagard RH 2001. Exercise characteristics and blood pressure response to dynamic physical training. Medicine and Science in Sports and Exercise 33(6) Supplement: 484–92.

55
Folsom A, Kushi LH & Hong CP 2000. Physical activity and incident diabetes in postmenopausal women. American Journal of Public Health 90: 134–138. Gammon MD, John EM & Britton JA 1998. Recreational and occupational physical activities and risk of breast cancer. Journal of the National Cancer Institute 90(2): 100–117. Gillespie L, Gillespie W, Cumming R Lamb SE et al 1998. Interventions to reduce the incidence of falling in the elderly. Cochrane Database Systematic Reviews 3. Giovannucci E, Leitzmann M, Spiegelman D, Rimm E et al. 1998. A prospective study of physical activity and prostate cancer in male health professionals. Cancer Research 58(22): 5117–5122. Glenister D 1996. Exercise and mental health: a review. Journal of the Royal Society of Health 116(1): 7–13. Grisso J, Kelsey J, O‘Brien L, Miles C et al. 1997. Risk factors for hip fracture in men, hip fracture study group. American Journal of Epidemiology 145(9): 786–793. Grundy SM, Pasternak R, Greenland P, Smith S et al 1999. Assessment of cardiovascular risk by use of multiple-risk-factor assessment equations: a statement for health-care professionals from the American Heart Association and the American College of Cardiology. Circulation 100: 1481–1492. Gutin B & Kasper M 1992. Can vigorous exercise play a role in osteoporosis prevention? A review. Osteoporosis International 2(2): 55–69. Hassmén P, Koivula N & Uutela A 2000. Physical exercise and psychological well-being: a population study in Finland. Preventive Medicine 30: 17–25. Hu FB, Stampfer MJ, Colditz GA, Asherio A et al. 2000. Physical activity and risk of stroke in women. Journal of American Medical Association 283: 2961–64. Huang Y, Macera C, Blair S, Brill P et al 1998. Physical fitness, physical activity, and functional limitation in adults aged 40 and older. Medicine and Science in Sports and Exercise 30(9): 1430–1435. Hunter Valley Research Foundation (HVRF) 2001. 2000 physical activity survey: methods and coding manual. Maryville: HVRF. Ivy J, Zderic T & Fogt D 1999. Prevention and treatment of non-insulin-dependent diabetes mellitus. In: Holloszy J (ed.) Exercise and sport sciences reviews. Philadelphia: Lippincott Williams & Wilkins. Vol. 17: 1–36. Kelley & Goodpaster 2001. Effects of exercise on glucose homeostasis in Type 2 diabetes mellitus. Medicine and Science in Sports and Exercise 33(6) Supplement: 495–501. Kohl H 2001. Physical activity and cardiovascular disease: evidence for a dose-response. Medicine and Science in Sports and Exercise 33(6) Supplement: 472–83. Kohl H & McKenzie J 1994. Physical activity, fitness and stroke: physical activity, fitness and health. International proceedings and consensus statement. Champaign: Human Kinetics Publishers. Kraus WE, Houmard JA, Duscha BD, Knetzger KJ et al. 2002 Effects Of The Amount And Intensity Of Exercise On Plasma Lipoproteins. The New England Journal of Medicine Vol. 347(19): 1483-1492 Kujala U, Kaprio J & Sarna S 1994. Osteoarthritis of weight bearing joints of lower limbs in former elite male athletes. British Medical Journal 308: 231–234.

56
Laforge R, Rossi J, Prochaska J, Velicer W et al 1999. Stage of regular exercise and health-related quality of life. Preventive Medicine 28(4): 349–360. Latikka P, Pukkala E & Vihko V 1998. Relationship between the risk of breast cancer and physical activity. Sports Medicine 26(3): 133–143. Lee I & Paffenbarger R 2000. Associations of light, moderate, and vigorous intensity physical activity with longevity. American Journal of Epidemiology 151(3): 293–299. Lee I & Paffenbarger R 1997. Physical activity, fitness and longevity. Ageing 9: 2–11. Lee I & Skerrett PJ 2001. Physical activity and all-cause mortality: what is the dose-response relation? Medicine and Science in Sports and Exercise 33(6) Supplement: 459–471. Leon AS & Sanchez OA 2001. Response of blood lipids to exercise training alone or combined with dietary intervention. Medicine and Science in Sports and Exercise 33(6) Supplement: 502–15. Liu SM, Lee IM, Linson P, Ajani U et al 2000. A prospective study of physical activity and risk of prostate cancer in US physicians. International Journal of Epidemiology 29: 29–35. Lord S 1995. The effect of a 12-month exercise trial on balance, strength and falls in older women. Journal of American Geriatrics Society 43: 1198–1206. Manson JE, Greenland P, LaCroix AZ, Stefanick ML et al. Walking compared with vigorous exercise for the prevention of cardiovascular events in women. The New England Journal of Medicine 347(10): 716-725. Manson J & Spelsberg A 1994. Primary prevention of non-insulin-dependent diabetes mellitus. American Journal of Preventive Medicine 10(3): 172–184. Mathers C, Vos T, Stevenson C 1999. The Burden of Disease and Injury in Australia. Canberra: Australian Institute of Health and Welfare. Cat. No. 17. Maxwell K & Tucker L 1992. Effects of weight training on the emotional well being and body image of females: predictors of greatest benefit. American Journal of Health Promotion 6(5): 338–344. Mensink GBM, Ziese T & Kok FJ 1999. Benefits of leisure-time physical activity on the cardiovascular risk profile at older age. International Journal of Epidemiology 28(4): 659–666. Moore S 1994. Physical activity, fitness and atherosclerosis. In: Bouchard C, Shepherd R & Stephens T (eds). Physical activity, fitness and health: international proceedings and consensus statement. Champaign Il: Human Kinetics Publishers. Morans R & Mohai P 1991. Leisure resources, recreation activity and the quality of life. In: Driver B, Brown P & Peterson G (eds). Benefits of leisure. Philadelphia: Venture Publishing. Mutrie N & Parfitt G 1998. Physical activity and its link with mental, social and moral health in young people. In: Biddle S, Sallis J & Cavill N (eds). Young and active: young people and health-enhancing physical activity—evidence and implications. London: Health Education Authority. Neugut A, Terry M, Hocking G, Mosca L et al 1996. Leisure and occupational physical activity and risk of colorectal adenomatous polyps. International Journal of Cancer 68: 744–748. Paffenbarger R, Hyde R, Wing A, Lee I, Jung D & Kampert J 1993. The association of changes in physical activity level and other lifestyle characteristics with mortality among men. New England Journal of Medicine 328: 538–545.

57
Paffenbarger RS, Lee I & Leung R 1994. Physical activity and personal characteristics associated with depression and suicide in American college men. Acta Psychiatrica Scandinavica Supplementum 377: 16–22. Petruzzello S, Landers D, Hatfield B, Kubitz K & Salazar W 1991. A meta-analysis on the anxiety-reducing effects of acute and chronic exercise. Sports Medicine 11(3): 143–182. Powell KE, Thompson PD, Caspersen CJ & Kendrick JS 1987. Physical activity and the incidence of coronary heart disease. Annual Review of Public Health 8: 253–287. Simonsick E 1991. Personal health habits and mental health in a national probability sample. American Journal of Preventive Medicine 7(6): 425–437. Simonsick EM, Lafferty ME, Phillips CL, Mendes de Leon CF, Kasl SV, Seeman TE et al. 1993. Risk due to inactivity in physically capable older adults. American Journal of Public Health 83: 1443–1450. Slattery M, Potter J, Caan B, Edwards S, Coate A, Ma K et al. 1997. Energy balance and colon cancer—beyond physical activity. Cancer Research 57: 75–80. Sonstroem R 1984. Exercise and self-esteem exercise. Sport Science Review 12: 123–155. Spirduso WW & Cronin DL 2001. Exercise dose-response effects on quality of life and independent living in older adults. Medicine and Science in Sports and Exercise 33(6) Supplement: 598–608. Stephens T 1988. Physical activity and mental health in the United States and Canada: evidence from four population surveys. Preventive Medicine 17(1): 35–47. Stessman J, Maaravi Y, Hammerman-Rozenberg R & Cohen A 2000. The effects of physical activity on mortality in the Jerusalem 70-year-olds longitudinal study. Journal of the American Geriatrics Society 48: 499–504. United States Department of Health and Human Services (USDHHS) 1996. Physical activity and health: a report of the Surgeon General. Atlanta, GA: U.S. Department of Health and Human Services, Centers for Disease Control and Prevention, National Center for Chronic Disease Prevention and Health Promotion. Verloop J, Rookus M, van der Kooy D & van Leeuwen F 2000. Physical activity and breast cancer risk in women aged 20–54 years. Journal of the National Cancer Institute 92(2): 128–135. Villeneuve PJ, Morrison HI, Craig CL & Schaubel DE 1998. Physical activity, physical fitness and risk of dying. Epidemiology 9: 626–631. Wannamethee SG & Shaper AG 1999. Physical activity and the prevention of stroke. Journal of Cardiovascular Risk 6: 213–16. Wei M, Gibbons LW, Mitchell TL, Kampert JB, Lee CD & Blair SN 1999. The association between cardiorespiratory fitness and impaired fasting glucose and type 2 diabetes mellitus in men. Annals of Internal Medicine 130(2): 89–96. Welten D, Kemper H, Psot G, Van-Mechelen W, Twisk J, Lips P et al. 1994. Weight-bearing activity during youth is a more important factor for peak bone mass than calcium intake. Journal of Bone and Mineral Research 9(7): 1089–1096. Williams PT 2001. Physical activity and fitness as separate heart disease risk factors: a meta-analysis. Medicine and Science in Sports and Exercise 33(5): 754–61. Zhang J, Feldblum P & Fortney J 1992. Moderate physical activity and bone density among perimenopausal women. American Journal of Public Health 82(5): 736–738.