Embed Size (px)
Citation preview
energy.gov/sunshot
energy.gov/sunshot
Photovoltaic System Pricing Trends Historical, Recent, and Near-Term Projections 2014 Edition
David Feldman1, Galen Barbose2, Robert Margolis1, Ted James1, Samantha Weaver2, Naïm Darghouth2, Ran Fu1, Carolyn Davidson1, Sam Booth1, and Ryan Wiser2
September 22, 2014 1National Renewable Energy Laboratory 2Lawrence Berkeley National Laboratory
NREL/PR-6A20-62558
energy.gov/sunshot
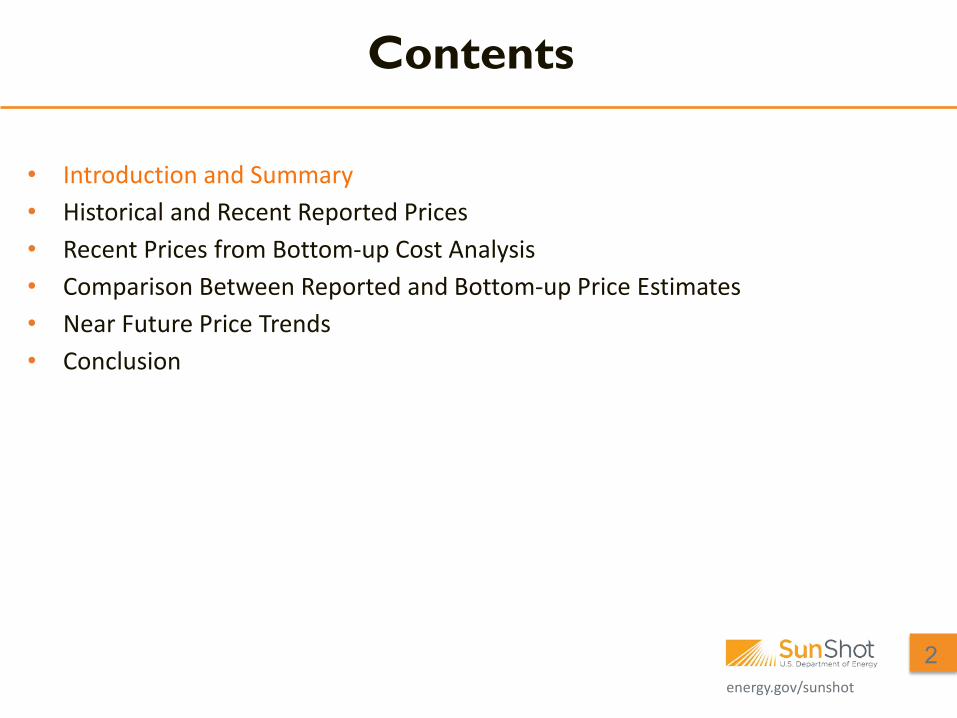
Contents
• Introduction and Summary • Historical and Recent Reported Prices • Recent Prices from Bottom-up Cost Analysis • Comparison Between Reported and Bottom-up Price Estimates • Near Future Price Trends • Conclusion
2
energy.gov/sunshot
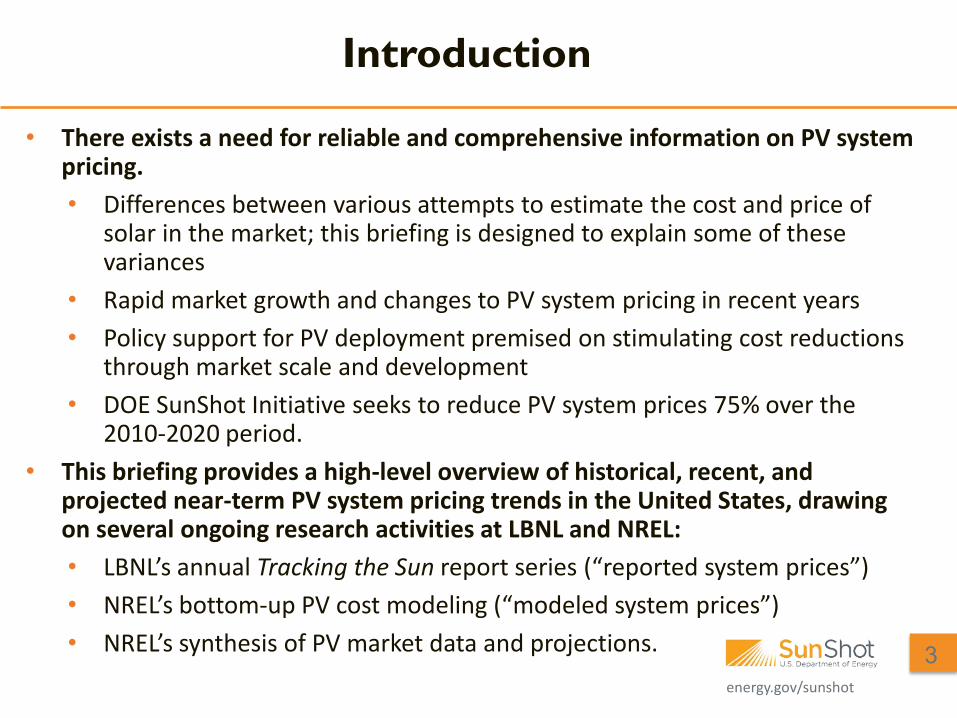
• There exists a need for reliable and comprehensive information on PV system pricing. • Differences between various attempts to estimate the cost and price of
solar in the market; this briefing is designed to explain some of these variances
• Rapid market growth and changes to PV system pricing in recent years • Policy support for PV deployment premised on stimulating cost reductions
through market scale and development • DOE SunShot Initiative seeks to reduce PV system prices 75% over the
2010-2020 period. • This briefing provides a high-level overview of historical, recent, and
projected near-term PV system pricing trends in the United States, drawing on several ongoing research activities at LBNL and NREL: • LBNL’s annual Tracking the Sun report series (“reported system prices”) • NREL’s bottom-up PV cost modeling (“modeled system prices”) • NREL’s synthesis of PV market data and projections.
Introduction
3
energy.gov/sunshot
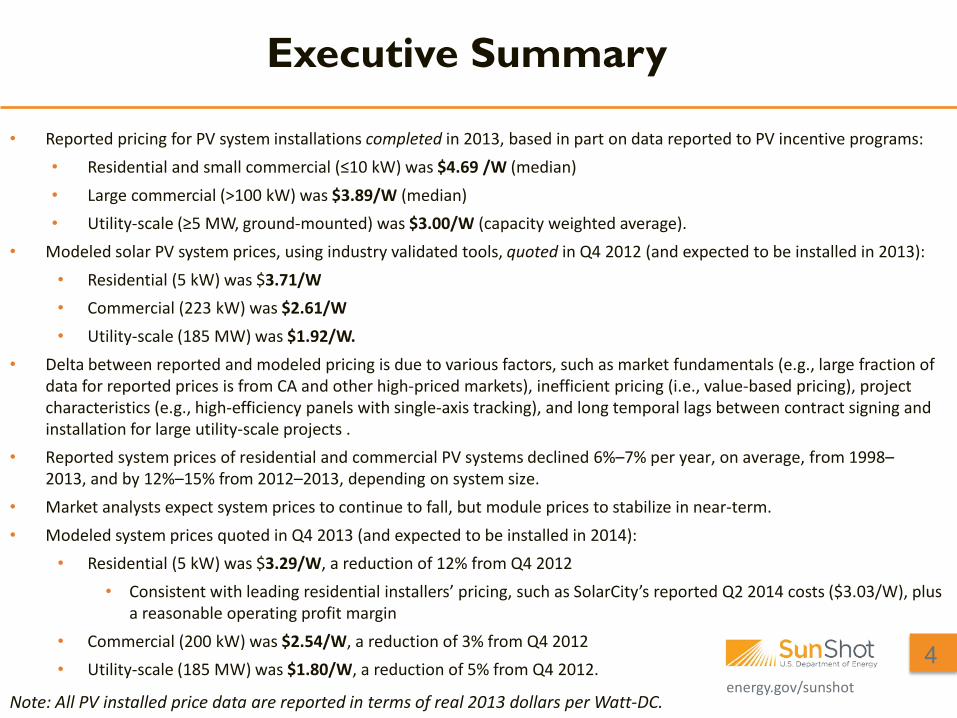
• Reported pricing for PV system installations completed in 2013, based in part on data reported to PV incentive programs:• Residential and small commercial (≤10 kW) was $4.69 /W (median)• Large commercial (>100 kW) was $3.89/W (median)• Utility-scale (≥5 MW, ground-mounted) was $3.00/W (capacity weighted average).
• Modeled solar PV system prices, using industry validated tools, quoted in Q4 2012 (and expected to be installed in 2013):• Residential (5 kW) was $3.71/W• Commercial (223 kW) was $2.61/W• Utility-scale (185 MW) was $1.92/W.
• Delta between reported and modeled pricing is due to various factors, such as market fundamentals (e.g., large fraction ofdata for reported prices is from CA and other high-priced markets), inefficient pricing (i.e., value-based pricing), projectcharacteristics (e.g., high-efficiency panels with single-axis tracking), and long temporal lags between contract signing andinstallation for large utility-scale projects .
• Reported system prices of residential and commercial PV systems declined 6%–7% per year, on average, from 1998–2013, and by 12%–15% from 2012–2013, depending on system size.
• Market analysts expect system prices to continue to fall, but module prices to stabilize in near-term.• Modeled system prices quoted in Q4 2013 (and expected to be installed in 2014):
• Residential (5 kW) was $3.29/W, a reduction of 12% from Q4 2012• Consistent with leading residential installers’ pricing, such as SolarCity’s reported Q2 2014 costs ($3.03/W), plus
a reasonable operating profit margin• Commercial (200 kW) was $2.54/W, a reduction of 3% from Q4 2012• Utility-scale (185 MW) was $1.80/W, a reduction of 5% from Q4 2012.
Executive Summary
Note: All PV installed price data are reported in terms of real 2013 dollars per Watt-DC.
4
energy.gov/sunshot
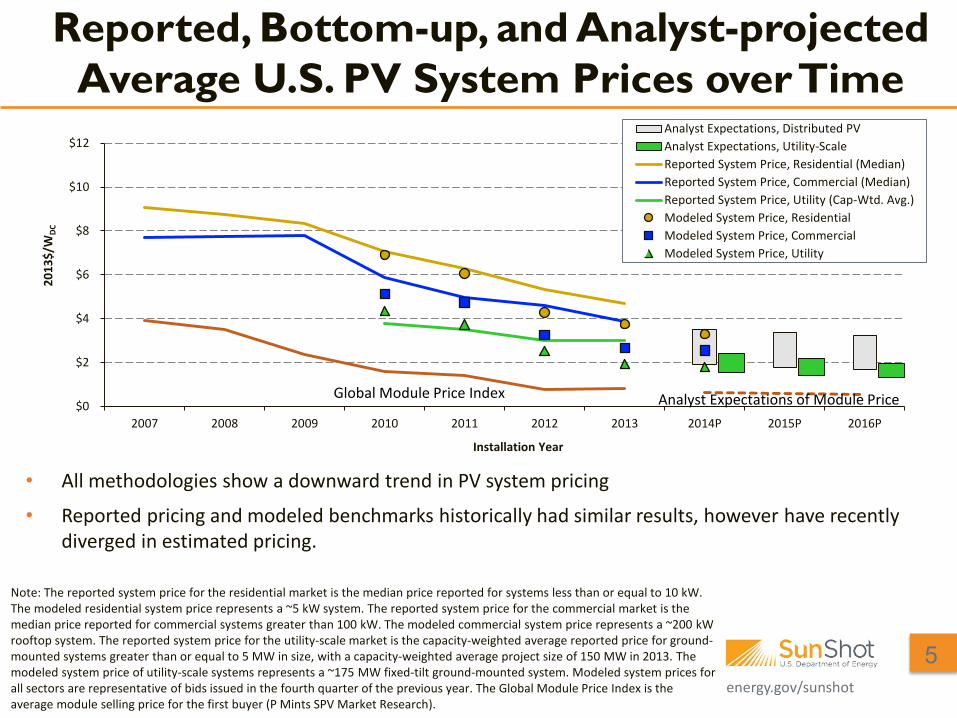
Reported, Bottom-up, and Analyst-projected Average U.S. PV System Prices over Time
Note: The reported system price for the residential market is the median price reported for systems less than or equal to 10 kW. The modeled residential system price represents a ~5 kW system. The reported system price for the commercial market is the median price reported for commercial systems greater than 100 kW. The modeled commercial system price represents a ~200 kW rooftop system. The reported system price for the utility-scale market is the capacity-weighted average reported price for ground-mounted systems greater than or equal to 5 MW in size, with a capacity-weighted average project size of 150 MW in 2013. The modeled system price of utility-scale systems represents a ~175 MW fixed-tilt ground-mounted system. Modeled system prices for all sectors are representative of bids issued in the fourth quarter of the previous year. The Global Module Price Index is the average module selling price for the first buyer (P Mints SPV Market Research).
5
• All methodologies show a downward trend in PV system pricing
• Reported pricing and modeled benchmarks historically had similar results, however have recently diverged in estimated pricing.
$0
$2
$4
$6
$8
$10
$12
2007 2008 2009 2010 2011 2012 2013 2014P 2015P 2016P
2013
$/W
DC
Installation Year
Analyst Expectations, Distributed PVAnalyst Expectations, Utility-ScaleReported System Price, Residential (Median)Reported System Price, Commercial (Median)Reported System Price, Utility (Cap-Wtd. Avg.)Modeled System Price, ResidentialModeled System Price, CommercialModeled System Price, Utility
Analyst Expectations of Module Price Global Module Price Index
energy.gov/sunshot
Contents
• Introduction and Summary • Historical and Recent Reported Prices • Recent Prices from Bottom-up Cost Analysis • Comparison Between Reported and Bottom-up Price Estimates • Near Future Price Trends • Conclusion
6
energy.gov/sunshot
• Prices are derived from project-level data reported for PV systems installed through year-end 2013 (and from a more limited set of states for H1 2014)
• Data Sources • Residential and commercial PV (<5 MW and/or roof-mounted): Project-level data
obtained from 60 PV incentive programs, spanning 32 states • Utility-scale PV (>5 MW ground-mounted): Sourced from FERC Form 1, Section
1603 Grant Program, SEC filings, company presentations, trade press articles • Raw sample represents 80% of all grid-connected PV capacity installed in the
United States through 2013 and 78% of all 2013 capacity additions • All residential and commercial projects for which reported prices were
deemed likely to represent appraised values, rather than prices paid to the installer/EPC, were removed from the final data sample used for analysis • After removing these and other systems, the final data sample represents 71% of
all grid-connected PV capacity installed in the United States through 2013 and 64% of all 2013 capacity additions.
Data Sources and Methodology for Reported Installed Prices
7
energy.gov/sunshot
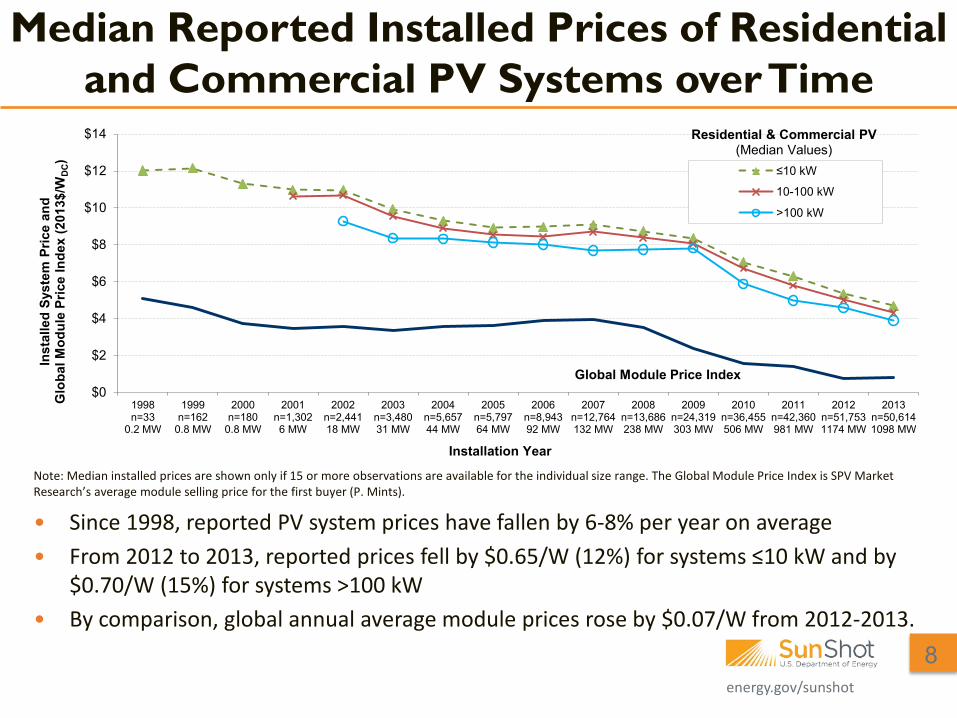
Median Reported Installed Prices of Residential and Commercial PV Systems over Time
• Since 1998, reported PV system prices have fallen by 6-8% per year on average • From 2012 to 2013, reported prices fell by $0.65/W (12%) for systems ≤10 kW and by
$0.70/W (15%) for systems >100 kW • By comparison, global annual average module prices rose by $0.07/W from 2012-2013.
Note: Median installed prices are shown only if 15 or more observations are available for the individual size range. The Global Module Price Index is SPV Market Research’s average module selling price for the first buyer (P. Mints).
8
$0
$2
$4
$6
$8
$10
$12
$14
1998n=33
0.2 MW
1999n=162
0.8 MW
2000n=180
0.8 MW
2001n=1,3026 MW
2002n=2,44118 MW
2003n=3,48031 MW
2004n=5,65744 MW
2005n=5,79764 MW
2006n=8,94392 MW
2007n=12,764132 MW
2008n=13,686238 MW
2009n=24,319303 MW
2010n=36,455506 MW
2011n=42,360981 MW
2012n=51,7531174 MW
2013n=50,6141098 MW
Inst
alle
d Sy
stem
Pric
e an
d G
loba
l Mod
ule
Pric
e In
dex
(201
3$/W
DC)
Installation Year
≤10 kW
10-100 kW
>100 kW
Residential & Commercial PV (Median Values)
Global Module Price Index
energy.gov/sunshot
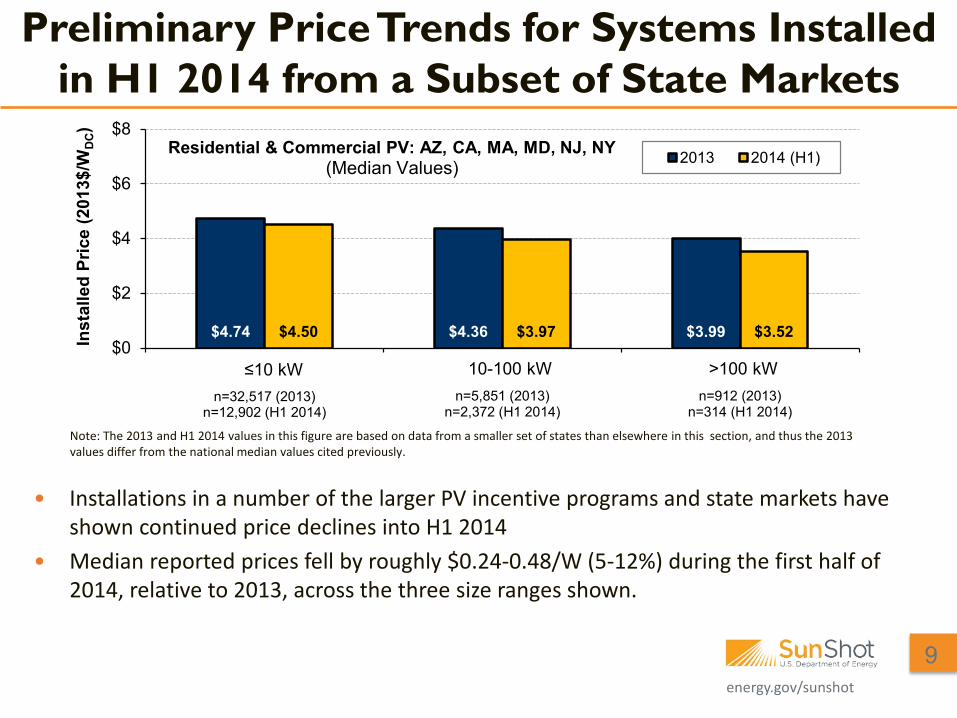
Preliminary Price Trends for Systems Installed in H1 2014 from a Subset of State Markets
• Installations in a number of the larger PV incentive programs and state markets have shown continued price declines into H1 2014
• Median reported prices fell by roughly $0.24-0.48/W (5-12%) during the first half of 2014, relative to 2013, across the three size ranges shown.
9
Note: The 2013 and H1 2014 values in this figure are based on data from a smaller set of states than elsewhere in this section, and thus the 2013 values differ from the national median values cited previously.
$4.74 $4.36 $3.99$4.50 $3.97 $3.52$0
$2
$4
$6
$8
≤10 kW
n=32,517 (2013) n=12,902 (H1 2014)
10-100 kW
n=5,851 (2013)n=2,372 (H1 2014)
>100 kW
n=912 (2013)n=314 (H1 2014)
Inst
alle
d Pr
ice
(201
3$/W
DC)
2013 2014 (H1)
≤10 kW 10-100 kW >100 kW
Residential & Commercial PV: AZ, CA, MA, MD, NJ, NY(Median Values)
energy.gov/sunshot
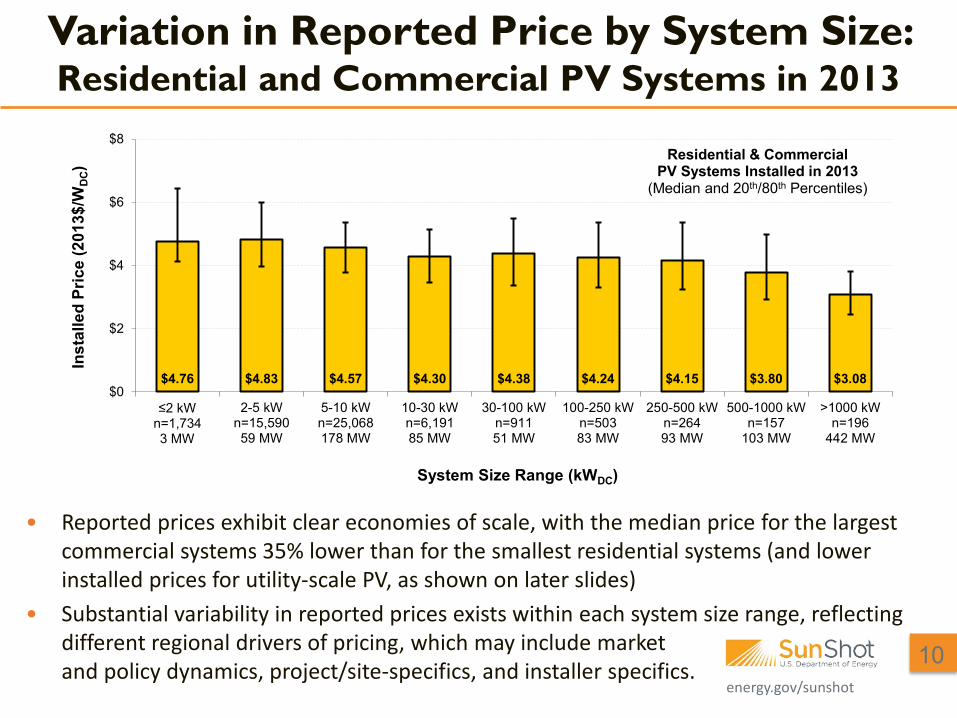
Variation in Reported Price by System Size: Residential and Commercial PV Systems in 2013
• Reported prices exhibit clear economies of scale, with the median price for the largest commercial systems 35% lower than for the smallest residential systems (and lower installed prices for utility-scale PV, as shown on later slides)
• Substantial variability in reported prices exists within each system size range, reflecting different regional drivers of pricing, which may include market and policy dynamics, project/site-specifics, and installer specifics.
10
$4.76 $4.83 $4.57 $4.30 $4.38 $4.24 $4.15 $3.80 $3.08$0
$2
$4
$6
$8
≤2 kWn=1,7343 MW
2-5 kWn=15,59059 MW
5-10 kWn=25,068178 MW
10-30 kWn=6,19185 MW
30-100 kWn=91151 MW
100-250 kWn=50383 MW
250-500 kWn=26493 MW
500-1000 kWn=157
103 MW
>1000 kWn=196
442 MW
Inst
alle
d Pr
ice
(201
3$/W
DC)
System Size Range (kWDC)
Residential & Commercial PV Systems Installed in 2013
(Median and 20th/80th Percentiles)
energy.gov/sunshot
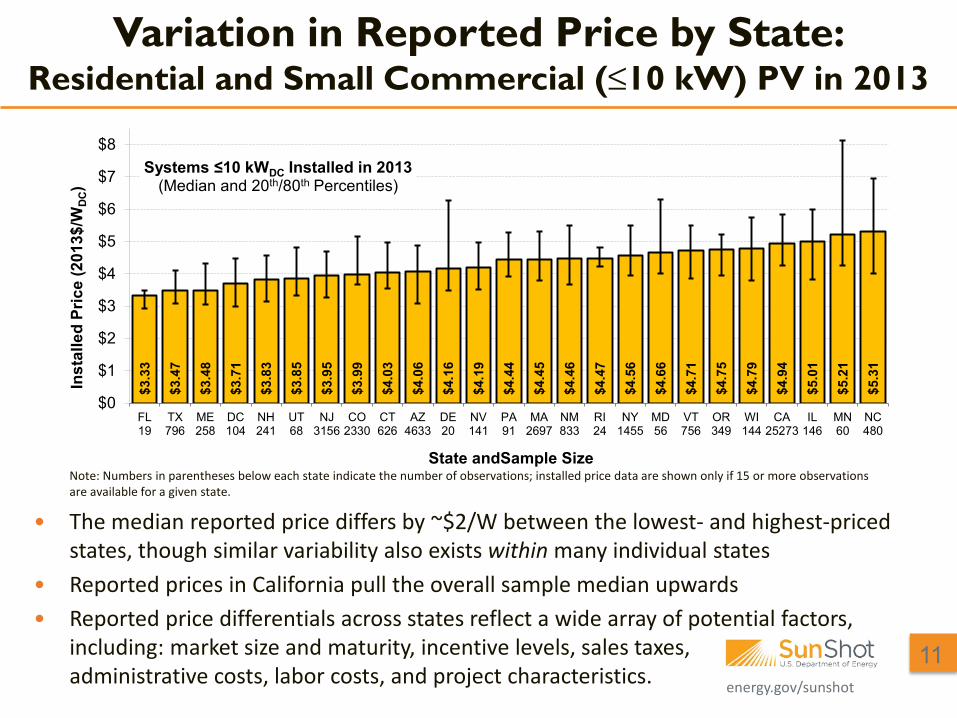
Variation in Reported Price by State: Residential and Small Commercial (≤10 kW) PV in 2013
• The median reported price differs by ~$2/W between the lowest- and highest-priced states, though similar variability also exists within many individual states
• Reported prices in California pull the overall sample median upwards • Reported price differentials across states reflect a wide array of potential factors,
including: market size and maturity, incentive levels, sales taxes, administrative costs, labor costs, and project characteristics.
Note: Numbers in parentheses below each state indicate the number of observations; installed price data are shown only if 15 or more observations are available for a given state.
11
$3.3
3
$3.4
7
$3.4
8
$3.7
1
$3.8
3
$3.8
5
$3.9
5
$3.9
9
$4.0
3
$4.0
6
$4.1
6
$4.1
9
$4.4
4
$4.4
5
$4.4
6
$4.4
7
$4.5
6
$4.6
6
$4.7
1
$4.7
5
$4.7
9
$4.9
4
$5.0
1
$5.2
1
$5.3
1
$0
$1
$2
$3
$4
$5
$6
$7
$8
FL19
TX796
ME258
DC104
NH241
UT68
NJ3156
CO2330
CT626
AZ4633
DE20
NV141
PA91
MA2697
NM833
RI24
NY1455
MD56
VT756
OR349
WI144
CA25273
IL146
MN60
NC480
Inst
alle
d Pr
ice
(201
3$/W
DC)
State andSample Size
Systems ≤10 kWDC Installed in 2013(Median and 20th/80th Percentiles)
energy.gov/sunshot
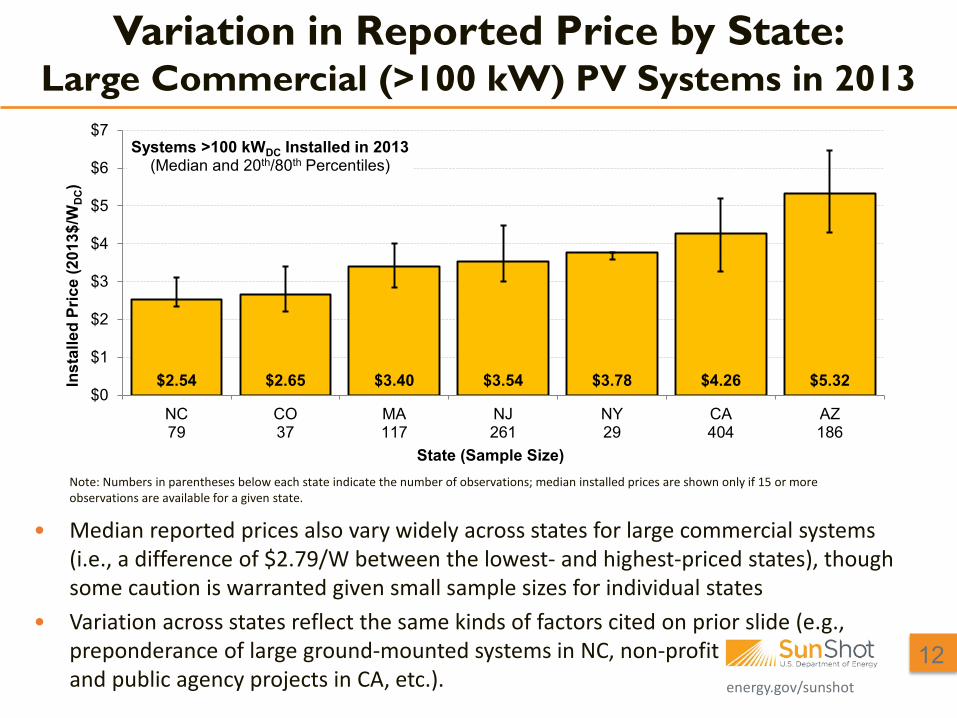
Variation in Reported Price by State: Large Commercial (>100 kW) PV Systems in 2013
• Median reported prices also vary widely across states for large commercial systems (i.e., a difference of $2.79/W between the lowest- and highest-priced states), though some caution is warranted given small sample sizes for individual states
• Variation across states reflect the same kinds of factors cited on prior slide (e.g., preponderance of large ground-mounted systems in NC, non-profit and public agency projects in CA, etc.).
Note: Numbers in parentheses below each state indicate the number of observations; median installed prices are shown only if 15 or more observations are available for a given state.
12
$2.54 $2.65 $3.40 $3.54 $3.78 $4.26 $5.32$0
$1
$2
$3
$4
$5
$6
$7
NC79
CO37
MA117
NJ261
NY29
CA404
AZ186
Inst
alle
d Pr
ice
(201
3$/W
DC)
State (Sample Size)
Systems >100 kWDC Installed in 2013(Median and 20th/80th Percentiles)
energy.gov/sunshot
Installed Price Data for Utility-scale PV: Important Notes and Caveats
• Utility-scale PV is defined as ground-mounted systems ≥5 MW, regardless of whether electricity is delivered to utility or customer
• Analysis considers only entire projects (not individual phases) • Project sample consists of 100 fully operational projects installed through year-
end 2013, totaling roughly 3,200 MW (88% of total U.S. utility-scale) • A few important caveats:
• Significant and uncertain lags exist between when projects are contracted and installed (i.e., prices reported for projects installed in 2013 may reflect PPAs or EPC contracts signed in 2009-2012)
• Data reliability is mixed, depending on the data sources available for any individual project, with possible inconsistencies in the scope of cost components captured
• Focus is on reported installed prices rather than levelized cost of electricity, and thus ignores performance differences across system configurations.
13
energy.gov/sunshot
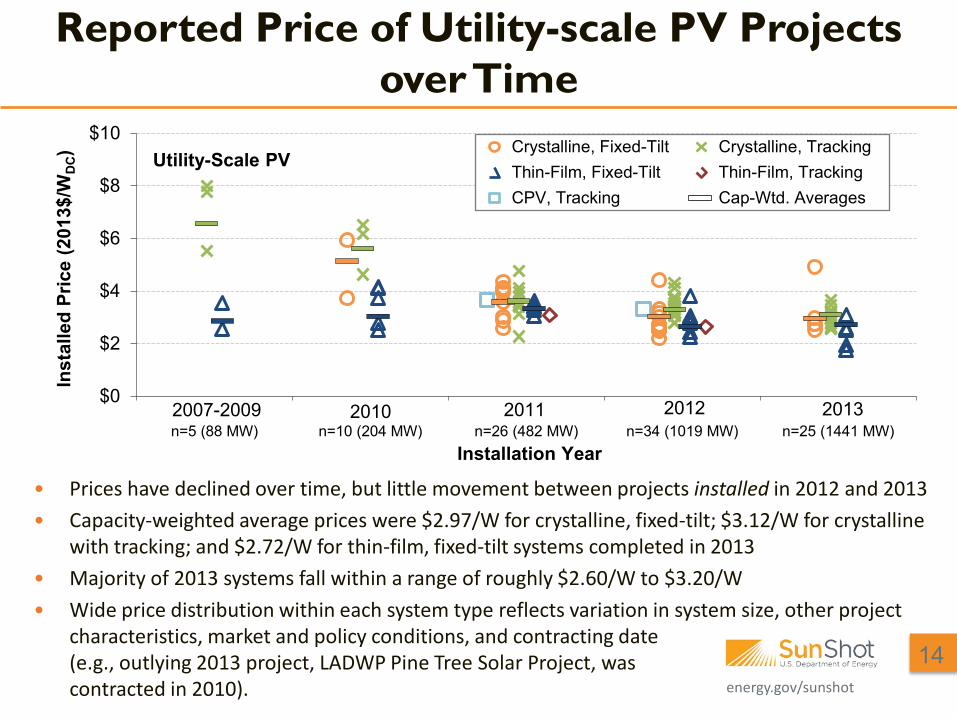
Reported Price of Utility-scale PV Projects over Time
• Prices have declined over time, but little movement between projects installed in 2012 and 2013 • Capacity-weighted average prices were $2.97/W for crystalline, fixed-tilt; $3.12/W for crystalline
with tracking; and $2.72/W for thin-film, fixed-tilt systems completed in 2013 • Majority of 2013 systems fall within a range of roughly $2.60/W to $3.20/W • Wide price distribution within each system type reflects variation in system size, other project
characteristics, market and policy conditions, and contracting date (e.g., outlying 2013 project, LADWP Pine Tree Solar Project, was contracted in 2010).
14
$0
$2
$4
$6
$8
$10
n=5 (88 MW) n=10 (204 MW) n=26 (482 MW) n=34 (1019 MW) n=25 (1441 MW)
Inst
alle
d Pr
ice
(201
3$/W
DC)
Installation Year
Crystalline, Fixed-Tilt Crystalline, Tracking Thin-Film, Fixed-Tilt Thin-Film, Tracking CPV, Tracking Cap-Wtd. Averages
Utility-Scale PV
2007-2009 2010 20122011 2013
energy.gov/sunshot
Contents
• Introduction and Summary • Historical and Recent Reported Prices • Recent Prices from Bottom-up Cost Analysis • Comparison Between Reported and Bottom-up Price Estimates • Near Future Price Trends • Conclusion
15
energy.gov/sunshot
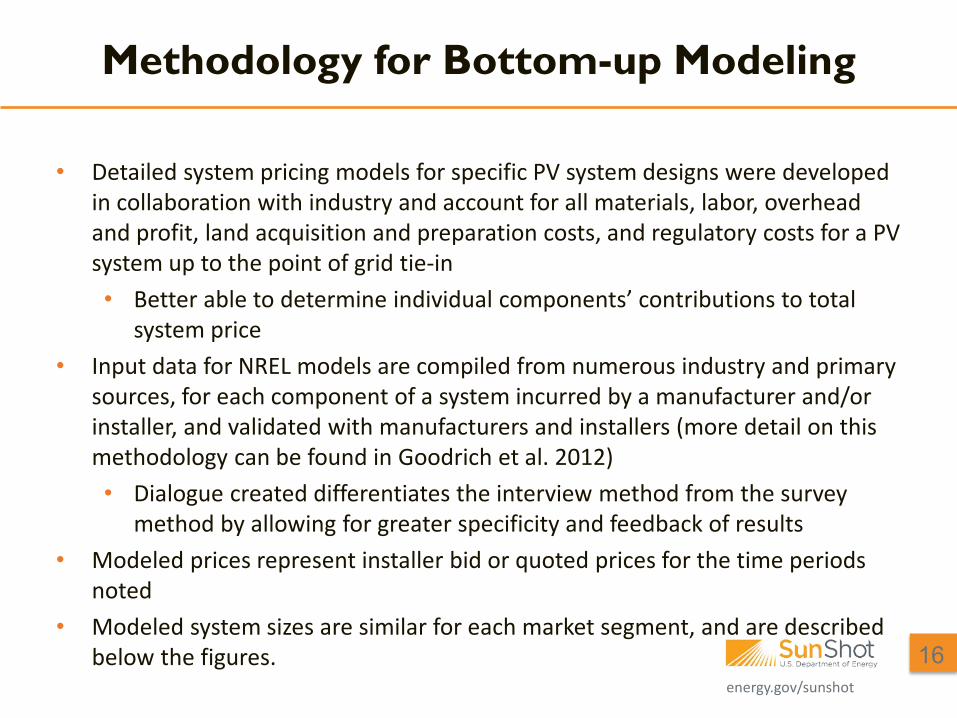
• Detailed system pricing models for specific PV system designs were developed in collaboration with industry and account for all materials, labor, overhead and profit, land acquisition and preparation costs, and regulatory costs for a PV system up to the point of grid tie-in • Better able to determine individual components’ contributions to total
system price • Input data for NREL models are compiled from numerous industry and primary
sources, for each component of a system incurred by a manufacturer and/or installer, and validated with manufacturers and installers (more detail on this methodology can be found in Goodrich et al. 2012) • Dialogue created differentiates the interview method from the survey
method by allowing for greater specificity and feedback of results • Modeled prices represent installer bid or quoted prices for the time periods
noted • Modeled system sizes are similar for each market segment, and are described
below the figures.
Methodology for Bottom-up Modeling
16
energy.gov/sunshot
$6.91
$6.06
$4.28 $3.74
$3.29
$5.11 $4.74
$3.26 $2.65
$2.54
$4.36 $3.74
$2.54 $1.94
$1.80
$0
$1
$2
$3
$4
$5
$6
$7
$8
Q42009
Q42010
Q42011
Q42012
Q42013
Q42009
Q42010
Q42011
Q42012
Q42013
Q42009
Q42010
Q42011
Q42012
Q42013
Residential Commercial Utility ground mount (Fixed axis)
2013
$/W
DC
BOSInverterModule
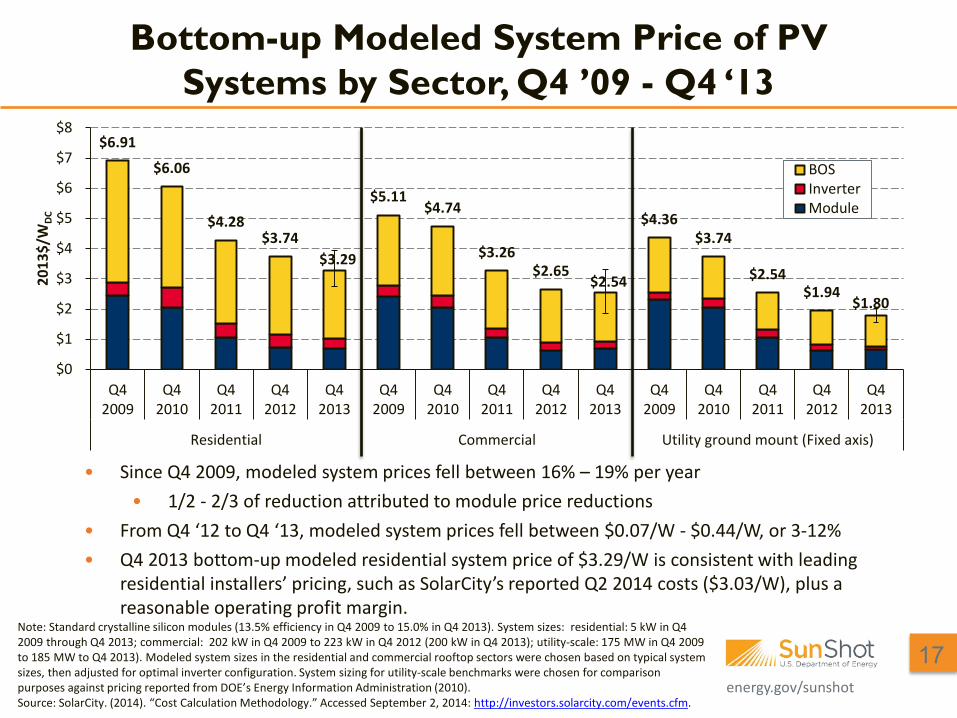
Bottom-up Modeled System Price of PV Systems by Sector, Q4 ’09 - Q4 ‘13
Note: Standard crystalline silicon modules (13.5% efficiency in Q4 2009 to 15.0% in Q4 2013). System sizes: residential: 5 kW in Q4 2009 through Q4 2013; commercial: 202 kW in Q4 2009 to 223 kW in Q4 2012 (200 kW in Q4 2013); utility-scale: 175 MW in Q4 2009 to 185 MW to Q4 2013). Modeled system sizes in the residential and commercial rooftop sectors were chosen based on typical system sizes, then adjusted for optimal inverter configuration. System sizing for utility-scale benchmarks were chosen for comparison purposes against pricing reported from DOE’s Energy Information Administration (2010). Source: SolarCity. (2014). “Cost Calculation Methodology.” Accessed September 2, 2014: http://investors.solarcity.com/events.cfm.
• Since Q4 2009, modeled system prices fell between 16% – 19% per year • 1/2 - 2/3 of reduction attributed to module price reductions
• From Q4 ‘12 to Q4 ‘13, modeled system prices fell between $0.07/W - $0.44/W, or 3-12% • Q4 2013 bottom-up modeled residential system price of $3.29/W is consistent with leading
residential installers’ pricing, such as SolarCity’s reported Q2 2014 costs ($3.03/W), plus a reasonable operating profit margin.
17
energy.gov/sunshot
Contents
• Introduction and Summary • Historical and Recent Reported Prices • Recent Prices from Bottom-up Cost Analysis • Comparison Between Reported and Bottom-up Price Estimates • Near Future Price Trends • Conclusion
18
energy.gov/sunshot
$4.69 $3.47
$4.94 $3.74 $3.89
$2.65
$4.26
$2.65 $3.00 $1.95
$0
$1
$2
$3
$4
$5
$6
$7
Medianreported
price - U.S.
Medianreportedprice - TX
Medianreportedprice - CA
ModeledPrice - U.S.
Medianreported
price - U.S.
Medianreportedprice - CO
Medianreportedprice - CA
ModeledPrice - U.S.
Cap. w. avg.reported
price - U.S.
ModeledPrice - U.S.
Residential Commercial Utility-Scale Grount-Mounted
Syst
em P
rice
(201
3 $/
WDC
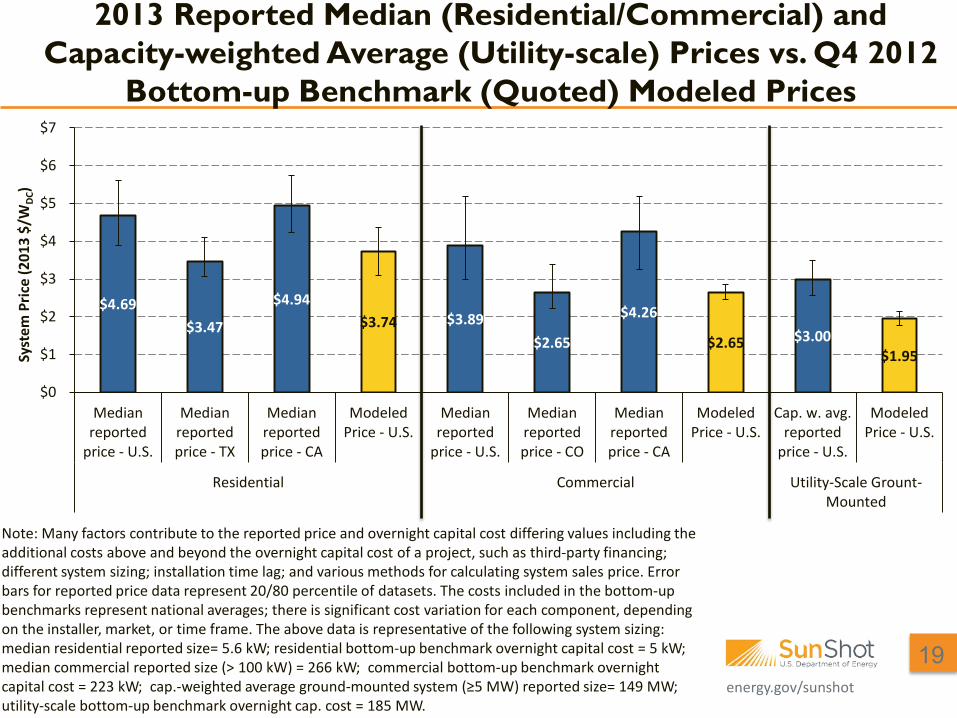
) 2013 Reported Median (Residential/Commercial) and
Capacity-weighted Average (Utility-scale) Prices vs. Q4 2012 Bottom-up Benchmark (Quoted) Modeled Prices
Note: Many factors contribute to the reported price and overnight capital cost differing values including the additional costs above and beyond the overnight capital cost of a project, such as third-party financing; different system sizing; installation time lag; and various methods for calculating system sales price. Error bars for reported price data represent 20/80 percentile of datasets. The costs included in the bottom-up benchmarks represent national averages; there is significant cost variation for each component, depending on the installer, market, or time frame. The above data is representative of the following system sizing: median residential reported size= 5.6 kW; residential bottom-up benchmark overnight capital cost = 5 kW; median commercial reported size (> 100 kW) = 266 kW; commercial bottom-up benchmark overnight capital cost = 223 kW; cap.-weighted average ground-mounted system (≥5 MW) reported size= 149 MW; utility-scale bottom-up benchmark overnight cap. cost = 185 MW.
19

energy.gov/sunshot
Reasons for Deviations Between Reported and Modeled Installed Prices
• Median reported U.S. distributed system pricing is weighted heavily towards California • CA is generally a high-cost state with relatively high retail rates that may allow for
higher installer margins • Bottom-up benchmark overnight capital cost are more in line with states with
lower reported median prices (e.g., TX) • 2013 median reported TX residential system price = $3.47/W • Q4 2012 modeled price for residential systems = $3.74/W
• Utility-scale projects’ duration between signature of electricity sales agreement and placed in service date can be significant
• Reported pricing generally reflects module and other component pricing at the time that electricity sales agreements (PPAs) were signed
• Time lags of up to 4 years exist between date of PPA signature and commercial operation for utility-scale projects installed in 2013
• Bottom-up overnight capital costs represent pricing at the time of benchmark.
20

energy.gov/sunshot
Reasons for Deviations Between Reported and Modeled Installed Prices (cont.)
• Large variety in projects currently built in the United States • Lack of standards and transparency in incentive program reporting • Large differences across system configurations for geographic, market, and LCOE
purposes • Bottom-up, modeled system prices represents a specific prototypical project
• Price and cost represent different things • Reported pricing reflects what customers did pay for systems (i.e., what the market
will bear). A customer’s purchase price may be significantly higher than it would be elsewhere, regardless of the underlying cost to the installer, due to:
• Higher electricity rates (e.g., CA) • Higher incentive levels (which may lower a customer’s upfront cash outlay,
though not the price paid to the installer) • Lower levels of competition, consumer awareness, etc.
• The bottom-up benchmarks are reflective of consistent, transparent cost assumptions and representative margins of each subcomponent to an installer, regardless of market conditions or incentives. 21
energy.gov/sunshot
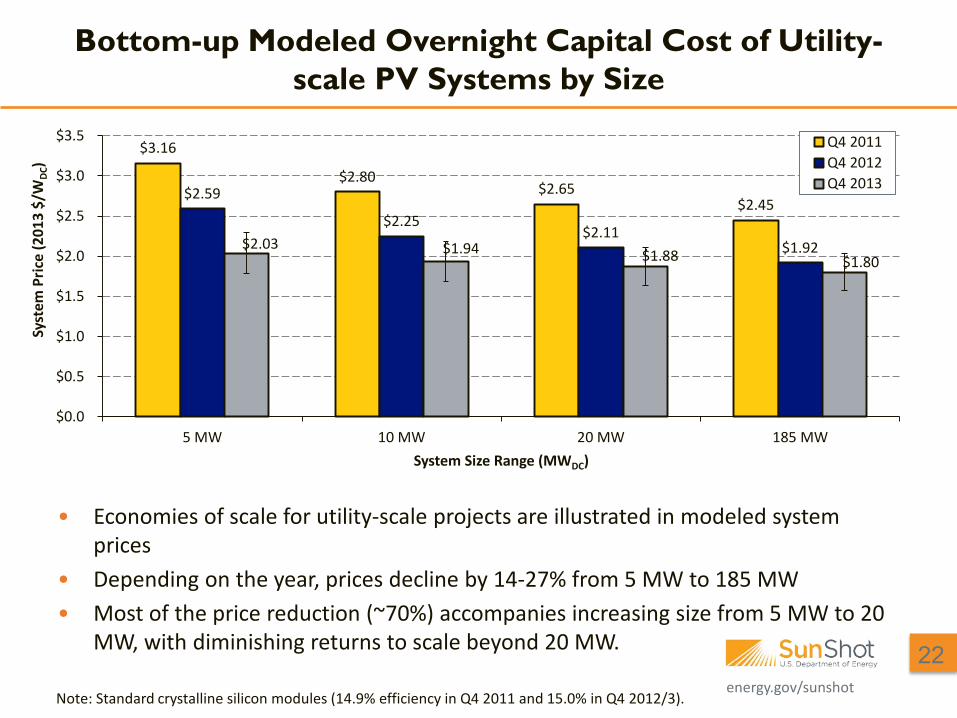
Bottom-up Modeled Overnight Capital Cost of Utility-scale PV Systems by Size
Note: Standard crystalline silicon modules (14.9% efficiency in Q4 2011 and 15.0% in Q4 2012/3).
• Economies of scale for utility-scale projects are illustrated in modeled system prices
• Depending on the year, prices decline by 14-27% from 5 MW to 185 MW • Most of the price reduction (~70%) accompanies increasing size from 5 MW to 20
MW, with diminishing returns to scale beyond 20 MW. 22
$3.16
$2.80 $2.65
$2.45 $2.59
$2.25 $2.11
$1.92 $2.03 $1.94 $1.88 $1.80
$0.0
$0.5
$1.0
$1.5
$2.0
$2.5
$3.0
$3.5
5 MW 10 MW 20 MW 185 MW
Syst
em P
rice
(201
3 $/
WDC
)
System Size Range (MWDC)
Q4 2011Q4 2012Q4 2013
energy.gov/sunshot
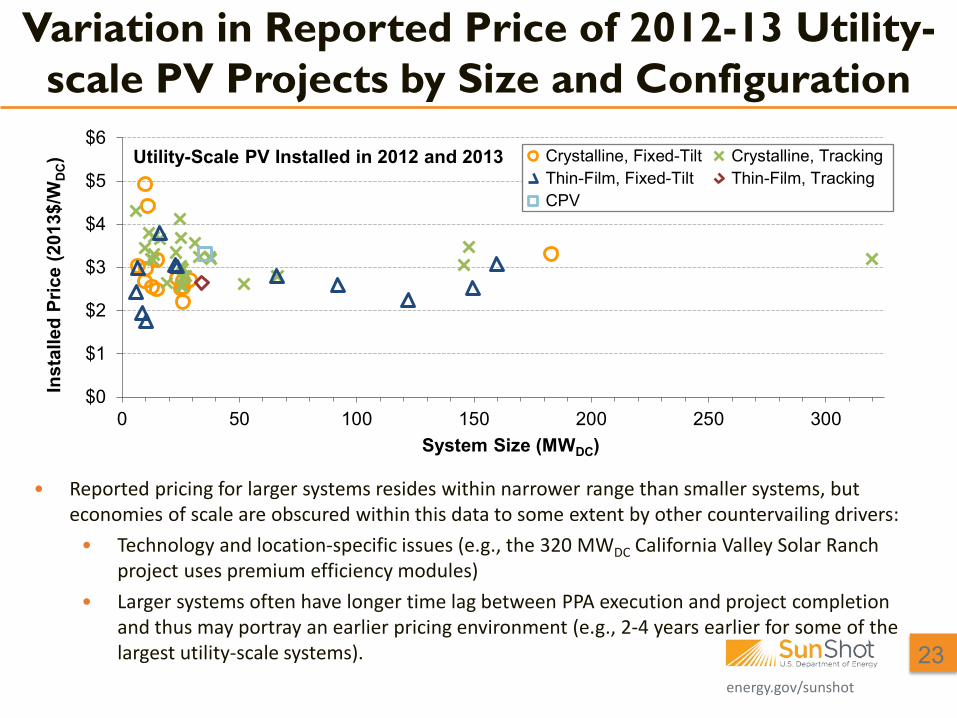
Variation in Reported Price of 2012-13 Utility-scale PV Projects by Size and Configuration
• Reported pricing for larger systems resides within narrower range than smaller systems, but economies of scale are obscured within this data to some extent by other countervailing drivers:
• Technology and location-specific issues (e.g., the 320 MWDC California Valley Solar Ranch project uses premium efficiency modules)
• Larger systems often have longer time lag between PPA execution and project completion and thus may portray an earlier pricing environment (e.g., 2-4 years earlier for some of the largest utility-scale systems). 23
$0
$1
$2
$3
$4
$5
$6
0 50 100 150 200 250 300
Inst
alle
d Pr
ice
(201
3$/W
DC)
System Size (MWDC)
Crystalline, Fixed-Tilt Crystalline, Tracking Thin-Film, Fixed-Tilt Thin-Film, Tracking CPV
Utility-Scale PV Installed in 2012 and 2013
energy.gov/sunshot
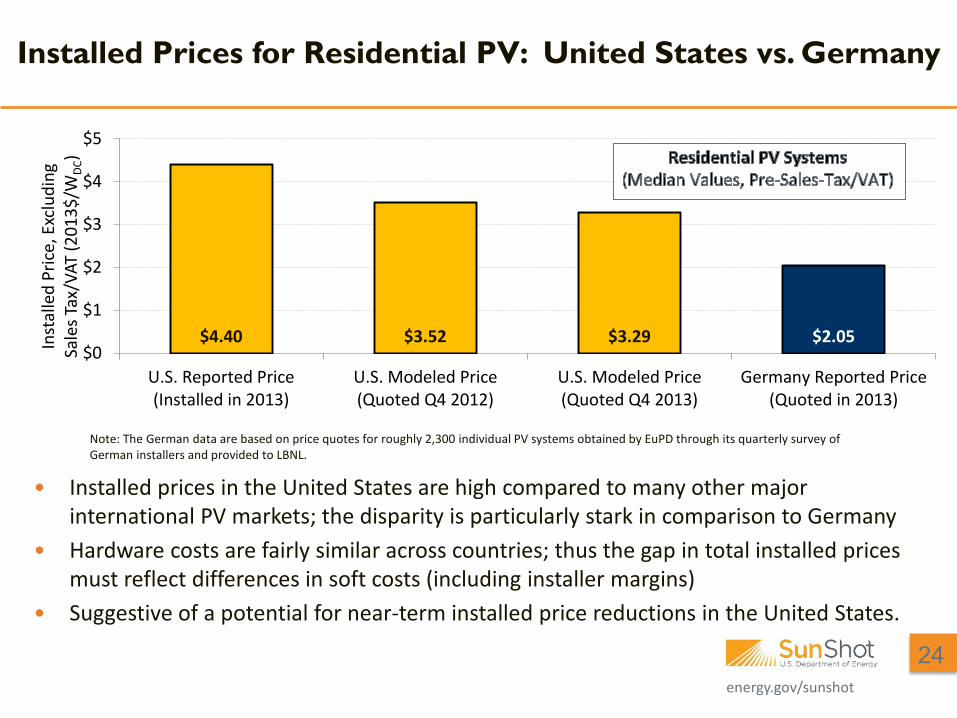
Installed Prices for Residential PV: United States vs. Germany
• Installed prices in the United States are high compared to many other major international PV markets; the disparity is particularly stark in comparison to Germany
• Hardware costs are fairly similar across countries; thus the gap in total installed prices must reflect differences in soft costs (including installer margins)
• Suggestive of a potential for near-term installed price reductions in the United States.
Note: The German data are based on price quotes for roughly 2,300 individual PV systems obtained by EuPD through its quarterly survey of German installers and provided to LBNL.
24
$4.40 $3.52 $3.29 $2.05 $0
$1
$2
$3
$4
$5
U.S. Reported Price(Installed in 2013)
U.S. Modeled Price(Quoted Q4 2012)
U.S. Modeled Price(Quoted Q4 2013)
Germany Reported Price(Quoted in 2013)
Inst
alle
d Pr
ice,
Exc
ludi
ng
Sale
s Tax
/VAT
(201
3$/W
DC)

energy.gov/sunshot
Contents
• Introduction and Summary • Historical and Recent Reported Prices • Recent Prices from Bottom-up Cost Analysis • Comparison Between Reported and Bottom-up Price Estimates • Near Future Price Trends • Conclusion
25
energy.gov/sunshot
$1.34
$0.77 $0.67 $0.64 $0.60 $0.59
$0.0
$0.2
$0.4
$0.6
$0.8
$1.0
$1.2
$1.4
$1.6
2011 2012 2013 2014P 2015P 2016P
2013
$/W
att
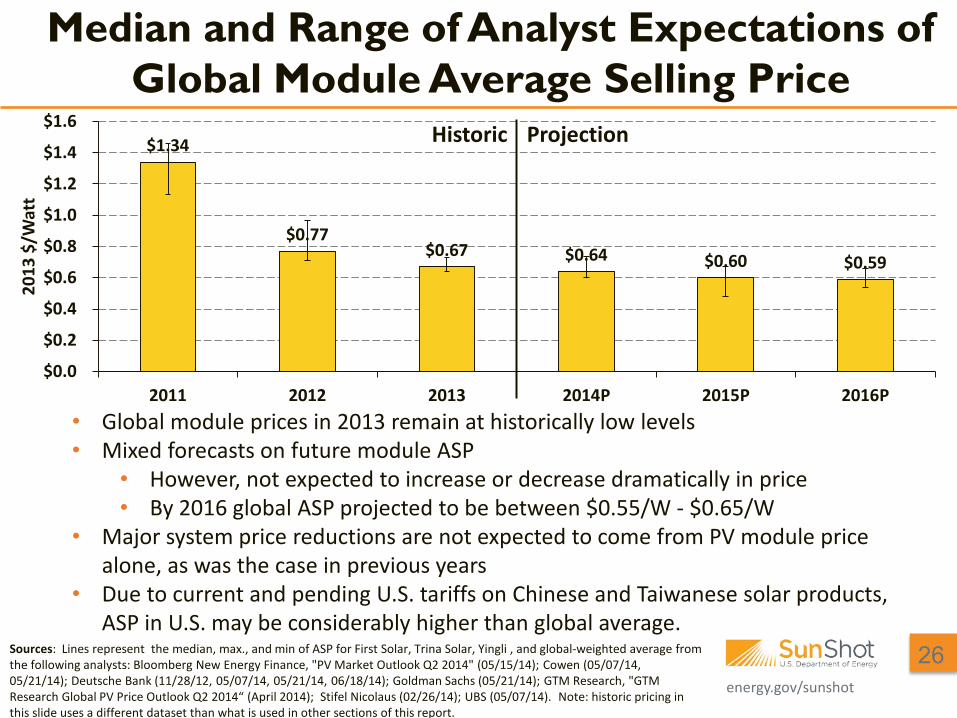
Median and Range of Analyst Expectations of Global Module Average Selling Price
Historic Projection
Sources: Lines represent the median, max., and min of ASP for First Solar, Trina Solar, Yingli , and global-weighted average from the following analysts: Bloomberg New Energy Finance, "PV Market Outlook Q2 2014" (05/15/14); Cowen (05/07/14, 05/21/14); Deutsche Bank (11/28/12, 05/07/14, 05/21/14, 06/18/14); Goldman Sachs (05/21/14); GTM Research, "GTM Research Global PV Price Outlook Q2 2014“ (April 2014); Stifel Nicolaus (02/26/14); UBS (05/07/14). Note: historic pricing in this slide uses a different dataset than what is used in other sections of this report.
• Global module prices in 2013 remain at historically low levels • Mixed forecasts on future module ASP
• However, not expected to increase or decrease dramatically in price • By 2016 global ASP projected to be between $0.55/W - $0.65/W
• Major system price reductions are not expected to come from PV module price alone, as was the case in previous years
• Due to current and pending U.S. tariffs on Chinese and Taiwanese solar products, ASP in U.S. may be considerably higher than global average.
26
energy.gov/sunshot
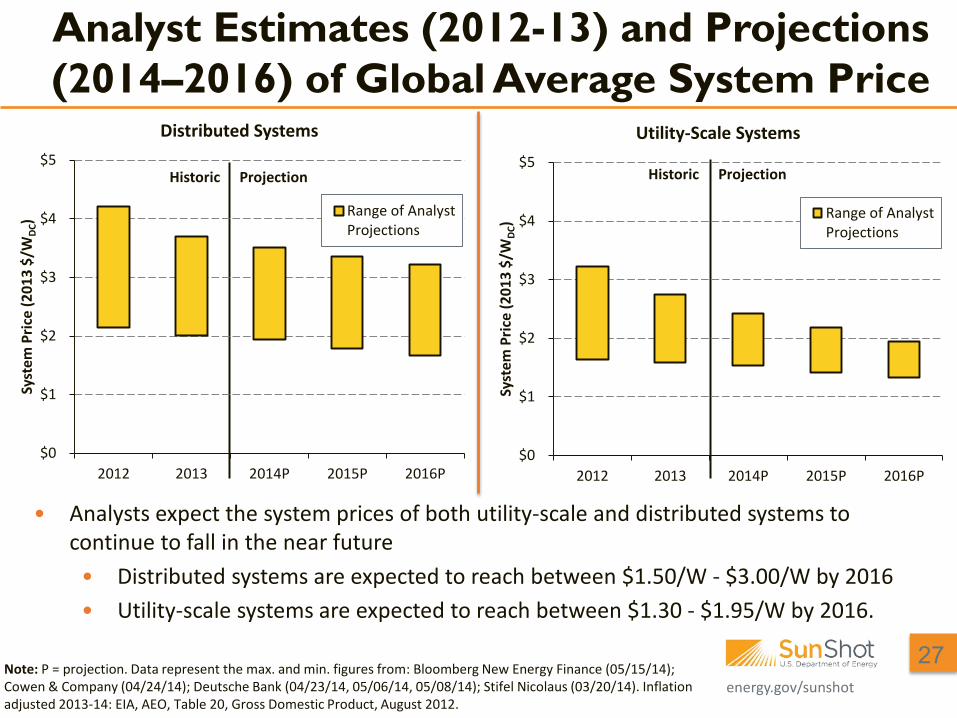
Analyst Estimates (2012-13) and Projections (2014–2016) of Global Average System Price
• Analysts expect the system prices of both utility-scale and distributed systems to continue to fall in the near future
• Distributed systems are expected to reach between $1.50/W - $3.00/W by 2016 • Utility-scale systems are expected to reach between $1.30 - $1.95/W by 2016.
Note: P = projection. Data represent the max. and min. figures from: Bloomberg New Energy Finance (05/15/14); Cowen & Company (04/24/14); Deutsche Bank (04/23/14, 05/06/14, 05/08/14); Stifel Nicolaus (03/20/14). Inflation adjusted 2013-14: EIA, AEO, Table 20, Gross Domestic Product, August 2012.
Historic Projection Historic Projection
27
$0
$1
$2
$3
$4
$5
2012 2013 2014P 2015P 2016P
Syst
em P
rice
(201
3 $/
WDC
)
Distributed Systems
Range of AnalystProjections
$0
$1
$2
$3
$4
$5
2012 2013 2014P 2015P 2016P
Syst
em P
rice
(201
3 $/
WDC
)
Utility-Scale Systems
Range of AnalystProjections
energy.gov/sunshot
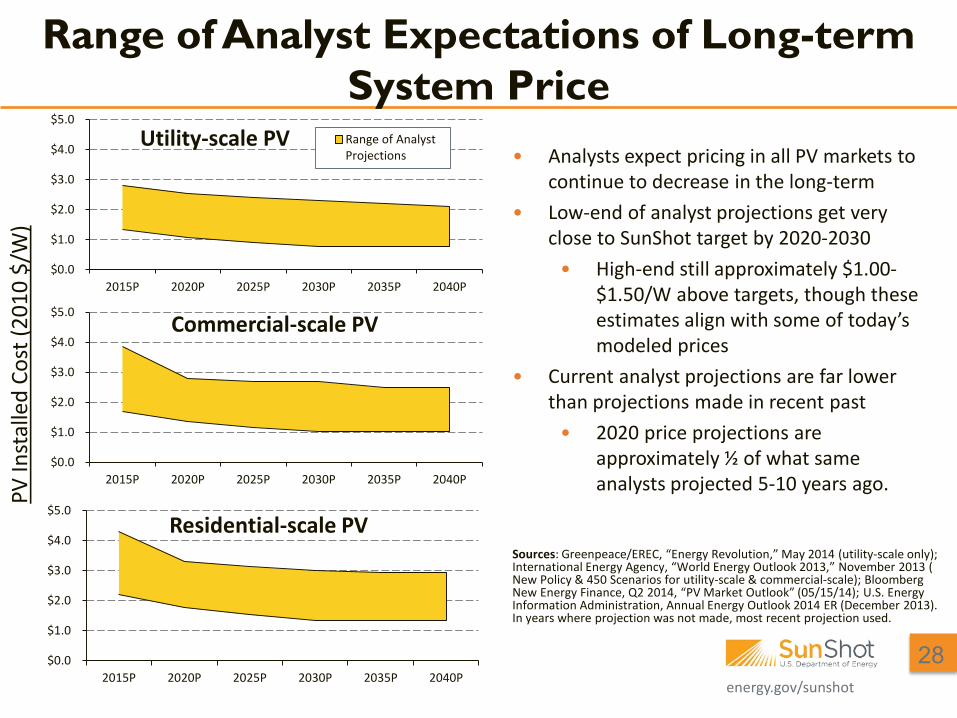
Range of Analyst Expectations of Long-term System Price
28
PV In
stal
led
Cost
(201
0 $/
W)
• Analysts expect pricing in all PV markets to continue to decrease in the long-term
• Low-end of analyst projections get very close to SunShot target by 2020-2030
• High-end still approximately $1.00-$1.50/W above targets, though these estimates align with some of today’s modeled prices
• Current analyst projections are far lower than projections made in recent past
• 2020 price projections are approximately ½ of what same analysts projected 5-10 years ago.
$0.0
$1.0
$2.0
$3.0
$4.0
$5.0
2015P 2020P 2025P 2030P 2035P 2040P
Residential-scale PV
$0.0
$1.0
$2.0
$3.0
$4.0
$5.0
2015P 2020P 2025P 2030P 2035P 2040P
Commercial-scale PV
$0.0
$1.0
$2.0
$3.0
$4.0
$5.0
2015P 2020P 2025P 2030P 2035P 2040P
Utility-scale PV Range of AnalystProjections
Sources: Greenpeace/EREC, “Energy Revolution,” May 2014 (utility-scale only); International Energy Agency, “World Energy Outlook 2013,” November 2013 ( New Policy & 450 Scenarios for utility-scale & commercial-scale); Bloomberg New Energy Finance, Q2 2014, “PV Market Outlook” (05/15/14); U.S. Energy Information Administration, Annual Energy Outlook 2014 ER (December 2013). In years where projection was not made, most recent projection used.
energy.gov/sunshot
Contents
• Introduction and Summary • Historical and Recent Reported Prices • Recent Prices from Bottom-up Cost Analysis • Comparison Between Reported and Bottom-up Price Estimates • Near Future Price Trends • Conclusion
29
energy.gov/sunshot
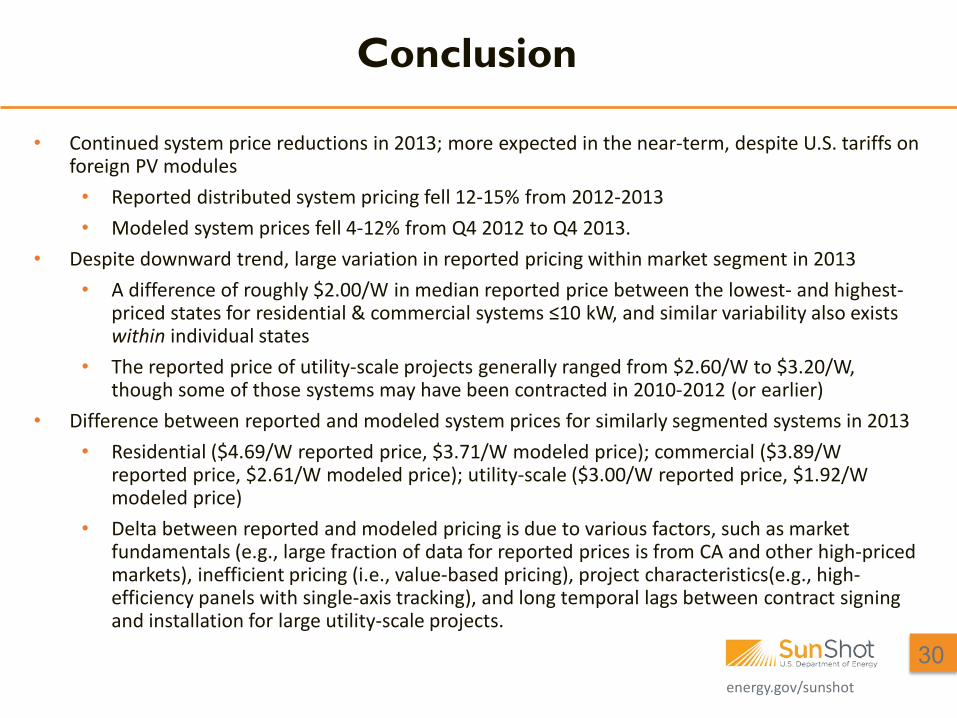
• Continued system price reductions in 2013; more expected in the near-term, despite U.S. tariffs on foreign PV modules
• Reported distributed system pricing fell 12-15% from 2012-2013 • Modeled system prices fell 4-12% from Q4 2012 to Q4 2013.
• Despite downward trend, large variation in reported pricing within market segment in 2013 • A difference of roughly $2.00/W in median reported price between the lowest- and highest-
priced states for residential & commercial systems ≤10 kW, and similar variability also exists within individual states
• The reported price of utility-scale projects generally ranged from $2.60/W to $3.20/W, though some of those systems may have been contracted in 2010-2012 (or earlier)
• Difference between reported and modeled system prices for similarly segmented systems in 2013 • Residential ($4.69/W reported price, $3.71/W modeled price); commercial ($3.89/W
reported price, $2.61/W modeled price); utility-scale ($3.00/W reported price, $1.92/W modeled price)
• Delta between reported and modeled pricing is due to various factors, such as market fundamentals (e.g., large fraction of data for reported prices is from CA and other high-priced markets), inefficient pricing (i.e., value-based pricing), project characteristics(e.g., high-efficiency panels with single-axis tracking), and long temporal lags between contract signing and installation for large utility-scale projects.
Conclusion
30
energy.gov/sunshot
• Barbose, G.; Darghouth, N.; Weaver, S.; Wiser, R. (2014). Tracking the Sun VII: An Historical Summary of the Installed Price of Photovoltaics in the United States from 1998 to 2013. Berkeley, CA: Lawrence Berkeley National Laboratory.
• Bolinger, M.; Weaver, S. (2014). Utility-Scale Solar 2013: An Empirical Analysis of Project Cost, Performance, and Pricing Trends in the United States. Berkeley, CA: Lawrence Berkeley National Laboratory.
• Davidson, C.; James, T.; Margolis, R.; Feldman, D.; Fu, R. (forthcoming). U.S. Residential Photovoltaic (PV) System Prices, Q4 2013 Benchmarks: Cash Purchase, Fair Market Value, and Prepaid Lease Transaction Prices.
• Feldman D.; Barbose, G.; Margolis, R.; Darghouth, N.; James, T.; Weaver, S.; Goodrich, A.; Wiser. R. (2013). Photovoltaic System Pricing Trends: Historical, Recent, and Near-Term Projections. 2013 Edition. NREL/PR-6A20-60207. Golden, CO: NREL.
• Feldman, D.; Barbose, G.; Margolis, R.; Wiser. R.; Darghouth, N.; Goodrich, A. (2012). Photovoltaic System Pricing Trends: Historical, Recent, and Near-Term Projections. Golden, CO: NREL.
• Feldman, D.; Friedman, B.; Margolis, R. (2013). Financing, Overhead, and Profit: An In-Depth Discussion of Costs Associated with Third-Party Financing of Residential and Commercial Photovoltaic Systems. NREL/TP-6A20-60401. Golden, CO: NREL.
• Goodrich, A.; James, T.; Woodhouse, M. (2012). Residential, Commercial, and Utility-Scale Photovoltaic (PV) System Prices in the United States: Current Drivers and Cost-Reduction Opportunities. NREL/TP-6A20-53347. Golden, CO: NREL. Accessed July 2014: http://www.nrel.gov/docs/fy12osti/53347.pdf.
• U.S. Department of Energy (DOE). (2012). SunShot Vision Study. DOE/GO-102012-3037. Washington, D.C.: DOE. Accessed 2013: http://www1.eere.energy.gov/solar/pdfs/47927.pdf.
For Further Reading, Please see the Following Reports:
31
energy.gov/sunshot
To download this briefing, please go to the following link:
http://www.nrel.gov/docs/fy14osti/62558.pdf
Thank You
David Feldman Senior Financial Analyst
National Renewable Energy Laboratory 202-488-2231
Galen Barbose Electricity Markets and Policy Group
Lawrence Berkeley National Laboratory 510-984-3453