Embed Size (px)
Citation preview

Photonic Floquet Topological Insulators in Atomic Ensembles
Yiqi Zhang1,∗ Zhenkun Wu1, Milivoj R. Belic2, Huaibin Zheng1, Zhiguo Wang1, Min Xiao3,4, and Yanpeng Zhang11Key Laboratory for Physical Electronics and Devices of the Ministryof Education & Shaanxi Key Lab of Information Photonic Technique,
Xi’an Jiaotong University, Xi’an 710049, China2Science Program, Texas A&M University at Qatar, P.O. Box 23874 Doha, Qatar
3Department of Physics, University of Arkansas, Fayetteville, Arkansas, 72701, USA4National Laboratory of Solid State Microstructures and School of Physics, Nanjing University, Nanjing 210093, China
(Dated: October 8, 2018)
We demonstrate the feasibility of realizing a photonic Floquet topological insulator (PFTIs) in anatomic ensemble. The interference of three coupling fields will split energy levels periodically, toform a periodic refractive index structure with honeycomb profile that can be adjusted by differentfrequency detunings and intensities of the coupling fields. This in turn will affect the appearanceof Dirac cones in the momentum space. When the honeycomb lattice sites are helically orderedalong the propagation direction, gaps open at Dirac points, and one obtains a PFTI in an atomicvapor. An obliquely incident beam will be able to move along the zigzag edge of the lattice withoutscattering energy into the PFTI, due to the confinement of edge states. The appearance of Diraccones and the formation of PFTI can be shut down by the third-order nonlinear susceptibility andopened up by the fifth-order one.
PACS numbers: 03.65.Ge, 03.65.Sq, 42.25.Gy, 42.65.Sf
arX
iv:1
411.
3048
v2 [
phys
ics.
optic
s] 2
8 O
ct 2
015

2
I. INTRODUCTION
Recently, topological insulators (TIs) have attracted much attention, since TI, as a new phase of matter, only allowsconducting electrons to exist on the surfaces, and the moving electrons are not affected by defects or disorder [1–3].There are edge states in TI that lie in a bulk energy gap in the momentum space and are spatially localized on theboundaries of TI. The edge states are predicted to be useful in performing quantum computations [4]. TIs, as well assome graphene-based structures, have also found potential applications in optical modulators [5, 6] and optical diodes[7]. Photonic topological insulators (PTIs), fabricated by using metamaterials [8] or helical waveguides [9], can breakthe time-reversal symmetry and lead to one-way edge states, which are robust against defects.
So far, research on PTIs has been mostly based on graphene-like structures. A honeycomb lattice [10–14] alsoexhibits certain graphene-like properties and can be obtained by using the femtosecond laser writing technique or thethree-beam interference method [15, 16]. The first method is valid only in solid materials, whereas the second methodcan be used in both solid and gas materials [17–19]. We note that the three-beam interference will generally inducea hexagonal lattice instead of the honeycomb lattice. However, the corresponding refractive index modulation willexhibit honeycomb profile in a saturable nonlinear medium or an atomic vapor.
The interference pattern (in the form of hexagonal lattice) produced by the three-beam interference will exhibitmany pairs of singularities, and the band structure of the corresponding refractive index change (in the form ofhoneycomb lattice) will feature conical singularities at the corners of the first Brillouin zone. In an atomic (e.g.rubidium) vapor, when the three-beam interference pattern serves as the dressing field, the dressed atomic systemwill exhibit controllable optical properties, which were extensively investigated in the past decade [20–22].
In this paper, we investigate the creation of photonic Floquet topological insulators (PFTIs) in an atomic ensemble,which, to the best of our knowledge, has not been studied before. Even though there is a related work done in ultracoldfermionic atoms [23], the topic of this work is quite different. It opens the possibility of generating PFTIs in atomicvapors, under physical mechanisms that are vastly different from the ones in solid state materials. One of the mainadvantages in utilizing atomic media for the generation of PFTIs is that many interesting topological properties canbe easily controlled through adjusting frequency detunings and powers of the coupling fields, as well as higher-ordernonlinear susceptibilities, which are readily available in multi-level atomic systems.
The paper is organized in the following manner. In Sec. II the model is introduced, based on an inverted Y-typeenergy level system in an atomic vapor. Section III deals with the photonic band structure and Sec. IV with thegeneration of the photonic Floquet topological insulator in the chosen system. Section V provides a discussion ofresults and Sec. VI brings conclusion.
II. THE MODEL
We consider an inverted Y-type electromagnetically induced transparency (EIT) atomic system, as shown in Fig.1(a), in which Ep probes the transition |0〉 → |1〉, the coupling field E2 drives the transition |1〉 → |2〉, and thecontrolling field E3 connects |1〉 → |3〉. The proposed scheme is for an atomic system in regular cold magneto-opticaltrap. If three coupling fields are used with the same frequency and launched along the same direction z, they willinterfere with each other [24–26], to form a two-dimensional hexagonal lattice interference pattern in the transversexy plane. The resulting Rabi frequency of such an optically induced interference pattern can be written as
G =
3∑i=1
G2 exp[ik2(x cos θi + y sin θi)], (1)
where θi = [0, 2π/3, 4π/3] are the relative phases of the three laser beams [15], k2 is the wavenumber of the couplingfields, and G2 represents Rabi frequency of the coupling field, with G2 = ℘12E2/~, where ℘12 is the electric dipolemoment. Level |1〉 can be dressed by the coupling fields [27] and split into two sublevels |+〉 and |−〉 having modified
eigenfrequencies `|±〉 = −∆2/2 ±√
∆22/4 + |G|2 with |G|2 = |G2|2[4 cos(3k2x/2) cos(
√3k2y/2) + 2 cos(
√3k2y) + 3].
Since the three coupling fields interfere with each other to form a periodic interference pattern, the sublevels |±〉 willbe periodic, as shown in Fig. 1(b) and the inset panels, in which the grid represents the original level |1〉.
Since the energy level is dressed to be periodic, the susceptibility will also have the same periodicity, which can bewritten as [29, 30]
χp(x, y) = χ(1)p + χ(3)
p |E2|2 + χ(5)p |E2|4, (2)
when only the first three (linear and nonlinear) susceptibilities are considered. In Eq. (2),
χ(1)p = iN℘2
10/~ε0[(d10 + |G|2/d20)],
3
(a) (b)
j1i
+j i
j i−
¢1
¢2
j1i
j0ij2i
Ep
E2
j3i
E3
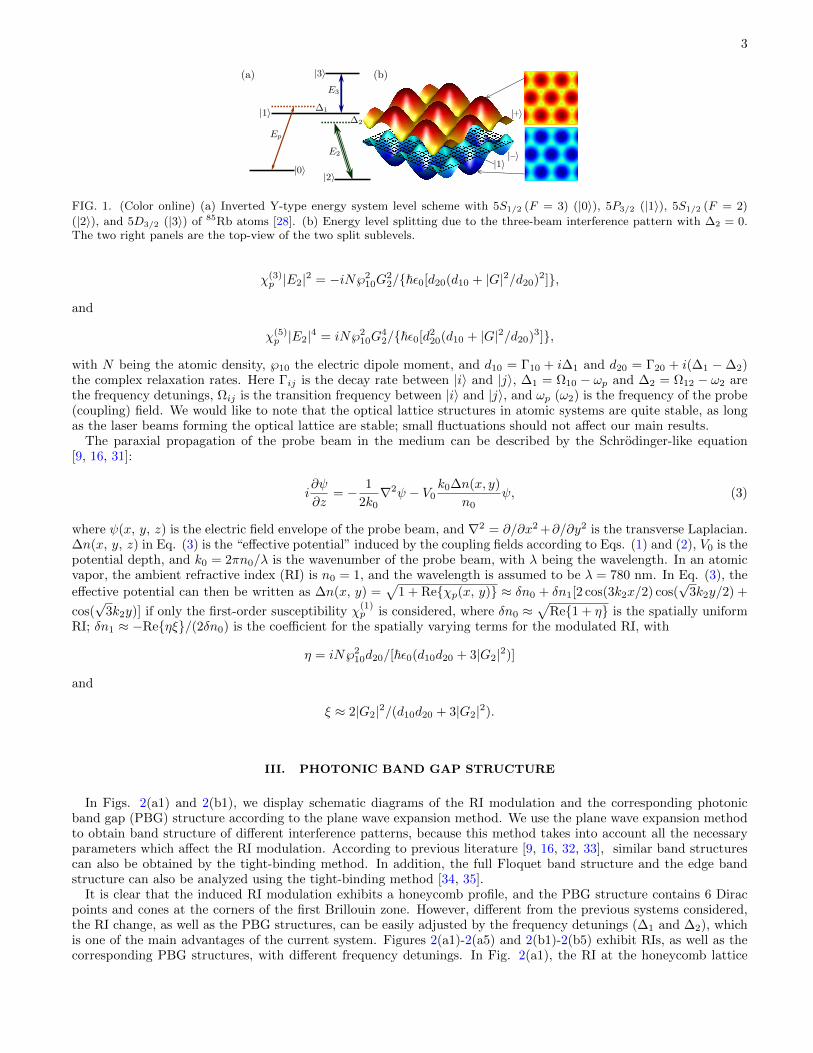
FIG. 1. (Color online) (a) Inverted Y-type energy system level scheme with 5S1/2 (F = 3) (|0〉), 5P3/2 (|1〉), 5S1/2 (F = 2)
(|2〉), and 5D3/2 (|3〉) of 85Rb atoms [28]. (b) Energy level splitting due to the three-beam interference pattern with ∆2 = 0.The two right panels are the top-view of the two split sublevels.
χ(3)p |E2|2 = −iN℘2
10G22/~ε0[d20(d10 + |G|2/d20)2],
and
χ(5)p |E2|4 = iN℘2
10G42/~ε0[d220(d10 + |G|2/d20)3],
with N being the atomic density, ℘10 the electric dipole moment, and d10 = Γ10 + i∆1 and d20 = Γ20 + i(∆1 −∆2)the complex relaxation rates. Here Γij is the decay rate between |i〉 and |j〉, ∆1 = Ω10 − ωp and ∆2 = Ω12 − ω2 arethe frequency detunings, Ωij is the transition frequency between |i〉 and |j〉, and ωp (ω2) is the frequency of the probe(coupling) field. We would like to note that the optical lattice structures in atomic systems are quite stable, as longas the laser beams forming the optical lattice are stable; small fluctuations should not affect our main results.
The paraxial propagation of the probe beam in the medium can be described by the Schrodinger-like equation[9, 16, 31]:
i∂ψ
∂z= − 1
2k0∇2ψ − V0
k0∆n(x, y)
n0ψ, (3)
where ψ(x, y, z) is the electric field envelope of the probe beam, and ∇2 = ∂/∂x2 +∂/∂y2 is the transverse Laplacian.∆n(x, y, z) in Eq. (3) is the “effective potential” induced by the coupling fields according to Eqs. (1) and (2), V0 is thepotential depth, and k0 = 2πn0/λ is the wavenumber of the probe beam, with λ being the wavelength. In an atomicvapor, the ambient refractive index (RI) is n0 = 1, and the wavelength is assumed to be λ = 780 nm. In Eq. (3), the
effective potential can then be written as ∆n(x, y) =√
1 + Reχp(x, y) ≈ δn0 + δn1[2 cos(3k2x/2) cos(√
3k2y/2) +
cos(√
3k2y)] if only the first-order susceptibility χ(1)p is considered, where δn0 ≈
√Re1 + η is the spatially uniform
RI; δn1 ≈ −Reηξ/(2δn0) is the coefficient for the spatially varying terms for the modulated RI, with
η = iN℘210d20/[~ε0(d10d20 + 3|G2|2)]
and
ξ ≈ 2|G2|2/(d10d20 + 3|G2|2).
III. PHOTONIC BAND GAP STRUCTURE
In Figs. 2(a1) and 2(b1), we display schematic diagrams of the RI modulation and the corresponding photonicband gap (PBG) structure according to the plane wave expansion method. We use the plane wave expansion methodto obtain band structure of different interference patterns, because this method takes into account all the necessaryparameters which affect the RI modulation. According to previous literature [9, 16, 32, 33], similar band structurescan also be obtained by the tight-binding method. In addition, the full Floquet band structure and the edge bandstructure can also be analyzed using the tight-binding method [34, 35].
It is clear that the induced RI modulation exhibits a honeycomb profile, and the PBG structure contains 6 Diracpoints and cones at the corners of the first Brillouin zone. However, different from the previous systems considered,the RI change, as well as the PBG structures, can be easily adjusted by the frequency detunings (∆1 and ∆2), whichis one of the main advantages of the current system. Figures 2(a1)-2(a5) and 2(b1)-2(b5) exhibit RIs, as well as thecorresponding PBG structures, with different frequency detunings. In Fig. 2(a1), the RI at the honeycomb lattice
4
(a2) (a3) (a4)
(b3) (b4)
kx ky
x=¸ y=¸
(a1)
(b1) (b2)
(a5)
(b5)
¡1
10
¡10
1
1:1
0:9
1 0:8
1:1
0:9
1 1 1 1:1
0:9
1 0:8
1:1
0:9
1 0:8
1
¡110
¡1 0 1
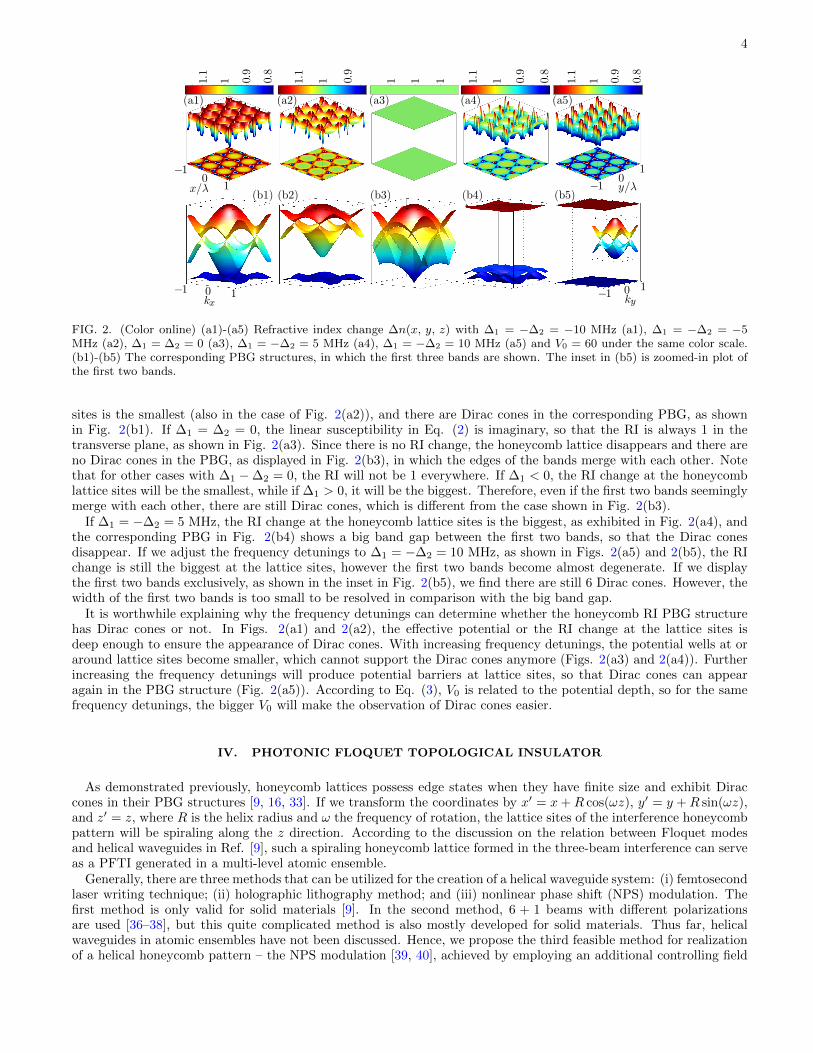
FIG. 2. (Color online) (a1)-(a5) Refractive index change ∆n(x, y, z) with ∆1 = −∆2 = −10 MHz (a1), ∆1 = −∆2 = −5MHz (a2), ∆1 = ∆2 = 0 (a3), ∆1 = −∆2 = 5 MHz (a4), ∆1 = −∆2 = 10 MHz (a5) and V0 = 60 under the same color scale.(b1)-(b5) The corresponding PBG structures, in which the first three bands are shown. The inset in (b5) is zoomed-in plot ofthe first two bands.
sites is the smallest (also in the case of Fig. 2(a2)), and there are Dirac cones in the corresponding PBG, as shownin Fig. 2(b1). If ∆1 = ∆2 = 0, the linear susceptibility in Eq. (2) is imaginary, so that the RI is always 1 in thetransverse plane, as shown in Fig. 2(a3). Since there is no RI change, the honeycomb lattice disappears and there areno Dirac cones in the PBG, as displayed in Fig. 2(b3), in which the edges of the bands merge with each other. Notethat for other cases with ∆1 −∆2 = 0, the RI will not be 1 everywhere. If ∆1 < 0, the RI change at the honeycomblattice sites will be the smallest, while if ∆1 > 0, it will be the biggest. Therefore, even if the first two bands seeminglymerge with each other, there are still Dirac cones, which is different from the case shown in Fig. 2(b3).
If ∆1 = −∆2 = 5 MHz, the RI change at the honeycomb lattice sites is the biggest, as exhibited in Fig. 2(a4), andthe corresponding PBG in Fig. 2(b4) shows a big band gap between the first two bands, so that the Dirac conesdisappear. If we adjust the frequency detunings to ∆1 = −∆2 = 10 MHz, as shown in Figs. 2(a5) and 2(b5), the RIchange is still the biggest at the lattice sites, however the first two bands become almost degenerate. If we displaythe first two bands exclusively, as shown in the inset in Fig. 2(b5), we find there are still 6 Dirac cones. However, thewidth of the first two bands is too small to be resolved in comparison with the big band gap.
It is worthwhile explaining why the frequency detunings can determine whether the honeycomb RI PBG structurehas Dirac cones or not. In Figs. 2(a1) and 2(a2), the effective potential or the RI change at the lattice sites isdeep enough to ensure the appearance of Dirac cones. With increasing frequency detunings, the potential wells at oraround lattice sites become smaller, which cannot support the Dirac cones anymore (Figs. 2(a3) and 2(a4)). Furtherincreasing the frequency detunings will produce potential barriers at lattice sites, so that Dirac cones can appearagain in the PBG structure (Fig. 2(a5)). According to Eq. (3), V0 is related to the potential depth, so for the samefrequency detunings, the bigger V0 will make the observation of Dirac cones easier.
IV. PHOTONIC FLOQUET TOPOLOGICAL INSULATOR
As demonstrated previously, honeycomb lattices possess edge states when they have finite size and exhibit Diraccones in their PBG structures [9, 16, 33]. If we transform the coordinates by x′ = x+R cos(ωz), y′ = y +R sin(ωz),and z′ = z, where R is the helix radius and ω the frequency of rotation, the lattice sites of the interference honeycombpattern will be spiraling along the z direction. According to the discussion on the relation between Floquet modesand helical waveguides in Ref. [9], such a spiraling honeycomb lattice formed in the three-beam interference can serveas a PFTI generated in a multi-level atomic ensemble.
Generally, there are three methods that can be utilized for the creation of a helical waveguide system: (i) femtosecondlaser writing technique; (ii) holographic lithography method; and (iii) nonlinear phase shift (NPS) modulation. Thefirst method is only valid for solid materials [9]. In the second method, 6 + 1 beams with different polarizationsare used [36–38], but this quite complicated method is also mostly developed for solid materials. Thus far, helicalwaveguides in atomic ensembles have not been discussed. Hence, we propose the third feasible method for realizationof a helical honeycomb pattern – the NPS modulation [39, 40], achieved by employing an additional controlling field

5
in an atomic system, as shown in Fig. 1(a).
The added controlling field E3 will split |+〉 into |+±〉 with eigenfrequencies `|+±〉 = (−∆2/2 +√
∆22/4 + |G|2) +
(∆′3/2 ±√
∆′32/4 + |G3|2), in which ∆′3 = ∆3 + (∆2/2 −
√∆2
2/4 + |G|2); ∆3 is the frequency detuning of E3 and
G3 is the Rabi frequency of E3. The NPS can be written as SNL(r, φ, z) = 2k2nX2 I3e
−[r2+l2+2rl cos(φ−φ′)]z/n0 in
the cylindrical coordinates, with r =√x2 + y2 and φ = arctan(y/x), where l and φ′ are the distance and angle of
the controlling field relative to the lattice site. Here nX2 = Reχ(3)X/(ε0cn0) is the cross-Kerr nonlinear index from
the controlling field, χ(3)X = N℘210℘
213ρ
(3)10 /(~3ε0GpG2
3), ρ(3)10 is the corresponding density-matrix element, and I3 the
intensity of the controlling field.
The NPS will introduce a transverse wave vector δk⊥(r, φ) = r(∂SNL/∂r) + φ(∂SNL/∂φ)/r = kr + kφ, with r
and φ being the unit vectors. Specifically, the momenta can be written as kr = −2SNL[r + l cos(φ − φ′)]r and
kφ = −2SNLl sin(φ−φ′)φ, which will determine the radial and azimuthal movements of the lattice sites, respectively.Therefore, if the NPS is imposed on each honeycomb lattice site, the site will be driven to rotate in the transverseplane and spiral along the propagation direction z, as elucidated by the curved waveguide in Fig. 3. Furthermore,the spiraling direction (clockwise or anticlockwise), the period of the spiral and the radius of the helical pattern canbe all adjusted through controlling the beam intensity I3 and the nonlinear index nX2 . In a hot atomic vapor, thepropagation distance z is effectively related to the atomic density, which can be easily controlled by the temperature[17, 29]. There, one can use a beam shaper to prepare the coupling fields with certain profiles. With the spatiallyshaped beams, the interference of the coupling fields will lead to a honeycomb lattice with well-defined boundaries. Onthe other hand, for cold atomic media, the boundary can be obtained by using the boundary of the magneto-opticaltrap, which is wide in comparison to the wavelength of light. For cold cigar-shaped atomic clouds, one can adjust thelength of the sample with the trap potential.
kr kÁ
xy
z
FIG. 3. (Color online) Illustrating the formation of a helical waveguide due to NPS modulation. Each lattice site forms onewaveguide.
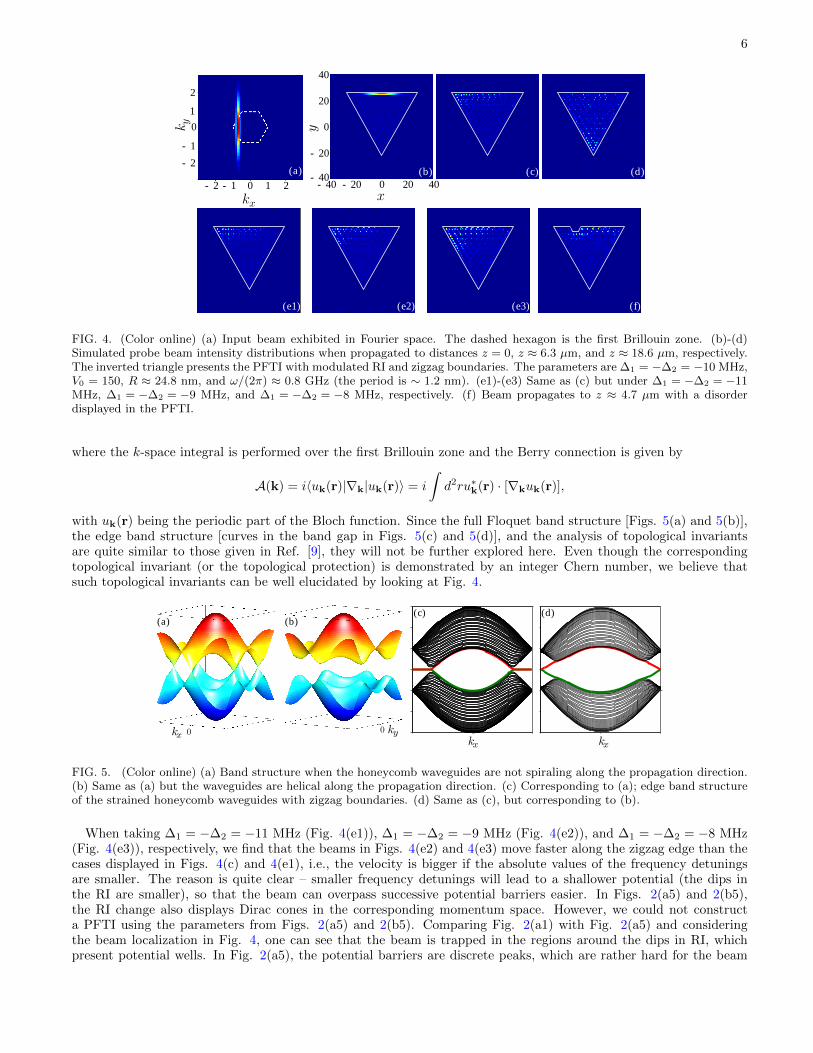
If one launches a probe beam into the medium along one edge [16], the corresponding optical properties can beeasily studied by propagating the beam according to Eq. (3). Because of the distribution of zigzag edge states inmomentum space, one should launch the incident beam obliquely. In Fig. 4(a), we show the obliquely incident beam inmomentum space with the dashed hexagon being the first Brillouin zone. It is clear that the obliquely incident beammay excite the zigzag edge state. In real space, the incident beam is shown in Fig. 4(b), in which the inverted triangleis the constructed PFTI. When the probe beam propagates to a distance of z ≈ 6.3 µm, the intensity distribution isnumerically stimulated and exhibited in Fig. 4(c). Comparing Fig. 4(c) with Fig. 4(b), one can see that the beammoves to the left (counterclockwise) along the zigzag edge without scattering energy into the bulk of PFTI. When thebeam further propagates to z ≈ 18.6 µm, it moves to the bottom corner of the PFTI (Fig. 4(d)), and still there isnearly no energy scattered into PFTI. The phenomenon displayed in Figs. 4(b)-4(d) can be naturally explained by thefollowing two arguments: (I) The zigzag edge state is excited by the obliquely incident beam, so that the confinementof the edge state prohibits the scattering of the beam into the bulk during propagation. (II) The honeycomb latticesites are spiraling along the z direction; such a structure helps the edge state attain an effective velocity along thepropagation distance z, which enables the probe beam to move one-way (anticlockwise) along the zigzag edge.
V. DISCUSSION
In Fig. 5, we show the full band structure and the corresponding edge band structure for a spiraling and non-spiraling lattice. One can see that Dirac points in Fig. 5(a) are eliminated in Fig. 5(b), creating a PFTI. Thetopological invariant for each band shown in Fig. 5 can be evaluated by the Chern number [41–43], which is given by
C =1
2π
∫BZ
d2k∇k ×A(k),
6
-40 -20 0 20 40
-20
0
20
40
-2 0 2
-2
0
2
1
-40
x
y
kx
k y(a) (b) (c) (d)
(e1) (e2) (e3) (f)
-1 1
-1
FIG. 4. (Color online) (a) Input beam exhibited in Fourier space. The dashed hexagon is the first Brillouin zone. (b)-(d)Simulated probe beam intensity distributions when propagated to distances z = 0, z ≈ 6.3 µm, and z ≈ 18.6 µm, respectively.The inverted triangle presents the PFTI with modulated RI and zigzag boundaries. The parameters are ∆1 = −∆2 = −10 MHz,V0 = 150, R ≈ 24.8 nm, and ω/(2π) ≈ 0.8 GHz (the period is ∼ 1.2 nm). (e1)-(e3) Same as (c) but under ∆1 = −∆2 = −11MHz, ∆1 = −∆2 = −9 MHz, and ∆1 = −∆2 = −8 MHz, respectively. (f) Beam propagates to z ≈ 4.7 µm with a disorderdisplayed in the PFTI.
where the k-space integral is performed over the first Brillouin zone and the Berry connection is given by
A(k) = i〈uk(r)|∇k|uk(r)〉 = i
∫d2ru∗k(r) · [∇kuk(r)],
with uk(r) being the periodic part of the Bloch function. Since the full Floquet band structure [Figs. 5(a) and 5(b)],the edge band structure [curves in the band gap in Figs. 5(c) and 5(d)], and the analysis of topological invariantsare quite similar to those given in Ref. [9], they will not be further explored here. Even though the correspondingtopological invariant (or the topological protection) is demonstrated by an integer Chern number, we believe thatsuch topological invariants can be well elucidated by looking at Fig. 4.
kx0 ky0
kx
kx
(a) (b)(c) (d)
FIG. 5. (Color online) (a) Band structure when the honeycomb waveguides are not spiraling along the propagation direction.(b) Same as (a) but the waveguides are helical along the propagation direction. (c) Corresponding to (a); edge band structureof the strained honeycomb waveguides with zigzag boundaries. (d) Same as (c), but corresponding to (b).
When taking ∆1 = −∆2 = −11 MHz (Fig. 4(e1)), ∆1 = −∆2 = −9 MHz (Fig. 4(e2)), and ∆1 = −∆2 = −8 MHz(Fig. 4(e3)), respectively, we find that the beams in Figs. 4(e2) and 4(e3) move faster along the zigzag edge than thecases displayed in Figs. 4(c) and 4(e1), i.e., the velocity is bigger if the absolute values of the frequency detuningsare smaller. The reason is quite clear – smaller frequency detunings will lead to a shallower potential (the dips inthe RI are smaller), so that the beam can overpass successive potential barriers easier. In Figs. 2(a5) and 2(b5),the RI change also displays Dirac cones in the corresponding momentum space. However, we could not constructa PFTI using the parameters from Figs. 2(a5) and 2(b5). Comparing Fig. 2(a1) with Fig. 2(a5) and consideringthe beam localization in Fig. 4, one can see that the beam is trapped in the regions around the dips in RI, whichpresent potential wells. In Fig. 2(a5), the potential barriers are discrete peaks, which are rather hard for the beam

7
to overcome and obtain transverse velocity. Note that the positive change in RI, ∆n(x, y, z) > 0, (the red regions inFig. 2) indicates the attractive of focusing effective potential, whereas ∆n(x, y, z) < 0 (the blue regions) indicatesrepulsive or defocusing potential.
On the other hand, when the first two bands are almost degenerate, the edge states will be too weak to confine thebeam to the edge. This tendency is already visible in Fig. 4(e3), where the detunings are smaller and the scatteringinto bulk is larger. Various numerical simulations indicate that ∆1 = −∆2 > 0 would not support the formation ofPFTI. So, the appearance of Dirac cones in momentum space is not the sufficient condition for realizing PFTI. Byfixing ∆1 = −∆2 = −10 MHz, we can change the intensities of the coupling fields to investigate the properties ofthe constructed PFTI. We find that the velocity of the moving beam increases with the increasing intensities of thecoupling fields. If the PFTI possesses a disorder, as shown in Fig. 4(f), the beam will move around it, due to thetopological protection.
−1
0
1
y=¸
−1 0 1x=¸
(a1) (a2) (a3) (b)
PB
G
kx
ky−1
0 1
10−1
(c1) (c2)
1.1
1.2
1.3
−0.4
−0.2
0
0.2
0.4
0.6
(c3)
3rd band
1st & 2nd bands
FIG. 6. (Color online) (a1)-(a3) Real parts of χ(1)p , χ
(3)p |E2|2 and χ
(5)p |E2|4, respectively. (b) Modulated RI patterns with χ
(1)p ,
χ(3)p |E2|2 and χ
(5)p |E2|4 all considered. Parameters are ∆1 = 0, ∆2 = 10 MHz and G2 = 10 MHz. (c) PBG structures for RI
with χ(1)p (c1), χ
(1)p + χ
(3)p |E2|2 (c2), and χ
(1)p + χ
(3)p |E2|2 + χ
(5)p |E2|4 (c3) considered, respectively.
When the coupling beam intensities are high enough, the third- and fifth-order nonlinear susceptibilities (χ(3)p |E2|2
and χ(5)p |E2|4) come into play and should be taken into account [29, 30, 44–46]. Then, the total susceptibility should
be modified to
∆n(x, y) ≈ δn0+
δn1[2 cos(3k2x/2) cos(√
3k2y/2) + cos(√
3k2y)]+
δn2[2 cos(3k2x/2) cos(√
3k2y/2) + cos(√
3k2y)]2+
δn4[2 cos(3k2x/2) cos(√
3k2y/2) + cos(√
3k2y)]3,
with δn2 and δn4 being the higher-order nonlinearity coefficients, which are connected with the Rabi frequencies andfrequency detunings. Here, we have
δn0 ≈√
1 + Re(1− τ + τ2)η,
δn1 ≈ −Re(1− 2τ + 3τ2)ηξ/(2δn0),
δn2 ≈ Re(1− 3τ + 6τ2)ηξ2/(2δn0),
and
δn3 ≈ −Re(1− 4τ + 10τ2)ηξ3/(2δn0),
with τ = G22/(d10d20 + G2
2). With an increasing G2, the influence of higher-order nonlinear susceptibilities grows,which will modify the RI patterns significantly. Taking ∆1 = −∆2 = −10 MHz as an example, G2 > 19.5 MHz will

8
make the RI complex, so that the beam may undergo gain or loss during propagation [32], which may provide a wayto study the PT symmetry in atomic ensembles [47, 48].
In Figs. 6(a1)-6(a3), we plot the real parts of the susceptibilities χ(1)p , χ
(3)p |E2|2 and χ
(5)p |E2|4, respectively, under
the same color scale, with ∆1 = 0, ∆2 = 10 MHz and G2 = 10 MHz. It is clear that the signs of the first- andfifth-order susceptibilities are the same, while the third-order susceptibility has the opposite sign. The RI values of
χ(1)p at the lattice sites will change when the modifications of χ
(3)p |E2|2 and χ
(5)p |E2|4 are added. In Fig. 6(b), we
display the total RI pattern with all three susceptibilities considered. Thus, the RI values at the lattice sites can becontrolled through manipulating the frequency detunings and intensities of the coupling fields.
The PBG structures of the RI for χ(1)p , χ
(1)p + χ
(3)p |E2|2 and χ
(1)p + χ
(3)p |E2|2 + χ
(5)p |E2|4 are shown in Figs. 6(c1),
6(c2) and 6(c3), respectively. Dirac cones clearly appear in Fig. 6(c1). However, in Fig. 6(c2) the first two bands arenearly degenerate and flat, with a wide band gap between them and the third band [49], which is quite similar to thecase in Fig. 2(b5). The flat bands mean that only the light with very special propagation constants can be allowedto couple among the sites of honeycomb lattice. The reason for the appearance of flat bands is that the third-ordernonlinear susceptibility makes the bands collapse [50]. As a result, the PFTI cannot be formed when the third-ordernonlinear susceptibility is included with given parameters. However, when the fifth-order nonlinear susceptibility isalso included, one sees that the Dirac cones reappear again in the first two bands, as shown in Fig. 6(c3). Therefore,the third-order nonlinear susceptibility shuts down and the fifth-order nonlinear susceptibility reopens the Dirac cones.Therefore, the high-order nonlinear susceptibilities can serve as a kind of switch, which determines the appearanceand disappearance of Dirac cones in the momentum space, and so the formation of PFTIs in the system.
VI. CONCLUSION
In summary, we have proposed a scheme for construction of PFTIs in multi-level atomic vapor ensembles. Theformed PFTIs in atomic ensembles can be easily controlled and reconfigured by adjusting the frequency detunings,coupling field intensities, and high-order nonlinear susceptibilities, which shows the advantages of using atomic en-sembles to study PFTI properties in comparison with other solid media. The PFTIs should also exist in other typesof multi-level atomic systems. Easy controllability of the spiraling and the switching property of higher-order suscep-tibilities establish a new platform for better understanding of the topological protection and open potential photonicdevice applications of PFTIs.
ACKNOWLEDGEMENT
This work was supported by the 973 Program (2012CB921804), KSTIT of Shaanxi province (2014KCT-10), CPSF(2014T70923, 2012M521773), NSFC (61308015, 11474228), NSFC of Shaanxi province (2014JQ8341), and the NPRP6-021-1-005 project of the Qatar National Research Fund (a member of the Qatar Foundation). Yiqi Zhang appreciatesthe helpful discussions with Dr. Ruimin Wang.
[1] C. L. Kane and E. J. Mele, Phys. Rev. Lett. 95, 226801 (2005).[2] D. Hsieh, D. Qian, L. Wray, Y. Xia, Y. S. Hor, R. J. Cava, and M. Z. Hasan, Nature 452, 970 (2008).[3] M. Z. Hasan and C. L. Kane, Rev. Mod. Phys. 82, 3045 (2010).[4] X.-L. Qi and S.-C. Zhang, Rev. Mod. Phys. 83, 1057 (2011).[5] M. Liu, X. Yin, E. Ulin-Avila, B. Geng, T. Zentgraf, L. Ju, F. Wang, and X. Zhang, Nature 474, 64 (2011).[6] H. Yu, H. Zhang, Y. Wang, C. Zhao, B. Wang, S. Wen, H. Zhang, and J. Wang, Laser Photon. Rev. 7, L77 (2013).[7] G. Q. Liang and Y. D. Chong, Phys. Rev. Lett. 110, 203904 (2013).[8] A. B. Khanikaev, S. H. Mousavi, W.-K. Tse, M. Kargarian, A. H. MacDonald, and G. Shvets, Nat. Mater. 12, 233 (2012).[9] M. C. Rechtsman, J. M. Zeuner, Y. Plotnik, Y. Lumer, D. Podolsky, F. Dreisow, S. Nolte, M. Segev, and A. Szameit,
Nature 496, 196 (2013).[10] O. Peleg, G. Bartal, B. Freedman, O. Manela, M. Segev, and D. N. Christodoulides, Phys. Rev. Lett. 98, 103901 (2007).[11] M. J. Ablowitz, S. D. Nixon, and Y. Zhu, Phys. Rev. A 79, 053830 (2009).[12] K. L. Lee, B. Gremaud, R. Han, B.-G. Englert, and C. Miniatura, Phys. Rev. A 80, 043411 (2009).[13] O. Bahat-Treidel, O. Peleg, M. Grobman, N. Shapira, M. Segev, and T. Pereg-Barnea, Phys. Rev. Lett. 104, 063901
(2010).[14] O. Bahat-Treidel and M. Segev, Phys. Rev. A 84, 021802 (2011).

9
[15] B. Terhalle, T. Richter, A. S. Desyatnikov, D. N. Neshev, W. Krolikowski, F. Kaiser, C. Denz, and Y. S. Kivshar, Phys.Rev. Lett. 101, 013903 (2008).
[16] Y. Plotnik, M. C. Rechtsman, D. Song, M. Heinrich, J. M. Zeuner, S. Nolte, Y. Lumer, N. Malkova, J. Xu, A. Szameit,Z. C. Chen, and M. Segev, Nat. Mater. 13, 57 (2014).
[17] Y. Zhang, Z. Wang, Z. Nie, C. Li, H. Chen, K. Lu, and M. Xiao, Phys. Rev. Lett. 106, 093904 (2011).[18] Y. Zhang, Z. Nie, Y. Zhao, C. Li, R. Wang, J. Si, and M. Xiao, Opt. Express 18, 10963 (2010).[19] Y. Zhang, C. Yuan, Y. Zhang, H. Zheng, H. Chen, C. Li, Z. Wang, and M. Xiao, Laser Phys. Lett. 10, 055406 (2013).[20] M. Artoni and G. C. La Rocca, Phys. Rev. Lett. 96, 073905 (2006).[21] Y. Zhang, X. Yao, C. Yuan, P. Li, J. Yuan, W. Feng, S. Jia, and Y. Zhang, IEEE Photon. J. 4, 2057 (2012).[22] D.-W. Wang, H.-T. Zhou, M.-J. Guo, J.-X. Zhang, J. Evers, and S.-Y. Zhu, Phys. Rev. Lett. 110, 093901 (2013).[23] G. Jotzu, M. Messer, R. Desbuquois, M. Lebrat, T. Uehlinger, D. Greif, and T. Esslinger, Nature 515, 237 (2014).[24] W. Pang, J. Wu, Z. Yuan, Y. Liu, and G. Chen, J. Phys. Soc. Jap. 80, 113401 (2011).[25] Y. Li, B. A. Malomed, M. Feng, and J. Zhou, Phys. Rev. A 82, 063813 (2010).[26] Y. Li, W. Pang, S. Fu, and B. A. Malomed, Phys. Rev. A 85, 053821 (2012).[27] J.-H. Wu, M. Artoni, and G. C. L. Rocca, J. Opt. Soc. Am. B 25, 1840 (2008).[28] D. A. Steck, http://steck.us/alkalidata.[29] Z. Wu, Y. Zhang, C. Yuan, F. Wen, H. Zheng, Y. Zhang, and M. Xiao, Phys. Rev. A 88, 063828 (2013).[30] A. Paredes, D. Feijoo, and H. Michinel, Phys. Rev. Lett. 112, 173901 (2014).[31] N. K. Efremidis, J. Hudock, D. N. Christodoulides, J. W. Fleischer, O. Cohen, and M. Segev, Phys. Rev. Lett. 91, 213906
(2003).[32] A. Szameit, M. C. Rechtsman, O. Bahat-Treidel, and M. Segev, Phys. Rev. A 84, 021806 (2011).[33] M. C. Rechtsman, Y. Plotnik, J. M. Zeuner, D. Song, Z. Chen, A. Szameit, and M. Segev, Phys. Rev. Lett. 111, 103901
(2013).[34] T. Oka and H. Aoki, Phys. Rev. B 79, 081406 (2009).[35] K. Fang, Z. Yu, and S. Fan, Opt. Express 21, 18216 (2013).[36] S. R. Kennedy, M. J. Brett, O. Toader, and S. John, Nano Lett. 2, 59 (2002).[37] Y. K. Pang, J. Lee, H. Lee, W. Y. Tam, C. Chan, and P. Sheng, Opt. Express 13, 7615 (2005).[38] K. K. Seet, V. Mizeikis, S. Matsuo, S. Juodkazis, and H. Misawa, Adv. Mater. 17, 541 (2005).[39] G. P. Agrawal, Phys. Rev. Lett. 64, 2487 (1990).[40] J. M. Hickmann, A. S. L. Gomes, and C. B. de Araujo, Phys. Rev. Lett. 68, 3547 (1992).[41] F. D. M. Haldane and S. Raghu, Phys. Rev. Lett. 100, 013904 (2008).[42] Z. Wang, Y. Chong, J. D. Joannopoulos, and M. Soljacic, Nature 461, 772 (2009).[43] J. Zak, Phys. Rev. Lett. 62, 2747 (1989).[44] D. Mihalache, D. Mazilu, I. Towers, B. A. Malomed, and F. Lederer, Phys. Rev. E 67, 056608 (2003).[45] A. S. Desyatnikov, D. Mihalache, D. Mazilu, B. A. Malomed, C. Denz, and F. Lederer, Phys. Rev. E 71, 026615 (2005).[46] H. Michinel, M. J. Paz-Alonso, and V. M. Perez-Garcıa, Phys. Rev. Lett. 96, 023903 (2006).[47] C. Hang, G. Huang, and V. V. Konotop, Phys. Rev. Lett. 110, 083604 (2013).[48] J. Sheng, M.-A. Miri, D. N. Christodoulides, and M. Xiao, Phys. Rev. A 88, 041803 (2013).[49] K. Sun, Z. Gu, H. Katsura, and S. Das Sarma, Phys. Rev. Lett. 106, 236803 (2011).[50] A. Crespi, G. Corrielli, G. D. Valle, R. Osellame, and S. Longhi, New J. Phys. 15, 013012 (2013).