Embed Size (px)
Citation preview
molecules
Article
Photochemistry of the α-Al2O3-PETN Interface
Roman V. Tsyshevsky 1, Anton Zverev 2,3, Anatoly Mitrofanov 2,3, Sergey N. Rashkeev 1,4 andMaija M. Kuklja 1,*
1 Department of Materials Science and Engineering, University of Maryland, College Park, MD 20742, USA;[email protected] (R.V.T.); [email protected] (S.N.R.)
2 Department of Organic and Physical Chemistry, Kemerovo State University, Kemerovo 650043, Russia;[email protected] (A.Z.); [email protected] (A.M.)
3 Yurga Institute of Technology, National Research Tomsk Polytechnic University, Yurga 652057, Russia4 Qatar Environment & Energy Research Institute, Hamad Bin Khalifa University, Qatar Foundation,
P.O. Box 5825, Doha, Qatar* Correspondance: [email protected] or [email protected]; Tel.: +1-703-292-4940
Academic Editors: Scott Reed and Marino ResendizReceived: 13 January 2016 ; Accepted: 23 February 2016 ; Published: 29 February 2016
Abstract: Optical absorption measurements are combined with electronic structure calculationsto explore photochemistry of an α-Al2O3-PETN interface formed by a nitroester (pentaerythritoltetranitrate, PETN, C5H8N4O12) and a wide band gap aluminum oxide (α-Al2O3) substrate. The firstprinciples modeling is used to deconstruct and interpret the α-Al2O3-PETN absorption spectrumthat has distinct peaks attributed to surface F0-centers and surface—PETN transitions. We predict thelow energy α-Al2O3 F0-center—PETN transition, producing the excited triplet state, and α-Al2O3
F0-center—PETN charge transfer, generating the PETN anion radical. This implies that irradiation bycommonly used lasers can easily initiate photodecomposition of both excited and charged PETN atthe interface. The feasible mechanism of the photodecomposition is proposed.
Keywords: singlet-triplet exciton; electronically excited and charged state; decomposition barrier;initiation of detonation; explosives; F-centers; oxygen vacancy
1. Introduction
With many unresolved research challenges, photo-stimulated processes in composite systems,containing several components, became important objects of study by many researchers in differentareas of chemistry, physics, and material science. Applications of photo-processes are compellingbut interactions of materials with light are manifested in many different ways and hence are stillpoorly understood. For example, charge carrier excitations in light-sensitizer (dye) organometallicmolecules with subsequent charge transfer to metal oxides are widely studied for developing novelefficient solar cells [1–3]. In contrast to photovoltaics, in photocatalysis [1,4], charge carriers formed byabsorption of photons remain in the photocatalyst and do not transfer across the interfaces. The abilityof the material to change its electro-physical properties (the band gap, electroconductivity, and thetype of conductivity) under adsorption of gas molecules is employed for developing solid state gassensors. Photo-sensitivity and selectivity of nanostructures [5,6], organic molecules [7], metal-organicframeworks [8], and polymers [9–12] among other systems have been long explored for sensing [13,14],and detecting [15–17] of high-power explosives, in order to prevent threats to human security, locateburied land mines, and aid environmental protection efforts.
Our current research was inspired by an idea of achieving a highly controllable explosivedecomposition chemistry initiated by photo-excitation with standard available lasers. In a seriesof recent experiments [18–21] and quantum-chemical simulations [22,23], it was fundamentally
Molecules 2016, 21, 289; doi:10.3390/molecules21030289 www.mdpi.com/journal/molecules
Molecules 2016, 21, 289 2 of 13
established that the decomposition of a high explosive material, PETN, can be reliably triggeredby laser irradiation once PETN crystals are mixed with a small fraction of micron size metal oxide(e.g., MgO) powders. This demonstrated that there is a strong dependence of the initiation processon the presence of the oxide. The PETN and MgO are wide gap dielectrics, which are completelytransparent to the laser light of 1.17 eV [20,21]. However, once they form an interface, or a composite,their optical, electronic, and photochemical properties significantly change. Thus, oxygen vacancies atthe MgO surface facilitate strong chemical adsorption of PETN on MgO, induce a charge transfer, andconsequently may initiate the PETN decomposition by laser light with the photon energy of 1.17 eV,with an unusually low activation barrier [22,23].
To validate and refine the notion of laser initiation of explosive decomposition chemistry inhigh energy density materials, we explored an α-Al2O3-PETN composite. We expect that this systemis somewhat different from the MgO-PETN composite but it will exhibit similar photo-chemistryand enrich our knowledge of organic crystal—oxide composite systems. Here we report results ofthe combined theoretical and experimental study of the electronic structure, optical properties, andphotodecomposition of α-Al2O3-PETN composite by Nd:YAG laser irradiation (1.17 and 2.33 eV) inorder to understand: (i) how optical absorption of the composite material differs from the propertiesof the pristine individual PETN and α-Al2O3 materials; and (ii) how the defect- and interface-inducedchanges of the electronic structure affect the chemical reactivity of adsorbed molecules. The developedmethodology and achieved conclusions will further clarify atomic scale mechanisms of charge transferon surface defects and interfaces between molecular crystals and oxides thus providing a solid basisfor fundamental understanding of decomposition chemistry of highly energetic materials, energystorage and conversion, photocatalysis, and molecular electronics.
2. Results and Discussion
2.1. Optical Absorption of α-Al2O3-PETN Composites
2.1.1. Structures of Model Supercells
To study optical absorption of α-Al2O3-PETN composites, we started with performing electronicstructure calculations of the pristine α-Al2O3 (0001) surface, surface containing oxygen vacancies andthe α-Al2O3 (0001) surface with adsorbed PETN molecules. Taking into account that the electronicstructure of an organic molecular crystal is nearly fully defined by the electronic structure ofconstituting molecules, we constructed simplified model supercells, which consist of an individualPETN molecule positioned at the (0001) α-Al2O3 surface (Figure 1). Similar model structures havebeen recently employed to investigate the photo-chemistry of the PETN-MgO interfaces [22] andinteractions of various nitro-containing molecules with silicon [24], aluminum [25], and aluminumoxide [26] surfaces.
To simulate the Al2O3 surface we used a periodic slab model. Surface slab was cut from the bulkα-Al2O3 structure to form the surface with the (0001) orientation, with the supercell lattice vectorsof a =14.288, b =16.499 Å, and c =26.169 Å. The vacuum layer of 20 Å placed on the top of the (0001)Al2O3 surface was intended to minimize interactions between supercells in z direction and to ensurethat electronic states of different slabs do not overlap.
Further, individual PETN molecules were placed on an ideal (0001) α-Al2O3 surface (Figure 1).The orientation of the PETN molecule was chosen in such a way that it mimics the interface between(0001) α-Al2O3 and (110) and (101) low energy facets [27–29] of the PETN crystal (Figure 1a,b).
In the fully relaxed structural configuration-1 (with the relative position of the PETN moleculeversus the oxide surface corresponding to its orientation at the PETN crystal (110) surface; Figure 1a),oxygen atoms of nitro groups are located above the surface aluminum atoms. The calculted interatomicdistances between O and surface Al atoms are 2.000 and 2.168 Å, respectively.
Molecules 2016, 21, 289 3 of 13Molecules 2016, 21, 3 3 of 13
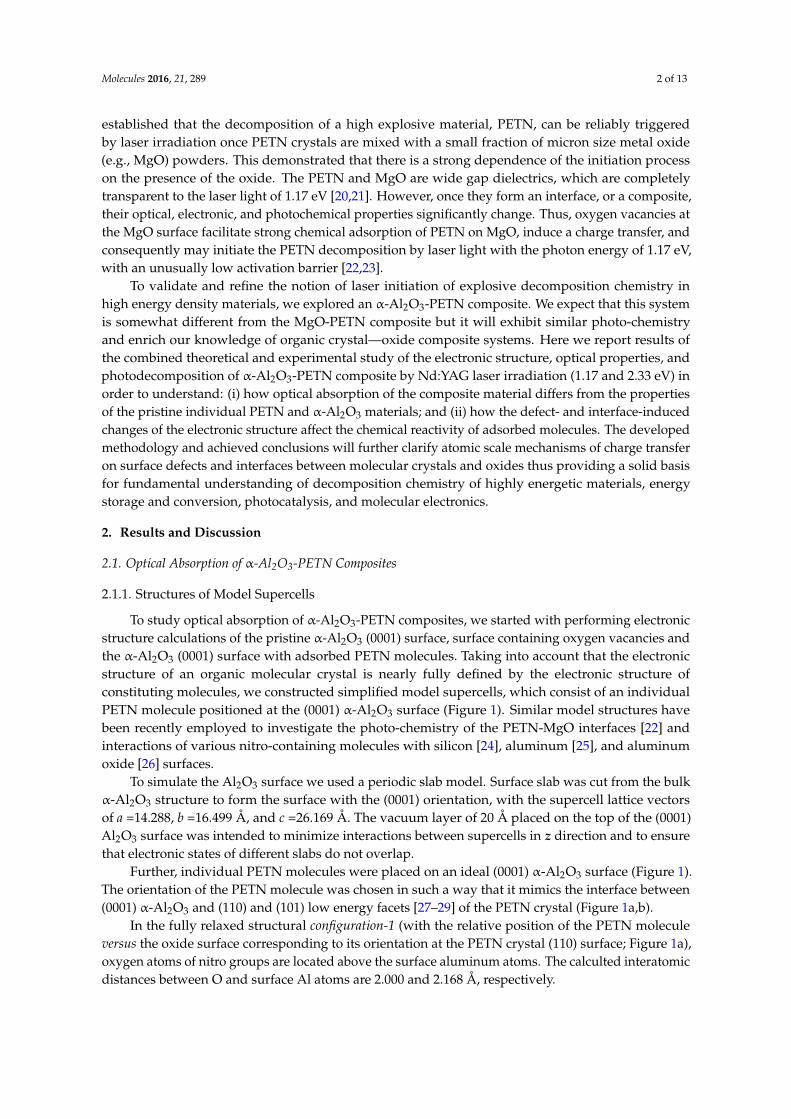
Figure 1. Schematics of the model supercells representing a PETN molecule adsorbed at the (0001) α-Al2O3 surface. The configuration of the PETN molecule corresponds to its relaxed position at the interface between (0001) α-Al2O3 and (a) (110) and (b) (101) PETN crystal surfaces. Bader charges localized on PETN molecules are also shown.
Further, individual PETN molecules were placed on an ideal (0001) α-Al2O3 surface (Figure 1). The orientation of the PETN molecule was chosen in such a way that it mimics the interface between (0001) α-Al2O3 and (110) and (101) low energy facets [27–29] of the PETN crystal (Figure 1a,b).
In the fully relaxed structural configuration-1 (with the relative position of the PETN molecule versus the oxide surface corresponding to its orientation at the PETN crystal (110) surface; Figure 1a), oxygen atoms of nitro groups are located above the surface aluminum atoms. The calculted interatomic distances between O and surface Al atoms are 2.000 and 2.168 Å, respectively.
The orientation of the PETN molecule in the configuration-2 (Figure 1b) corresponds to its orientation at the (101) surface of PETN crystal with only one C-CH2-O-NO2 tail of the PETN molecule directed almost perpendicualar to the surface. In this model, one of the O atoms of the NO2 group is located above the aluminum atom at the distance of 1.992 Å.
Because van der Waals interactions are important for the accurate determintion of adsorption/desorption energies, we included vDW corrections in our calculations. The calculated binding energy for the PETN molecule adsorbed on the α-Al2O3 surface in the configuration-1 (1.59 eV) is two times higher than that obtained from the configuration-2 (0.80 eV). A comparison of the adsorbtion energies obtained for α-Al2O3-PETN with those reported earlier for MgO-PETN system (0.43 eV) [22] indicates significantly stronger binding of the PETN molecule to Al2O3 than to MgO surface. This actually means that the Al2O3-PETN interface should be more stable than MgO-PETN.
2.1.2. Optical Absorption of the Pristine α-Al2O3 (0001) Surface
Figure 1. Schematics of the model supercells representing a PETN molecule adsorbed at the (0001)α-Al2O3 surface. The configuration of the PETN molecule corresponds to its relaxed position at theinterface between (0001) α-Al2O3 and (a) (110) and (b) (101) PETN crystal surfaces. Bader chargeslocalized on PETN molecules are also shown.
The orientation of the PETN molecule in the configuration-2 (Figure 1b) corresponds to itsorientation at the (101) surface of PETN crystal with only one C-CH2-O-NO2 tail of the PETN moleculedirected almost perpendicualar to the surface. In this model, one of the O atoms of the NO2 group islocated above the aluminum atom at the distance of 1.992 Å.
Because van der Waals interactions are important for the accurate determintion of adsorption/desorptionenergies, we included vDW corrections in our calculations. The calculated binding energy for the PETNmolecule adsorbed on the α-Al2O3 surface in the configuration-1 (1.59 eV) is two times higher thanthat obtained from the configuration-2 (0.80 eV). A comparison of the adsorbtion energies obtained forα-Al2O3-PETN with those reported earlier for MgO-PETN system (0.43 eV) [22] indicates significantlystronger binding of the PETN molecule to Al2O3 than to MgO surface. This actually means that theAl2O3-PETN interface should be more stable than MgO-PETN.
2.1.2. Optical Absorption of the Pristine α-Al2O3 (0001) Surface
The optical and electronic properties ofα-Al2O3 crystals have been previously studied experimentallyand theoretically. Hence, our goal here is to reproduce all major features of the optical spectra andaccurately interpret them before we can move on to the study of the composite system. The calculatedband gap of an ideal α-Al2O3 bulk crystal (8.43 eV, Figure 2) is consistent with the experimentallymeasured gap (8.7 eV) [30] and shows better agreement than earlier estimations (7.2 [31], 7.77 [32] and

Molecules 2016, 21, 289 4 of 13
8.06 [31] eV). The obtained band gap of the (0001) α-Al2O3 surface is reduced to 6.53 eV (Figure 2),which is consistent with the earlier theoretical studies [31,32].
Molecules 2016, 21, 3 4 of 13
The optical and electronic properties of α-Al2O3 crystals have been previously studied experimentally and theoretically. Hence, our goal here is to reproduce all major features of the optical spectra and accurately interpret them before we can move on to the study of the composite system. The calculated band gap of an ideal α-Al2O3 bulk crystal (8.43 eV, Figure 2) is consistent with the experimentally measured gap (8.7 eV) [30] and shows better agreement than earlier estimations (7.2 [31], 7.77 [32] and 8.06 [31] eV). The obtained band gap of the (0001) α-Al2O3 surface is reduced to 6.53 eV (Figure 2), which is consistent with the earlier theoretical studies [31,32].
Figure 2. The relative energies of the (0001) α-Al2O3 surface, F0-center, and PETN- induced electronic states in the bulk band gap are shown. The dashed green arrow indicates the predicted F0-center (HOMO) → PETN (LUMO) transition with the energy of 1.2 eV. The solid green arrows correspond to singlet-triplet excitations from the aluminum oxide surface to PETN.
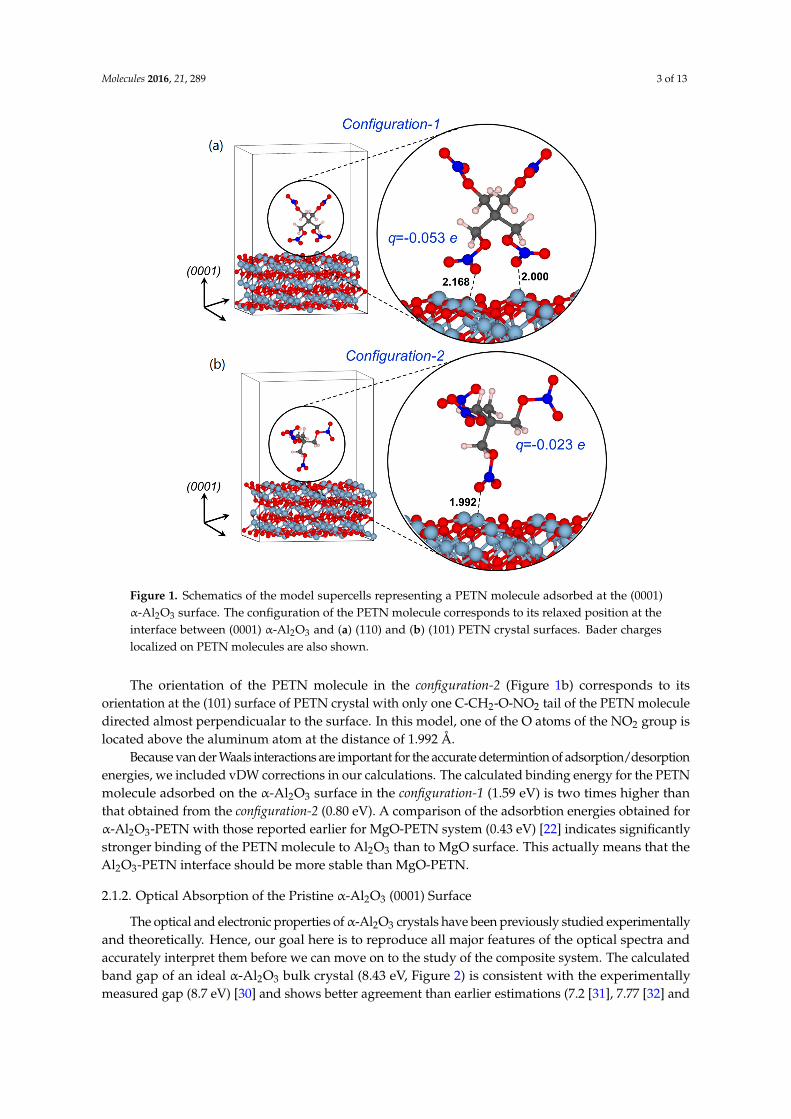
Figure 3 compares experimental and theoretically simulated spectra. The experimentally measured optical absorption spectrum of α-Al2O3 samples is depicted in Figure 3a and consists of two pronounced absorption bands, the first band with a well-defined maximum at 6.3 eV and the shoulder with a maximum at 4.76 eV. The energy of the intense transition at 6.3 eV agrees well with the calculated surface energy gap (6.53 eV, Figure 2) and therefore can be attributed to absorption of the α-Al2O3 surface. The calculated plot of frequency-dependent imaginary part of the dielectric function ε(ω) depicted in Figure 3b shows a distinct maxima at 6.58 and additionally confirms that this band is due to optical absorption of the pristine (0001) α-Al2O3 surface.
Since transitions in the range from 4.5 to 5.05 eV are most likely related to surface defects, we explicitly simulated an F0-center at the (0001) α-Al2O3 surface as oxygen vacancies are the most frequent defects on oxides [33]. We found that the F0-center generates an occupied state in the surface band gap. This state lies at about 2.20 eV (Figure 2) above the top of the valence band of the pristine α-Al2O3, which agrees well with the results of earlier theoretical study [34]. The energy gap between the F0-center-induced state and the top of the Al2O3 surface conduction band is 4.33 eV (Figure 2), which should roughly approximate the experimental peak, i.e., ~ 4.76 eV (Figure 3a). The calculated optical absorption spectrum of the oxide surface with F0-center depicted in Figure 3c indicates a maximum at 4.78 eV, which is very close to the experimentally observed peak at 4.76 eV. Therefore, the shoulder in the experimentally measured spectrum of α-Al2O3 is related to the transitions associated with absorption of F0-centers [35].
Figure 2. The relative energies of the (0001) α-Al2O3 surface, F0-center, and PETN- induced electronicstates in the bulk band gap are shown. The dashed green arrow indicates the predicted F0-center(HOMO)Ñ PETN (LUMO) transition with the energy of 1.2 eV. The solid green arrows correspond tosinglet-triplet excitations from the aluminum oxide surface to PETN.
Figure 3 compares experimental and theoretically simulated spectra. The experimentallymeasured optical absorption spectrum of α-Al2O3 samples is depicted in Figure 3a and consistsof two pronounced absorption bands, the first band with a well-defined maximum at 6.3 eV and theshoulder with a maximum at 4.76 eV. The energy of the intense transition at 6.3 eV agrees well with thecalculated surface energy gap (6.53 eV, Figure 2) and therefore can be attributed to absorption of theα-Al2O3 surface. The calculated plot of frequency-dependent imaginary part of the dielectric functionε(ω) depicted in Figure 3b shows a distinct maxima at 6.58 and additionally confirms that this band isdue to optical absorption of the pristine (0001) α-Al2O3 surface.
Since transitions in the range from 4.5 to 5.05 eV are most likely related to surface defects, weexplicitly simulated an F0-center at the (0001) α-Al2O3 surface as oxygen vacancies are the mostfrequent defects on oxides [33]. We found that the F0-center generates an occupied state in the surfaceband gap. This state lies at about 2.20 eV (Figure 2) above the top of the valence band of the pristineα-Al2O3, which agrees well with the results of earlier theoretical study [34]. The energy gap between theF0-center-induced state and the top of the Al2O3 surface conduction band is 4.33 eV (Figure 2), whichshould roughly approximate the experimental peak, i.e., ~ 4.76 eV (Figure 3a). The calculated opticalabsorption spectrum of the oxide surface with F0-center depicted in Figure 3c indicates a maximum at4.78 eV, which is very close to the experimentally observed peak at 4.76 eV. Therefore, the shoulderin the experimentally measured spectrum of α-Al2O3 is related to the transitions associated withabsorption of F0-centers [35].
In addition, we note that the lowest energy peak at 3.96 eV observed in the α-Al2O3 spectrum maybe associated with absorption of Mn-ion impurity centers [36], which are typical for alumina materials.
These results illustrate a very close agreement between the measured and calculated opticalparameters of the system under study as well as with previously published reports by other researchers.
Molecules 2016, 21, 289 5 of 13
This correspondence serves as a solid indication of quality of this research and allows us to expectaccurate conclusions related to the α-Al2O3-PETN composites.Molecules 2016, 21, 3 5 of 13
Figure 3. (a) Kubelka-Munk function of experimentally measured optical reflectance spectrum of α-Al2O3 (black line) is approximated with a set of Gaussians (red line); (b) Imaginary part of dielectric function of the pristine (0001) α-Al2O3 surface for light propagation parallel (blue line) and normal (red line) to the (0001) direction; (c) Imaginary part of dielectric function of the (0001) α-Al2O3 surface containing an F0-center for light propagation parallel (blue line) and normal (red line) to the (0001) direction; (d) Kubelka-Munk function of experimentally measured optical reflectance spectrum of the α-Al2O3-PETN composite (black line) is approximated with a set of Gaussians (red line); Imaginary part of dielectric function of (0001) α-Al2O3 surface with PETN molecule adsorbed in (e) configuration-1 and (f) configuration-2 for light propagation parallel (blue line) and normal (red line) to (0001) direction.
In addition, we note that the lowest energy peak at 3.96 eV observed in the α-Al2O3 spectrum may be associated with absorption of Mn-ion impurity centers [36], which are typical for alumina materials.
These results illustrate a very close agreement between the measured and calculated optical parameters of the system under study as well as with previously published reports by other researchers. This correspondence serves as a solid indication of quality of this research and allows us to expect accurate conclusions related to the α-Al2O3-PETN composites.
2.1.3. Optical Absorption of the α-Al2O3 (0001)-PETN Interface
The optical absorption of PETN molecules and crystals were recently studied in great detail [23]. The UV absorption spectrum of PETN consists of three broad bands: a strong electronic transition at or below 193.5 nm (>6.41 eV) [37–39] and two weak transitions at 260 nm (4.77 eV) [37,38] and 290 nm (4.27 eV) [37]. All three excitations are localized predominantly on the -NO2 groups of PETN [23]. The former two correspond to singlet-singlet transitions, whereas the last one was interpreted as a combination of two overlapping singlet-triplet transitions [23].
The diagram shown in Figure 2 indicates additional unoccupied states (LUMO) in the oxide band gap, which lie 3.30 and 3.53 eV above the top of the valence band. These states are localized on O-NO2 fragments of PETN molecule and formed from 2p atomic functions of oxygen and nitrogen
Figure 3. (a) Kubelka-Munk function of experimentally measured optical reflectance spectrum ofα-Al2O3 (black line) is approximated with a set of Gaussians (red line); (b) Imaginary part of dielectricfunction of the pristine (0001) α-Al2O3 surface for light propagation parallel (blue line) and normal(red line) to the (0001) direction; (c) Imaginary part of dielectric function of the (0001) α-Al2O3 surfacecontaining an F0-center for light propagation parallel (blue line) and normal (red line) to the (0001)direction; (d) Kubelka-Munk function of experimentally measured optical reflectance spectrum of theα-Al2O3-PETN composite (black line) is approximated with a set of Gaussians (red line); Imaginarypart of dielectric function of (0001) α-Al2O3 surface with PETN molecule adsorbed in (e) configuration-1and (f) configuration-2 for light propagation parallel (blue line) and normal (red line) to (0001) direction.
2.1.3. Optical Absorption of the α-Al2O3 (0001)-PETN Interface
The optical absorption of PETN molecules and crystals were recently studied in great detail [23].The UV absorption spectrum of PETN consists of three broad bands: a strong electronic transition at orbelow 193.5 nm (>6.41 eV) [37–39] and two weak transitions at 260 nm (4.77 eV) [37,38] and 290 nm(4.27 eV) [37]. All three excitations are localized predominantly on the -NO2 groups of PETN [23].The former two correspond to singlet-singlet transitions, whereas the last one was interpreted asa combination of two overlapping singlet-triplet transitions [23].
The diagram shown in Figure 2 indicates additional unoccupied states (LUMO) in the oxide bandgap, which lie 3.30 and 3.53 eV above the top of the valence band. These states are localized on O-NO2
fragments of PETN molecule and formed from 2p atomic functions of oxygen and nitrogen atoms.The presence of the extra occupied states generated by the surface oxygen vacancy in the band gapof α-Al2O3 and of the unoccupied states attributed to PETN molecules adsorbed on (0001) α-Al2O3
surface (Figure 2) implies that additional optical excitations should be observed in the absorptionspectrum of the oxide. Energetic considerations suggest that this transition should be characterizedby the excitation energy of the order of 1.2 eV. We note that this expected excitation energy is very
Molecules 2016, 21, 289 6 of 13
close to the laser excitation energy of 1.17 eV (the first harmonic). This prediction further guides ourabsorption measurements to validate the theory [40].
There is a clear difference between the measured α-Al2O3 spectrum shown in Figure 3a (withthree obvious peaks with maximums at 6.3, 4.76, and 3.96 eV) and α-Al2O3-PETN composite spectrumdepicted in Figure 3d (with four maximums at 6.19, 4.81, 4.09, and 3.15 eV). We note that the presenceof PETN in the composite is reflected in two facts, intensity of the three of the existing bands becomeshigher and one additional band appears in the spectra.
The calculated optical absorption spectra depicted in Figure 3b,c,e,f represent each distinguishablecomponent of the α-Al2O3-PETN composite system. Hence, a comparative analysis of the experimentaland simulated spectra suggests a reasonable interpretation of the absorption spectrum of theα-Al2O3-PETN composite.
The main high intensity absorption band at the energies >6 eV is related to the α-Al2O3 surfaceabsorption. The F0-center absorbs light with energy of 4.78 eV (Figure 3c), which is consistentwith earlier estimates (4.62 and 5.03 eV) [41] obtained from embedded cluster calculations usingTD-DFT and CASPT2 methods. Hence, the energy range from 4.76 to 5.05 eV observed in both thepristine α-Al2O3 spectrum and the α-Al2O3-PETN composite spectrum is associated with the oxygenvacancy absorption.
Further, the broad low intensity band at 3.15 eV (Figure 3d) appears only in the spectrum of thecomposite but not in the pristine alumina. The energy maximum agrees well with the energy gapsof 3.30 and 3.53 eV and the corresponding singlet-triplet transitions at 2.63 and 3.16 eV, respectively(Figure 2), depending on the PETN configuration on the (0001) α-Al2O3 surface (Figure 1). This excitationis attributed to PETN absorption at the interface and corresponds to the transition of an electron fromthe alumina surface to the adsorbed PETN molecule, creating an excited state of PETN.
Furthermore, while the 4.09 eV peak (Figure 3d) nearly coincides with 3.96 eV (Figure 3a) andmay be attributed to the Mn-ion impurity’s absorption, the visible increase of the intensity and breadthof this peak suggests the existence of a new absorption band in this spectral range. The calculatedspectra (Figure 3e,f) clearly show the broad absorption peak with the maximum at 4.0 eV while themodel interfaces (Figure 4a,b) obviously did not include Mn impurities unlike experimental samplesin which Mn is always present.
Molecules 2016, 21, 3 9 of 13
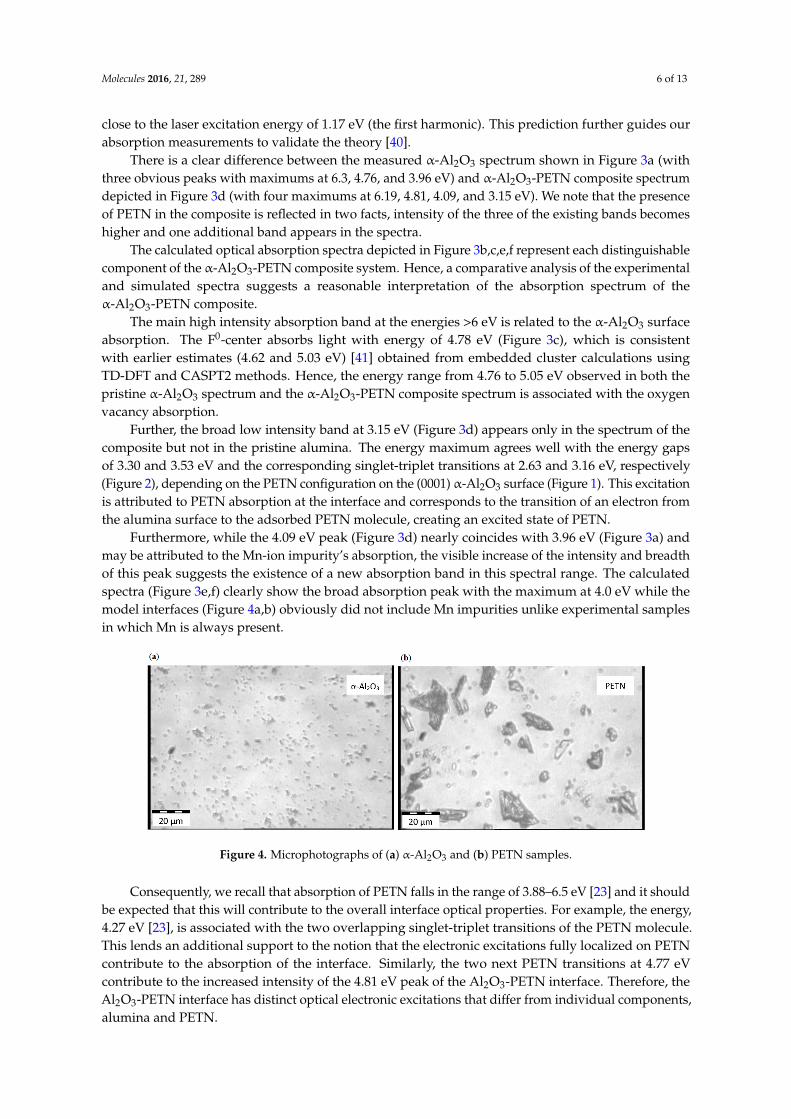
initial sample was subjected to a heat treatment in a muffle furnace in the air at temperature 1300 °C for 2 h, followed by slow cooling. Ground oxide powder was manually ground in an agate mortar, the final powder grain size was ~1 μm (Figure 5). Al2O3-PETN composite particles (Figure 5) with the 0.5% weight concentration of PETN were prepared through the following procedures. Samples of PETN were initially grinded in agate mortar. Al2O3 powder was subsequently added to the mortar and two powders have being mixed for 5 min. The mixture was heated in the drying oven for 10 min at temperature 144 °C to allow PETN to melt and cover uniformly Al2O3 particles. The selected oven temperature provided a guaranteed meltdown of PETN grains weighting ~3.2 g in composite in 10 min as the PETN melting point is 141.3 °C (see, e.g., [58]).
Figure 5. Microphotographs of (a) α-Al2O3 and (b) PETN samples.
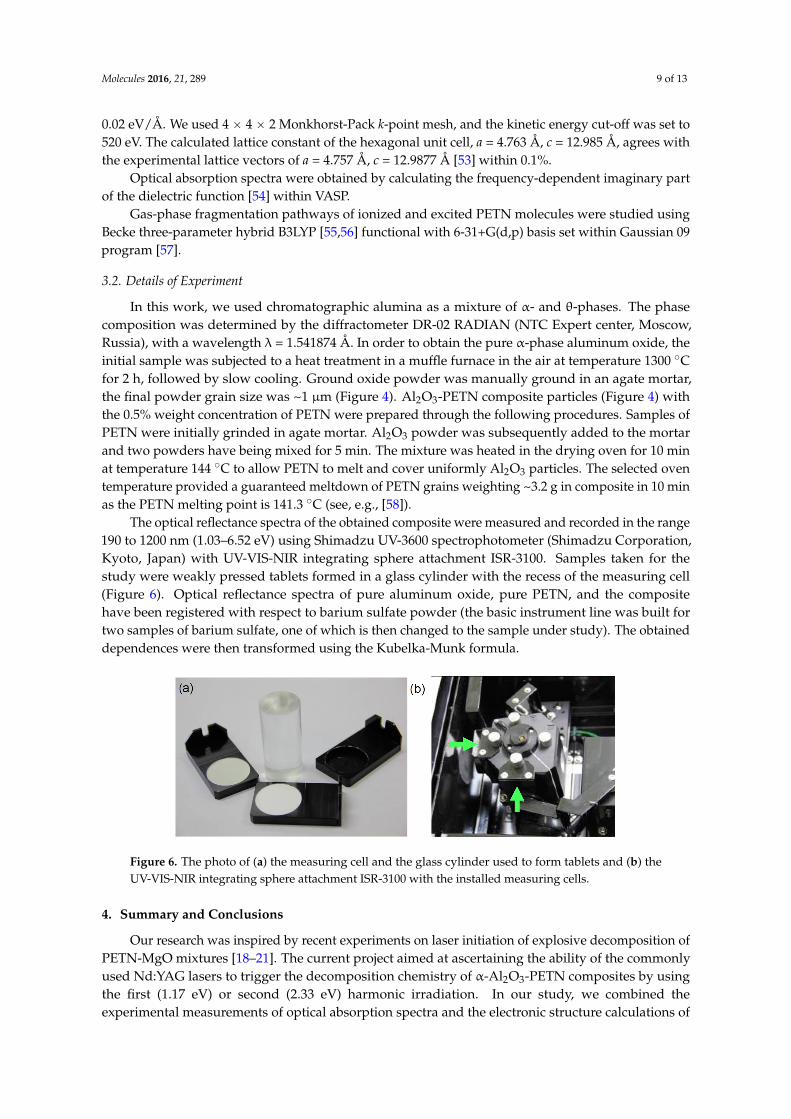
The optical reflectance spectra of the obtained composite were measured and recorded in the range 190 to 1200 nm (1.03–6.52 eV) using Shimadzu UV-3600 spectrophotometer (Shimadzu Corporation, Kyoto, Japan) with UV-VIS-NIR integrating sphere attachment ISR-3100. Samples taken for the study were weakly pressed tablets formed in a glass cylinder with the recess of the measuring cell (Figure 6). Optical reflectance spectra of pure aluminum oxide, pure PETN, and the composite have been registered with respect to barium sulfate powder (the basic instrument line was built for two samples of barium sulfate, one of which is then changed to the sample under study). The obtained dependences were then transformed using the Kubelka-Munk formula.
Figure 6. The photo of (a) the measuring cell and the glass cylinder used to form tablets and (b) the UV-VIS-NIR integrating sphere attachment ISR-3100 with the installed measuring cells.
4. Summary and Conclusions
Our research was inspired by recent experiments on laser initiation of explosive decomposition of PETN-MgO mixtures [18–21]. The current project aimed at ascertaining the ability of the commonly used Nd:YAG lasers to trigger the decomposition chemistry of α-Al2O3-PETN composites by using the first (1.17 eV) or second (2.33 eV) harmonic irradiation. In our study, we combined the experimental measurements of optical absorption spectra and the electronic structure calculations of
Figure 4. Microphotographs of (a) α-Al2O3 and (b) PETN samples.
Consequently, we recall that absorption of PETN falls in the range of 3.88–6.5 eV [23] and it shouldbe expected that this will contribute to the overall interface optical properties. For example, the energy,4.27 eV [23], is associated with the two overlapping singlet-triplet transitions of the PETN molecule.This lends an additional support to the notion that the electronic excitations fully localized on PETNcontribute to the absorption of the interface. Similarly, the two next PETN transitions at 4.77 eVcontribute to the increased intensity of the 4.81 eV peak of the Al2O3-PETN interface. Therefore, theAl2O3-PETN interface has distinct optical electronic excitations that differ from individual components,alumina and PETN.
Molecules 2016, 21, 289 7 of 13
2.2. Decomposition of Charged and Excited PETN Molecules
The goal of this section is to determine whether decomposition of the PETN molecule fromeither its excited or charged state can be triggered by laser excitation energy of 1.17 or 2.3 eV and tocompare this process to the ground state chemistry. In our consideration, the interactions betweenthe adsorbed PETN molecule and the F0-center on the Al2O3 surface play a crucial role in initiationof such photochemical decomposition reactions. In the absence of solid-state calculations of PETNmolecules decomposing on the oxygen deficient Al2O3-PETN interface, which is quite challenging,especially with hybrid functionals, we will make an attempt to interpret the obtained results in termsof previously performed modeling of the decomposition of isolated PETN molecules and ion radicals.We will analyze here activation barriers and reaction energies to link (or correlate) them with thecharacteristic excitation energies observed in the optical spectrum of our composite.
For the intended analysis, we simulated two different scenarios of the formation of the initialPETN state: (i) a PETN anion radical that can be formed due to charge transfer from the F0-center toPETN, similarly to the process observed for the MgO-PETN interface [22] and (ii) PETN in its tripletstate that can occur due to the vertical HOMO-LUMO excitation (F0-center-PETN transition) with theenergy of ~1.2 eV (Figure 2) or as a result of an electron excitation from the surface to the moleculeobserved at ~2.3 eV (Figures 2 and 3). We limited our decomposition simulations to the O-NO2
(Equation (1)) bond homolysis only as it is the main decomposition pathway of the neutral groundstate PETN (Figure 5a) in both gaseous and solid states (Equation (1)) and requires ~35 kcal/mol [29].
C5H8N4O12ÑNO2 ` C5H8N3O10 (1)
Molecules 2016, 21, 3 7 of 13
We will analyze here activation barriers and reaction energies to link (or correlate) them with the characteristic excitation energies observed in the optical spectrum of our composite.
For the intended analysis, we simulated two different scenarios of the formation of the initial PETN state: (i) a PETN anion radical that can be formed due to charge transfer from the F0-center to PETN, similarly to the process observed for the MgO-PETN interface [22] and (ii) PETN in its triplet state that can occur due to the vertical HOMO-LUMO excitation (F0-center-PETN transition) with the energy of ~1.2 eV (Figure 2) or as a result of an electron excitation from the surface to the molecule observed at ~2.3 eV (Figures 2 and 3). We limited our decomposition simulations to the O-NO2 (Equation (1)) bond homolysis only as it is the main decomposition pathway of the neutral ground state PETN (Figure 4a) in both gaseous and solid states (Equation (1)) and requires ~35 kcal/mol [29].
C5H8N4O12 → NO2 + C5H8N3O10 (1)
It was discovered that the similar process proceeding from the PETN radical anion state requires 50% lower energy (18.0 kcal/mol, Table 1) [22] than the ground state decomposition (~ 35 kcal/mol) [29]. An extra electron in the equilibrium structure of PETN radical anion (Figure 4b) is localized on the –ONO2 molecular fragment (Figure 4c) with the elongated O–N bond. Having high positive electron affinity, the PETN molecule readily traps an electron, gaining 2.4 eV (Table 1). We suggest that the formation of PETN anion radical is feasible at the Al2O3-PETN interface atop the F0-center through withdrawal of an electron from the vacancy. Once an electron is transferred to the PETN LUMO, the system will gain energy and the level will go down in energy, thus facilitating new transitions from and to this state. This will likely to trigger dissociation of PETN with a low activation barrier through the charged state potential surface.
Figure 4. The geometric configurations of equilibrium molecular structures of (a) the ground state neutral PETN molecule; (b) PETN radical anion; (c) electron component of PETN radical anion; (d) PETN in the triplet state; (e) electron and (f) hole components of PETN in triplet state.
The formation of the vertical singlet-triplet transition in PETN was simulated by using TD B3LYP and ΔSCF approximations. The energy required to form a triplet state is 3.88–4.22 eV, depending on the method [42]. The fully relaxed equilibrium structure of the triplet state PETN (Figure 4d) lies 2.75 eV above the ground state equilibrium structure. The high relaxation energy indicates that the exciton is tightly bound. Both the electron and hole components of the triplet state are well-localized on the distorted -O-NO2 fragment (Figure 4e,f) with the elongated by ~0.07–0.09 Å
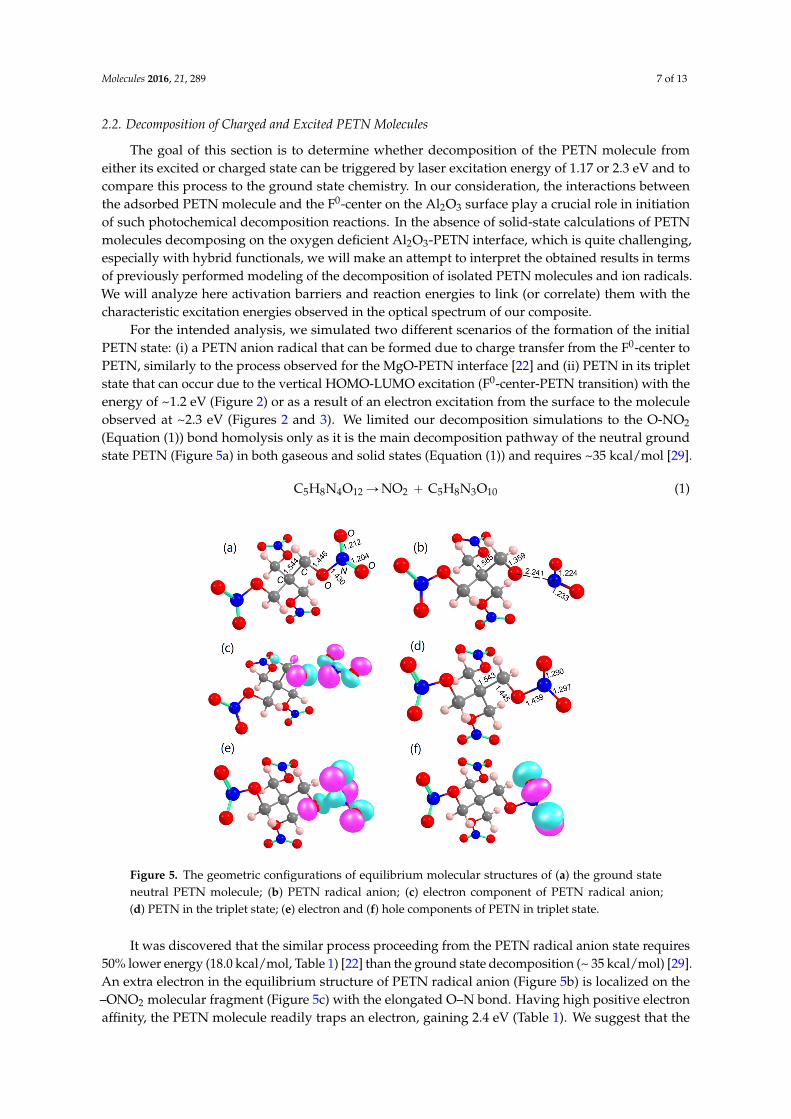
Figure 5. The geometric configurations of equilibrium molecular structures of (a) the ground stateneutral PETN molecule; (b) PETN radical anion; (c) electron component of PETN radical anion;(d) PETN in the triplet state; (e) electron and (f) hole components of PETN in triplet state.
It was discovered that the similar process proceeding from the PETN radical anion state requires50% lower energy (18.0 kcal/mol, Table 1) [22] than the ground state decomposition (~ 35 kcal/mol) [29].An extra electron in the equilibrium structure of PETN radical anion (Figure 5b) is localized on the–ONO2 molecular fragment (Figure 5c) with the elongated O–N bond. Having high positive electronaffinity, the PETN molecule readily traps an electron, gaining 2.4 eV (Table 1). We suggest that the

Molecules 2016, 21, 289 8 of 13
formation of PETN anion radical is feasible at the Al2O3-PETN interface atop the F0-center throughwithdrawal of an electron from the vacancy. Once an electron is transferred to the PETN LUMO, thesystem will gain energy and the level will go down in energy, thus facilitating new transitions fromand to this state. This will likely to trigger dissociation of PETN with a low activation barrier throughthe charged state potential surface.
Table 1. The decomposition of PETN in its equilibrium, [PETN], charged, (PETN)-, and excited,(PETN)*, states is illustrated by the corresponding energy of the initial state formation (in eV), activationbarrier for the O-NO2 homolysis reaction (in kcal/mol), and the reaction energy (in kcal/mol).
Initial State Formation Energy Activation Barrier Reaction Energy
[PETN] 0 35.0 35.0(PETN)- ´2.4 (EA of isolated molecule) 18.0 18.0(PETN)* 3.88–4.22 (Vertical excitation) 4.5 ´28.7
The formation of the vertical singlet-triplet transition in PETN was simulated by using TD B3LYPand ∆SCF approximations. The energy required to form a triplet state is 3.88–4.22 eV, depending onthe method [42]. The fully relaxed equilibrium structure of the triplet state PETN (Figure 5d) lies2.75 eV above the ground state equilibrium structure. The high relaxation energy indicates that theexciton is tightly bound. Both the electron and hole components of the triplet state are well-localizedon the distorted -O-NO2 fragment (Figure 5e,f) with the elongated by ~0.07–0.09 Å N-O bonds of thenitro group as compared to the neutral molecule (Figure 5a). The O-NO2 bond cleavage of the PETNmolecule in its triplet state requires only 4.5 kcal/mol, and the reaction proceeds with the energyrelease of 28.7 kcal/mol (Table 1).
These simple estimates vividly illustrate that decomposition of PETN on the Al2O3-PETN interfacecan be triggered with a very low energy, significantly lower than the ground state decompositionreaction. However, the formation of the excited state (via direct vertical HOMO-LUMO excitationfully localized on PETN) or charged PETN state (via electron transfer from the surface to PETN) onthe otherwise ideal interface would require ~ 3–4 eV. This high energy is inconsistent with either first(1.17 eV) or second (2.33 eV) harmonic laser excitation energies. On the other hand, Figure 2 clearlyindicates that the transition from F0-center (HOMO) to PETN (LUMO) at the interface would havean excitation energy ~1.2 eV, close to the first harmonic 1.17 eV. The singlet-triplet excitation associatedwith the electronic transition from the surface HOMO to PETN LUMO requires only 2.63 eV, close tothe second harmonic 2.33 eV. The charge transfer from the oxygen vacancy, which typically traps nearlytwo electrons on oxides, to PETN is energetically favorable. This situation is, indeed, somewhat similarto the MgO-PETN interface. We therefore suggest that the interactions of oxygen vacancies and thePETN molecules at the Al2O3-PETN interface would facilitate the formation of charged and/or excitedPETN states that would consequently rapidly dissociate, producing NO2 and will be accompanied byheat release.
3. Methods
3.1. Details of Calculations
Solid state periodic calculations were performed by employing density functional theory (DFT) [43,44]with vDW-DF [45–47] functional of Langreth, Lundqvist et al. which includes corrections of van der Waalsinteractions as implemented in the VASP code [48–50]. To correct the significantly underestimatedband gap energies, obtained from vDW-DF, a self-consistent single point calculation was performedfor each configuration by using hybrid PBE0 functional [51]. The projector augmented-wave (PAW)pseudo-potentials [52] were used.
In calculations of an ideal Al2O3 crystal, the convergence criterion for total energy was set to10´5 eV, and the maximum force acting on each atom in the periodic cell was set not to exceed
Molecules 2016, 21, 289 9 of 13
0.02 eV/Å. We used 4 ˆ 4 ˆ 2 Monkhorst-Pack k-point mesh, and the kinetic energy cut-off was set to520 eV. The calculated lattice constant of the hexagonal unit cell, a = 4.763 Å, c = 12.985 Å, agrees withthe experimental lattice vectors of a = 4.757 Å, c = 12.9877 Å [53] within 0.1%.
Optical absorption spectra were obtained by calculating the frequency-dependent imaginary partof the dielectric function [54] within VASP.
Gas-phase fragmentation pathways of ionized and excited PETN molecules were studied usingBecke three-parameter hybrid B3LYP [55,56] functional with 6-31+G(d,p) basis set within Gaussian 09program [57].
3.2. Details of Experiment
In this work, we used chromatographic alumina as a mixture of α- and θ-phases. The phasecomposition was determined by the diffractometer DR-02 RADIAN (NTC Expert center, Moscow,Russia), with a wavelength λ = 1.541874 Å. In order to obtain the pure α-phase aluminum oxide, theinitial sample was subjected to a heat treatment in a muffle furnace in the air at temperature 1300 ˝Cfor 2 h, followed by slow cooling. Ground oxide powder was manually ground in an agate mortar,the final powder grain size was ~1 µm (Figure 4). Al2O3-PETN composite particles (Figure 4) withthe 0.5% weight concentration of PETN were prepared through the following procedures. Samples ofPETN were initially grinded in agate mortar. Al2O3 powder was subsequently added to the mortarand two powders have being mixed for 5 min. The mixture was heated in the drying oven for 10 minat temperature 144 ˝C to allow PETN to melt and cover uniformly Al2O3 particles. The selected oventemperature provided a guaranteed meltdown of PETN grains weighting ~3.2 g in composite in 10 minas the PETN melting point is 141.3 ˝C (see, e.g., [58]).
The optical reflectance spectra of the obtained composite were measured and recorded in the range190 to 1200 nm (1.03–6.52 eV) using Shimadzu UV-3600 spectrophotometer (Shimadzu Corporation,Kyoto, Japan) with UV-VIS-NIR integrating sphere attachment ISR-3100. Samples taken for thestudy were weakly pressed tablets formed in a glass cylinder with the recess of the measuring cell(Figure 6). Optical reflectance spectra of pure aluminum oxide, pure PETN, and the compositehave been registered with respect to barium sulfate powder (the basic instrument line was built fortwo samples of barium sulfate, one of which is then changed to the sample under study). The obtaineddependences were then transformed using the Kubelka-Munk formula.
Molecules 2016, 21, 3 9 of 13
initial sample was subjected to a heat treatment in a muffle furnace in the air at temperature 1300 °C for 2 h, followed by slow cooling. Ground oxide powder was manually ground in an agate mortar, the final powder grain size was ~1 μm (Figure 5). Al2O3-PETN composite particles (Figure 5) with the 0.5% weight concentration of PETN were prepared through the following procedures. Samples of PETN were initially grinded in agate mortar. Al2O3 powder was subsequently added to the mortar and two powders have being mixed for 5 min. The mixture was heated in the drying oven for 10 min at temperature 144 °C to allow PETN to melt and cover uniformly Al2O3 particles. The selected oven temperature provided a guaranteed meltdown of PETN grains weighting ~3.2 g in composite in 10 min as the PETN melting point is 141.3 °C (see, e.g., [58]).
Figure 5. Microphotographs of (a) α-Al2O3 and (b) PETN samples.
The optical reflectance spectra of the obtained composite were measured and recorded in the range 190 to 1200 nm (1.03–6.52 eV) using Shimadzu UV-3600 spectrophotometer (Shimadzu Corporation, Kyoto, Japan) with UV-VIS-NIR integrating sphere attachment ISR-3100. Samples taken for the study were weakly pressed tablets formed in a glass cylinder with the recess of the measuring cell (Figure 6). Optical reflectance spectra of pure aluminum oxide, pure PETN, and the composite have been registered with respect to barium sulfate powder (the basic instrument line was built for two samples of barium sulfate, one of which is then changed to the sample under study). The obtained dependences were then transformed using the Kubelka-Munk formula.
Figure 6. The photo of (a) the measuring cell and the glass cylinder used to form tablets and (b) the UV-VIS-NIR integrating sphere attachment ISR-3100 with the installed measuring cells.
4. Summary and Conclusions
Our research was inspired by recent experiments on laser initiation of explosive decomposition of PETN-MgO mixtures [18–21]. The current project aimed at ascertaining the ability of the commonly used Nd:YAG lasers to trigger the decomposition chemistry of α-Al2O3-PETN composites by using the first (1.17 eV) or second (2.33 eV) harmonic irradiation. In our study, we combined the experimental measurements of optical absorption spectra and the electronic structure calculations of
Figure 6. The photo of (a) the measuring cell and the glass cylinder used to form tablets and (b) theUV-VIS-NIR integrating sphere attachment ISR-3100 with the installed measuring cells.
4. Summary and Conclusions
Our research was inspired by recent experiments on laser initiation of explosive decomposition ofPETN-MgO mixtures [18–21]. The current project aimed at ascertaining the ability of the commonlyused Nd:YAG lasers to trigger the decomposition chemistry of α-Al2O3-PETN composites by usingthe first (1.17 eV) or second (2.33 eV) harmonic irradiation. In our study, we combined theexperimental measurements of optical absorption spectra and the electronic structure calculations of
Molecules 2016, 21, 289 10 of 13
the α-Al2O3-PETN composite as well as first principles modeling of decomposition of PETN anionradicals and excitons.
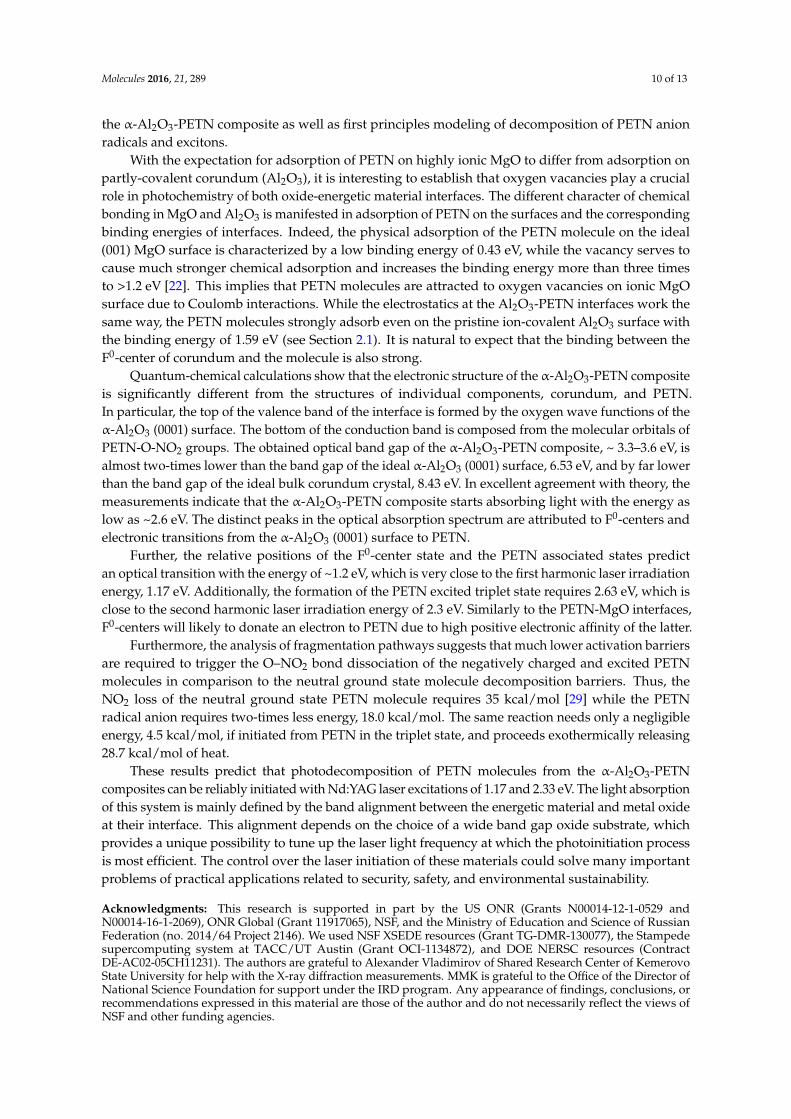
With the expectation for adsorption of PETN on highly ionic MgO to differ from adsorption onpartly-covalent corundum (Al2O3), it is interesting to establish that oxygen vacancies play a crucialrole in photochemistry of both oxide-energetic material interfaces. The different character of chemicalbonding in MgO and Al2O3 is manifested in adsorption of PETN on the surfaces and the correspondingbinding energies of interfaces. Indeed, the physical adsorption of the PETN molecule on the ideal(001) MgO surface is characterized by a low binding energy of 0.43 eV, while the vacancy serves tocause much stronger chemical adsorption and increases the binding energy more than three timesto >1.2 eV [22]. This implies that PETN molecules are attracted to oxygen vacancies on ionic MgOsurface due to Coulomb interactions. While the electrostatics at the Al2O3-PETN interfaces work thesame way, the PETN molecules strongly adsorb even on the pristine ion-covalent Al2O3 surface withthe binding energy of 1.59 eV (see Section 2.1). It is natural to expect that the binding between theF0-center of corundum and the molecule is also strong.
Quantum-chemical calculations show that the electronic structure of the α-Al2O3-PETN compositeis significantly different from the structures of individual components, corundum, and PETN.In particular, the top of the valence band of the interface is formed by the oxygen wave functions of theα-Al2O3 (0001) surface. The bottom of the conduction band is composed from the molecular orbitals ofPETN-O-NO2 groups. The obtained optical band gap of the α-Al2O3-PETN composite, ~ 3.3–3.6 eV, isalmost two-times lower than the band gap of the ideal α-Al2O3 (0001) surface, 6.53 eV, and by far lowerthan the band gap of the ideal bulk corundum crystal, 8.43 eV. In excellent agreement with theory, themeasurements indicate that the α-Al2O3-PETN composite starts absorbing light with the energy aslow as ~2.6 eV. The distinct peaks in the optical absorption spectrum are attributed to F0-centers andelectronic transitions from the α-Al2O3 (0001) surface to PETN.
Further, the relative positions of the F0-center state and the PETN associated states predictan optical transition with the energy of ~1.2 eV, which is very close to the first harmonic laser irradiationenergy, 1.17 eV. Additionally, the formation of the PETN excited triplet state requires 2.63 eV, which isclose to the second harmonic laser irradiation energy of 2.3 eV. Similarly to the PETN-MgO interfaces,F0-centers will likely to donate an electron to PETN due to high positive electronic affinity of the latter.
Furthermore, the analysis of fragmentation pathways suggests that much lower activation barriersare required to trigger the O–NO2 bond dissociation of the negatively charged and excited PETNmolecules in comparison to the neutral ground state molecule decomposition barriers. Thus, theNO2 loss of the neutral ground state PETN molecule requires 35 kcal/mol [29] while the PETNradical anion requires two-times less energy, 18.0 kcal/mol. The same reaction needs only a negligibleenergy, 4.5 kcal/mol, if initiated from PETN in the triplet state, and proceeds exothermically releasing28.7 kcal/mol of heat.
These results predict that photodecomposition of PETN molecules from the α-Al2O3-PETNcomposites can be reliably initiated with Nd:YAG laser excitations of 1.17 and 2.33 eV. The light absorptionof this system is mainly defined by the band alignment between the energetic material and metal oxideat their interface. This alignment depends on the choice of a wide band gap oxide substrate, whichprovides a unique possibility to tune up the laser light frequency at which the photoinitiation processis most efficient. The control over the laser initiation of these materials could solve many importantproblems of practical applications related to security, safety, and environmental sustainability.
Acknowledgments: This research is supported in part by the US ONR (Grants N00014-12-1-0529 andN00014-16-1-2069), ONR Global (Grant 11917065), NSF, and the Ministry of Education and Science of RussianFederation (no. 2014/64 Project 2146). We used NSF XSEDE resources (Grant TG-DMR-130077), the Stampedesupercomputing system at TACC/UT Austin (Grant OCI-1134872), and DOE NERSC resources (ContractDE-AC02-05CH11231). The authors are grateful to Alexander Vladimirov of Shared Research Center of KemerovoState University for help with the X-ray diffraction measurements. MMK is grateful to the Office of the Director ofNational Science Foundation for support under the IRD program. Any appearance of findings, conclusions, orrecommendations expressed in this material are those of the author and do not necessarily reflect the views ofNSF and other funding agencies.
Molecules 2016, 21, 289 11 of 13
Author Contributions: R.V.T. and S.N.R. performed DFT calculations, A.Z. and A.M. performed experiments,R.V.T. drafted main results, M.M.K. designed this research, analyzed and interpreted results, and largely wrotethe paper.
Conflicts of Interest: The authors declare no conflict of interest.
References and notes
1. Akimov, A.V.; Neukirch, A.J.; Prezhdo, O.V. Theoretical insights into photoinduced charge transfer andcatalysis at oxide interfaces. Chem. Rev. 2013, 113, 4496–4565. [PubMed]
2. Duncan, W.R.; Prezhdo, O.V. Theoretical studies of photoinduced electron transfer in dye-sensitized TiO2.Annu. Rev. Phys. Chem. 2007, 58, 143–843. [PubMed]
3. Gregg, B.A. Interfacial processes in the dye-sensitized solar cell. Coord. Chem. Rev. 2004, 248, 1215–1224. [CrossRef]4. Asahi, R.; Morikawa, T.; Irie, H.; Ohwaki, T. Nitrogen-doped titanium dioxide as visible-light-sensitive
photocatalyst: Designs, developments, and prospects. Chem. Rev. 2014, 114, 9824–9852. [PubMed]5. Naddo, T.; Che, Y.; Zhang, W.; Balakrishnan, K.; Yang, X.; Yen, M.; Zhao, J.; Moore, J.S.; Zang, L. Detection of
explosives with a fluorescent nanofibril film. J. Am. Chem. Soc. 2007, 129, 6978–6979. [CrossRef] [PubMed]6. Tu, R.; Liu, B.; Wang, Z.; Gao, D.; Wang, F.; Fang, Q.; Zhang, Z. Amine-capped ZnS-Mn2+ nanocrystals for
fluorescence detection of trace TNT explosive. Anal. Chem. 2008, 80, 3458–3465. [CrossRef] [PubMed]7. Kartha, K.K.; Babu, S.S.; Srinivasan, S.; Ajayaghosh, A. Attogram sensing of trinitrotoluene with
a self-assembled molecular gelator. J. Am. Chem. Soc. 2012, 134, 4834–4841. [CrossRef] [PubMed]8. Pramanik, S.; Zheng, C.; Zhang, X.; Emge, T.J.; Li, J. New microporous metal-organic framework
demonstrating unique selectivity for detection of high explosives and aromatic compounds. J. Am. Chem. Soc.2011, 133, 4153–4155. [CrossRef] [PubMed]
9. Yang, J.-S.; Swager, T.M. Porous shape persistent fluorescent polymer films: An approach to TNTsensory materials. J. Am. Chem. Soc. 1998, 120, 5321–5322. [CrossRef]
10. Sohn, H.; Sailor, M.J.; Magde, D.; Trogler, W.C. Detection of nitroaromatic explosives based on photoluminescentpolymers containing metalloles. J. Am. Chem. Soc. 2003, 125, 3821–3830. [CrossRef] [PubMed]
11. Germain, M.E.; Knapp, M.J. Discrimination of nitroaromatics and explosives mimics by a fluorescentZn(salicylaldimine) sensor array. J. Am. Chem. Soc. 2008, 130, 5422–5423. [CrossRef] [PubMed]
12. Li, Z.; Ding, J.; Song, N.; Lu, J.; Tao, Y. Development of a new s-tetrazine-based copolymer for efficientsolar cells. J. Am. Chem. Soc. 2010, 132, 13160–13161. [CrossRef] [PubMed]
13. Pinnaduwage, L.A.; Gehl, A.; Hedden, D.L.; Muralidharan, G.; Thundat, T.; Lareau, R.T.; Sulchek, T.;Manning, L.; Rogers, B.; Jones, M.; et al. Explosives: A microsensor for trinitrotoluene vapour. Nature 2003,425. [CrossRef] [PubMed]
14. Moore, D.S. Recent advances in trace explosives detection instrumentation. Sens. Imaging 2007, 8, 9–38.15. Rose, A.; Zhu, Z.; Madigan, C.F.; Swager, T.M.; Bulovic, V. Sensitivity gains in chemosensing by lasing action
in organic polymers. Nature 2005, 434, 876–879. [CrossRef] [PubMed]16. Andrew, T.L.; Swager, T.M. A fluorescence turn-on mechanism to detect high explosives RDX and PETN.
J. Am. Chem. Soc. 2007, 129, 7254–7255. [CrossRef] [PubMed]17. Germain, M.N.; Arechederra, R.L.; Minteer, S.D. Nitroaromatic actuation of mitochondrial bioelectrocatalysis
for self-powered explosive sensors. J. Am. Chem. Soc. 2008, 130, 15272–15273. [CrossRef] [PubMed]18. Aluker, E.D.; Krechetov, A.G.; Mitrofanov, A.Y.; Sakharchuk, Y.P. Model of the photostimulated fragmentation
of PETN molecules in selective photoinitiation. Russ. J. Phys. Chem. B 2011, 5, 821–823. [CrossRef]19. Aluker, E.D.; Krechetov, A.G.; Mitrofanov, A.Y.; Nurmukhametov, D.R.; Kuklja, M.M. Laser initiation of
energetic materials: Selective photoinitiation regime in pentaerythritol tetranitrate. J. Phys. Chem. C 2011,115, 6893–6901. [CrossRef]
20. Aluker, E.D.; Krechetov, A.G.; Mitrofanov, A.Y.; Zverev, A.S.; Kuklja, M.M. Understanding limits of thethermal mechanism of laser initiation of energetic materials. J. Phys. Chem. C 2012, 116, 24482–24486.
21. Aluker, E.D.; Krechetov, A.G.; Mitrofanov, A.Y.; Zverev, A.S.; Kuklja, M.M. Topography of photochemicalinitiation in molecular materials. Molecules 2013, 18, 14148–14160. [CrossRef] [PubMed]
22. Tsyshevsky, R.V.; Rashkeev, S.N.; Kuklja, M.M. Defect states at organic–inorganic interfaces: Insight fromfirstprinciples calculations for pentaerythritol tetranitrate on MgO surface. Surf. Sci. 2015, 637–638, 19–28.
Molecules 2016, 21, 289 12 of 13
23. Tsyshevsky, R.V.; Sharia, O.; Kuklja, M.M. Energies of electronic transitions of PETN molecules and crystals.J. Phys. Chem. C 2014, 118, 9324–9335.
24. McLeod, J.A.; Kurmaev, E.Z.; Sushko, P.V.; Boyko, T.D.; Levitsky, I.A.; Moewes, A. Selective response ofmesoporous silicon to adsorbants with nitro groups. Chem. Eur. J. 2012, 18, 2912–2922. [CrossRef] [PubMed]
25. Sorescu, D.C.; Boatz, J.A.; Thompson, D.L. First-principles calculations of the adsorption of nitromethaneand 1,1-diamino-2,2-dinitroethylene (FOX-7) molecules on the Al(111) surface. J. Phys. Chem. B 2003, 107,8953–8964. [CrossRef]
26. Sorescu, D.C.; Boatz, J.A.; Thompson, D.L. First-principles calculations of the adsorption of nitromethaneand 1,1-diamino-2,2-dinitroethylene (FOX-7) molecules on the α-Al2O3 (0001) Surface. J. Phys. Chem. B 2005,109, 1451–1463. [PubMed]
27. Zepeda-Ruiz, L.A.; Maiti, A.; Gee, R.; Gilmer, G.H.; Weeks, B.L. Size and habit evolution of PETN crystals:A lattice monte carlo study. J. Cryst. Growth 2006, 291, 461–467. [CrossRef]
28. Kuklja, M.M.; Kunz, A.B. Electronic structure of molecular crystals containing edge dislocations. J. Appl. Phys.2001, 89, 4962–4970. [CrossRef]
29. Tsyshevsky, R.V.; Sharia, O.; Kuklja, M.M. Thermal decomposition mechanisms of nitroesters: Ab Initiomodeling of pentaerythritol tetranitrate. J. Phys. Chem. C 2013, 117, 18144–18153. [CrossRef]
30. French, R.H. Electronic band structure of Al2O3, with comparison to Alon and AIN. J. Am. Ceram. Soc. 1990,73, 477–489. [CrossRef]
31. Gomes, J.R.B.; Lodziana, Z.; Illas, F. Adsorption of small palladium clusters on the relaxed α-Al2O3(0001) surface.J. Phys. Chem. B 2003, 107, 6411–6424. [CrossRef]
32. Łodziana, Z.; Nørskov, J.K. Adsorption of Cu and Pd on α-Al2O3 (0001) surfaces with different stoichiometries.J. Chem. Phys. 2001, 115. [CrossRef]
33. Kotomin, E.A.; Popov, A.I. Radiation-induced point defects in simple oxides. Nucl. Instrum. Methods Phys.1998, 141, 1–15.
34. Carrasco, J.; Gomes, J.R.B.; Illas, F. Theoretical study of bulk and surface oxygen and aluminum vacanciesin α-Al2O3. Phys. Rev. B 2004, 69. [CrossRef]
35. In this research, we did not study F+-centers, however, we expect that its absorption band, which typicallyhas the similar or a slightly higher energy than F0-center, will fall in the observed range of 4.5–5.1 eV.
36. Ivakin, Y.D.; Danchevskaya, M.N.; Ovchinnikova, O.G.; Murav’eva, G.P.; Kreisberg, V.A. The kinetics andmechanism of doped corundum structure formation in an water fluid. Rus. J. Phys. Chem. B 2009, 3,1019–1034. [CrossRef]
37. Mullen, P.A.; Orloff, M.K. Ultraviolet absorption spectrum of pentaerythritol tetranitrate. J. Phys. Chem. 1973,77, 910–911.
38. Yu, Z.; Bernstein, E.R. Decomposition of pentaerythritol tetranitrate [C(CH2ONO2)4] followingelectronic excitation. J. Chem. Phys. 2011, 135. [CrossRef]
39. Cooper, J.K.; Grant, C.D.; Zhang, J.Z. Experimental and TD-DFT Study of optical absorption of six explosivemolecules: RDX, HMX, PETN, TNT, TATP, and HMTD. J. Phys. Chem. A 2013, 117, 6043–6051. [CrossRef][PubMed]
40. The fact that our optical measurements of the Al2O3-PETN composites did not register the absorption bandcorresponding to the transition from F0-center (HOMO) to PETN (LUMO) is explained by a simple reason.The absorption was measured in the range from 190 to 1100 nm (1.12–6.52 eV), and the excitation of 1.2 fallsright at the edge of the measurement interval.
41. Carrasco, J.; Lopez, N.; Sousa, C.; Illas, F. First-principles study of the optical transitions of F centers in thebulk and on the (0001) surface of α-Al2O3. Phys. Rev. B 2005, 72. [CrossRef]
42. Tsyshevsky, R.V.; Sharia, O.; Kuklja, M.M. Optical absorption energies of molecular defects in pentaerythritoltetranitrate crystals: Quantum chemical modeling. J. Phys. Chem. C 2014, 118, 26530–26542.
43. Hohenberg, P.; Kohn, W. Inhomogeneous electron gas. Phys. Rev. 1964, 136, B864–B871. [CrossRef]44. Kohn, W.; Sham, L.J. A self-consistent equations including exchange and correlation effects. Phys. Rev. 1965,
140, A1133–A1138. [CrossRef]45. Dion, M.; Rydberg, H.; Schroder, E.; Langreth, D.C.; Lundqvist, B.I. Van der Waals density functional for
general geometries. Phys. Rev. Lett. 2004, 92. [CrossRef]46. Thonhauser, T.; Cooper, V.R.; Li, S.; Puzder, A.; Hyldgaard, P.; Langreth, D.C. Van der Waals density functional:
Self-consistent potential and the nature of the van der Waals bond. Phys. Rev. B 2007, 76. [CrossRef]
Molecules 2016, 21, 289 13 of 13
47. Roman-Perez, G.; Soler, J.M. Efficient implementation of a van der Waals density functional: Application todouble-wall carbon nanotubes. Phys. Rev. Lett. 2009, 103. [CrossRef] [PubMed]
48. Kresse, G.; Futhmuller, J. Efficiency of ab-initio total energy calculations for metals and semiconductorsusing a plane-wave basis set. Comput. Mater. Sci. 1996, 6, 15–50.
49. Kresse, G.; Furthmuller, F. Efficient iterative schemes for ab initio total-energy calculations using a plane-wavebasis set. Phys. Rev. B 1996, 54, 11169–11186.
50. Kresse, G.; Hafner, J. Ab initio molecular dynamics for liquid metals. Phys. Rev. B 1993, 47, 558–561. [CrossRef]51. Adamo, C.; Barone, V. Toward reliable density functional methods without adjustable parameters: The PBE0 model.
J. Chem. Phys. 1999, 110, 6158–6169. [CrossRef]52. Blöchl, P.E. Projector augmented-wave method. Phys. Rev. B 1994, 50, 17953–17979. [CrossRef]53. Kirfel, A.; Eichhorn, K. Accurate structure analysis with synchrotron radiation. The electron density in Al2O3
and Cu2O. Acta Cryst. 1990, 46, 271–284. [CrossRef]54. Gajdoš, M.; Hummer, K.; Kresse, G.; Furthmüller, J.; Bechstedt, F. Linear optical properties in the
projector-augmented wave methodology. Phys. Rev. B 2006, 73, 045112. [CrossRef]55. Becke, A.D. Density-functional thermochemistry. III. The role of exact exchange. J. Chem. Phys. 1993, 98,
5648–5652.56. Lee, C.; Yang, W.; Parr, R.G. Development of the colle-salvetti correlation-energy formula into a functional of
the electron density. Phys. Rev. B 1988, 37, 785–789. [CrossRef]57. Gaussian 09; Revision B.01; Gaussian Inc.: Wallingford, CT, USA, 2009.58. Ahmad, S.R.; Cartwright, M. Laser Ignition of Energetic Materials; John Wiley & Sons: New York, NY, USA, 2014.
Sample Availability: Samples of the compounds are available from the authors upon request.
© 2016 by the authors; licensee MDPI, Basel, Switzerland. This article is an open accessarticle distributed under the terms and conditions of the Creative Commons by Attribution(CC-BY) license (http://creativecommons.org/licenses/by/4.0/).