Embed Size (px)
Citation preview

1
Applied Microbiology and Biotechnology 2014
http://link.springer.com/article/10.1007/s00253-014-6090-z
Phenotypic evaluation of natural and industrial Saccharomyces yeasts for
different traits desirable in industrial bioethanol production
Vaskar Mukherjee1,3#
, Jan Steensels2#
, Bart Lievens1, Ilse Van de Voorde
3, Alex Verplaetse
3, Guido
Aerts3, Kris A. Willems
1, Johan M. Thevelein
4, Kevin J. Verstrepen
2 and Stefan Ruyters
1*
Abstract Saccharomyces cerevisiae is the organism of choice for many food and beverage fermentations
because it thrives in high-sugar and high-ethanol conditions. However, the conditions encountered in
bioethanol fermentation pose specific challenges, including extremely high sugar and ethanol concentrations,
high temperature and the presence of specific toxic compounds. It is generally considered that exploring the
natural biodiversity of Saccharomyces strains may be an interesting route to find superior bioethanol strains
and may also improve our understanding of the challenges faced by yeast cells during bioethanol fermentation.
In this study, we phenotypically evaluated a large collection of diverse Saccharomyces strains on six selective
traits relevant for bioethanol production with increasing stress intensity. Our results demonstrate a remarkably
large phenotypic diversity among different Saccharomyces species and among S. cerevisiae strains from
different origins. Currently applied bioethanol strains showed a high tolerance to many of these relevant traits,
but several other natural and industrial S. cerevisiae strains outcompeted the bioethanol strains for specific
traits. These multitolerant strains performed well in fermentation experiments mimicking industrial bioethanol
production. Together, our results illustrate the potential of phenotyping the natural biodiversity of yeasts to
find superior industrial strains that may be used in bioethanol production or can be used as a basis for further
strain improvement through genetic engineering, experimental evolution, or breeding. Additionally, our study
provides a basis for new insights into the relationships between tolerance to different stressors.
Key words bioethanol, fermentation, high-throughput, phenotype, Saccharomyces spp., stress tolerance
1 KU Leuven, Laboratory for Process Microbial Ecology and Bioinspirational Management, Cluster for Bioengineering
Technology (CBeT), Department of Microbial and Molecular Systems (M2S), Campus De Nayer, Fortsesteenweg 30A, B-2860
Sint-Katelijne-Waver, Belgium
2 KU Leuven, Laboratory for Genetics and Genomics & VIB Laboratory for Systems Biology, Centre of Microbial and Plant
Genetics (CMPG), Department of Microbial and Molecular Systems (M2S), Gaston Geenslaan 1, B-3001 Leuven, Belgium
3 KU Leuven, Laboratory of Enzyme, Fermentation, and Brewing Technology, Cluster for Bioengineering Technology (CBeT),
Department of Microbial and Molecular Systems (M2S), Campus KaHo Sint-Lieven, Gebroeders De Smetstraat 1, B-9000
Ghent, Belgium
4 KU Leuven, Laboratory of Molecular Cell Biology, Institute of Botany and Microbiology, and VIB Department of Molecular
Microbiology, Kasteelpark Arenberg 31, B-3001 Leuven,Belgium
#These authors contributed equally
*corresponding author: [email protected] Tel +32 15 30 55 97 Fax +32 15 30 55 99

2
Introduction
Taxonomic analysis of the microbiota present in spontaneous alcoholic fermentation
processes, such as the fermentation of fruit juice, beer wort, honey or cocoa, revealed a huge yeast
diversity, with one yeast species dominating most of the fermentation processes, namely the
ascomycetous yeast Saccharomyces cerevisiae (Pando Bedriñana et al. 2010; Bokulich et al. 2014;
Meersman et al. 2013; Pretorius 2000; Steensels et al. 2014). This dominance has been studied
intensively, and it was established that S. cerevisiae developed several mechanisms that caused a
selective advantage in sugar-rich, alcoholic fermentation-like environments. For example, the
Crabtree effect (in which glucose represses respiration) in S. cerevisiae is the basis for the so-called
“make-accumulate-consume” strategy, where ethanol is first produced to inhibit the growth of other
microorganisms, and is later consumed when all fermentable sugars are depleted (Thomson 2005).
Furthermore, its ability to grow in both aerobic and anaerobic conditions and its very high glycolytic
flux enables it to thrive in all stages of the fermentation process and restrain competing
microorganisms (Conant and Wolfe 2007; Goddard 2008; Piškur et al. 2006). Interestingly, the
majority of these “fermentative features” emerged not as a response to a man-made fermentation
environment, but rather in response to the emergence of angiosperms and fleshy fruits that offered
a novel carbon resource worth defending by ethanol accumulation (Thomson et al. 2005;
Voordeckers et al. 2012). However, it is well accepted that human intervention has evolved wild S.
cerevisiae strains into distinct domesticated variants (Diezmann and Dietrich 2009; Fay and
Benavides 2005; Steensels and Verstrepen 2014). Examples of traits acquired during domestication
include increased copper tolerance (Warringer et al. 2011), flavour production (Hyma et al. 2011) and
fructose fermentation capacity (Novo et al. 2009) for wine strains, or an industrially favorable
flocculation behavior (Verstrepen et al. 2003) and improved maltose utilization (Voordeckers et al.
2012) in brewing strains. As a result, there are currently several non-domesticated (”wild”) and
domesticated (”industrial”) genetic lineages of S. cerevisiae (Liti et al. 2009). These lineages are often
not strictly genetically or geographically separated. Indeed, recent genome-wide analysis of the S.
cerevisiae biodiversity revealed that man-mediated dispersal of this species allowed intercrossing of
different lineages generated strains with mosaic genomes that inherited traits from both parental
lineages (Diezmann and Dietrich 2009; Legras et al. 2007; Liti et al. 2009). This peculiar genomic
structure is not encountered in non-domesticated species, such as the S. paradoxus, which is
genetically closely related to S. cerevisiae.
Compared to e.g. beer, bread or wine fermentations, bioethanol production is a relatively
new man-made fermentation process. The bioethanol environment confronts yeasts with new, very
specific challenges, which differ greatly from conditions commonly encountered in the traditional
3
food and beverage fermentations. More specifically, the implementation of very high gravity
fermentation with initial sugar concentrations above 300 g l-1 to increase cost efficiency requires
osmotolerant and ethanol tolerant yeast strains (Pais et al. 2013; Puligundla et al. 2011; Tao et al.
2012; Watanabe et al. 2010). Salt tolerance is important in ethanol production with molasses (Basso
et al. 2011). In second-generation bioethanol production with lignocellulose hydrolysates, typical
stressors include furfural and 5-hydroxymethylfurfural (5-HMF) originating from the dehydration of
pentoses and hexoses, respectively, weak acids formed by the degradation of furfural and 5-HMF
(Almeida et al. 2007; Palmqvist and Hahn-Hägerdal 2000, Taylor et al. 2012), acetic acid due to
cleavage of acetyl groups from the xylan backbone of the hemicelluloses fraction (Chen et al. 2012),
phenolic compounds released due to partial breakdown of lignin (Almeida et al. 2011) and heavy
metal contaminants. Lastly, strains are often subjected to thermal stress during the fermentation
process, which is caused by the metabolic activity of the yeasts and/or by high environmental
temperatures (Basso et al. 2011; Kumar et al. 2013).
Several studies aimed to improve the efficiency of S. cerevisiae strains for first- and second-
generation bioethanol production by targeting one or few specific traits of interest, such as tolerance
to inhibitors or pentose fermentation, e.g. by quantitative trait locus (QTL) analysis, mutagenesis,
genome shuffling, metabolic and evolutionary engineering or a combination of these techniques
(Demeke et al. 2013; Hubmann et al. 2013; Koppram et al. 2012; Kumari and Pramanik 2012; Pais et
al. 2013; Pinel et al. 2011; Shi et al. 2009; Swinnen et al. 2012; Tao et al. 2012). Moreover, several
recent studies focus on investigating the potential of wild or other industrial S. cerevisiae strains for
bioethanol production (Jin et al. 2013; Pereira et al. 2014; Ramos et al. 2013; Wimalasena et al.
2014). Indeed, in the Brazilian bioethanol production with yeast recycling, regular baker’s yeast
strains initially used as bioethanol fermentations starters were quickly outcompeted by invading wild
strains. They dominated and persisted much better in the recycling system than any domesticated
yeast strain (Basso et al. 2008; da Silva-Filho et al. 2005). This shows the potential of phenotyping the
natural biodiversity of yeasts to find superior industrial bioethanol strains. However, many of these
previously performed studies are limited by the number of targeted traits or by the number of
studied strains, despite the advent of diverse high-throughput automated phenotypic screening
platforms. Nevertheless, such information might be crucial for selection of new, multitolerant strains
that can serve as efficient bioethanol production strains or as good candidates for further
improvements by, for example, genetic or evolutionary engineering and/or breeding.
In this study, a comprehensive phenotypic evaluation of a large collection of Saccharomyces
isolates belonging to different species was performed for six stress tolerance traits important for
bioethanol production. Studied isolates originated from different habitats and were subjected to
4
increasing stress intensities in order to map the phenotypic diversity among different Saccharomyces
species and among S. cerevisiae strains from different origins. The most multitolerant strains were
selected for fermentation experiments mimicking industrial bioethanol production.
Materials and methods
Yeast collection
A large culture collection, consisting of 373 industrial and wild Saccharomyces isolates from
diverse origins and belonging to S. cerevisiae (279), S. pastorianus (46), S. paradoxus (38) and S.
bayanus (10), was used in this study (Table 1). Isolates were identified to the species level by
sequencing the variable D1/D2 domain of the large-subunit (26S) ribosomal RNA gene as described
by Kurtzman and Robnett (1997). The majority of strains (276) originated from diverse industrial food
fermentations, such as ale (122, all S. cerevisiae), lager (47, all S. pastorianus except one), wine (71,
all S. cerevisiae except one S. bayanus), sake (15, all S. cerevisiae), spirit (12, all S. cerevisiae) or
bakery (9, all S. cerevisiae). Additionally, eight S. cerevisiae strains that are currently applied in
commercial bioethanol production were included. Further, the collection consisted of 82 wild isolates
(no S. pastorianus) originating from various natural environments, such as oak bark and spontaneous
cocoa fermentations, and a number of laboratory yeast strains, including S288c (Mortimer and
Johnston 1986) and SK1 (Kane and Roth 1974). All isolates were stored at -80 °C in glycerol based
standard storage medium (2% w/v bacto peptone, 1% w/v yeast extract, 25% v/v glycerol) in 96-well
microtiter plates. Five strains from different origins were present in each microtiter plate as a control
for inter-experiment variation.
Genotyping
All isolates were characterized at strain level by interdelta typing according to Legras and
Krast (2003), employing the primers delta12 (5’-TCAACAATGGAATCCCAAC-3’) and delta21 (5’-
CATCTTAACACCGTATATGA-3’). Genomic DNA was extracted as described previously (Meersman et al.
2013). PCR amplification was performed in a reaction volume of 20 µl, containing 200 mM of each
dNTP, 1 µM of each primer, 5 units ExTaq polymerase, 1x ExTaq Buffer (Takara, Otsu, Shiga Japan),
and 5 ng genomic DNA. Amplification was performed using a C1000 thermal cycler (Biorad, Hercules,
California USA) according to the following thermal profile: initial denaturation at 95 °C for 3 min,
followed by 9 cycles of 94 °C for 25 s, 45 °C for 30 s and 72 °C for 90 s, and 21 cycles of 94 °C for 25 s,
50 °C for 30 s and 72 °C for 90 s. A final elongation step of 10 min at 72 °C was performed.
Amplification products were separated by agarose gel electrophoresis (7 min, 5 kV) on a QIAxcel
Advanced System (Qiagen, Venlo, Limburg Netherlands).
5
Test conditions and media preparation
Unless mentioned otherwise, all materials used for media preparation were purchased from
Sigma-Aldrich (St. Louis, Missouri USA). All isolates were evaluated for (i) sugar- and/or
osmotolerance using increasing concentrations of glucose (ranging from 40% to 70% w/v), fructose
(40% - 70% w/v) and sorbitol (30% - 55% w/v), (ii) halotolerance using increasing concentrations of
NaCl (500 mM - 3000 mM), KCl (1000 mM - 4000 mM) and LiCl (10 mM - 600 mM), (iii) ethanol
tolerance using increasing concentrations of ethanol (5% - 15% v/v), (iv) furan derivative tolerance
using increasing concentrations of 5-HMF (2 g l-1 - 7 g l-1), and (v) metal tolerance using increasing
concentrations of ZnCl2 (1 mM – 10 mM), CuSO4 (0.1 mM – 2 mM) and CdSO4 (0.25 mM – 3 mM).
Concentrations were selected based on Saccharomyces tolerance limits described in literature and
can be found in Table S1 (Supplementary Information). For all trait evaluations, YPD agar plates (1.5%
w/v agar (Invitrogen, Carlsbad, California USA); 2% w/v bacto peptone (Becton Dickinson, East
Rutherford, New Jersey USA); 1% w/v yeast extract (LabM, Heywood, Lancashire UK) and 2% w/v
glucose) were used, supplemented with the test compound. Additionally, isolates were incubated on
YPD agar without test compound as a control. Further, isolates were tested for thermotolerance (24
°C - 41 °C) on this medium. Carbon and nitrogen sources were autoclaved separately to avoid
Maillard reactions, and mixed when the temperature dropped to about 50 °C. Ethanol and 5-HMF
were also added after autoclaving.
Phenotypic screening
In order to maximize throughput and reproducibility, a high-density array robot (ROTOR HDA,
Singer Instruments, Roadwater, Somerset UK) was used to produce and replicate high-density arrays
of the yeast collection on the different test media. More specifically, first, the 96-well microtiter
plates containing the stored isolates were thawed and spotted on YPD agar and incubated at 30 °C
for 48 h. Next, 96-well plates containing 150 µl of standard YPD medium (2% w/v Bacto peptone; 1%
w/v yeast extract, and 2% w/v glucose) in each well were inoculated with the isolates using the robot
and incubated overnight at 30 °C on a microplate shaking platform (Heidolph, Schwabach, Bavaria
Germany) at 900 rpm. In case of screening for ethanol tolerance, isolates were precultured for 48 h
in YPD medium with 2% ethanol (v/v) for preconditioning. Then, the optical density at 600 nm (OD600)
of all wells was measured using a microplate reader (Molecular Devices, Sunnyvale, California USA).
Subsequently, cell density was manually adjusted to OD600≈0.2 in a second 96-well microtiter plate
using sterile deionized water in order to standardize the starting cell concentration for all isolates.
This plate was used as the source plate for spotting the test media. After spotting, all plates were
sealed using parafilm and incubated at 30 °C (except for the thermotolerance assays). After five days

6
of incubation all plates were scanned using a high definition scanner (Seiko Epson, Nagano, Japan).
An example of the obtained pictures can be found in Supplementary Material Fig. S2.
Data analysis
For each isolate, a phenotypic profile was obtained by assessment of the colony size on the
different test media relative to the growth on the control medium (YPD agar), containing no test
compounds. For that purpose, scanned images were processed using ImageJ (Abramoff et al. 2004),
combined with the ScreenMill software (Dittmar et al. 2010) especially developed for this purpose.
Relative growth was calculated as the growth at a certain trait concentration (“test condition”)
relative to the growth on the control medium. Growth under a test condition is only considered
when the relative growth exceeds 5% of the growth on the control medium. The relative growth was
further processed by an inverse hyperbolic sine transformation, followed by conversion into Z-scores,
which is a statistical measurement of a score's relationship to the mean in a group of scores:
�-����� =(� − )
�
with X = transformed relative growth for a particular strain under a particular test condition; µ =
mean transformed relative growth for all isolates for a particular test condition; σ = standard
deviation of transformed values for all isolates for a particular test condition.
Both genotypic and phenotypic profiles obtained were processed using BioNumerics (Applied
Maths, Sint-Martens-Latem, Belgium). Clustering of the isolates based on genotype was established
using a combination of the Dice coefficient (for generating the similarity matrix) and the Unweighted
Pair Group Method with Arithmetic Mean (UPGMA) clustering algorithm. Clustering of the isolates
based on phenotype was performed using the Pearson coefficient (for generating the similarity
matrix) and the UPGMA algorithm. The equality of overall phenotypic variation among different
species and between domesticated and non-domesticated isolates was estimated by calculating the
coefficient of variation among isolates at different reference concentrations followed by student’s
two tailed paired t-test to check for any statistically significant difference (p value < 0.05).
Maximal tolerance limits were defined for each species, and for origin of isolation by the
stress concentrations at which at least 10% of the strains showed >5% relative growth. Additionally,
for each trait a “reference concentration” was determined (Supplementary Material Table S2) as the
concentration where approximately 50% of the investigated isolates managed to grow and showed
the highest coefficient of variation. These reference concentrations should therefore be the best
concentrations to position isolates in comparison with the whole isolates set. Spearman correlation
coefficients were calculated among reference concentrations for each tested trait using SAS software
(SAS 9.3, SAS Institute, USA). Further, results were visualized by density plots (“bean plots”) using R
7
for each reference concentration (R Development Core Team, 2013). The pairwise Wilcoxon test for
equality of means, combined with the Holm correction for multiple testing, and the Levene’s test for
equality of variances were performed using R in order to detect significant differences between
different isolation origins or between different species. These tests take into account the difference
in the number of isolates among groups.
Fermentation assays
Seven strains with the best overall performance at high concentrations of glucose, 5-HMF,
ethanol and at high temperature were selected and considered multitolerant. For these strains,
fermentation experiments at 33% glucose (w/v) were performed to determine their fermentation
potential in simulated 1st generation high-gravity bioethanol production medium. Next, the two most
promising strains (Y312 and Y232) were selected for fermentations in an artificial medium with 12%
w/v glucose and an inhibitor cocktail containing 1.02 g l-1 5-HMF, 0.33 g l-1 furfural, 1.9 g l-1 acetic
acid, 0.36 g l-1 formic acid, 0.7 g l-1 levulinic acid and 0.033 g l-1 vanillin, mimicking the inhibitor
concentrations in lignocellulose hydrolysates (Koppram et al. 2012). Similar fermentations were also
performed without inhibitors. Fermentation parameters were compared with those of commercial
bioethanol production strains (Ethanol Red and CAT1). The CO2 production rate (g l-1 h-1) was
calculated using cubic spline fitting function (Prism 6.04, Graph Pad Software, San Diego California,
USA). Lab strain S288c and ale strain Y1 were used as references for strains performing weakly in our
high-throughput phenotypic evaluation. Strains were precultured overnight in 3 ml control medium
containing 2% glucose at 30 °C. Subsequently, 50 ml YP medium containing 10% glucose was
inoculated with the strains at a starting OD600 of 0.75 and incubated at 30 °C, 200 rpm for two days
until stationary phase. Next, OD600 of the precultures was measured and fermentation tubes were
inoculated at a final OD600 of 2.5 (for 33% glucose) or 0.75 (for artificial fermentation medium
mimicking the inhibitor concentrations in lignocellulose hydrolysates) in a total volume of 80 ml.
Semi-anaerobic batch fermentation were performed in cylindrical glass tubes with a rubber stopper
containing a cotton plugged glass pipe to release CO2. The fermentations were continuously stirred at
120 rpm. This system has been used frequently to mimic the industrial fermentation conditions
(Demeke et al. 2013; Hubmann et al. 2013). The weight loss of the tubes due to CO2 release was used
to follow the course of fermentation. Fermentations were performed in duplicate. At the end of the
fermentation (when the CO2 production rate dropped below 0.01 g l-1 h-1), 1 ml samples of the
fermentation medium were taken, centrifuged and the concentration of ethanol was determined in
the supernatant using high performance liquid chromatography (HPLC, Waters isocratic Breeze, ion
exchange column WAT010290; Demeke et al. 2013). Column temperature was maintained at 75 °C. 5
8
mM H2SO4 was used as eluent with a flow rate of 1 ml min-1. A refractive index detector (Waters
2410, Waters, Milford, Massachusetts USA) was used to quantify the compounds of interest.
Results
Genetic and phenotypic diversity within the Saccharomyces isolates collection
Genotyping by PCR-based fingerprinting (interdelta analysis) showed that this collection
consists of genetically very diverse isolates. Interestingly, S. cerevisiae did not show clearly
distinguishable clusters of isolates from different origins (Supplementary Material Fig. S1) except for
a separate cluster of ale isolates. Isolates from other origins did not cluster clearly, which is indicative
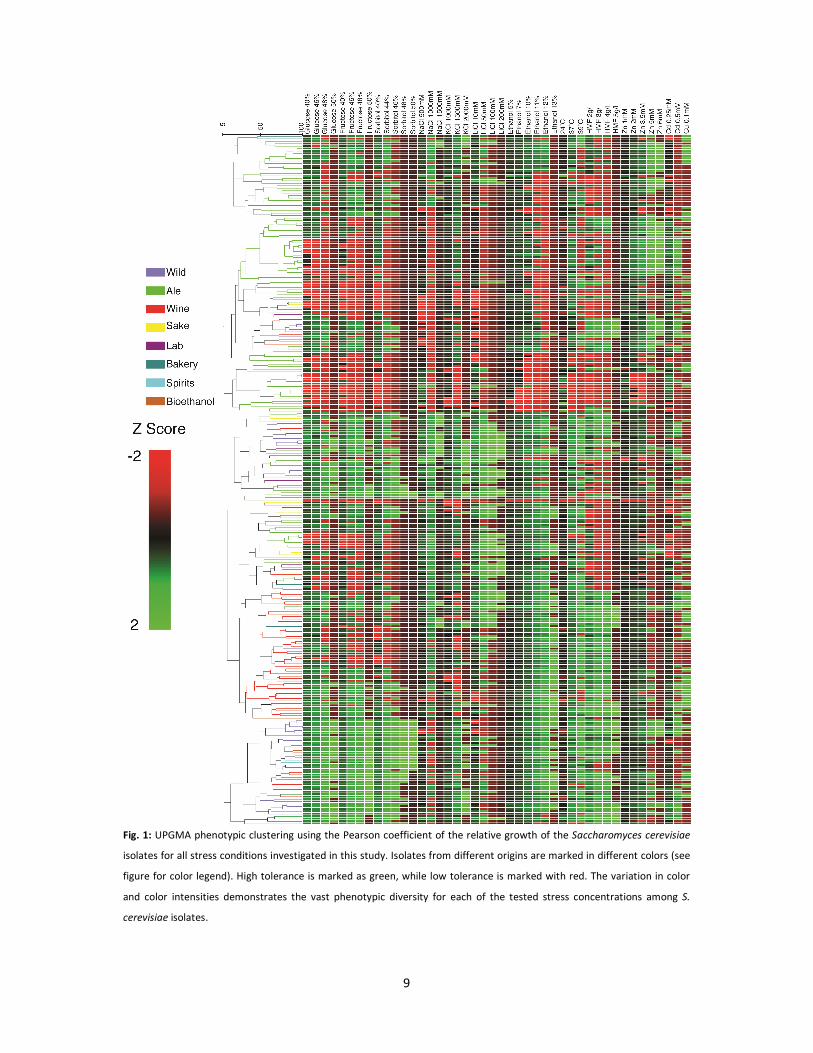
of a broad genetic diversity within the collection. The color gradient in the phenotypic clustering in
Fig. 1 shows the tolerance of each S. cerevisiae isolate to a given stress concentration, with green
being most tolerant and red as least tolerant. The variation in color and color intensities within each
column in Fig. 1 demonstrates the vast phenotypic diversity for each of the tested stress
concentrations among S. cerevisiae isolates. Relative growth of all isolates on all parameters is given
in Supplementary Material Table S3. No significant difference in the overall phenotypic diversity was
observed between the species S. paradoxus and S. cerevisiae (student’s two tailed paired t-test,
p=0.62). However, for specific traits the diversity of the S. paradoxus isolates was significantly
(Levene’s test for equality of variances, p<0.05) lower than that of the S. cerevisiae strains, e.g.
under osmostress (39% difference in coefficient of variance), NaCl stress (27%), KCl stress (55%), Cd
stress (71%), while the diversity of the S. cerevisiae isolates was significantly lower than that of the S.
paradoxus isolates for LiCl stress (30%), ethanol stress (17%), thermal stress (77%) and Cu stress
(49%). Additionally, the overall phenotypic diversity among the non-domesticated (wild) S. cerevisiae
isolates was found to be 6% less than the domesticated S. cerevisiae isolates.
Comparison of stress tolerance between different Saccharomyces species
A significant and very high correlation (r=0.78-0.85, Table 3) between tolerance to the three
different osmolytes used in this study (glucose, fructose and sorbitol) was observed. Therefore, only
osmotolerance in glucose medium will be discussed henceforward. S. pastorianus was the least
tolerant to all stress factors compared to the other species (Table 1 and Fig. 2) and in particular for
osmostress, ethanol stress and 5-HMF stress. S. paradoxus generally grew better compared to the
other species in high osmolyte concentrations, e.g. 76% of the isolates (29 isolates) managed to grow
in 48% glucose (w/v) (reference concentration), compared to only 13% (6 strains) of S. pastorianus,
55% (153 isolates) of S. cerevisiae and 60% (6 strains) of S. bayanus isolates. Similarly, significant
differences were noticed in the KCl tolerance assay (Fig. 2 and Table S4A), in which 97% (37) of S.
paradoxus isolates exhibited growth at the reference concentration compared to 26% (12) of
9
Fig. 1: UPGMA phenotypic clustering using the Pearson coefficient of the relative growth of the Saccharomyces cerevisiae
isolates for all stress conditions investigated in this study. Isolates from different origins are marked in different colors (see
figure for color legend). High tolerance is marked as green, while low tolerance is marked with red. The variation in color
and color intensities demonstrates the vast phenotypic diversity for each of the tested stress concentrations among S.
cerevisiae isolates.
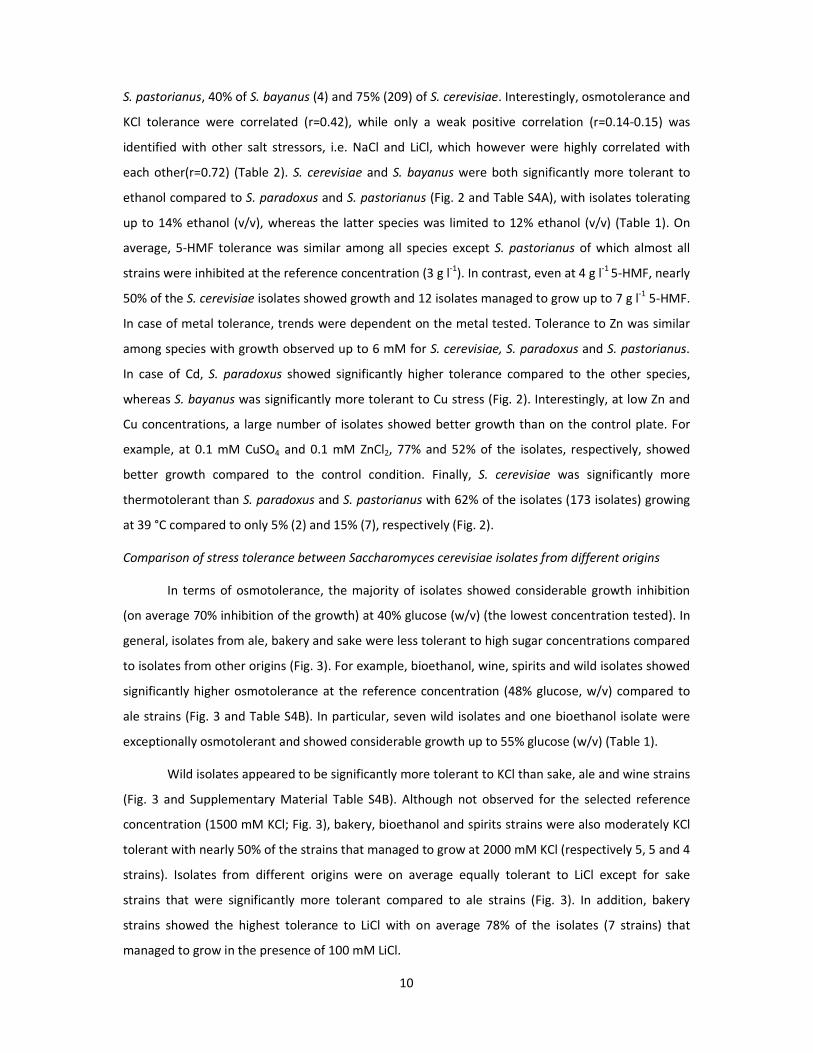
10
S. pastorianus, 40% of S. bayanus (4) and 75% (209) of S. cerevisiae. Interestingly, osmotolerance and
KCl tolerance were correlated (r=0.42), while only a weak positive correlation (r=0.14-0.15) was
identified with other salt stressors, i.e. NaCl and LiCl, which however were highly correlated with
each other(r=0.72) (Table 2). S. cerevisiae and S. bayanus were both significantly more tolerant to
ethanol compared to S. paradoxus and S. pastorianus (Fig. 2 and Table S4A), with isolates tolerating
up to 14% ethanol (v/v), whereas the latter species was limited to 12% ethanol (v/v) (Table 1). On
average, 5-HMF tolerance was similar among all species except S. pastorianus of which almost all
strains were inhibited at the reference concentration (3 g l-1). In contrast, even at 4 g l-1 5-HMF, nearly
50% of the S. cerevisiae isolates showed growth and 12 isolates managed to grow up to 7 g l-1 5-HMF.
In case of metal tolerance, trends were dependent on the metal tested. Tolerance to Zn was similar
among species with growth observed up to 6 mM for S. cerevisiae, S. paradoxus and S. pastorianus.
In case of Cd, S. paradoxus showed significantly higher tolerance compared to the other species,
whereas S. bayanus was significantly more tolerant to Cu stress (Fig. 2). Interestingly, at low Zn and
Cu concentrations, a large number of isolates showed better growth than on the control plate. For
example, at 0.1 mM CuSO4 and 0.1 mM ZnCl2, 77% and 52% of the isolates, respectively, showed
better growth compared to the control condition. Finally, S. cerevisiae was significantly more
thermotolerant than S. paradoxus and S. pastorianus with 62% of the isolates (173 isolates) growing
at 39 °C compared to only 5% (2) and 15% (7), respectively (Fig. 2).
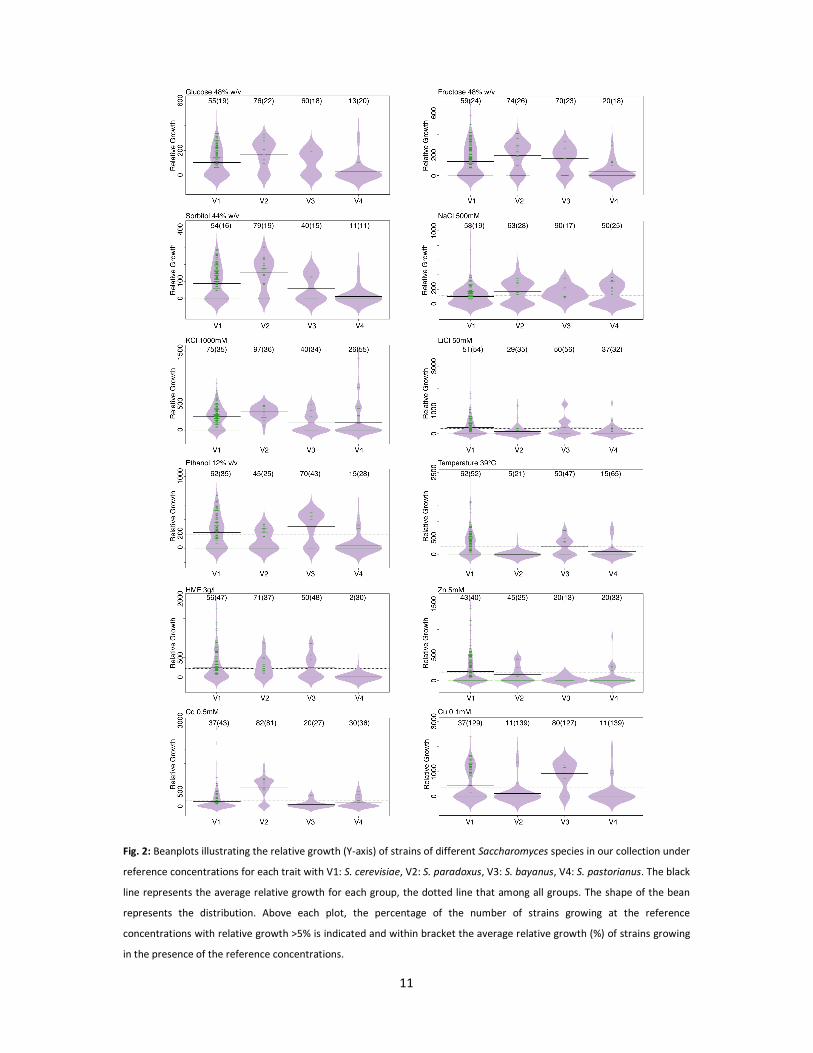
Comparison of stress tolerance between Saccharomyces cerevisiae isolates from different origins
In terms of osmotolerance, the majority of isolates showed considerable growth inhibition
(on average 70% inhibition of the growth) at 40% glucose (w/v) (the lowest concentration tested). In
general, isolates from ale, bakery and sake were less tolerant to high sugar concentrations compared
to isolates from other origins (Fig. 3). For example, bioethanol, wine, spirits and wild isolates showed
significantly higher osmotolerance at the reference concentration (48% glucose, w/v) compared to
ale strains (Fig. 3 and Table S4B). In particular, seven wild isolates and one bioethanol isolate were
exceptionally osmotolerant and showed considerable growth up to 55% glucose (w/v) (Table 1).
Wild isolates appeared to be significantly more tolerant to KCl than sake, ale and wine strains
(Fig. 3 and Supplementary Material Table S4B). Although not observed for the selected reference
concentration (1500 mM KCl; Fig. 3), bakery, bioethanol and spirits strains were also moderately KCl
tolerant with nearly 50% of the strains that managed to grow at 2000 mM KCl (respectively 5, 5 and 4
strains). Isolates from different origins were on average equally tolerant to LiCl except for sake
strains that were significantly more tolerant compared to ale strains (Fig. 3). In addition, bakery
strains showed the highest tolerance to LiCl with on average 78% of the isolates (7 strains) that
managed to grow in the presence of 100 mM LiCl.
11
Fig. 2: Beanplots illustrating the relative growth (Y-axis) of strains of different Saccharomyces species in our collection under
reference concentrations for each trait with V1: S. cerevisiae, V2: S. paradoxus, V3: S. bayanus, V4: S. pastorianus. The black
line represents the average relative growth for each group, the dotted line that among all groups. The shape of the bean
represents the distribution. Above each plot, the percentage of the number of strains growing at the reference
concentrations with relative growth >5% is indicated and within bracket the average relative growth (%) of strains growing
in the presence of the reference concentrations.
12
Fig. 3: Beanplots illustrating the relative growth of Saccharomyces cerevisiae strains coming from different origins in the
presence of the reference concentrations, with V1: Ale, V2: Bakery, V3: Bioethanol, V4: Sake, V5: Wine, V6: Spirit, V7: Wild,
V8: Lab. Above each plot, the percentage of the number of strains growing in the presence of the reference concentrations
with relative growth >5% is indicated and within brackets the average relative growth of strains growing in the presence of
the reference concentrations.
13
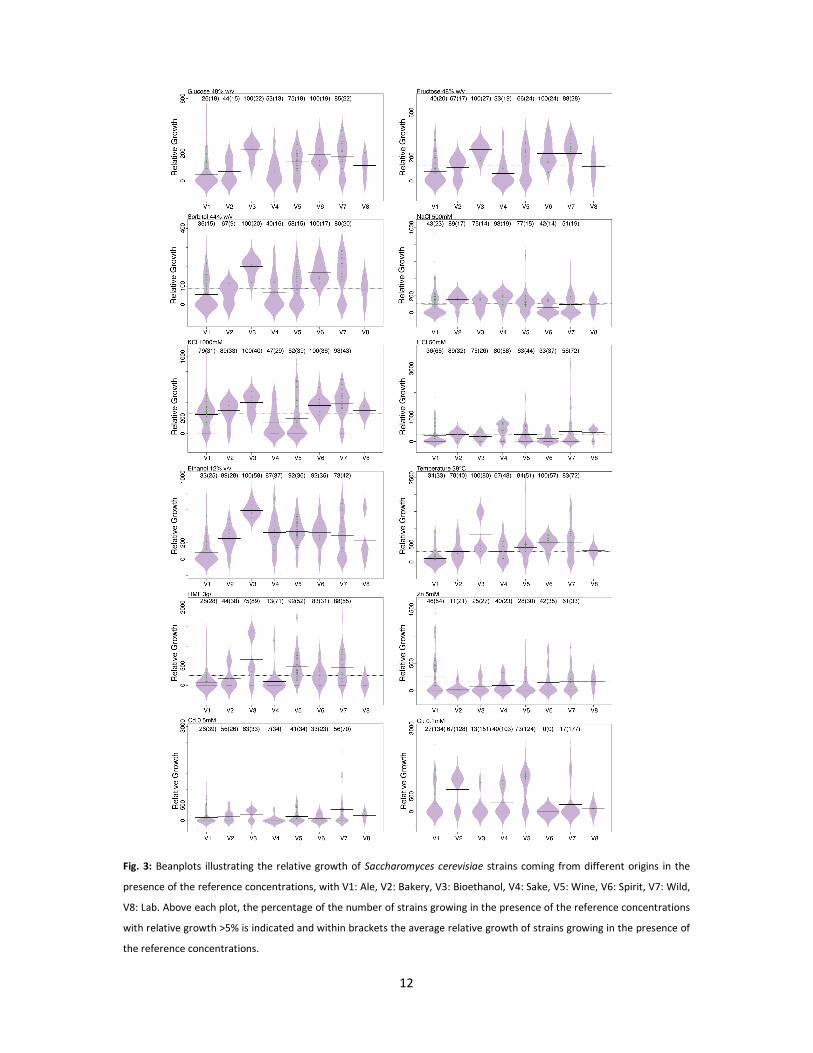
Table 1: Overview of the number of isolates and tolerance limits(a) of different Saccharomyces species and for different origins of S. cerevisiae isolates in this
study.
No of isolates Glucose
w/v%
Fructose
w/v%
Sorbitol
w/v%
NaCl
mM
KCl
mM
LiCl
mM
Ethanol
v/v%
Temp
°C
HMF
g l-1
ZnCl2
mM
CdSO4
mM
CuSO4
mM
Species
S. cerevisiae 279 50 50 48 1500 2000 200 14 39 5 6 0.5 0.2
S. paradoxus 38 50 50 50 1000 2000 100 12 37 5 6 1 0.1
S. pastorianus 46 50 48 44 1500 1500 100 12 39 2 6 0.5 0.1
S. bayanus 10 48 48 46 1500 1500 200 14 39 5 5 0.5 0.1
Origin of S. cerevisiae isolates
Ale 122 48 48 46 1000 2000 200 12 39 4 7 0.5 0.1
Wild 41 55 55 50 1500 2000 200 13 39 7 6 0.5 0.1
Wine 64 50 50 46 1500 1500 200 14 39 5 5 0.5 0.2
Sake 15 48 48 48 1000 1500 200 14 39 4 6 0.25 0.2
Spirits 12 50 50 50 1000 2000 100 13 39 5 6 0.5 <0.1
Bakery 9 50 50 50 1500 2000 200 12 39 5 5 0.5 0.2
Bioethanol 8 55 55 50 1000 2000 50 14 39 6 6 0.5 0.1
Control and Industrial strains profiles
S288C 48 48 44 1000 2000 200 12 39 <2 3.5 0.25 0.1
SK1 46 <40 40 <500 1500 <10 10 39 <2 5 0.5 <0.1
Ethanol Red 50 50 50 1000 2000 50 14 39 5 3.5 0.5 <0.1
CAT1 50 55 50 1000 2000 50 13 39 2 3.5 0.25 <0.1
(a) Tolerance limit is defined as the tested concentration of each trait at which at least 10% of the isolates exhibited >5% growth.
14
Table 3: Overview of the tolerance limit, growth (at reference concentrations) and fermentation parameters in 33% glucose of the selected multitolerant
strains obtained in this study, two industrial bioethanol strains and two selected non-multitolerant strains.
Strain name Origin Osmotolerance Ethanol Tolerance HMF Tolerance Thermotolerance Fermentation
Tolerance
limit (%)
Growth
at 48%
Glucose
(%)
Tolerance
limit (%)
Growth at
12%
EtOH(%)
Tolerance
limit (g l-1
)
Growth
at 3 g l-1
HMF (%)
Tolerance
limit (°C)
Growth
at 39°C
(%)
Theoretical
Yield (%)
Time
to
reach
Vmax
(h)
C50
(h)(a)
Y745 Wild 50 32.4 14 63.5 7 66.2 41 116.9 83 18.33 40.51
Y313 Wild 50 24.5 12 25.9 7 91.7 39 85.3 86 20.26 40.51
Y314 Wild 50 22.4 13 61.6 7 77.4 39 161.5 83 24.12 40.51
Y312 Wild 50 25.5 13 59.9 7 75.1 39 158.6 84 22.19 38.58
Y310 Wine 50 21.7 14 45.6 < 2 0 39 95.3 86 18.33 36.65
Y224 Wine 50 28.4 14 52.3 4 36 39 43.8 85 20.26 32.79
Y232 Wine 50 28.1 14 51.7 4 66.8 37 0 85 18.33 30.86
CAT1 Bioethanol 50 27.6 13 56.8 2 0 39 40.6 88 18.33 30.86
Ethanol Red Bioethanol 50 24.1 14 21.9 5 128.7 39 150.3 91 18.33 32.79
s288c Lab 48 9.4 12 12.5 < 2 0 39 27.2 78 18.33 63.67
Y1 Ale < 40 0 10 0 < 2 0 39 38.5 61 31.83 79.1
(a) C50: Time to consume 50% of the initial sugar content
15
Ale strains were significantly less tolerant to 12% ethanol (v/v), while bioethanol strains
performed significantly better than the average ethanol tolerance levels of isolates from other
origins (Fig. 3). Isolates from all other origins showed no significant difference in ethanol tolerance,
however, a large variation of tolerance is observed within each origin, especially for wild isolates (Fig.
3). Some wild isolates even managed to grow at very high ethanol concentrations (14%). On average,
ale strains were also significantly less tolerant to 5-HMF compared to bioethanol, wine, spirit and
wild isolates (Fig. 3). A large variation was seen among wild isolates (Fig. 3). Most wine, bioethanol
and wild isolates were still able to grow at 4 g l-1 5-HMF (91% (58), 88% (7) and 83% (34)
respectively). Twelve isolates, of which eight were wild isolates, managed to grow even at 7 g l-1 5-
HMF.
In order to determine metal tolerance three metals were selected, i.e. Zn, Cd and Cu. Results show
that no correlation (Table 2) exists between tolerance to Cu and the two other metals (r=0.02-0.04),
whereas a weak correlation was observed between tolerance to Cd and Zn (r=0.29). On average, no
significant difference in tolerance to the reference concentration of Zn was observed among all
origins (Fig. 3). Nevertheless, ale, wild and sake isolates represented most of the isolates (89%) still
able to grow at 6 mM and four ale strains were able to grow up to 8 mM. Similarly, no significant
differences in average tolerance to Cd were observed among the isolates from different origins. From
1 mM onwards, growth of all, except five wild isolates, was inhibited. We identified two S. cerevisiae
wild isolates that can tolerate up to 2 mM of CdSO4. Results showed that wine strains were most
tolerant to 0.1 mM of Cu with 73% (47) of the strains that managed to grow and showed significantly
higher Cu tolerance compared to ale, sake, spirit and wild isolates (Fig. 3). Surprisingly, 67% (6) of the
bakery strains also showed considerably high Cu tolerance. We identified 12 S. cerevisiae strains that
managed to grow up to 0.3 mM Cu concentration, from which six originate from the winery
environment.
16
Table 2: Correlations(a) between different reference concentrations(b) for the S. cerevisiae isolates.
Glucose 48%
Fructose 48%
Sorbitol 44%
NaCl 1000 mM
KCl 1500 mM
LiCl 50 mM
ET12% T 39°C HMF 3 g l-1 ZnCl2
5mM CdSO4 0.5mM
CuSO4 0.1mM
Glucose 48%
0.84 0.78 0.14 0.42 0.15 0.56 0.41 0.47 -0.01 0.22 0.10
Fructose 48%
0.85 0.18 0.52 0.13 0.47 0.38 0.37 0.00 0.16 0.06
Sorbitol 44%
0.14 0.52 0.10 0.45 0.38 0.34 0.08 0.19 0.02
NaCl 1000 mM
0.21 0.72 0.31 0.27 -0.01 -0.23 -0.09 0.11
KCl 1500 mM
0.22 0.34 0.30 0.21 0.07 0.16 -0.09
LiCl 50 mM
0.34 0.30 0.05 -0.32 -0.08 0.05
ET12% 0.58 0.40 -0.16 0.18 0.21
T 39°C 0.36 -0.16 0.21 0.08
HMF 3 g l-1 0.05 0.40 0.18
ZnCl2 5mM
0.29 0.02
CdSO4
0.5mM 0.04
CuSO4
0.1mM
(a) All significant trait correlations (p <0.05) are indicated with black font color. Correlations that are not significant are indicated with red font color. Cells with larger correlation values are colored blue, while cells with smaller values are colored green to yellow. Cells with the smallest value are colored red. (b)
concentration at which approximately 50% of the investigated strains managed to grow and showed the highest coefficient of variation (Supplementary Material Table S2).
17
Potential of selected multitolerant Saccharomyces cerevisiae strains in first and second-generation
bioethanol fermentations
To validate the potential of the obtained dataset for selection of industrially applicable
Saccharomyces strains, two proof-of-principle experiments, aiming at the identification of strains
suitable for first and/or second generation bioethanol production were conducted. Fermentation
assays in simulated 1st generation high gravity bioethanol production medium allowed us to compare
the ethanol productivity and fermentation efficiency of the seven selected multitolerant strains
(Table 3). Ethanol Red yielded most ethanol and produced 91% of the theoretical ethanol yield,
followed by CAT1 which produced 88% of the theoretical yield. The ethanol yields of the selected
multitolerant strains were comparable (83%-86% of the theoretical ethanol yield). However, strains
Y312 and Y232 were the fastest in consuming 50% of the starting sugar concentration among the
tested wild and wine strains, respectively (Table 3). These two strains were therefore subjected to a
fermentation mimicking a second-generation bioethanol fermentation of lignocellulose hydrolysate
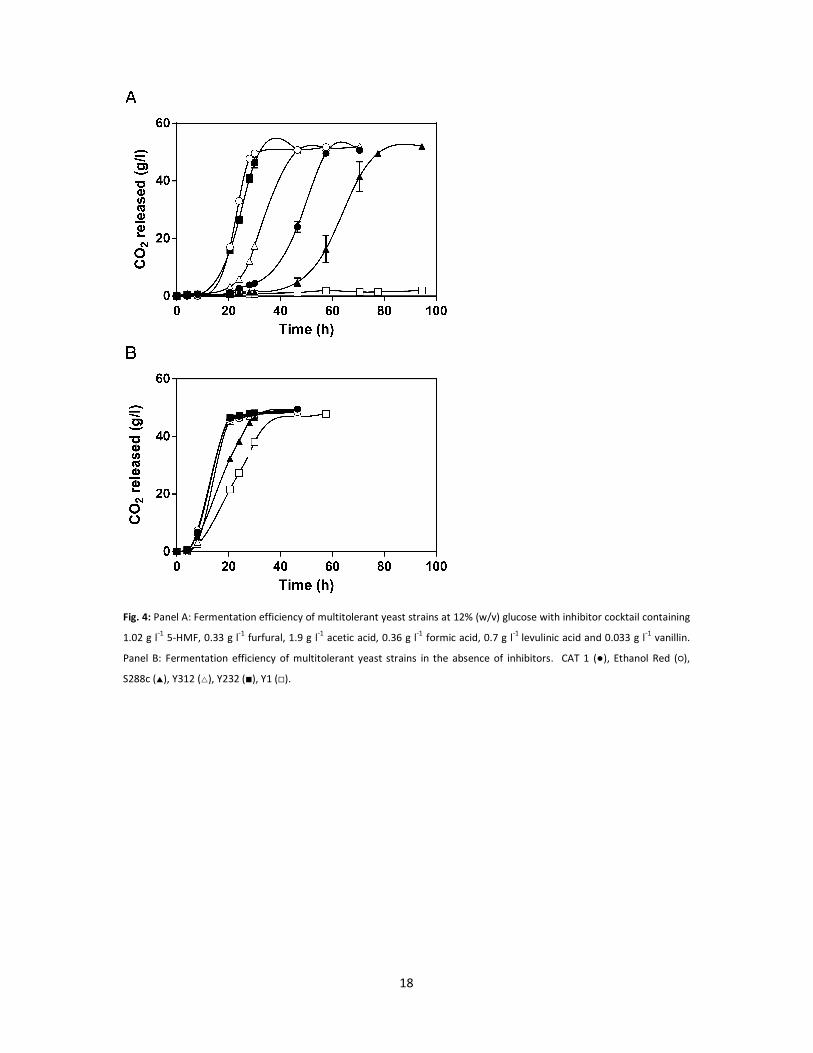
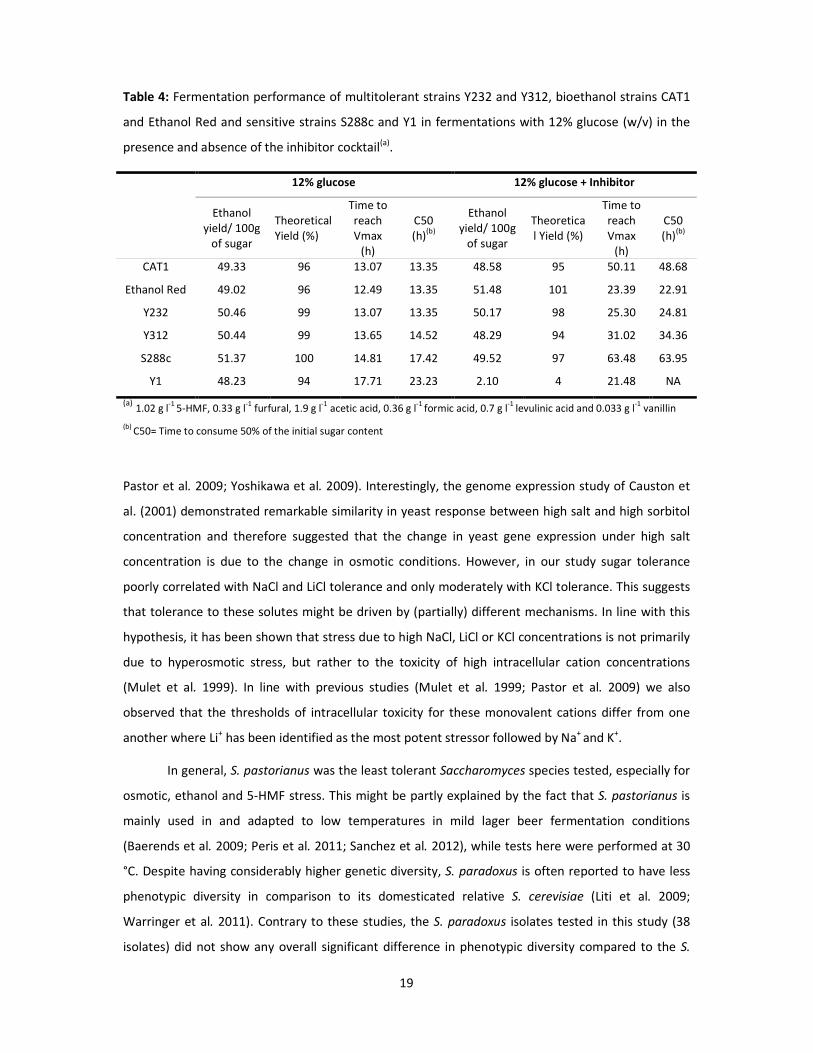
containing multiple inhibitors and 12% glucose (w/v) (Fig. 4A). In these conditions, the industrial
bioethanol strain CAT1 needed nearly 47 h to consume 50% of the sugars, while Ethanol Red and
Y232 were significantly faster (23 h and 25 h, respectively). Strain Y312 was also significantly faster
than CAT1, but slower than Ethanol Red and Y232. The HPLC analysis after completion of the
fermentation indicated that the ethanol yield was nearly 100% of the theoretical yield for all four
strains (Table 4). No significant differences were found between these strains in terms of
fermentation performance in 12% glucose without inhibitors (Fig. 4B).
Discussion
In this study, a broad collection of genetically diverse Saccharomyces yeasts, belonging to
four different species (namely S. cerevisiae, S. paradoxus, S. pastorianus, and S. bayanus) and
originating from different industrial and natural habitats, was phenotyped on six selective traits
relevant for bioethanol production, including osmotic, thermal, ethanol, salt, heavy metal and 5-HMF
stress. Our results demonstrate a remarkably large phenotypic diversity among different
Saccharomyces species and among S. cerevisiae isolates from different origins, extending the results
of Kvitek et al. (2008), Skelly et al. (2013), and Warringer et al. (2011).
Hyperosmotic stress tolerance of S. cerevisiae and the molecular basis behind it has been
investigated extensively. In hyperosmostress tolerance studies, Saccharomyces yeasts have been
generally subjected to hypertonic growth conditions using glucose or sorbitol as the solute (Tokuoka
1993; Tedrick et al. 2004; Dudley et al. 2005; Watanabe et al. 2010). Additionally, in a few cases,
osmostress tolerance has also been evaluated using NaCl or KCl as the solute (Babazadeh et al. 2013;
18
Fig. 4: Panel A: Fermentation efficiency of multitolerant yeast strains at 12% (w/v) glucose with inhibitor cocktail containing
1.02 g l-1 5-HMF, 0.33 g l-1 furfural, 1.9 g l-1 acetic acid, 0.36 g l-1 formic acid, 0.7 g l-1 levulinic acid and 0.033 g l-1 vanillin.
Panel B: Fermentation efficiency of multitolerant yeast strains in the absence of inhibitors. CAT 1 (●), Ethanol Red (○),
S288c (�), Y312 (�), Y232 (�), Y1 (�).
19
Table 4: Fermentation performance of multitolerant strains Y232 and Y312, bioethanol strains CAT1
and Ethanol Red and sensitive strains S288c and Y1 in fermentations with 12% glucose (w/v) in the
presence and absence of the inhibitor cocktail(a).
12% glucose 12% glucose + Inhibitor
Ethanol yield/ 100g
of sugar
Theoretical Yield (%)
Time to reach Vmax
(h)
C50 (h)(b)
Ethanol yield/ 100g
of sugar
Theoretical Yield (%)
Time to reach Vmax
(h)
C50 (h)(b)
CAT1 49.33 96 13.07 13.35 48.58 95 50.11 48.68
Ethanol Red 49.02 96 12.49 13.35 51.48 101 23.39 22.91
Y232 50.46 99 13.07 13.35 50.17 98 25.30 24.81
Y312 50.44 99 13.65 14.52 48.29 94 31.02 34.36
S288c 51.37 100 14.81 17.42 49.52 97 63.48 63.95
Y1 48.23 94 17.71 23.23 2.10 4 21.48 NA
(a) 1.02 g l-1
5-HMF, 0.33 g l-1
furfural, 1.9 g l-1
acetic acid, 0.36 g l-1
formic acid, 0.7 g l-1
levulinic acid and 0.033 g l-1
vanillin (b)
C50= Time to consume 50% of the initial sugar content
Pastor et al. 2009; Yoshikawa et al. 2009). Interestingly, the genome expression study of Causton et
al. (2001) demonstrated remarkable similarity in yeast response between high salt and high sorbitol
concentration and therefore suggested that the change in yeast gene expression under high salt
concentration is due to the change in osmotic conditions. However, in our study sugar tolerance
poorly correlated with NaCl and LiCl tolerance and only moderately with KCl tolerance. This suggests
that tolerance to these solutes might be driven by (partially) different mechanisms. In line with this
hypothesis, it has been shown that stress due to high NaCl, LiCl or KCl concentrations is not primarily
due to hyperosmotic stress, but rather to the toxicity of high intracellular cation concentrations
(Mulet et al. 1999). In line with previous studies (Mulet et al. 1999; Pastor et al. 2009) we also
observed that the thresholds of intracellular toxicity for these monovalent cations differ from one
another where Li+ has been identified as the most potent stressor followed by Na+ and K+.
In general, S. pastorianus was the least tolerant Saccharomyces species tested, especially for
osmotic, ethanol and 5-HMF stress. This might be partly explained by the fact that S. pastorianus is
mainly used in and adapted to low temperatures in mild lager beer fermentation conditions
(Baerends et al. 2009; Peris et al. 2011; Sanchez et al. 2012), while tests here were performed at 30
°C. Despite having considerably higher genetic diversity, S. paradoxus is often reported to have less
phenotypic diversity in comparison to its domesticated relative S. cerevisiae (Liti et al. 2009;
Warringer et al. 2011). Contrary to these studies, the S. paradoxus isolates tested in this study (38
isolates) did not show any overall significant difference in phenotypic diversity compared to the S.
20
cerevisiae isolates. Differences in the stressors evaluated, the evaluation method and the strain
collections studied might explain this discrepancy between the present study and the previous
studies. However, when we consider individual traits, we found that for some traits, S. paradoxus
isolates have significantly lower phenotypic diversity compared to S. cerevisiae isolates. However, it
has to be emphasized that in this study the S. cerevisiae isolates set was considerably larger than that
of S. paradoxus.
Both S. paradoxus and S. bayanus have been reported previously as less tolerant to ethanol
(Arroyo-López et al. 2010) and less thermotolerant (Gonçalves et al. 2011) compared to S. cerevisiae.
In agreement with these findings, S. cerevisiae performed significantly better than S. paradoxus also
in this study. However, S. bayanus performed as well as S. cerevisiae in both ethanol and thermal
stress conditions. This might be explained by the fact that S. bayanus strains in this collection mainly
originated from wine fermentations (seven strains out of ten). This might introduce a bias for the
high temperature and especially the ethanol tolerance.
Within the domesticated S. cerevisiae isolates, our results showed that ale strains showed
significantly higher phenotypic diversity than isolates from other origins (except sake). This may be
explained by the pervasive poly- and aneuploidy of ale beer strains (Legras et al. 2007; Querol and
Bond 2009), that may confer phenotypic plasticity under different environmental conditions (Comai
2005). The phenotypic diversity of sake strains was as wide as that of ale strains (p=0.374). This is
caused by the fact that the sake strains investigated are mostly either sensitive or very tolerant to
the different environmental conditions assayed in this study, which is in line with the findings of
Kvitek et al. (2008).
Within the set of S. cerevisiae isolates, phenotypic variability among the non-domesticated S.
cerevisiae isolates was found to be more or less similar to that of the domesticated S. cerevisiae.
Interestingly, S. cerevisiae strains from wine and bioethanol production as well as the wild isolates
investigated, generally showed considerable tolerance to most of the traits (Fig. 3). On the contrary,
ale beer strains appeared to be the least tolerant to the conditions tested. Moreover, the
performances of wild S. cerevisiae isolates were often equally good or sometimes even significantly
better compared to the isolates from domesticated origins (wine, sake, bakery, spirit and ale). This
suggests that domestication events specific for these origins did not contribute any improvements
over these traits during the course of centuries-long evolution. This agrees with the hypothesis that
domestication events do not greatly influence the phenotypic diversity among the S. cerevisiae
population (Liti et al. 2009). Treu et al. (2014) also suggested that domestication events are not
always crucial as they showed that many wild vineyard isolates own appropriate phenotypic
characteristics for wine fermentation. As an exception, results showed that 73% of wine isolates
21
were tolerant to 0.1 mM of Cu. Kvitek et al. (2008) suggested that Cu tolerance might have evolved in
wine isolates through positive selection as copper is traditionally used in the vineyards and orchards
as antimicrobial agent. Warringer et al. (2011) demonstrated a strong association of the sake lineage
with a copy number variation of the copper binding metallothionein CUP1 gene, which could explain
the high Cu tolerance of sake strains, a result confirmed in this study. Interestingly, also baker’s
yeasts were found to be exceptionally tolerant to copper. Since these strains are traditionally not
associated with high copper stress, this peculiar phenotype might be explained by the historical
origin of baker’s yeast. It was recently proposed that most modern baker’s yeast strains result from
an allotetroploidization event between an ale and a wine yeast (Randez-Gilet al. 2013). Therefore,
genetic inheritance of the wine strain’s high copper tolerance could explain this phenotype.
In addition to this phenotypic variability analysis this dataset allows selection of multitolerant
strains suited for bioethanol production. Not surprisingly currently used bioethanol strains were in
general considerably tolerant to multiple stress factors (osmotolerance, ethanol tolerance,
thermotolerance, 5-HMF tolerance). However, we also identified multitolerant isolates from other
origins that sometimes even outperformed the bioethanol strains for certain traits. Therefore, we
hypothesized that these multitolerant strains coming from other origins might have great potential
for commercial bioethanol production. In order to validate this hypothesis two proof-of-principle
fermentation experiments were conducted. The first experiment at 33% glucose indicated that in
terms of ethanol yield, all the tested multitolerant strains performed nearly as well as industrial
strain CAT1. However, Ethanol Red outcompeted all other strains and was clearly superior in
conditions mimicking first-generation bioethanol production. Nevertheless, in a second fermentation
mimicking the harsh conditions in lignocellulose hydrolysates by addition of fermentation inhibitors,
the strain Y232 (originating from wine) showed to be as efficient as Ethanol Red and better than
CAT1. The wild strain Y312 also outperformed CAT1.
Together, this large-scale and high-throughput phenotypic analysis yielded a multi-purpose
database, providing novel insights in general inter- and intra-species phenotypic diversity of
Saccharomyces yeasts. Additionally, it provides a basis for new insights into the relationships
between tolerance to different stressors. Our results also illustrate the potential of phenotypically
evaluating the natural biodiversity of yeasts to find superior industrial strains that may be used in
bioethanol production. In addition, it may provide excellent candidates for further strain
improvement through genetic engineering, experimental evolution, or breeding.
22
References
Abramoff MD, Magalhães, PJ, Ram, SJ (2004) Image processing with ImageJ. Biophotonics Intern
11:36-42
Almeida JR, Runquist D, Sànchez Nogué V, Lidén G, Gorwa-Grauslund MF (2011) Stress-related
challenges in pentose fermentation to ethanol by the yeast Saccharomyces cerevisiae. Biotechnol J
6:286-299 doi:10.1002/biot.201000301
Almeida JRM, Modig T, Petersson A, Hahn-Hägerdal B, Lidén G, Gorwa-Grauslund MF (2007)
Increased tolerance and conversion of inhibitors in lignocellulosic hydrolysates by Saccharomyces
cerevisiae. J Chem Technol Biotechnol 82:340-349 doi:10.1002/jctb.1676
Arroyo-López FN, Salvado Z, Tronchoni J, Guillamón JM, Barrio E, Querol A (2010) Susceptibility and
resistance to ethanol in Saccharomyces strains isolated from wild and fermentative environments.
Yeast 27:1005-1015 doi:10.1002/yea.1809
Babazadeh R, Adiels CB, Smedh M, Petelenz-Kurdziel E, Goksör M, Hohmann S (2013) Osmostress-
induced cell volume loss delays yeast Hog1 signaling by limiting diffusion processes and by Hog1-
specific effects. PLoS ONE 8:e80901 doi:10.1371/journal.pone.0080901
Baerends RJ, Qiu JL, Rasmussen S, Nielsen HB, Brandt A (2009) Impaired uptake and/or utilization of
leucine by Saccharomyces cerevisiae is suppressed by the SPT15-300 allele of the TATA-binding
protein gene. Appl Environ Microbiol 75:6055-6061 doi:10.1128/AEM.00989-09
Basso LC, de Amorim HV, de Oliveira AJ, Lopes ML (2008) Yeast selection for fuel ethanol production
in Brazil. FEMS Yeast Res 8:1155-1163 doi:10.1111/j.1567-1364.2008.00428.x
Basso LC, Basso TO, Rocha SN (2011) Ethanol production in Brazil: the industrial process and its
impact on yeast fermentation. In: dos Santos Bernardes MA (ed) Biofuel production-Recent
developments and prospects. InTech, Rijeka, Croatia, doi: 10.5772/17047
Bokulich NA, Thorngate JH, Richardson PM, Mills DA (2014) Microbial biogeography of wine grapes is
conditioned by cultivar, vintage, and climate. Proc Natl Acad Sci USA 111:E139-148
doi:10.1073/pnas.1317377110
Causton HC, Ren B, Koh SS, Harbison CT, Kanin E, Jennings EG, Lee TI, True HL, Lander ES, Young RA
(2001) Remodeling of yeast genome expression in response to environmental changes. Mol Biol Cell
12:323-337 doi:10.1091/mbc.12.2.323
23
Chen X, Shekiro J, Franden MA, Wang W, Zhang M, Kuhn E, Johnson DK, Tucker MP (2012) The
impacts of deacetylation prior to dilute acid pretreatment on the bioethanol process. Biotechnol
Biofuels 5:8 doi:10.1186/1754-6834-5-8
Comai L (2005) The advantages and disadvantages of being polyploidy. Nat Rev Genet 6:836-846
doi:10.1038/nrg1711
Conant GC, Wolfe KH (2007) Increased glycolytic flux as an outcome of whole-genome duplication in
yeast. Mol Syst Biol 3:129 doi:10.1038/msb4100170
da Silva-Filho EA, Brito dos Santos SK, Resende Ado M, de Morais JO, de Morais MA Jr, Ardaillon
Simões D (2005) Yeast population dynamics of industrial fuel-ethanol fermentation process assessed
by PCR-fingerprinting. Antonie van Leeuwenhoek 88:13-23 doi:10.1007/s10482-004-7283-8
Demeke MM, Dietz H, Li Y, Foulquié-Moreno MR, Mutturi S, Deprez S, Abt TD, Bonini BM, Lidén G,
Dumortier F, Verplaetse A, Boles E, Thevelein JM (2013) Development of a D-xylose fermenting and
inhibitor tolerant industrial Saccharomyces cerevisiae strain with high performance in lignocellulose
hydrolysates using metabolic and evolutionary engineering. Biotechnol Biofuels
6:89doi:10.1186/1754-6834-6-89
Diezmann S, Dietrich FS (2009) Saccharomyces cerevisiae: population divergence and resistance to
oxidative stress in clinical, domesticated and wild strains. PLoS ONE 4:e5317
doi:10.1371/journal.pone.0005317
Dittmar JC, Reid RJ, Rothstein R (2010) ScreenMill: a freely available software suite for growth
measurement, analysis and visualization of high-throughput screen data. BMC Bioinfo 11:353
doi:10.1186/1471-2105-11-353
Dudley AM, Janse DM, Tanay A, Shamir R, Church GM (2005) A global view of pleiotropy and
phenotypically derived gene function in yeast. Mol Syst Biol 1:2005.0001 doi:10.1038/msb4100004
Fay JC, Benavides JA (2005) Evidence for domesticated and wild populations of Saccharomyces
cerevisiae. PLoS Genet 1:66-71 doi:10.1371/journal.pgen.0010005
Garcia Sanchez R, Solodovnikova N, Wendland J (2012) Breeding of lager yeast with Saccharomyces
cerevisiae improves stress resistance and fermentation performance. Yeast 29:343-355
doi:10.1002/yea.2914
Goddard MR (2008) Quantifying the complexities of Saccharomyces cerevisiae's ecosystem
engineering via fermentation. Ecology 89:2077-2082 doi:10.1890/07-2060.1
24
Gonçalves P, Valerio E, Correia C, de Almeida JM, Sampaio JP (2011) Evidence for divergent evolution
of growth temperature preference in sympatric Saccharomyces species. PLoS ONE 6:e20739
doi:10.1371/journal.pone.0020739
Hubmann G, Mathe L, Foulquié-Moreno MR, Duitama J, Nevoigt E, Thevelein JM (2013) Identification
of multiple interacting alleles conferring low glycerol and high ethanol yield in Saccharomyces
cerevisiae ethanolic fermentation. Biotechnol Biofuels 6:87 doi:10.1186/1754-6834-6-87
Hyma KE, Saerens SM, Verstrepen KJ, Fay JC (2011) Divergence in wine characteristics produced by
wild and domesticated strains of Saccharomyces cerevisiae. FEMS Yeast Res 11:540-551
doi:10.1111/j.1567-1364.2011.00746.x
Jin M, Sarks C, Gunawan C, Bice BD, Simonett SP, Narasimhan RA, Willis LB, Dale BE, Balan V, Sato TK
(2013) Phenotypic selection of a wild Saccharomyces cerevisiae strain for simultaneous
saccharification and co-fermentation of AFEXTM pretreated corn stover. Biotechnol Biofuels
6:108doi:10.1186/1754-6834-6-108
Kane SM, Roth R (1974) Carbohydrate metabolism during ascospore development in yeast. J
Bacteriol 118:8-14
Koppram R, Albers E, Olsson L (2012) Evolutionary engineering strategies to enhance tolerance of
xylose utilizing recombinant yeast to inhibitors derived from spruce biomass. Biotechnol Biofuels
5:32 doi:10.1186/1754-6834-5-32
Kumar S, Dheeran P, Singh SP, Mishra IM, Adhikari DK (2013) Cooling system economy in ethanol
production using thermotolerant yeast Kluyveromyces Sp. IIPE453. Am J Microbiol Res 1:39-44
doi:10.12691/ajmr-1-3-1
Kumari R, Pramanik K (2012) Improvement of multiple stress tolerance in yeast strain by sequential
mutagenesis for enhanced bioethanol production. J Biosci Bioeng 114:622-629
doi:10.1016/j.jbiosc.2012.07.007
Kurtzman CP, Robnett CJ (1997) Identification of clinically important ascomycetous yeasts based on
nucleotide divergence in the 5' end of the large-subunit (26S) ribosomal DNA gene. J Clin Microbiol
35:1216-1223
Kvitek DJ, Will JL, Gasch AP (2008) Variations in stress sensitivity and genomic expression in diverse S.
cerevisiae strains. PLoS Genet 4:e1000223 doi:10.1371/journal.pgen.1000223
Legras JL, Karst F (2003) Optimisation of interdelta analysis for Saccharomyces cerevisiae strain
characterisation. FEMS Microbiol Lett 221:249-255 doi:10.1016/s0378-1097(03)00205-2
25
Legras JL, Merdinoglu D, Cornuet JM, Karst F (2007) Bread, beer and wine: Saccharomyces cerevisiae
diversity reflects human history. Mol Ecol 16:2091-2102 doi:10.1111/j.1365-294X.2007.03266.x
Liti G, Carter DM, Moses AM, Warringer J, Parts L, James SA, Davey RP, Roberts IN, Burt A,
Koufopanou V, Tsai IJ, Bergman CM, Bensasson D, O’Kelly MJT, van Oudenaarden A, Barton DBH,
Bailes E, Ba ANN, Jones M, Quail MA, Goodhead I, Sims S, Smith F, Blomberg A, Durbin R, Louis EJ
(2009) Population genomics of domestic and wild yeasts. Nature 458:337-341
doi:10.1038/nature07743
Meersman E, Steensels J, Mathawan M, Wittocx PJ, Saels V, Struyf N, Bernaert H, Vrancken G,
Verstrepen KJ (2013) Detailed analysis of the microbial population in Malaysian spontaneous cocoa
pulp fermentations reveals a core and variable microbiota. PLoS ONE 8:e81559
doi:10.1371/journal.pone.0081559
Mortimer RK, Johnston JR (1986) Genealogy of principal strains of the yeast genetic stock center.
Genetics 113:35-43
Mulet JM, Leube MP, Kron SJ, Rios G, Fink GR, Serrano R (1999) A novel mechanism of ion
homeostasis and salt tolerance in yeast: the Hal4 and Hal5 protein kinases modulate the Trk1-Trk2
potassium transporter. Mol Cell Biol 19:3328-3337
Novo M, Bigey F, Beyne E, Galeote V, Gavory F, Mallet S, Cambon B, Legras JL, Wincker P, Casaregola
S, Dequin S (2009) Eukaryote-to-eukaryote gene transfer events revealed by the genome sequence of
the wine yeast Saccharomyces cerevisiae EC1118. Proc Natl Acad Sci USA 106:16333-16338
doi:10.1073/pnas.0904673106
Pais TM, Foulquié-Moreno MR, Hubmann G, Duitama J, Swinnen S, Goovaerts A, Yang Y, Dumortier F,
Thevelein JM (2013) Comparative polygenic analysis of maximal ethanol accumulation capacity and
tolerance to high ethanol levels of cell proliferation in yeast. PLoS Genet 9:e1003548
doi:10.1371/journal.pgen.1003548
Palmqvist E, Hahn-Hägerdal B (2000) Fermentation of lignocellulosic hydrolysates. II: inhibitors and
mechanisms of inhibition. Bioresour Technol 74:25-33 doi:http://dx.doi.org/10.1016/S0960-
8524(99)00161-3
Pando Bedriñana R, Querol Simón A, Suárez Valles B (2010) Genetic and phenotypic diversity of
autochthonous cider yeasts in a cellar from Asturias. Food Microbiol 27:503-508
doi:10.1016/j.fm.2009.11.018
Pastor MM, Proft M, Pascual-Ahuir A (2009) Mitochondrial function is an inducible determinant of
osmotic stress adaptation in yeast. J Biol Chem 284:30307-30317 doi:10.1074/jbc.M109.050682
26
Pereira FB, Romani A, Ruiz HA, Teixeira JA, Domingues L (2014) Industrial robust yeast strains with
great potential for fermentation of lignocellulosic biomass. Bioresour Technol 161 192-199;
10.1016/j.biortech.2014.03.043
Peris D, Belloch C, Lopandić K, Álvarez-Pérez JM, Querol A, Barrio E (2011) The molecular
characterization of new types of Saccharomyces cerevisiae x S. kudriavzevii hybrid yeasts unveils a
high genetic diversity. Yeast doi:10.1002/yea.2891
Pinel D, D'Aoust F, del Cardayre SB, Bajwa PK, Lee H, Martin VJ (2011) Saccharomyces cerevisiae
genome shuffling through recursive population mating leads to improved tolerance to spent sulfite
liquor. Appl Environ Microbiol 77:4736-4743 doi:10.1128/AEM.02769-10
Piškur J, Rozpędowska E, Polakova S, Merico A, Compagno C (2006) How did Saccharomyces evolve
to become a good brewer? Trends Genet 22:183-186 doi:10.1016/j.tig.2006.02.002
Pretorius IS (2000) Tailoring wine yeast for the new millennium: novel approaches to the ancient art
of winemaking. Yeast 16:675-729 doi:10.1002/1097-0061(20000615)16:8<675::aid-yea585>3.0.co;2-
b
Puligundla P, Smogrovicova D, Obulam VSR, Ko S (2011) Very high gravity (VHG) ethanolic brewing
and fermentation: a research update. J Ind Microbiol Biotechnol 38:1133-1144 doi:10.1007/s10295-
011-0999-3
Querol A, Bond U (2009) The complex and dynamic genomes of industrial yeasts. FEMS Microbiol Lett
293:1-10 doi:10.1111/j.1574-6968.2008.01480.x
R Core Team (2013) R: A language and environment for statistical computing. R Foundation for
Statistical Computing, Vienna, Austria. ISBN 3-900051-07-0 http://www.R-project.org/ 15/03/2014
Ramos CL, Duarte WF, Freire AL, Dias DR, Eleutherio ECA, Schwan RF (2013) Evaluation of stress
tolerance and fermentative behavior of indigenous Saccharomyces cerevisiae. Braz J Microbiol
44:935-944.
Randez-Gil F, Córcoles-Sáez I, Prieto JA (2013) Genetic and phenotypic characteristics of baker's
yeast: relevance to baking. Annu Rev Food Sci Technol 4:191-214 doi:10.1146/annurev-food-030212-
182609
Shi DJ, Wang CL, Wang KM (2009) Genome shuffling to improve thermotolerance, ethanol tolerance
and ethanol productivity of Saccharomyces cerevisiae. J Ind Microbiol Biotechnol 36:139-147
doi:10.1007/s10295-008-0481-z
27
Skelly DA, Merrihew GE, Riffle M, Connelly CF, Kerr EO, Johansson M, Jaschob D, Graczyk B, Shulman
NJ, Wakefield J, Cooper SJ, Fields S, Noble WS, Muller EGD, Davis TN, Dunham MJ, MacCoss MJ, Akey
JM (2013) Integrative phenomics reveals insight into the structure of phenotypic diversity in budding
yeast. Genome Res 23:1496-1504 doi:10.1101/gr.155762.113
Steensels J, Snoek T, Meersman E, Nicolino MP, Voordeckers K, Verstrepen KJ (2014) Improving
industrial yeast strains: exploiting natural and artificial diversity. FEMS Microbiol Rev
doi:10.1111/1574-6976.12073
Steensels J, Verstrepen KJ (2014) Taming wild yeast: potential of conventional and nonconventional
yeasts in industrial fermentations. Annu rev microbiol doi:10.1146/annurev-micro-091213-113025
Swinnen S, Schaerlaekens K, Pais T, Claesen J, Hubmann G, Yang Y, Demeke M, Foulquié-Moreno MR,
Goovaerts A, Souvereyns K, Clement L, Dumortier F, Thevelein JM (2012) Identification of novel
causative genes determining the complex trait of high ethanol tolerance in yeast using pooled-
segregant whole-genome sequence analysis. Genome Res 22:975-984 doi:10.1101/gr.131698.111
Tao X, Zheng D, Liu T, Wang P, Zhao W, Zhu M, Jiang X, Zhao Y, Wu X (2012) A novel strategy to
construct yeast Saccharomyces cerevisiae strains for very high gravity fermentation. PLoS ONE
7:e31235 doi:10.1371/journal.pone.0031235
Taylor MP, Mulako I, Tuffin M, Cowan D (2012) Understanding physiological responses to pre-
treatment inhibitors in ethanologenic fermentations. Biotechnol J 7:1169-1181
doi:10.1002/biot.201100335
Tedrick K, Trischuk T, Lehner R, Eitzen G (2004) Enhanced membrane fusion in sterol-enriched
vacuoles bypasses the Vrp1p requirement. Mol Biol Cell 15:4609-4621 doi:10.1091/mbc.E04-03-0194
Thomson JM, Gaucher EA, Burgan MF, De Kee DW, Li T, Aris JP, Benner SA (2005) Resurrecting
ancestral alcohol dehydrogenases from yeast. Nat Genet 37:630-635 doi:10.1038/ng1553
Tokuoka K (1993) Sugar- and salt-tolerant yeasts. J Appl Bacteriol 74:101-110 doi:10.1111/j.1365-
2672.1993.tb03002.x
Treu L, Toniolo C, Nadai C, Sardu A, Giacomini A, Corich V, Campanaro S (2014) The impact of
genomic variability on gene expression in environmental Saccharomyces cerevisiae strains. Environ
Microbiol 16:1378-1397 doi:10.1111/1462-2920.12327
Verstrepen KJ, Derdelinckx G, Verachtert H, Delvaux FR (2003) Yeast flocculation: what brewers
should know. Appl Microbiol Biotechnol 61:197-205 doi:10.1007/s00253-002-1200-8
Voordeckers K, Brown CA, Vanneste K, van der Zande E, Voet A, Maere S, Verstrepen KJ (2012)
Reconstruction of ancestral metabolic enzymes reveals molecular mechanisms underlying
28
evolutionary innovation through gene duplication. PLoS Biol 10:e1001446
doi:10.1371/journal.pbio.1001446
Warringer J, Zorgo E, Cubillos FA, Zia A, Gjuvsland A, Simpson JT, Forsmark A, Durbin R, Omholt SW,
Louis EJ, Liti G, Moses A, Blomberg A (2011) Trait variation in yeast is defined by population history.
PLoS Genet 7:e1002111 doi:10.1371/journal.pgen.1002111
Watanabe T, Srichuwong S, Arakane M, Tamiya S, Yoshinaga M, Watanabe I, Yamamoto M, Ando A,
Tokuyasu K, Nakamura T (2010) Selection of stress-tolerant yeasts for simultaneous saccharification
and fermentation (SSF) of very high gravity (VHG) potato mash to ethanol. Bioresour Technol
101:9710-9714 doi:10.1016/j.biortech.2010.07.079
Wimalasena TT, Greetham D, Marvin ME, Liti G, Chandelia Y, Hart A, Louis EJ, Phister TG, Tucker GA,
Smart KA (2014) Phenotypic characterisation of Saccharomyces spp. yeast for tolerance to stresses
encountered during fermentation of lignocellulosic residues to produce bioethanol. Microb Cell Fact
13:47 doi:10.1186/1475-2859-13-47
Yoshikawa K, Tanaka T, Furusawa C, Nagahisa K, Hirasawa T, Shimizu H (2009) Comprehensive
phenotypic analysis for identification of genes affecting growth under ethanol stress in
Saccharomyces cerevisiae. FEMS Yeast Res 9:32-44 doi:10.1111/j.1567-1364.2008.00456.x