Embed Size (px)
Citation preview
PHASE I – TASK 1B REPORT
PolyMet Financial Capabilities
FINANCIAL ASSURANCE REVIEW AND EVALUATION FOR THE NORTHMET MINING PROJECT
Prepared for the Minnesota Department of Natural Resources
November 2, 2016
Cover Image
Photo of NorthMet Mining facility, Hibbing, MN.
Document Component Specs
Text: Staples • multipurpose paper, 24 lb. text – 50% post-consumer fibers, FSC Certified.
Back Cover: Neenah Paper • Esse • Texture, Sapphire • 100 lb. cover • 30% post-consumer fibers, Green Seal® Certified
Wire Binding: Manufactured using recycled high carbon steel

CONTENTS
CAUTIONARY NOTE................................................................................................................................................ 1
EXECUTIVE SUMMARY ........................................................................................................................................... 2
INTRODUCTION ..................................................................................................................................................... 4
1. WHAT ARE FINANCIAL ASSURANCES? ........................................................................................................... 5
2. POLYMET STRUCTURE AND ASSETS............................................................................................................... 6
2.1. Assets ..............................................................................................................................................................7
2.2. Liabilities..........................................................................................................................................................8
2.3. Shareholders’ Equity .......................................................................................................................................9
3. NORTHMET ECONOMIC SENSITIVITY........................................................................................................... 11
3.1. Metal Grade and Reserves ............................................................................................................................11
3.2. Proposed Production Schedule .....................................................................................................................12
3.3. NorthMet Economic Viability ........................................................................................................................13
3.4. Historic Metal Prices .....................................................................................................................................18
3.5. Economic Evaluation .....................................................................................................................................21
4. FINANCIAL RISKS ......................................................................................................................................... 22
4.1. Surety Evaluation ..........................................................................................................................................24

LIST OF TABLES
Table 1. Poly Met Mining Inc. and PolyMet Mining Corp. Contact Information .......................................... 6
Table 2. PolyMet !ssets in 1,000’s of US$ by Fiscal Year End Date.............................................................. 7
Table 3. PolyMet Liabilities in $1,000’s of US$ by Fiscal Year End Date ....................................................... 8
Table 4. PolyMet Shareholders’ Equity in $1,000’s of US$ by Fiscal Year End Date...................................10
Table 5. PolyMet Capital Structure as of January 31, 2016 ........................................................................10
Table 6. Metal grade and reserves of the NorthMet Project (AGP December 2007).................................11
Table 7. NorthMet Capital Costs in million US$.........................................................................................14
Table 8. NorthMet Key Economic Highlights .............................................................................................15
Table 9. Insurance company financial strength ratings by agency .............................................................25
LIST OF FIGURES
Figure 1. Poly Met Mining Inc. Share Price History (2001 – May 2016) ....................................................... 9
Figure 2. NorthMet Proposed Production Schedule of Ore and Waste in Million tons per year (Mtpy; NI 43-101) ........................................................................................................................................12
Figure 3. Copper, Nickel and Cobalt Prices used for Various Valuations....................................................16
Figure 4. Palladium, Platinum and Gold Metal Prices Used for Various Valuations...................................16
Figure 5. Annual Revenue Forecast for Different Metal Price Scenarios (first 5 years) .............................17
Figure 6. Historic Copper Price in U.S. $/lb., 1992-2016 (Accessed May 2016 from BarChart.com) .........18
Figure 7. Historic Nickel Price in U.S. $/lb., 1989-2016 (Accessed May 2016 from InfoMine.com)...........18
Figure 8. Historic Cobalt Price in U.S. $/lb., 2005-2016 (Accessed May 2016 from InfoMine.com) ..........19
Figure 9. Historic Palladium Price in U.S. $/oz., 1992-2016 (Accessed May 2016 from BarChart.com) ....19
Figure 10. Historic Platinum Price in U.S. $/oz., 1992-2016 (Accessed May 2016 from BarChart.com) ....20
Figure 11 Historic Gold Price in U.S. $/oz., 1992-2016 (Accessed May 2016 from BarChart.com)............20
CAUTIONARY NOTE
The assumptions and analyses in this report were independently generated by Emmons and Olivier
Resources Inc. (EOR), Spectrum Engineering and Environmental LLC (Spectrum) and Jardine Lloyd
Thompson (JLT) for use by the State of Minnesota in its review of potential financial assurance
mechanisms and requirements for the proposed NorthMet project. This report was created solely
for government regulatory purposes related Ϫϥ ϪϞϛ SϪϗϪϛ ϥϜ MϟϤϤϛϩϥϪϗϩ ϟϣϦϢϛϣϛϤϪϗϪϟϥϤ ϥϜ ϪϞϛ
financial-assurance requirements of the Minnesota Mineland Reclamation Act, Minn. Stat. § 93.44
93.51, and the Nonferrous Metallic Mineral Mining Rules, Minn. R. ch. 6132. None of the statements
or analyses reported herein are made by or on behalf of PolyMet Mining Corp.
This report and the analyses contained herein were not generated by EOR, Spectrum, JLT, the State
of Minnesota, or PolyMet Mining Corp. in order to generate mineral resource or mineral reserve
estimates under any applicable securities laws.
This independent report is not a National Instrument 43-101 technical report. PolyMet Mining
CϥϨϦϩ NI Ͷω-101 technical report, last updated on January 14, 2013, is publicly available at:
https://www.sec.gov/Archives/edgar/data/866028/000106299313001723/exhibit99-1.htm.
PolyMet Financial Capabilities 1
EXECUTIVE SUMMARY
Financial assurances are a source of funds to be used by the Minnesota Department of Natural
Resources (DNR) Commissioner if the mining company permittee fails to perform:
A. Reclamation activities including closure and post-closure maintenance needed if operations
cease; and
B. Corrective action as required by the Commissioner if noncompliance with design and
operating criteria in the permit to mine occurs.
The purpose of this report is to assess the ability of Poly Met Mining Inc. (PolyMet) to provide the
required financial assurances and assess the financial risk to the State if PolyMet were unable to
perform the required work, thus forcing the State to assume the liability and perform the work.
PolyMet Mining Corp. is a junior Canadian mining company which owns 100 percent of Poly Met
Mining Inc. (PolyMet), a Minnesota corporation whose major asset is the future mining potential of
the NorthMet project. Glencore, an AngloSwiss multinational commodity trading and mining
company with headquarters in Baar, Switzerland, owns about 28% of PolyMet stock (as of May
2016) and holds sizeable loans to PolyMet. GϢϛϤϙϥϨϛ ϗϢϩϥ Ϟϗϩ ϭϗϨϨϗϤϪϩ Ϫϥ ϦϫϨϙϞϗϩϛ ϣϥϨϛ PϥϢϯϣϛϪϩ
shares within the next two years that, if exercised, would represent about 36% ϥϜ PϥϢϯMϛϪϩ ϩϪϥϙϡ
The annual average production rate of the NorthMet project is projected to be about 72 million
pounds of copper, 15 million pounds of nickel, 727 thousand pounds of cobalt, 75 thousand ounces
of palladium, 20.5 thousand ounces of platinum, and 9.5 thousand ounces of gold per year. The
value of that production will depend on metal prices. PϥϢϯMϛϪϩ ϜϟϤϗϤϙϟϗϢ strength depends to a
large degree on metal prices when the mine starts production and whether the mine opens during a
period of rising or falling prices.
Forecasts of annual revenue range from $259M to $441M. The review ϥϜ PϥϢϯMϛϪϩ engineering
financial feasibility studies that were undertaken at various stages of the project exploration
indicate that the NorthMet project is economic for most metal pricing and cost scenarios. The
economics also suggest that PolyMet should be able to obtain additional financing to develop the
NorthMet mine
PolyMet will continue to need outside financing to remain viable. PϥϢϯMϛϪϩ ϣϗϠϥϨ ϗϩϩϛϪ ϟϩ ϪϞϛ
capitalized mineral property, plant, and equipment (about $322M), which only has real value if all
mining permits are issued and the mine development is financed.
Therefore, a key consideration in evaluating the financial assurance funding risks would be to
determine the type and amount of financing that PolyMet can realistically obtain by itself (e.g.
surety bonds, cash, etc.). Due to numerous mine bond forfeitures that caused considerable losses to
the surety industry, it has now become more difficult for mining companies to obtain surety bonds.
For a small or new mining company like PolyMet it would be very difficult to obtain a reclamation
bond if there is any risk of bankruptcy which would be indicated if the financing or economics are
not solid. It would be even more difficult to find a surety willing to guarantee a long-term financial
ϗϩϩϫϨϗϤϙϛ ϢϟϗϘϟϢϟϪϯ ϫϤϢϛϩϩ ϪϞϛ ϦϨϥϠϛϙϪϩ ϛϙϥϤϥϣϟϙϩ ϗϨϛ ϬϛϨϯ ϩϪϨϥϤϝ
PolyMet Financial Capabilities 2
PϥϢϯMϛϪϩ potentially significant constraint in obtaining surety bonds indicates that, unless the
NorthMet project is sold to a major mining company, a financial partnership is formed, or any other
financial arrangement is made, only cash flow from the NorthMet operation would be available to
fund the financial assurance trust, pay off the debts, and generate dividends for the shareholders.
Therefore, another important issue for the State would be to fully understand how PolyMet
proposes to use cash flow to finance the assurance trust to the level required by the state, in the
context of its other obligations: finance mining activities, repay debt and distribute shareholder
dividends.
Ultimately, the State determines the total amount and timing to fund the trust. To inform this
decision and assess the risk of PolyMet not meeting its annual trust funding requirements, access to
an updated financial feasibility study and cash flow projections is paramount. To minimize the risk
to the State and the third party, the assurances should be converted into a funded trust or escrow
account within the first few years of operation.
If NorthMet project is not sold to a major mining company, a financial partnership is formed, or any
other financial arrangement is made, PolyMet may be tempted to obtain the surety bonds from less
stable sureties. If that is the case, the State should require that several sureties share the risk, and
that the sureties pass some financial health test. The surety must be licensed to do business in the
State of Minnesota. The surety should have a current A.M. Best Rating of A- or better, or a Standard
& Poorϩ ϟϤϩϫϨϛϨϩ ϜϟϤϗϤϙial strength rating of A or better. The surety should also be classified as a
Financial Size Category (FSC) of IX or greater.
To develop a more accurate assessment of the financial viability of the NortMet project, the
financial feasibility study should be updated to include legacy costs, financial assurances estimates,
reclamation costs, and long-term treatment and maintenance costs. This update should also include
costs for activities identified in the Final EIS and not included in the latest financial feasibility study
(e.g. stabilization of the tailings embankments), and any conditions
As part of the financial assurance and permit application review, PolyMet should be required to
provide the State with an updated financial feasibility study and revised cash flow projections using
a reasonable range of metal price assumptions. The State needs to review this information in order
to form an opinion regarding PϥϢϯMϛϪϩ cash flow capacity and to assess how the rate of financial
assurance funding would affect the NorthMetϩ project economics. This is critical to determine the
risk of PolyMet not meeting their financial assurance funding obligations.
PolyMet Financial Capabilities 3
INTRODUCTION
The Minnesota Department of Natural Resources (DNR) is responsible for reviewing the Permit to
Mine application for the Poly Met Mining Inc. (PolyMet) NorthMet project, including assessing the
projects ability to meet all Permit to Mine requirements. The purpose of the Permit to Mine is to
mitigate the possible adverse environmental effects of mining by ensuring orderly construction and
development of a mine, sound operational practices, progressive reclamation of mined areas, and
long-term protection of the environment. Financial assurance is required to provide adequate
funding that the DNR could access in the event that a company abandons a project, fails to properly
maintain or reclaim the site, or fails to correct noncompliance.
The purpose of tϞϟϩ ϨϛϦϥϨϪ ϟϩ Ϫϥ ϗϩϩϛϩϩ PϥϢϯMϛϪϩ ability to provide the financial assurances required
for the NorthMet Permit to Mine. The report also assesses the financial risk to the State if PolyMet
were unable to fund the required reclamation, long-term water treatment activities and other
corrective actions that would be required as part of the NorthMet Permit to Mine application
review. In that case, the State would be forced to assume the liability of completing all these tasks.
The first section describes what financial assurances are and why they are needed for mining
permits. The second section summarizes the corporate structure and financial assets of PolyMet.
The third section summarizes the revenue potential of the NorthMet project based on the metal
grade and reserves, proposed production schedule, metal prices, and economic analysis. The fourth
section evaluates the financial capability of PolyMet to meet the financial assurances required as
part of the Permit to Mine application review.
The authors reviewed publicly available information for this report. Much of the information was
available through standard filings required by the Canadian government. The review included
PϥϢϯMϛϪϩ ϙϥϨϦϥϨϗϪϛ ϩϪϨϫϙϪϫϨϛ ϗϤϚ ϗϩϩϛϪϩ ϣϛϪϗϢ ϨϛϩϛϨϬϛϩ ϟϤ ϪϞϛ NϥϨϪϞMϛϪ ϣϟϤϟϤϝ ϦϨϥϠϛϙϪ ϗϤd the
value of the NorthMet reserves given the history and trends of commodity prices. Technical and
engineering economic data are provided in the NorthMet Canadian National Instrument (NI) 43
101 report which follows a codified set of rules and guidelines that clearly describe the project and
its value. The reporting is overseen by the Canadian Securities Exchange and required by all mining
companies whose stock is traded on the Toronto Stock Exchange. The NorthMet NI 43-101 report
version reviewed was published October 2012 and updated in January 2013. The NorthMet NI 43
101 report and PolyMet audited financial statements are ϗϬϗϟϢϗϘϢϛ ϥϤ PϥϢϯMϛϪϩ ϭϛϘ ϩϟϪϛ and the
public sites SEDAR and EDGAR.
PolyMet Financial Capabilities 4
1. WHAT ARE FINANCIAL ASSURANCES?
Financial assurances are a source of funds to be used by the Minnesota Department of Natural
Resources (DNR) Commissioner if the mining company permittee fails to perform:
C. Reclamation activities including closure and post-closure maintenance needed if operations
cease; and
D. Corrective action as required by the Commissioner if noncompliance with design and
operating criteria in the permit to mine occurs.
Before a mining permit can be granted, Minnesota Administrative Rule 6132.1200, financial
assurance, requires the mining company to determine the cost to reclaim the mine and perform
post-closure maintenance if operations cease for any reason during the first calendar year of
operations. The cost estimate to reclaim the mine following a cease in operations must be updated
annually (as required by rule) by the mining company and submitted to the State. Therefore, DNR
must look many years ahead to anticipate the value of the financial assurance package needed to
perform the required reclamation activities or corrective actions during the entire course of mining
production. The mining company must provide satisfactory financial assurances to perform the
necessary reclamation activities and corrective actions that must meet the following criteria listed
in Minnesota Rule 6132.1200, subpart 5:
A. assurance of funds sufficient to cover the [reclamation and corrective action] costs
estimated under [Minnesota Rule 6132.1200] subparts 2 and 3;
B. assurance that the funds will be available and made payable to the commissioner when
needed;
C. assurance that the funds will be fully valid, binding, and enforceable under state and federal
law;
D. assurance that the funds will not be dischargeable through bankruptcy; and
E. all terms and conditions of the financial assurance must be approved by the DNR
Commissioner.
After mining begins, Minnesota Administrative Rules 6132.1200 and 6132.1300 require the mining
company to provide an annual report, including a contingency reclamation plan. The contingency
reclamation plan must include long-term operation and maintenance to be implemented if
operations cease during the upcoming year, and it must provide financial assurance to ensure that
there is a source of funds to perform the work if the State assumes the responsibility and must
contract a third party to perform the work.
These rules require that the financial assurance plans and costs be revised annually to reflect the
liability that will be incurred during the following year. However, the State recognizes that some
reclamation activities will require long-term operation and maintenance, so the financial
assurances plans and costs must recognize that the liabilities created in the following year will also
have costs that extend far into the future.
It is important to note that EPA has indicated they intend to promulgate financial assurance rules
for hard rock mining. This may affect financial assurance for this project in the future.
PolyMet Financial Capabilities 5
2. POLYMET STRUCTURE AND ASSETS
This section summarizes the corporate structure and financial assets of Poly Met Mining Inc.
(PolyMet). Financial assets were determined from the total assets, liabilities, and shareholder
equities of PolyMet based on the consolidated financial statements for two fiscal years: February 1,
2014 to January 31, 2016. Audited financial statements ϗϨϛ ϗϬϗϟϢϗϘϢϛ ϥϤ PϥϢϯMϛϪϩ ϭϛϘsite and the
public sites SEDAR and EDGAR.
PolyMet Mining Corp.1 is a junior Canadian mining company which owns 100 percent of PolyMet, a
Minnesota corporation (Table 1). Glencore, an AngloSwiss multinational commodity trading and
mining company with headquarters in Baar, Switzerland, owns about 28% of PolyMet stock (as of
May 2016) and holds sizeable debts against PolyMet.
Table 1. Poly Met Mining Inc. and PolyMet Mining Corp. Contact Information
Corporation Office Address
Poly Met Mining Inc. Operational Headquarters P.O. Box 475, 6500 County Road 666
Hoyt Lakes, Minnesota 55750
USA
Executive Office 444 Cedar Street, Suite 206 St. Paul, Minnesota 55101
USA
PolyMet Mining Corp. Corporate Office 100 King Street West, Suite 5700
Toronto, Ontario M5X 1C7
Canada
Records Office 700 West Georgia, 25th Floor
Vancouver, British Columbia V7Y 1B3
Canada
1 PolyMet website (http://www.polymetmining.com/investors/investor-faq/)
PolyMet Financial Capabilities 6
2.1. Assets
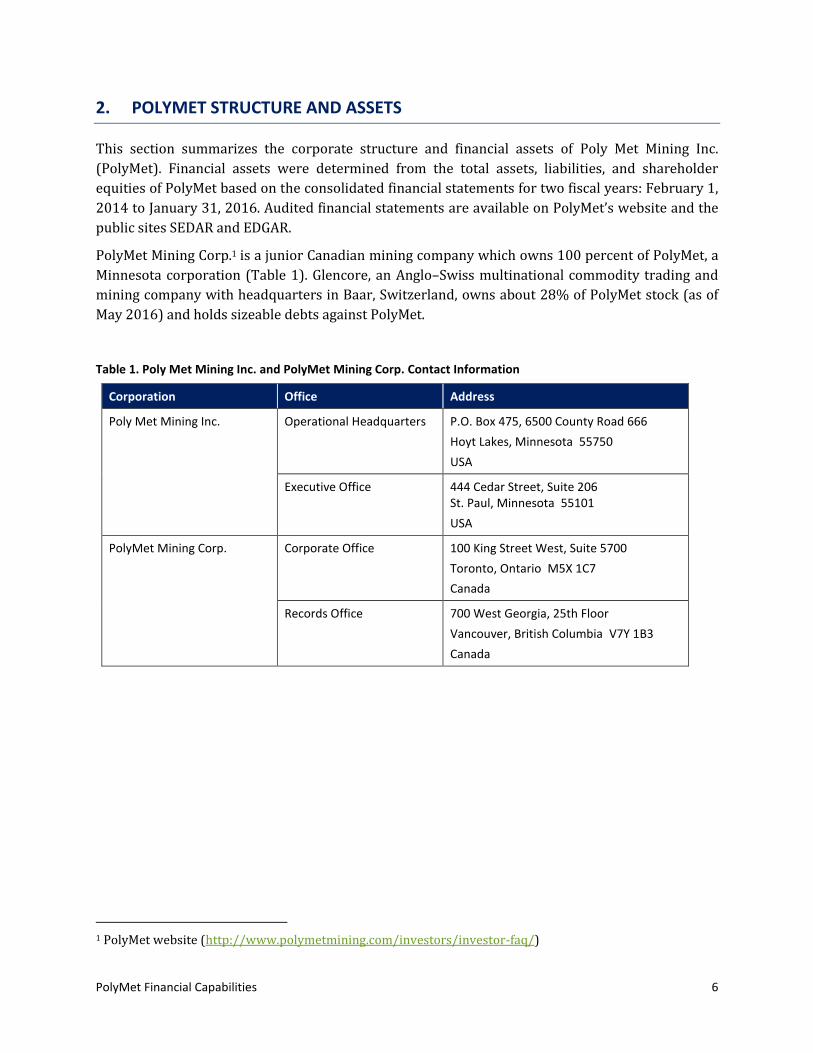
The total assets of PolyMet for the fiscal year ending on January 31, 2016 are $337.66M, comprised
of $11.97M in current and $325.69M in long-term assets (Table 2). The major asset is the
capitalized mineral property, plant, and equipment ($321.6M), which only has real value if all
mining permits are issued and the mine development is financed. If permits are not issued, there
would still be some small residual value associated to equipment that could be resold.
Table 2. PolyMet Assets in 1,000’s of US$ by Fiscal Year End Date
ASSETS Fiscal Year Ending:
Jan. 31, 2016 Jan. 31, 2015
Current
Cash
Amounts receivable
Prepaid expenses
$10,256
$429
$1,285
$9,301
$381
$1,108
Total Current $11,970 $10,790
Non-Current
Amounts receivable
Mineral Property, Plant and Equipment
Wetland Credit Intangible
$2,153
$321,649
$1,888
$0
$296,247
$6,192
Total Non-Current $325,690 $302,439
TOTAL $337,660 $313,229
Source: PolyMet January 2016 Audited Balance Sheet
PolyMet Financial Capabilities 7
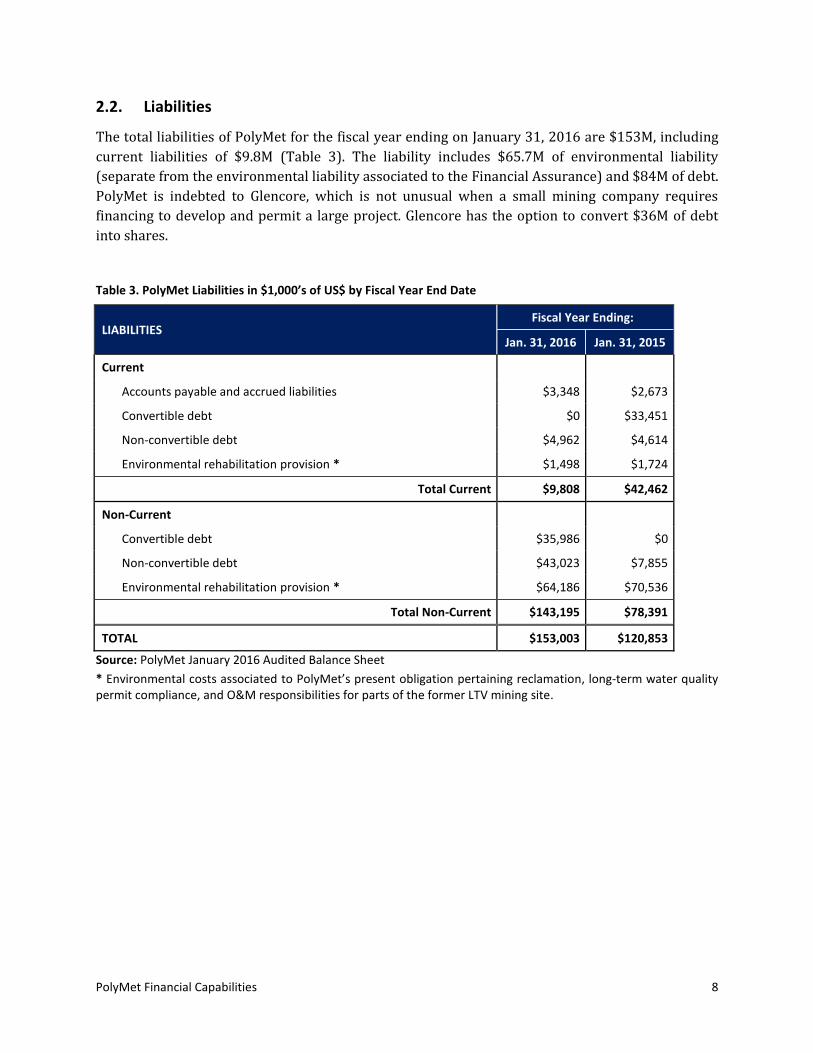
2.2. Liabilities
The total liabilities of PolyMet for the fiscal year ending on January 31, 2016 are $153M, including
current liabilities of $9.8M (Table 3). The liability includes $65.7M of environmental liability
(separate from the environmental liability associated to the Financial Assurance) and $84M of debt.
PolyMet is indebted to Glencore, which is not unusual when a small mining company requires
financing to develop and permit a large project. Glencore has the option to convert $36M of debt
into shares.
Table 3. PolyMet Liabilities in $1,000’s of US$ by Fiscal Year End Date
LIABILITIES Fiscal Year Ending:
Jan. 31, 2016 Jan. 31, 2015
Current
Accounts payable and accrued liabilities
Convertible debt
Non-convertible debt
Environmental rehabilitation provision *
$3,348
$0
$4,962
$1,498
$2,673
$33,451
$4,614
$1,724
Total Current $9,808 $42,462
Non-Current
Convertible debt
Non-convertible debt
Environmental rehabilitation provision *
$35,986
$43,023
$64,186
$0
$7,855
$70,536
Total Non-Current $143,195 $78,391
TOTAL $153,003 $120,853
Source: PolyMet January 2016 Audited Balance Sheet
* Environmental costs associated to PolyMet’s present obligation pertaining reclamation, long-term water quality permit compliance, and O&M responsibilities for parts of the former LTV mining site.
PolyMet Financial Capabilities 8
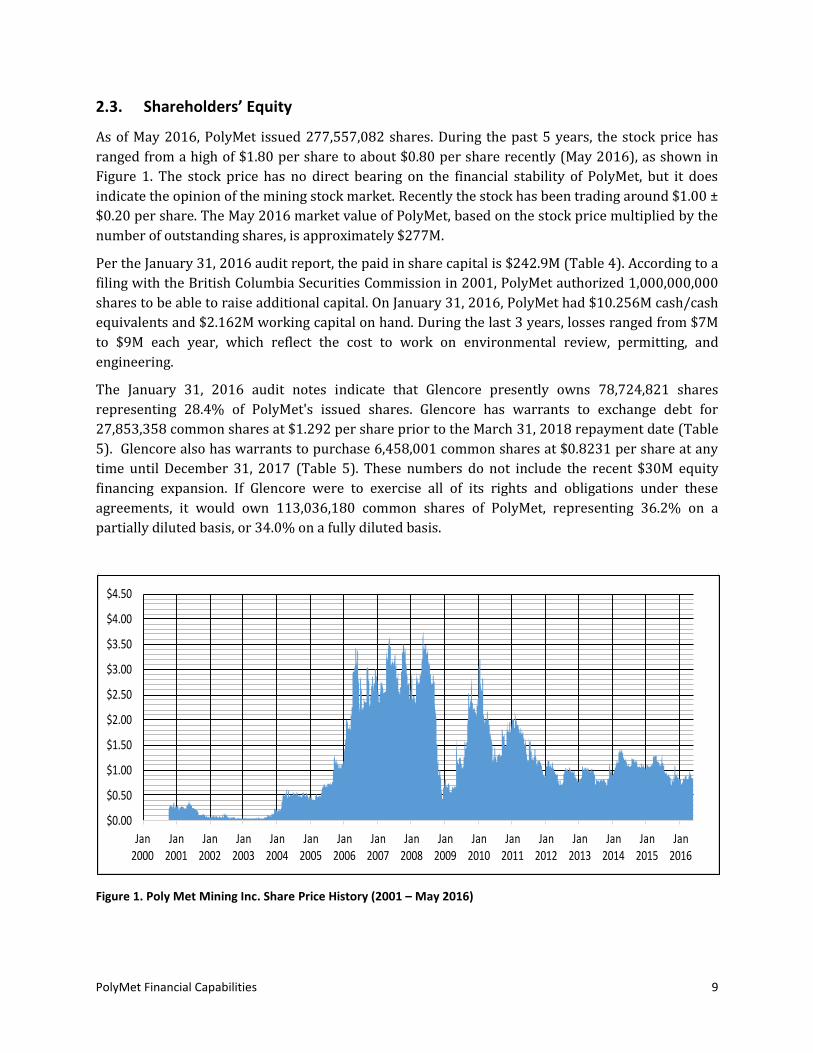
2.3. Shareholders’ Equity
As of May 2016, PolyMet issued 277,557,082 shares. During the past 5 years, the stock price has
ranged from a high of $1.80 per share to about $0.80 per share recently (May 2016), as shown in
Figure 1. The stock price has no direct bearing on the financial stability of PolyMet, but it does
indicate the opinion of the mining stock market. Recently the stock has been trading around $1.00 ±
$0.20 per share. The May 2016 market value of PolyMet, based on the stock price multiplied by the
number of outstanding shares, is approximately $277M.
Per the January 31, 2016 audit report, the paid in share capital is $242.9M (Table 4). According to a
filing with the British Columbia Securities Commission in 2001, PolyMet authorized 1,000,000,000
shares to be able to raise additional capital. On January 31, 2016, PolyMet had $10.256M cash/cash
equivalents and $2.162M working capital on hand. During the last 3 years, losses ranged from $7M
to $9M each year, which reflect the cost to work on environmental review, permitting, and
engineering.
The January 31, 2016 audit notes indicate that Glencore presently owns 78,724,821 shares
representing 28.4% of PolyMet's issued shares. Glencore has warrants to exchange debt for
27,853,358 common shares at $1.292 per share prior to the March 31, 2018 repayment date (Table
5). Glencore also has warrants to purchase 6,458,001 common shares at $0.8231 per share at any
time until December 31, 2017 (Table 5). These numbers do not include the recent $30M equity
financing expansion. If Glencore were to exercise all of its rights and obligations under these
agreements, it would own 113,036,180 common shares of PolyMet, representing 36.2% on a
partially diluted basis, or 34.0% on a fully diluted basis.
$0.00
$0.50
$1.00
$1.50
$2.00
$2.50
$3.00
$3.50
$4.00
$4.50
Jan2000
Jan2001
Jan2002
Jan2003
Jan2004
Jan2005
Jan2006
Jan2007
Jan2008
Jan2009
Jan2010
Jan2011
Jan2012
Jan2013
Jan2014
Jan2015
Jan2016
PolyMet Stock Price
Figure 1. Poly Met Mining Inc. Share Price History (2001 – May 2016)
PolyMet Financial Capabilities 9
’
-
-
Table 4. PolyMet Shareholders’ Equity in $1,000’s of US$ by Fiscal Year End Date
SHAREHOLDERS EQUITY Fiscal Year Ending:
Jan. 31, 2016 Jan. 31, 2015
Share Capital
Share Premium
Equity Reserves
Deficit
$242,917
$1,151
$53,759
$(113,170)
$241,489
$3,007
$51,704
$(103,824)
TOTAL $184,657 $192,376
Source: PolyMet January 2016 Audited Balance Sheet
Table 5. PolyMet Capital Structure as of January 31, 2016
Shares outstanding
Glencore convertible debt
Glencore Warrants
Other Warrants
Options
Other Rights
Fully Diluted
Glencore
Insiders
277.5 million
27.8 million ($36.0 million @ $1.2920 per share)
6.5 million @ $0.8231, expiring 12/2017, subject to mandatory exercise if the 20-day volume weighted average price ("VWAP") of PolyMet common shares is equal to or greater than 150% of the exercise price and PolyMet has received permits and construction finance is available ("Early Maturity Event"
0.5 million @ average $2.1678, expiring 6/2016
19.0 million @ average $1.29, expiring 2/2016 to 7/2024
0.7 million
332.0 million (including out-of-money options/warrants)
113.0 million (34.0% fully diluted)
19.4 million (5.8% fully diluted)
PolyMet Financial Capabilities 10
3. NORTHMET ECONOMIC SENSITIVITY
PϥϢϯMϛϪϩ NϥϨϪϞMϛϪ mining project is part of the northeastern Minnesota Duluth Complex, one of
ϪϞϛ ϭϥϨϢϚϩ ϢϗϨϝϛϩϪ ϡϤϥϭϤ ϫϤϚϛϬϛϢϥϦϛϚ ϚϛϦϥϩϟϪϩ ϥϜ ϙϥϦϦϛϨ ϤϟϙϡϛϢ ϗϤϚ ϥϪϞϛϨ ϦϨϛϙϟϥϫϩ ϣϛϪϗϢϩ If
permitted, the project would be the first in Minnesota to commercially extract nonferrous metals
from the Duluth Complex, thus potentially setting a precedent for the permitting and development
of nonferrous metal mine operations. The project is located near the community of Hoyt Lakes,
Minnesota, within an existing mining district with many operating and former iron (ferrous) mines
and processing facilities in the area.
The purpose of this section is to analyze the future revenue potential of the NorthMet project based
on the metal grade and reserves, the proposed production schedule, the capital needed to develop
the mine, and the sensitivity of revenue to fluctuating metal prices.
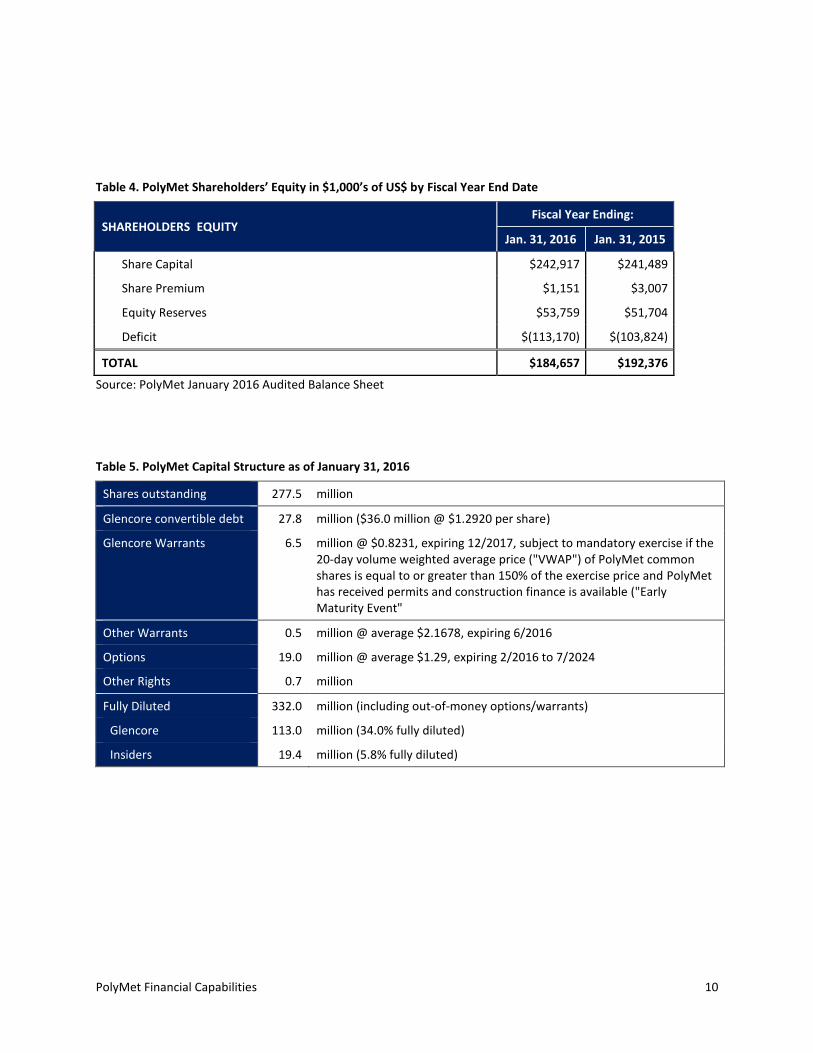
3.1. Metal Grade and Reserves
Metal grade and reserves were summarized for NorthMet based on the NI 43-101 Technical Report
on the NorthMet Deposit in Minnesota, USA prepared by AGP Mining Consultants and updated
January 2013 (Table 6).
Table 6. Metal grade and reserves of the NorthMet Project (AGP December 2007)
Metal Copper Nickel Sulfur Platinum Palladium Gold Cobalt Total
Grade (%) (%) (%) (ppb) (ppb) (ppb) (ppm) n/a
Measured 0.285 0.083 0.71 71 258 36 74 n/a
Indicated 0.256 0.075 0.69 66 231 34 70 n/a
Measured + Indicated 0.265 0.077 0.69 68 239 35 71 n/a
Inferred 0.273 0.079 0.65 73 263 37 56 n/a
Reserve (million
lbs.) (million
lbs.) (million
lbs.) (1,000
oz.) (1,000
oz.) (1,000
oz.) (million
lbs.)
(Million short
tons of ore)
Measured 1,154 337 2,879 418 1,526 214 30 202.5
Indicated 2,519 738 6,749 950 3,307 491 68 491.7
Measured + Indicated 3,673 1,075 9,628 1,369 4,833 704 98 694.2
Inferred 1,257 361 2,983 488 1,761 245 26 230
From the Updated NI 43-101 Technical Report on the NorthMet Deposit in Minnesota, USA, Tables 14-27 & 28: Resource above 0.00 ft. Comparison - Grade at US$7.42 NMV Cut-off, AGP December 2007. The Net Metal Value (NMV) formula used and described in Section 17.2.12 of the NI 43-101 report includes the gross metal price multiplied by the processing recovery minus refining, insurance and transportation charges.
PolyMet Financial Capabilities 11
3.2. Proposed Production Schedule
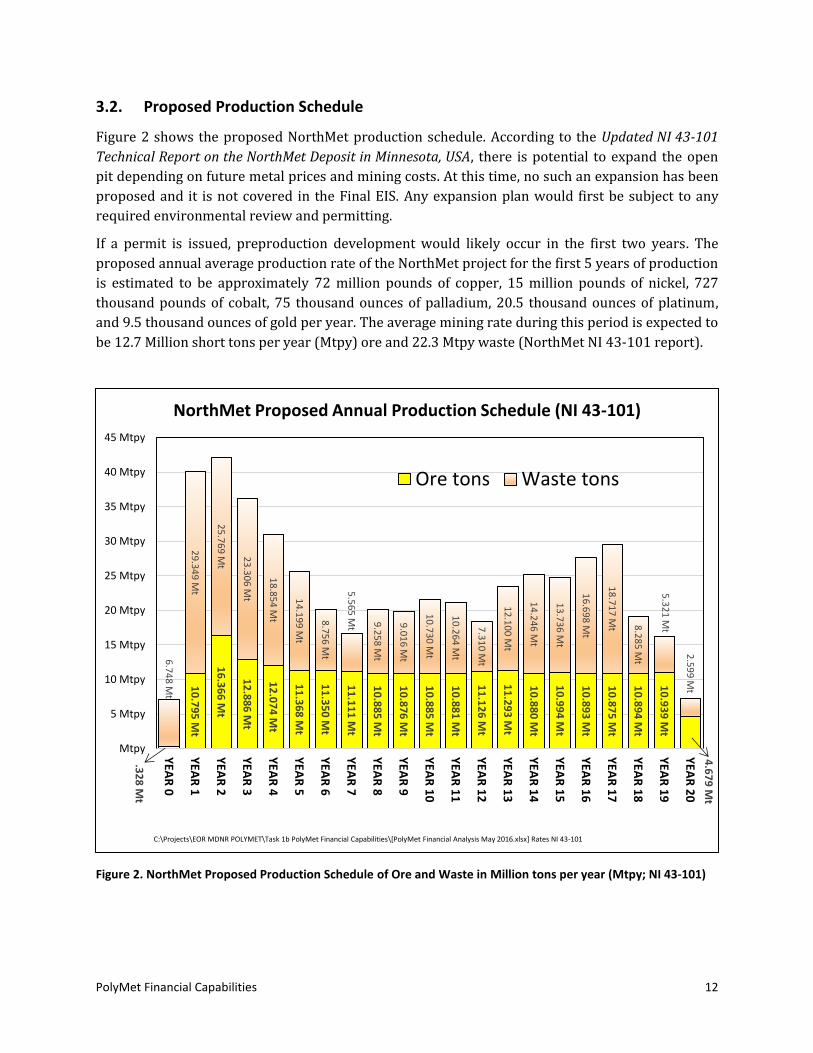
Figure 2 shows the proposed NorthMet production schedule. According to the Updated NI 43-101
Technical Report on the NorthMet Deposit in Minnesota, USA, there is potential to expand the open
pit depending on future metal prices and mining costs. At this time, no such an expansion has been
proposed and it is not covered in the Final EIS. Any expansion plan would first be subject to any
required environmental review and permitting.
If a permit is issued, preproduction development would likely occur in the first two years. The
proposed annual average production rate of the NorthMet project for the first 5 years of production
is estimated to be approximately 72 million pounds of copper, 15 million pounds of nickel, 727
thousand pounds of cobalt, 75 thousand ounces of palladium, 20.5 thousand ounces of platinum,
and 9.5 thousand ounces of gold per year. The average mining rate during this period is expected to
be 12.7 Million short tons per year (Mtpy) ore and 22.3 Mtpy waste (NorthMet NI 43-101 report).
.32
8 M
t
10
.79
5 M
t
16
.36
6 M
t
12
.88
6 M
t
12
.07
4 M
t
11
.36
8 M
t
11
.35
0 M
t
11
.11
1 M
t
10
.88
5 M
t
10
.87
6 M
t
10
.88
5 M
t
10
.88
1 M
t
11
.12
6 M
t
11
.29
3 M
t
10
.88
0 M
t
10
.99
4 M
t
10
.89
3 M
t
10
.87
5 M
t
10
.89
4 M
t
10
.93
9 M
t
4.6
79
Mt
6.7
48
Mt
29
.34
9 M
t
25
.76
9 M
t
23
.30
6 M
t
18
.85
4 M
t
14
.19
9 M
t
8.7
56
Mt
5.5
65
Mt
9.2
58
Mt
9.0
16
Mt
10
.73
0 M
t
10
.26
4 M
t
7.3
10
Mt
12
.10
0 M
t
14
.24
6 M
t
13
.73
6 M
t
16
.69
8 M
t
18
.71
7 M
t 8.2
85
Mt
5.3
21
Mt
2.5
99
Mt
Mtpy
5 Mtpy
10 Mtpy
15 Mtpy
20 Mtpy
25 Mtpy
30 Mtpy
35 Mtpy
40 Mtpy
45 Mtpy
YEA
R 0
YEA
R 1
YEA
R 2
YEA
R 3
YEA
R 4
YEA
R 5
YEA
R 6
YEA
R 7
YEA
R 8
YEA
R 9
YEA
R 1
0
YEA
R 1
1
YEA
R 1
2
YEA
R 1
3
YEA
R 1
4
YEA
R 1
5
YEA
R 1
6
YEA
R 1
7
YEA
R 1
8
YEA
R 1
9
YEA
R 2
0
NorthMet Proposed Annual Production Schedule (NI 43-101)
Ore tons Waste tons
C:\Projects\EOR MDNR POLYMET\Task 1b PolyMet Financial Capabilities\[PolyMet Financial Analysis May 2016.xlsx] Rates NI 43-101
Figure 2. NorthMet Proposed Production Schedule of Ore and Waste in Million tons per year (Mtpy; NI 43-101)
PolyMet Financial Capabilities 12
3.3. NorthMet Economic Viability
The economic viability of NorthMet is a function of the capital PolyMet needs to invest to place the
NorthMet mine into production (including financial assurance), the revenue (which depends on
metal prices), the mining and processing costs and recoveries, and the timing of the cash flows.
The Net Present Value (NPV), the Return on Investment (RI) rate, and the payback period, are
metrics used to assess the project viability and risk. For a large company with multiple investment
opportunities, these metrics are used to compare or rank different projects. For a company with a
single project such as PolyMet, these metrics will be used by investors, banks, and sureties to assess
the financial risk of lending money or guaranteeing the reclamation and other long term O&M
financial assurances. The State will want to review these metrics as part of the financial assurance
evaluation to determine the rate that the financial assurance trusts must be fully funded.
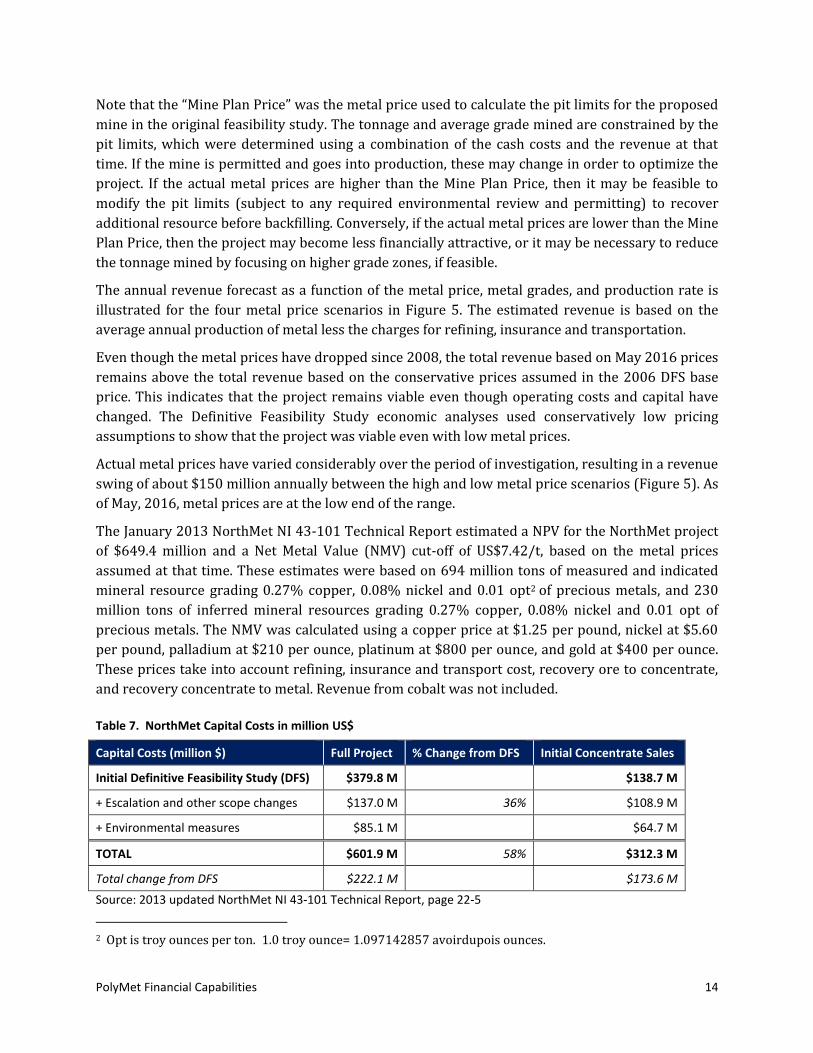
If the Permit to Mine is issued, an estimate of the amount of capital PolyMet will need to invest to
place the NorthMet mine into production is summarized in Table 7. Other key economic highlights
of NorthMet are summarized in Table 8. When these engineering cost estimates were being
prepared, legacy costs, financial assurances estimates, reclamation costs, long-term treatment and
maintenance costs, and other activities identified in the Final EIS, were not yet fully defined.
Therefore are not included in Table 7 or Table 8. These cost components should be revised and
included in an updated financial feasibility study.
The revenue potential of the NorthMet project is very sensitive to the prices of copper and nickel.
The metal prices have fluctuated substantially since the inception of this project, and have a
material effect on the projected NorthMet cash flow. Commodity charts of the historic price range of
the metals that PolyMet would produce are illustrated in Figure 6 through Figure 11. Copper and
nickel prices rose after 2006 but have recently fallen back to 2006 levels. Cobalt prices have
steadily dropped. Palladium, platinum and gold prices have incϨϛϗϩϛϚ ϘϫϪ ϗϨϛϤϪ ϣϗϠϥϨ ϨϛϬϛϤϫϛ
generators compared to nickel and copper.
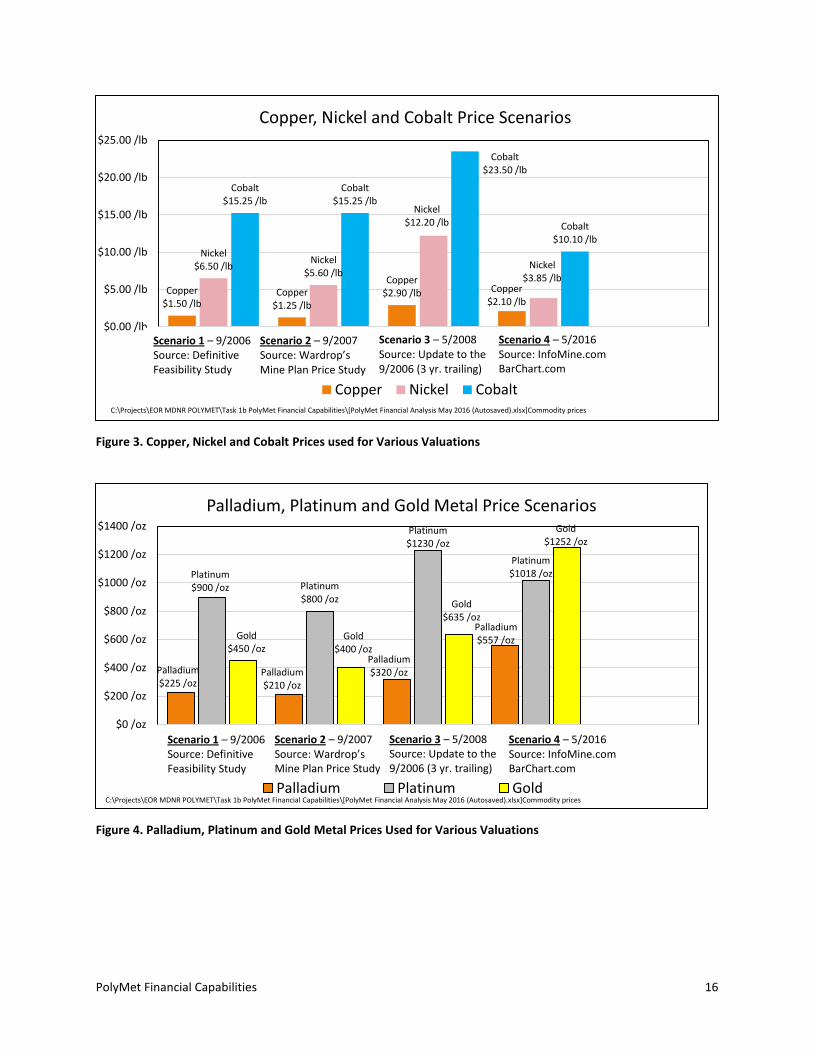
The value of the NorthMet project is very sensitive to metal price assumptions. Multiple metal price
scenarios are presented in this report to illustrate the sensitivity of NorthMet revenue to fluctuating
metal prices. The four scenarios are:
1) The September 2006 Definitive Feasibility Study (DFS) base price,
2) The September 2007 Wardrop original feasibility study Mine Plan Price,
3) The May 2008 update to the 2006 DFS price, and
4) May 2016 prices.
Both the September 2006 DFS ϗϤϚ ϪϞϛ ϥϦϛϤ ϦϟϪ ϣϟϤϟϤϝ ϢϟϣϟϪ MϟϤϛ PϢϗϤ PϨϟϙϛ ϗϩϩϫϣϛϚ
conservative (i.e. low) metal prices. The 2008 update to the 2006 DFS metal prices were based on
the most recent 3-year running average at the time of that study. These prices assume an annual
average production rate of 72 million pounds of copper, 15 million pounds of nickel, 727 thousand
pounds of cobalt, 75 thousand ounces of palladium, 20.5 thousand ounces of platinum, and 9.5
thousand ounces of gold per year. Figure 3 and Figure 4 illustrate the four metal price scenarios for
the expected annual average production rate of the NorthMet mine.
PolyMet Financial Capabilities 13
NϥϪϛ ϪϞϗϪ ϪϞϛ Mine Plan Price was the metal price used to calculate the pit limits for the proposed
mine in the original feasibility study. The tonnage and average grade mined are constrained by the
pit limits, which were determined using a combination of the cash costs and the revenue at that
time. If the mine is permitted and goes into production, these may change in order to optimize the
project. If the actual metal prices are higher than the Mine Plan Price, then it may be feasible to
modify the pit limits (subject to any required environmental review and permitting) to recover
additional resource before backfilling. Conversely, if the actual metal prices are lower than the Mine
Plan Price, then the project may become less financially attractive, or it may be necessary to reduce
the tonnage mined by focusing on higher grade zones, if feasible.
The annual revenue forecast as a function of the metal price, metal grades, and production rate is
illustrated for the four metal price scenarios in Figure 5. The estimated revenue is based on the
average annual production of metal less the charges for refining, insurance and transportation.
Even though the metal prices have dropped since 2008, the total revenue based on May 2016 prices
remains above the total revenue based on the conservative prices assumed in the 2006 DFS base
price. This indicates that the project remains viable even though operating costs and capital have
changed. The Definitive Feasibility Study economic analyses used conservatively low pricing
assumptions to show that the project was viable even with low metal prices.
Actual metal prices have varied considerably over the period of investigation, resulting in a revenue
swing of about $150 million annually between the high and low metal price scenarios (Figure 5). As
of May, 2016, metal prices are at the low end of the range.
The January 2013 NorthMet NI 43-101 Technical Report estimated a NPV for the NorthMet project
of $649.4 million and a Net Metal Value (NMV) cut-off of US$7.42/t, based on the metal prices
assumed at that time. These estimates were based on 694 million tons of measured and indicated
mineral resource grading 0.27% copper, 0.08% nickel and 0.01 opt2 of precious metals, and 230
million tons of inferred mineral resources grading 0.27% copper, 0.08% nickel and 0.01 opt of
precious metals. The NMV was calculated using a copper price at $1.25 per pound, nickel at $5.60
per pound, palladium at $210 per ounce, platinum at $800 per ounce, and gold at $400 per ounce.
These prices take into account refining, insurance and transport cost, recovery ore to concentrate,
and recovery concentrate to metal. Revenue from cobalt was not included.
Table 7. NorthMet Capital Costs in million US$
Capital Costs (million $) Full Project % Change from DFS Initial Concentrate Sales
Initial Definitive Feasibility Study (DFS) $379.8 M $138.7 M
+ Escalation and other scope changes $137.0 M 36% $108.9 M
+ Environmental measures $85.1 M $64.7 M
TOTAL $601.9 M 58% $312.3 M
Total change from DFS $222.1 M $173.6 M
Source: 2013 updated NorthMet NI 43-101 Technical Report, page 22-5
2 Opt is troy ounces per ton. 1.0 troy ounce= 1.097142857 avoirdupois ounces.
PolyMet Financial Capabilities 14
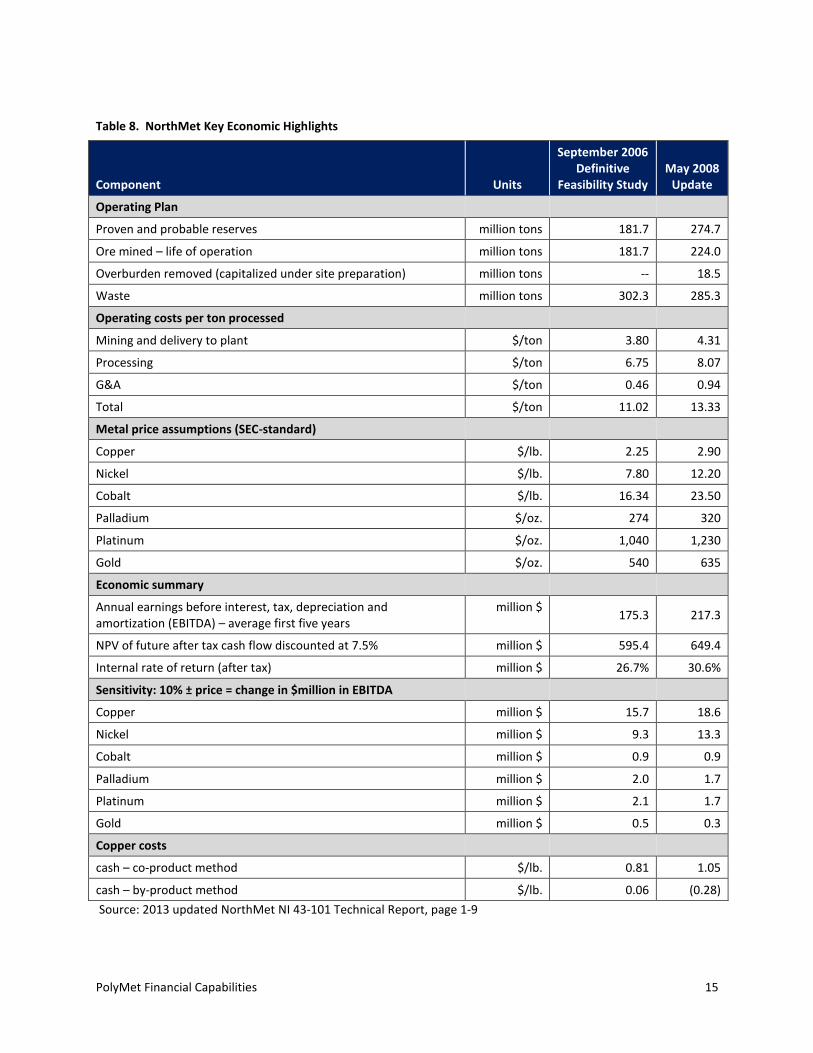
Table 8. NorthMet Key Economic Highlights
Component Units
September 2006 Definitive
Feasibility Study May 2008
Update
Operating Plan
Proven and probable reserves million tons 181.7 274.7
Ore mined – life of operation million tons 181.7 224.0
Overburden removed (capitalized under site preparation) million tons -- 18.5
Waste million tons 302.3 285.3
Operating costs per ton processed
Mining and delivery to plant $/ton 3.80 4.31
Processing $/ton 6.75 8.07
G&A $/ton 0.46 0.94
Total $/ton 11.02 13.33
Metal price assumptions (SEC-standard)
Copper $/lb. 2.25 2.90
Nickel $/lb. 7.80 12.20
Cobalt $/lb. 16.34 23.50
Palladium $/oz. 274 320
Platinum $/oz. 1,040 1,230
Gold $/oz. 540 635
Economic summary
Annual earnings before interest, tax, depreciation and amortization (EBITDA) – average first five years
million $ 175.3 217.3
NPV of future after tax cash flow discounted at 7.5% million $ 595.4 649.4
Internal rate of return (after tax) million $ 26.7% 30.6%
Sensitivity: 10% ± price = change in $million in EBITDA
Copper million $ 15.7 18.6
Nickel million $ 9.3 13.3
Cobalt million $ 0.9 0.9
Palladium million $ 2.0 1.7
Platinum million $ 2.1 1.7
Gold million $ 0.5 0.3
Copper costs
cash – co-product method $/lb. 0.81 1.05
cash – by-product method $/lb. 0.06 (0.28)
Source: 2013 updated NorthMet NI 43-101 Technical Report, page 1-9
PolyMet Financial Capabilities 15
$0.00 /lb
DFSBase Price
Mine Plan price DFS Update 20083 year trailing
May 2016 Price
DFSBase Price
Mine Plan price DFS Update 20083 year trailing
May 2016 Price
Figure 3. Copper, Nickel and Cobalt Prices used for Various Valuations
Copper $1.50 /lb
Copper $1.25 /lb
Copper $2.90 /lb Copper
$2.10 /lb
Nickel $6.50 /lb
Nickel $5.60 /lb
Nickel $12.20 /lb
Nickel $3.85 /lb
Cobalt $15.25 /lb
Cobalt $15.25 /lb
Cobalt $23.50 /lb
Cobalt $10.10 /lb
$5.00 /lb
$10.00 /lb
$15.00 /lb
$20.00 /lb
Copper Nickel Cobalt C:\Projects\EOR MDNR POLYMET\Task 1b PolyMet Financial Capabilities\[PolyMet Financial Analysis May 2016 (Autosaved).xlsx]Commodity prices
Scenario 1 – 9/2006 Source: Definitive Feasibility Study
Scenario 2 – 9/2007 Source: Wardrop’s Mine Plan Price Study
Scenario 3 – 5/2008 Source: Update to the 9/2006 (3 yr. trailing)
Scenario 4 – 5/2016 Source: InfoMine.com BarChart.com
Copper, Nickel and Cobalt Price Scenarios $25.00 /lb
Palladium, Platinum and Gold Metal Price Scenarios $1400 /oz Gold Platinum
$1230 /oz $1252 /oz $1200 /oz
Platinum
Platinum $1018 /oz $1000 /oz $900 /oz Platinum
$800 /oz Gold $800 /oz
$635 /oz Palladium
Gold Gold $600 /oz $557 /oz $450 /oz $400 /oz
Palladium $400 /oz Palladium Palladium $320 /oz
$225 /oz $210 /oz $200 /oz
$0 /oz
Scenario 1 – 9/2006 Scenario 2 – 9/2007 Scenario 3 – 5/2008 Scenario 4 – 5/2016 Source: Definitive Source: Wardrop’s Source: Update to the Source: InfoMine.com Feasibility Study Mine Plan Price Study 9/2006 (3 yr. trailing) BarChart.com
Palladium Platinum Gold C:\Projects\EOR MDNR POLYMET\Task 1b PolyMet Financial Capabilities\[PolyMet Financial Analysis May 2016 (Autosaved).xlsx]Commodity prices
Figure 4. Palladium, Platinum and Gold Metal Prices Used for Various Valuations
PolyMet Financial Capabilities 16

DFSBase PriceRevenue
DFS Update 20083 year trailing
Revenue
May 2016 Revenue
Copper, $108.1 M
Copper, $209.0 M
Copper, $151.3 M
Nickel, $100.1 M
Nickel, $166.3 M
Nickel, $37.7 M
Cobalt, $11.1 M
Cobalt, $12.6 M
Cobalt, $2.9 M
Palladium, $17.0 M
Palladium, $22.8 M
Palladium, $40.7 M
Platinum, $18.5 M
Platinum, $24.9 M
Platinum, $20.6 M
Gold, $4.3 M
Gold, $6.0 M
Gold, $11.9 M
$.0 M
$50.0 M
$100.0 M
$150.0 M
$200.0 M
$250.0 M
$300.0 M
$350.0 M
$400.0 M
$450.0 M
$500.0 M
Annual Revenue Forecast for Different Metal Price Scenarios
Copper Nickel Cobalt Palladium Platinum Gold
C:\Projects\EOR MDNR POLYMET\Task 1b PolyMet Financial Capabilities\[PolyMet Financial Analysis May 2016 (Autosaved) (Recovered)
$259.1 M $265.1 M
$441.7 M
Scenario 1 – 9/2006 Source: Definitive Feasibility Study
Scenario 3 – 5/2008 Source: Update to the 9/2006 (3 yr. trailing)
Scenario 4 – 5/2016 Source: InfoMine.com BarChart.com
Figure 5. Annual Revenue Forecast for Different Metal Price Scenarios (first 5 years)
Source: January, 2013 Updated NI 43-101 Technical Report on the NorthMet Project by AGP Mining Consultants. Note: Assumes an annual average production rate of 72M lbs. of copper, 15M lbs. of nickel, 727 thousand lbs. of cobalt, 75 thousand oz. of palladium, 20.5 thousand oz. of platinum, and 9.5 thousand oz. of gold.
PolyMet Financial Capabilities 17

3.4. Historic Metal Prices
Commodity charts for the historic price range of the metals that PolyMet would produce are
illustrated in Figure 6 through Figure 11 below.
Figure 6. Historic Copper Price in U.S. $/lb., 1992-2016 (Accessed May 2016 from BarChart.com)
Figure 7. Historic Nickel Price in U.S. $/lb., 1989-2016 (Accessed May 2016 from InfoMine.com)
PolyMet Financial Capabilities 18
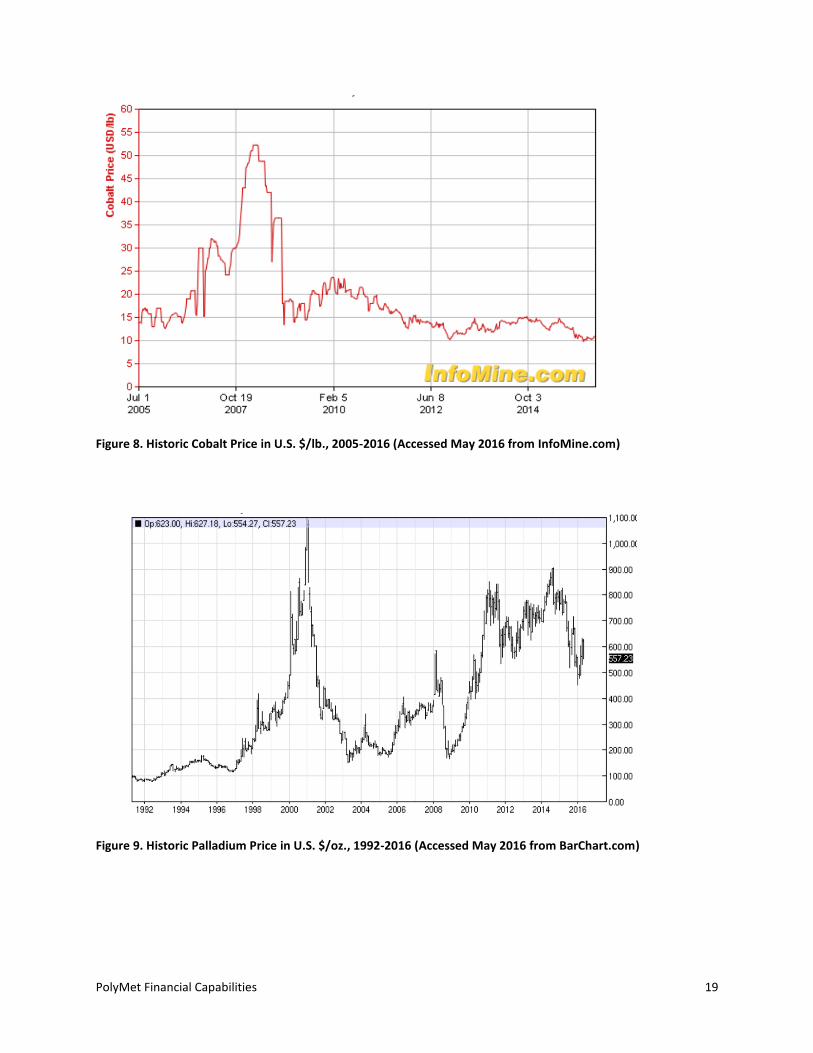
Figure 8. Historic Cobalt Price in U.S. $/lb., 2005-2016 (Accessed May 2016 from InfoMine.com)
Figure 9. Historic Palladium Price in U.S. $/oz., 1992-2016 (Accessed May 2016 from BarChart.com)
PolyMet Financial Capabilities 19

Figure 10. Historic Platinum Price in U.S. $/oz., 1992-2016 (Accessed May 2016 from BarChart.com)
Figure 11 Historic Gold Price in U.S. $/oz., 1992-2016 (Accessed May 2016 from BarChart.com)
PolyMet Financial Capabilities 20
3.5. Economic Evaluation
PolyMet Mining Corp. is a small Canadian mining company whose major asset is the NorthMet
copper-nickel precious metals project that is being developed by its wholly owned subsidiary, Poly
Met Mining, Inc. (PolyMet).
Engineering feasibility studies were undertaken by PolyMet at various stages of the NorthMet
project exploration (listed in the 2013 NorthMet NI 43-101 report). All of the studies concluded
that the project is economically feasible given the cost and revenue assumptions at the time.
The financial documents indicate that the exploration, environmental review, permitting, and
engineering of the NorthMet project are currently being funded by issuing equity and borrowing
money from Glencore, a major mining and commodity trading company headquartered in
Switzerland. The documents also indicate that PolyMet will require additional funding (debt, equity
or acquisition) in order to construct the mine, the waste rock facilities, the tailings impoundment,
the mill, and to obtain financial assurances for the Permit to Mine. The economics suggest that
PolyMet should be able to obtain additional financing to develop the NorthMet mine.
Information on costs associated with the existing tailings basin and the former LTV Mining
Company legacy impacts were not available at the time of this report. The financial feasibility study
should be updated to include legacy costs, financial assurances estimates, reclamation costs, and
long-term treatment and maintenance costs. This update should also include costs for activities
identified in the Final EIS and not included in the latest financial feasibility study (e.g. stabilization
of the tailings embankments), and any other conditions.
Previous engineering estimates available in the public domain place the NPV of NorthMet in the
$500M to $650M range, but all the cash flow details and assumptions supporting these numbers
were not found and may not be part of public filings.
Cash flow projections and sources and uses of capital must also be refined to include the latest
revisions to the operating plan, current revenue/cost projections, and financial assurances.
PolyMet Financial Capabilities 21
4. FINANCIAL RISKS
Key risks to the capability of Poly Met Mining Inc. (PolyMet) to provide financial assurances for the
NorthMet project are:
The amount of capital investment needed,
The type and cost of financing that can be obtained,
The sensitivity of annual revenue to metal prices,
The costs to reclaim the mine and manage the long-term water treatment and O&M
The ability of PolyMet to obtain surety bonds, and
The timing of the anticipated future cash flows.
The ultimate objective for the State regarding financial assurance is to determine the total amount
of funds and the financing sequence required from PolyMet to provide adequate environmental
protection in the event that PolyMet abandons a project, fails to properly maintain or reclaim the
site, or fails to correct noncompliance.
To that end, it is important to assess PolyMetϩ cash flow capacity to finance the assurance trust, to
the level required by the state, in the context of its other obligations: finance mining activities,
repay debt and distribute shareholder dividends. Ultimately, the State determines the total amount
and timing to fund the trust. To inform this decision and assess the risk of PolyMet not meeting its
annual trust funding requirements, access to an updated financial feasibility study and cash flow
projections is paramount
As part of the financial assurance and permit application review, PolyMet should be required to
provide the State with an updated financial feasibility study and revised cash flow projections using
a reasonable range of metal price assumptions.
PϥϢϯMϛϪ ϭϟϢϢ ϙϥϤϪϟϤϫϛ Ϫϥ ϤϛϛϚ ϥϫϪϩϟϚϛ ϜϟϤϗϤϙϟϤϝ Ϫϥ ϨϛϣϗϟϤ ϬϟϗϘϢϛ PϥϢϯMϛϪϩ ϣϗϠϥϨ ϗϩϩϛϪ ϟϩ ϪϞϛ
capitalized mineral property, plant, and equipment (about $322M), which only has real value if all
mining permits are issued and the mine development is financed. Nevertheless, if the Permit to
Mine were to be issued, the economics suggest that PolyMet should be able to obtain additional
financing to develop the mine.
The amount of capital investment that would be required, if the Permit to Mine is issued, to finance
the mine until it reaches full production and financially becomes self-supporting, depends on
several factors. The first factor is whether the mine sells the NorthMet metal concentrates or
further processes the concentrates on site. Table 22-4 in the January 2013 NorthMet NI 43-101
report estimates $601.9M in capital costs if the concentrates are processed on site and $312.3M in
capital costs if they are not processed on site. Another factor is the additional capital required to
stabilize the tailings embankments (i.e. enhanced CDSM/Buttress). The last factor is the
eϤϬϟϨϥϤϣϛϤϪϗϢ ϙϥϩϪϩ ϗϩϩϥϙϟϗϪϛϚ Ϫϥ PϥϢϯMϛϪϩ legacy environmental obligations for parts of the
former LTV mining site.
If PolyMet becomes bankrupt after the NorthMet mine is developed and operating for several years
before all the debts are paid off, the State must ensure that all of the reclamation and long-term
PolyMet Financial Capabilities 22
operation and maintenance financial assurance funds are only for the benefit of the State (as
required by rule) and not for any other creditors, and cannot be pledged as collateral.
Similarly, in the event of a bankruptcy or any other reason that prevents PolyMet from operating
the reclamation and long-term treatment facilities, all the assets needed by the State to operate and
maintain the site should become State property, and not sold to satisfy other creditors. These
include the real property, the water treatment collection and treatment facilities, mobile
equipment, etc.
PϥϢϯMϛϪϩ ϜϟϤϗϤϙϟϗϢ strength depends to a large degree on the metal prices when the mine would
start production and whether the mine would open during a period of rising or falling prices. The
NorthMet mine economics are very sensitive to the metal commodity price assumptions and
somewhat sensitive to the cut-off grade assumption (how big and profitable a mineral deposit is
assumed to be). When metal prices are high, the revenue can generate a healthy cash flow, but
when prices are low, the revenue can drop as much as $150 million per year (as determined in
Section 3.3 of this report), thus reducing the rate of return and increasing the economic risk.
Nevertheless, all of the economic evaluations completed to date concluded that the NorthMet
project was economical even assuming fairly conservative (i.e. low) metal prices.
PolyMet may require a third party to guarantee the assurances that PolyMet cannot fund upfront.
To minimize the risk to the State and the third party, the assurances should be converted into a
funded trust or escrow account within the first few years of operation.
Unless the project is sold to a major mining company, a financial partnership is formed, or any
other financial arrangement is made, only cash flow from operation would be available to pay off
the debts, fund the financial assurance trust, and generate dividends for the shareholders. The
NorthMet project NPV and rate of return depend on the timing of cash flow from operations, and
the timing and amount of money that should be placed in the financial assurance trust. If the
unfunded component of the trust is secured by a surety bond, then the bond should be set up to
immediately be accessible to make up the balance, rather than make up the balance over several
years. As required by rule, the State needs to make sure that the financial assurance costs are
covered at all times and immediately available.
A key consideration in evaluating the financial assurance funding risks would be to determine the
type and amount of financing that PolyMet can realistically obtain by itself (e.g. surety bonds, cash,
etc.). Due to numerous hardrock mine bond forfeitures that caused considerable losses to the
surety industry, it has now become more difficult for mining companies to obtain surety bonds. For
a small or new mining company like PolyMet it would be very difficult to obtain a reclamation bond
if there is any risk of bankruptcy. It would be even more difficult to find a surety willing to
guarantee a long-term financial assurance liability
A large company with a portfolio of other revenue sources and assets can more easily obtain surety
bonds compared to a small company whose only asset is a single mine. If NorthMet project is not
sold to a major mining company, a financial partnership is formed, or any other financial
arrangement is made, PolyMet may propose to obtain the surety bonds from less stable sureties. If
that is the case, the State should require that several sureties share the risk, and that the sureties
pass some financial health test.
PolyMet Financial Capabilities 23
4.1. Surety Evaluation
When evaluating the quality of surety, there are currently four key agencies, which rate the
financial strength of insurance companies: Standard & PϥϥϨϩ AM BϛϩϪ FϟϪϙϞ MϥϥϚϯϩ ϗϤϚ Wϛϟϩϩ
SϪϗϤϚϗϨϚ PϥϥϨϩ ϗϤϚ AM BϛϩϪ ϗϨϛ ϙϥϤϩϟϚϛϨϛϚ ϪϞϛ ϢϛϗϚ ϗϝϛϤϙϟϛϩ ϟϤ ϪϛϨϣϩ ϥϜ ϟϤϩϫϨϛϨ ϜϟϤϗϤϙϟϗϢ
strength ratings, based on recognition and coverage.
The rating agencies produce interactive or public data ratings. Interactive data rating is based on
ϣϛϛϪϟϤϝϩ ϭϟϪϞ ϙϥϣϦϗϤϟϛϩ ϣϗϤϗϝϛϣϛϤϪ ϗϤϚ ϟϤϬϥϢϬϛϩ ϜϫϢϢ ϗϤϗϢϯϪϟϙϗϢ ϗϙϙϛϩϩ Ϫϥ ϦϨϥϬϟϚϛ ϗϤ ϟϤ-depth
evaluation of a number of factors including, but not limited to, operating performance, balance
sheetϩ strength and business profile. Public data ratings reflect a quantitative and qualitative
analysis utilizing publicly available information only.
Rating agencies utilize different methodologies and rating codes ϗϢϩϥ ϚϟϜϜϛϨ AϤ A from one rating
service doeϩ ϤϥϪ ϤϛϙϛϩϩϗϨϟϢϯ ϛϧϫϗϪϛ Ϫϥ ϗϤ A from another raϪϟϤϝ ϩϛϨϬϟϙϛ FϥϨ ϟϤϩϪϗϤϙϛ ϗϤ A rating
from A.M. Best is aϤ ΊϛϮϙϛϢϢϛϤϪΊ ϨϗϪϟϤϝ ϭϞϟϢϛ ϗϤ A ratϟϤϝ ϜϨϥϣ MϥϥϚϯΉϩ ϟϩ ϥϤϢϯ ΊϝϥϥϚ
The ratings can be classified into secure and vulnerable categories however, providing a gauge of a
ϙϥϣϦϗϤϯϩ ϗϘϟϢϟϪϯ Ϫϥ ϣϛϛϪ ϟϪϩ ϥϘϢϟϝϗϪϟϥϤϩ TϞϛ ϞϟϝϞϛϩϪ ϨϗϪϛϚ SϛϙϫϨϛ companies have a very strong
ability to meet their ongoing obligations to policyϞϥϢϚϛϨϩ ϭϞϟϢϛ ϪϞϛ ϢϥϭϛϩϪ ϨϗϪϛϚ SϛϙϫϨϛ
companies have a good ability. Based on studies carried out by the agencies higher ratings generally
correspond to lower default ratios.
Table 9 shows the four key agencies which rate the financial strength of insurance companies and
their rating methodology. Plus or minus signs following the ratings show relative standing within
the rating category. TϞϛ ϩϞϗϚϛϚ ϗϨϛϗ ϟϤ ϪϞϛ ϪϗϘϢϛ ϨϛϦϨϛϩϛϤϪϩ SϛϙϫϨϛ category ratings.
In the case of the State of Minnesota, the surety must be licensed to do business in the State. It is
also strongly recommended that the surety has a current A.M. Best Rating of A- or better, or a
Standard & Poorϩ ϟϤϩϫϨϛϨϩ ϜϟϤϗϤϙϟϗϢ strength rating of A or better and classified as a Financial Size
Category (FSC) of IX or greater (adjusted policyholders' surplus of $250 million or better). The FSC
provides an indicator of ϪϞϛ ϙϥϣϦϗϤϯϩ financial capacity to provide the necessary policy limits to
insure risks.
More detailed credit ranking criteria to evaluate insurance and bonding companies can be found at
AM BϛϩϪϩ BϛϩϪ CϨϛϚϟϪ RϗϪϟϤϝϩ3. The US Treasury Department maintains a list of approved
sureties called Circular 54 that the StaϪϛ ϣϗϯ ϭϗϤϪ Ϫϥ ϫϩϛ ϗϩ ϗ ϨϛϜϛϨϛϤϙϛ Ϫϥ ϛϬϗϢϫϗϪϛ PϥϢϯMϛϪϩ ϩϫϨϛϪϯ
bond proposal. The Bureau of Land Management also has a list of approved sureties.
3 A.M. Best website (http://www3.ambest.com/ratings/default.asp)
4 Circular 5 (https://www.fiscal.treasury.gov/fsreports/ref/suretybnd/c570.htm)
PolyMet Financial Capabilities 24
’
Table 9. Insurance company financial strength ratings by agency
A.M. Best Fitch Moody’s S&P Weiss
A++ Superior AAA Exceptionally strong
Aaa Exceptional AAA Extremely strong
A+ Excellent
A+ Superior AA+ Very strong Aa1 Excellent AA+ Very strong A Excellent
A Excellent AA Very strong Aa2 Excellent AA Very strong A- Excellent
A- Excellent AA- Very strong Aa3 Excellent AA- Very strong B+ Good
B++ Very good A+ Strong A1 Good A+ Strong B Good
B+ Very good A Strong A2 Good A Strong B- Good
B Fair A- Strong A3 Good A- Strong C+ Fair
B- Fair BBB+ Good Baa1 Adequate BBB+ Good C Fair
C++ Marginal BBB Good Baa2 Adequate BBB Good C- Fair
C+ Marginal BBB- Good Baa3 Adequate BBB- Good D+ Weak
C Weak BB+ Moderately weak
Ba1 Questionable BB+ Marginal D Weak
C- Weak BB Moderately weak
Ba2 Questionable BB Marginal D- Weak
D Poor BB-Moderately weak
Ba3 Questionable BB- Marginal E+ Very weak
E Regulatory supervision
B+ Weak B1 Poor B+ Weak E Very weak
F In liquidation
B Weak B2 Poor B Weak E- Very weak
S Rating suspended
B- Weak B3 Poor B- Weak F Failed
CCC+ Very weak Caa1 Very poor CCC+ Very weak
CCC Very weak Caa2 Very poor CCC Very weak
CCC- Very weak Caa3 Very poor CCC- Very weak
CC/ C
Very weak Ca Extremely poor
CC Extremely weak
DDD/ DD/ D
Distressed C Lowest R Regulatory supervision
Note: Shaded area in the table represents “Secure” category ratings
PolyMet Financial Capabilities 25


![Unit 1B - HPT · design entwerfen, konstruieren; Entwurf, Muster 1B device Vorrichtung 1B dimension [ˌdaɪˈmen(t)ʃən] Abmessung 1B district Bezirk 1B drawing Zeichnung 1B drill](https://img.dokumen.tips/doc/110x75/6004851a49508c087b3c11bf/unit-1b-hpt-design-entwerfen-konstruieren-entwurf-muster-1b-device-vorrichtung.jpg)