Embed Size (px)
Citation preview

Petroleum taxation: Experience and issues 1
by
Kjell Løvås* and Petter Osmundsen**
*StatoilHydro ASA
**University of Stavanger / Norwegian School of Economics and Business Administration
Abstract
Topical issues in petroleum tax design are in this chapter discussed by means of a tax model for a
net income tax system (Norway) and a representative PSA regime. We analyse the entire life
cycle of a typical petroleum project, i.e., the exploration decision is included. Many petroleum
tax systems are regressive, and thus not able to cope with high increases or decreases in the oil
price. Accordingly, many countries are seeking to include progressive elements in their tax
system. We discuss the trade-off between progressivity on the one hand and the optimal sharing
of risk and investment between the oil companies and the host government on the other. Optimal
risk sharing and optimal allocation of cash flow over the project lifetime between host
government and international oil company, often call for the oil company to fund the initial
investments. The high front end loading of costs and the high risk on part of the oil company,
calls for it to keep a substantial part of the upside if the project is successful. This limits the
1 We would like to express our thanks for rewarding conversations with and comments on the article itself from a number of key specialists in the oil sector and academia, in particular Flemming Helgeland, Michael Keen, Per Kårstad, Morten Lindbäck, Knut Einar Rosendahl, and Rolf Wiborg. Address for correspondence: Petter Osmundsen, Department of industrial economics and risk management, University of Stavanger, NO-4036 Stavanger, Norway. Tel: +47 51 83 15 68. Mobile: +47 99 62 51 43. E-mail: [email protected]. Home page: http://www5.uis.no/kompetansekatalog/visCV.aspx?ID=08643&sprak=BOKMAL

degree of progressivity that is possible to implement. Thus, optimal tax design is contingent on
the relative characteristics of the host government and the oil companies - who is better able to
carry downside risk and who is the more impatient in terms of getting revenue. Also, the tax
system must be curtailed to the attractivity of the petroleum projects available.
1. Introduction
Tax theory generates recommendations as to optimal design of revenue instruments, e.g., the
resource rent tax. However, most observed tax systems deviate from theoretical
recommendations. Also, there is a large diversity in observed tax systems. Our working
hypothesis is that this variation is due to different characteristics of projects, host governments
and international oil companies (IOCs), and that the number of relevant parameters is larger than
what is accommodated in traditional tax analyses. By simple project analyses of the features of a
net income tax system and a PSA-contract, we attempt to illuminate some of these additional
parameters. Also, we make some careful attempts to indicate optimal state contingent tax design.
Oil tax systems need to cope with fluctuations in the oil price. Such fluctuations have been
extreme in 2008, see Figure 1.
Figure 1: Oil prices in 2008, Brent Platts Dated
Our focus is on trends and practical issues in design of petroleum taxation. For more theoretical
and general approaches of taxation of non-renewable natural resources, see Chapter 1 by
Boadway and Keen, and Lund (2008).
2. Analytical framework
Design of petroleum taxation can be illustrated by Principal-Agent theory.2 The petroleum
deposits are in many cases a common resource whose ownership is shared by all inhabitants.
Accordingly, the government's main objective is to maximise the net total government take from
the industry, using this revenue for public expenditure and investments.3 Optimal division of
labour implies participation of private companies in petroleum extraction. On behalf of the
residents, the government acts as a principal, and by a discretionary licensing system private
companies (agents) are given the right to extract, in return for which they pay taxes. An ideal tax
and licensing system captures the petroleum rent, attracts the most efficient companies, and
induces all socially profitable fields to be exploited in an optimal way. Due to incomplete
financial markets, risk must be borne by the contracting parties, and an optimal regulatory
system shares this risk optimally between the government and the petroleum companies.
An important insight from Principal-Agent theory is that there is not one universal optimal
contract or tax system. Instead, optimal contracts must be curtailed to the situation of the
contracting parties and the transaction. Thus, a state contingent optimal tax policy may be
derived. As for the transaction, relevant characteristics for petroleum deposits are the
prospectivity (economic attractivity) of a given field and geological area, the oil price, the
business cycle, and the presence of infrastructure and competent suppliers. Relevant
characteristics for the contracting parties
host governments and oil companies
are the ability
and willingness to carry risk, and the degree of impatience for revenue (i.e., the level of discount
rate). In this paper we analyse the two principal tax systems in the petroleum sector
net
2 See, e.g., Laffont (1989) for a general exposition of Principal-Agent theory, and Osmundsen (1998, 2002) for applications to exhaustible natural resources. 3 The government may in addition seek to increase the number of local jobs and enhance local investment.

income tax systems and production sharing arrangements (PSA contracts)
generating some
indications on the kind of circumstances they are useful.
3. Trends in petroleum taxation
Access to acreage for IOCs and petroleum taxation is changing with the oil price. We can
perceive this as a bargaining situation between host governments and IOCs. When oil prices are
high, host governments have a strong bargaining position. Their finances are sound, so they can
be more patient. They can ration available acreage, and they can give priority to national oil
companies. Also, they are in a position to increase taxes, as a number of IOCs are eager to
compete for the limited acreage. When oil prices fall, we have the reverse situation. Host
governments
if they have not developed a buffer fund
are in a weak financial position. They
are in this situation not able to fund large investments by national oil companies (NOCs), and are
dependent on investments from the IOCs. At the same time, the IOCs typically cut back on their
investment budgets. To attract sufficient investments, host governments therefore increase the
available acreage and cut taxes. The availability of prospective acreage is also strongly
influenced by the development in exploration and extraction technology.

0
20
40
60
80
100
120
1972 1972 1976 1980 1984 1988 1992 1996 2000 2004 2008
2008 USD/bbl Price of Brent Blend
Figure 2: Oil price since 1970
Consistent with this picture, and the oil price development depicted in Figure 2, we can see three
phases in petroleum taxation since 1974, where the general tax trends (though not without
exceptions) follow the development in the oil price:
1974
1984:
Strong increases in government take o High oil prices o Tax increases o Reduction in acreage
The sharp increase in oil prices in this period caused a strong fiscal situation for host
governments and consequently a strong bargaining position towards IOCs. The shift in relative

bargaining power led to tax increases and a reduction in available acreage for IOC, e.g., by
means of nationalisations.
1984
2003:
Decreases in government take o Low oil prices o Tax reduction o Expansion of acreage
As a response to falling oil prices and a reduced government take, many host governments (e.g.,
Canada, UK, Malaysia, Algeria and Egypt) made new acreage available in this period.
During this period of government take decline, the role of NOC s changed significantly.
More NOC s started to contract with IOC s (Azerbaijan, Mexico, Iran). Some NOC s lost their
monopoly and governments dealt directly with IOC s through concessions (Brazil, Argentina,
Saudi Arabia, Bolivia), and Carried interest provisions for NOC s were reduced or eliminated
(Norway, The Netherlands, Columbia)
2003
2008:
Increases in government take o Increase in oil prices o Tax increases o No new acreage
Prices go up and government take on oil is now again increasing. This is taking place along
several different paths. Progressive elements of some systems generate an automatic upward
adjustment (Angola, Malaysia, Trinidad and Tobago, Russia and India).4 Host governments
introduce stricter fiscal terms (UK, Alaska, Alberta, Algeria, Bolivia and Kazakhstan).
Government take is increased by the oil companies themselves in bid rounds (Libya, India). We
4 Note that although taxes increase at higher oil prices, the tax systems are not necessarily progressive. That would require taxes to increase as a fraction of revenue.

see greater state participation, directly by the state (Venezuela, Algeria) or through NOCs
(Russia through Gazprom). Still, the NOCs are not retrieving their previous roles.
A topical issue pertaining to long term trends in the petroleum sector is whether private
petroleum companies may gain access to large resources through political change, e.g., in the
Middle East, and whether service contracts will be replaced by concessions and PSC-schemes.
Will we at the same time see an extension of the current trend re-nationalization (Venezuela,
Bolivia, Russia, Algeria)? As displayed above, developments in the oil price are likely to be
decisive is these matters.
Political pressure for transparency might support a trend towards simplification of terms
less diverse fiscal terms, standardisation of PSAs, and more legislation at the expense of
negotiation.
We also see indications of trends towards differentiated taxation for different petroleum
qualities. We already see that - to stimulate gas production - tax conditions for gas often are more
favourable than for oil.5 In the same manner, we may see special (preferential) tax condition for
LNG, GTL, heavy oils, oil sands, oil shales, coal bed methane, gas hydrates, frontier areas, deep
water, and enhanced oil recovery.
Lately there has been a strong focus on a sluggish development of petroleum reserves. It is
important to recognise that the development of petroleum reserves is not only dependent of the
change in licensed acreage, but also technological development. We see many technological
advances. Acreage has been extended to 2000 meter depth. Improved pipeline technology is
opening up inland and arctic basins (Bolivia, Siberia, Sudan, Alaska), and improved LNG-
technology contributes to a globalisation of the gas market.
5 In some contracts in Malaysia, e.g., the cost oil limit is 50 per cent for oil and 60 per cent for gas. In order to be able to calculate cost oil and cost gas separately, a cost allocation procedure has to be established
usually based on gross revenue from each source.

4. Life cycle perspective
Many tax analyses consider exploration expenses to be sunk cost, and focus only on the stages of
development and operation. To have sustainable operations, however, an oil company needs to
consider the entire life cycle of the projects it enters into. Accordingly, we undertake EMV-
analyses, i.e., we include the exploration decision. EMV is the expected NPV of a life cycle oil
project, including exploration expenses.
As preliminary descriptions for our project analyses, we first describe the two particular polar tax
systems that we analyse
the Norwegian net income tax system, and a PSA-regime.
5. The Norwegian petroleum tax system6
Norway has a discretionary licensing system. The government receives a large share of the value
created through:
taxation of oil and gas activities
direct ownership in fields on the Norwegian continental shelf (through the State s Direct
Financial Interest - SDFI)
dividends from its shareholdings in the StatoilHydro oil company.
Petroleum taxation is based on the Norwegian rules for ordinary corporation tax. Owing to the
extraordinary profitability associated with production of petroleum resources, a special tax is
also levied on income from these activities. The ordinary tax rate is 28 per cent, the same as for
land-based activities, while the special tax rate is 50 per cent. When calculating taxable income
6 This section is based on Facts 2008 - the Norwegian petroleum sector by the Ministry of Petroleum and Energy and the Norwegian Petroleum Directorate. For analyses of the Norwegian petroleum tax system, see Bjerkedal and Johnsen (2005), and Lund (2002).

for both ordinary and special taxes, an investment is subject to depreciation on a linear basis over
six years from the date it was made. Companies may deduct all relevant expenses for
exploration, research and development, net finance, operation, decommissioning and so forth.
Consolidation between fields is permitted.
In order to shield normal return from the special tax, an extra deduction - the uplift - is
allowed in the calculation base for special tax. This amounts to 30 per cent of investment (7.5 per
cent per annum for four years from the year the investment was made). Companies which are not
in a tax position may carry forward with interest their losses on development and operations as
well as the uplift. Also, losses can be sold as a tax position to companies with offshore income.
For exploration costs oil companies receive a refund of the fiscal value of exploration costs in the
company s tax return. Thus, the Norwegian petroleum tax system is close to being linear.
The petroleum tax system has been designed to provide neutrality, so that an investment
project which is profitable for an investor before tax will also be profitable after tax. This makes
it possible to harmonise the desire to secure significant revenues for the community with the
requirement to provide sufficient post-tax profitability for the companies.
6. The PSA/NIC regime
There is a large variety of PSA-regimes, also within any given country, and it is hard to decide
on a representative case to analyse. Often, these are not strict PSA-schemes, but hybrid revenue
schemes containing PSA elements, a corporate income tax and often additional revenue
instruments. We analyse a fairly simple hybrid production sharing / net income tax (PSA/NIC)
regime that contains standard elements, including a rate of return (ROR) scheme that we believe
will become more common. We would like to emphasise that PSA-schemes vary from contract
to contract. Thus, our analysis must not be interpreted as a detailed analysis of a specific PSA
contract, but rather a system analysis of the general patterns inherent in such contracts. The
specific PSA/NIC scheme we analyse has the following features:

The main element is a cost recovery for the IOC and profit split of the oil not used for cost
recovery and a tax on profit oil for the IOC. There is limitation in cost recovery in two ways.
First only 50% of the oil produced can be used for cost recovery7 and secondly the CAPEX must
be depreciated over 4 years from production start. But there is also a high uplift of 10% in 4
years which gives a 140% cost recovery of CAPEX. CAPEX is recovered first then operating
cost afterwards.
The oil not used to recover cost is split between the IOC and the government (usually
represented by a national oil company) based on a sliding scale dependent on the return on
invested capital for the IOC. This rate of return (ROR) is calculated based on the cash flow for
the IOC in the years leading up to this profit split. The sliding scale we use is shown in table
below.8
ROR IOC profit oil share
0%-10% 80%
10%-20% 70%
20%-30% 60%
30%-50% 30%
Above 50% 15%
The IOC is then taxed 50% on the profit oil it receives.
7 In many PSAs the fraction of cost oil can vary, determined by predefined triggers in the contract. For example, if a project has not covered its year 0 costs by year 4, the cost fraction in year 5 increases above 50% until all costs from year 0 are covered. 8 There are examples that the investors share of the profit oil could be as low as 10 per cent.

Many PSA regimes would in addition include other elements like up-front payments of either a
bid for the license or bonus payments to the governments, royalty as a gross take on total
production and payable before cost recovery, carry of the national oil company in the exploration
phase, part of the production sold domestic for a low price, and price cap on possible profit oil
incomes. These additional tax features would shift more risk over on the IOC and reinforce the
front end loading of the IOC investments.
We now turn to describing the model project that we will use in our project analyses.
7. The project
The two tax systems
the Norwegian and a PSA regime
are applied on the same oil project.
We use a standard type of petroleum project, with the following details:
Figure 3: Decision tree for the project example
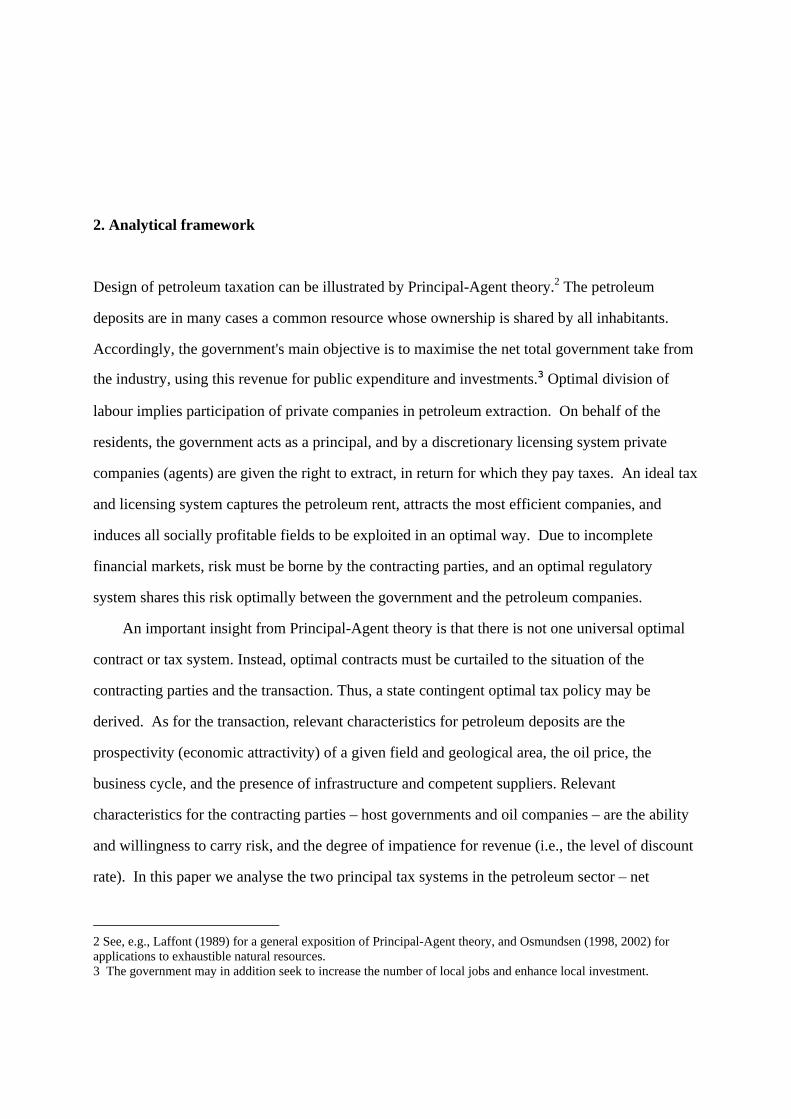
Exploration starts in 2009.The probability of finding oil is 30 %, whereas the ex ante probability
of the project being commercial, given that oil has been found, is 80%. Discount rate for
company and society is 10 %. The decision tree is depicted in Figure 3.
Upstream project 2009 2010 2011 2012 2013 2014 2015 2016
Front-end costs
Exploration OPEX 150
Appraisal OPEX
75 150 75
OPEX
Investment
New facilities
200 1500 2000 3000
Table 1: Front- end costs, in million USD.
Table 1 depicts the initial costs of the project, divided between costs for exploration, appraisal
and development of the field. Thereafter, from the start of production in year 2017 until close
down in 2031 there are an annual operation costs of 400 million USD.
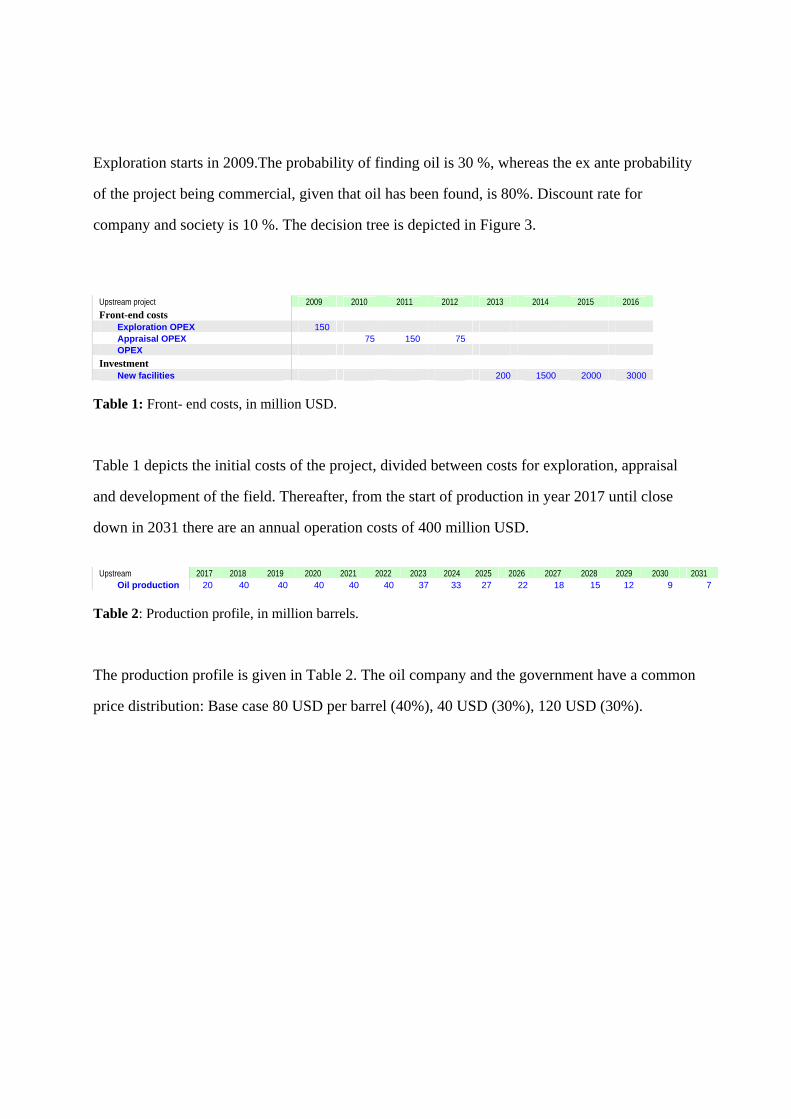
Upstream 2017 2018 2019 2020 2021 2022 2023 2024 2025 2026 2027 2028 2029 2030 2031 Oil production 20 40 40 40 40 40 37 33 27 22 18 15 12 9 7
Table 2: Production profile, in million barrels.
The production profile is given in Table 2. The oil company and the government have a common
price distribution: Base case 80 USD per barrel (40%), 40 USD (30%), 120 USD (30%).
8. Results
Over the last years the oil price has increased dramatically, and focus has been on tax
adjustments to capture additional resource rents. Following the credit crunch, the oil price has
fallen more than 50 per cent. If the price fall continues, the topical issue may become how to cut
taxes to attract foreign investment. The current regulatory model in many resource rich countries
very much relies on heavy funding by the NOCs, which is a vulnerable strategy when prices fall.
Thus, it is vital to examine how different types of petroleum tax systems cope with large
fluctuations in the oil price.
There is a large variety of PSA-regimes. According to Johnston (2008) most of them were not
adequately constructed to efficiently handle the dramatic increase in oil prices, because most of
them are regressive, i.e., the government percentage share of profits goes down when oil prices
go up. This is the main reason why we have seen a large number of ad hoc changes in petroleum
tax systems over the last couple of years. Petroleum tax systems with progressive government
take elements, such as rate-of-return (ROR) schemes have been under less pressure to change.
In some countries we see a trend towards net income tax systems, e.g., by an important country
like Russia. In another significant producer country - Brazil - they consider a PSA-scheme.
Comparing PSAs and net income systems therefore seems relevant. Also, progressivity is
topical, as progressive systems are better able to cope with price variation. These are the main
topics of our simulations.
Below we illustrate company EMV and government take, for different oil prices, and for two
countries: Norway s net income tax system and a PSA regime. A few results are worth
mentioning. First, even though the PSA regime includes a progressive ROR-scheme, the overall
tax burden in the country is actually regressive. This is also the case for most existing petroleum

tax systems, as noted by Johnston (2008). The reason is fairly obvious from the graph - the PSA
government does not carry any downside risk. The IOC carries all the downside risk - and to be
willing to participate the IOC accordingly must be allowed to keep a significant part of the
upside. Second, from the simulations we can indicate state contingent optimal tax design. The
PSA regime is beneficial to the host government if it is risk averse (not able or willing to bear
downside risk) and impatient (prefer tax revenue to come early). For governments that are
patient and able and willing to carry downside risk, a neutral net income systems (i.e., with no
distortions) - like the depicted Norwegian tax system - is recommendable as it maximizes the
overall value of the project. This pretty much fits real world observations. Host governments in
OECD-countries generally carry more risk, get the revenue later, and have less distortive
petroleum tax systems, than host governments outside the OECD-area. We now go into our
analyses in more detail.
Exploration Economics
-1500
-1000
-500
0
500
1000
1500
2000
2500
3000
0 20 40 60 80 100 120 140 160 180
Oilprice 2008 USD/Bbl
NP
V M
ill 2
008
US
D
PSA IOC
Norway IOC
PSA Goverment
Norway Goverment
Project 100%
Figure 4: Life cycle calculation for a model field and with two tax systems: Norwegian petroleum tax and a PSA/NIC scheme. For different oil prices, the curves illustrate (in NPV terms) the before-tax return of

the project, the after-tax return to the IOC in the two tax regimes, and the revenue to the two governments. The black line illustrates the before-tax NPV of the project.
Figure 4 shows the NPV calculations for the IOC and the government, under two different tax
systems (a PSA scheme and a neutral NIC system) and under different oil prices. The
calculations are made at the time before the decision of exploration is made, i.e., we focus on the
life cycle perspective of the field. The term used for such net present value calculations is
expected monetary value, or EMV. It is an expected value, as it is contingent on the outcome of
the exploration activity.
The diagram clearly illustrates the linearity of the Norwegian petroleum tax system, and the non-
linearity of the PSA-regime. Given the uncertainty of the exploration outcome, there is a clear
degressivity in the PSA-regime. For low oil prices, e.g., 40 USD per barrel, the IOC has a
negative outcome from the project, but still has to pay much tax in the PSA-regime. In a sense,
the IOC here faces a tax above 100 per cent. So the government does fine, even at a low oil
price. The IOC, however, takes a double hit, and there must be considerable upside present to
compensate for this negative outcome. At an oil price of 80 dollar per barrel, the tax burden falls
below 100 per cent, and the IOC gets a positive EMV. We see from Figure 4 that the Norwegian
government captures a smaller fraction of the EMV for oil prices below 140, but that the
difference is largest below 70 dollar per barrel. For prices above 140 the two tax systems
generate about the same revenue.

Net Present Value given exploration success
-6000
-4000
-2000
0
2000
4000
6000
8000
10000
12000
14000
0 20 40 60 80 100 120 140 160 180
Oilprice 2008 USD/Bbl
NP
V M
ill 2
008
US
D
PSA IOC
Norway IOC
PSA Goverment
Norway Goverment
Project 100%
Figure 5: Field development calculations for a model field and with two tax systems: Norwegian petroleum tax and a PSA/NIC scheme. Exploration costs are treated as sunk. For different oil prices, the curves illustrate (in NPV terms) the before-tax return of the development project, the after-tax return to the IOC in the two tax regimes, and the revenue to the two governments.
Figure 5 illustrates similar calculations as Figure 4, but only for the development phase of the
project. Thus, we undertake ex post calculations, after exploration has turns out to be successful.
We see that for prices below 95 USD, the PSA government has higher revenue than the
Norwegian government, whereas for prices above 95 the Norwegian system generates a marginal
higher revenue.

Yearly and cummualted tax income host goverments
-4000
-2000
0
2000
4000
6000
8000
10000
12000
14000
16000
2009 2014 2019 2024 2029
Year
Mill
200
8 U
SD Yearly Tax income PSA country
Yearly Tax income Norway
Accum Tax income PSA country
Accum Tax income Norway
Figure 6: Revenue streams for an oil price of 80 USD. Life cycle calculation for a model field and with two tax systems: Norwegian petroleum tax and a PSA/NIC scheme. For different oil prices, the curves illustrate the annual and the accumulated revenue for the two tax systems.
Figure 6 illustrates annual and accumulated revenues for the two tax systems for the base case oil
price of 80 USD. Unlike the previous figures that show NPV calculations, the numbers in Figure
6 are not discounted. Abstracting from discounting, we see that Norway overall gets a higher tax
revenue, but with a considerably less favourable time profile. To get a better grasp of the tax
system comparison, we now provide some specific numbers from our calculations.
Oil Price 40 80 120 Weighted
IOC PSA -2 147 580 2 203 249
IOC Norway -301 821 1 953 824
Goverment PSA 1 259 2 788 5 436 3123
Goverment Norway -587 2 545 5 685 2548
Table 3: Net present value, given exploration success

Table 3 shows net present value of the project, given successful exploration, for oil prices of 40,
80 and 120 USD per barrel. Also, we show the expected NPV, with oil price probabilities 30 per
cent for 40 USD, 40 per cent probability for 80 USD, and 30 per vent probability for 120 USD
per barrel. The results are reported for the IOC and the two governments. We see that the IOC
gets marginal better expected payoff in the PSA-regime at high oil prices, but that the situation is
dramatically reversed on low prices. The reason is that Norwegian authorities share the downside
risk by means of tax deductions, whereas this is not the case in the PSA-regime.
Oil Price 40 80 120 Weighted
IOC PSA -632 22 412 -57
IOC Norway -103 166 438 167
Goverment PSA 302 669 1 305 750
Goverment Norway -227 524 1 278 525
Table 4: Expected monetary value of the exploration project
Table 4 shows the corresponding expected exploration economics. Note that the net present
value of the project is much lower when we account for exploration uncertainty, exploration
expenses and lead times. When we account for the exploration phase, the differences between the
two tax regimes are reinforced. The EMV is better for the IOC in Norway than in the PSA-
country, for all the oil prices we analyse. Note that the weighted EMV is negative for the PSA-
country, so the IOC will not undertake the project under the PSA-conditions even if the project is
profitable on a before-tax basis.9 This is an illustration of the fact that PSA-regimes are non-
neutral when we account for uncertainty, and that investment decisions can be distorted. The
Norwegian tax regime is neutral by design, so in this regime the decision can be made by
calculating EMV for the basis price of 80 USD
price weighting is not necessary. The neutrality
of the Norwegian system lies in the fact that the fraction of costs - on a net present value basis -
carried by the government is equal to the fraction of the income it captures. This symmetry
9 Thus, it does not help that the government revenue calculated for the PSA regime in Table 4 is higher than for the Norwegian tax regime, as long as the project will not go through. In technical terms, the PSA-terms in this particular case violate the IOC s participation constraint.

implies a cash flow tax system, which does not distort economic decisions by the oil
companies.10 The distortive property of the PSA system lies in its asymmetry
whereas the
government does not carry any of the downside risk, it captures a large fraction of the upside.
Thus, the non-linearity tax system discriminates against risky investments. In this particular case
the PSA government will have incentives to change the fiscal conditions so that this profitable
project can be developed. As the PSA-conditions are project based, such adjustments can be
made.
Oil Price 40 80 120 Weighted
Goverment PSA 414 882 1649 971
Goverment Norway -610 373 1357 373
Table 5: Expected monetary value of government revenue from the development project, with a discount rate of 20 per cent
PSA-schemes are non-neutral, and are known to induce distortions of the investment level, the
trade-off between CAPEX and OPEX, and production profiles.11 Despite the deadweight losses,
PSA-schemes are wide spread among resource rich host governments outside OECD. Important
reasons are that the host government does not have to carry downside risk, and the revenue
comes early. The latter can be illustrated by our model project. Let us assume that the
government is impatient, represented by a high discount rate of 20 per cent. We see from a
comparison of table 3 and table 5, that the increase in discount rate clearly improves the relative
ranking in favour of the PSA-scheme.
Oil Price 40 80 120 Weighted
Goverment PSA 99 212 396 233
Goverment Norway -221 15 251 15
Table 6: Expected monetary value of government revenue from the Life cycle project, with a discount rate of 20 per cent
10 As capital expenditure cannot be written off immediately, the Norwegian tax system is not identical to conventional cash flow tax systems. The net present value loss of depreciation, however, is compensated by an uplift that is calculated to generate neutrality. 11 Note that the resulting deadweight losses are not captured by our project example, we have for simplicity assumed that the IOC has the same costs and revenues under the two tax regimes.

Table 6 shows the same qualitative result for the life cycle project.
Oil Price 40 80 120
PSA -142 % 83 % 71 %
Norway 66 % 76 % 76 %
Table 7: Tax progression
Remember that the PSA-scheme we analysed had a progressive element in the ROR-based
sliding scale. Nevertheless, the overall tax system is regressive; see Table 7. A progressive tax
system would not be possible as it would not allow the IOC to recoup all the costs it bore up
front.12 The Norwegian tax system, in comparison, is close to linear.
We will now explore a few supplementary decision criteria that IOC s use for selecting projects.
Oil Price 40 80 120 Weighted
IOC PSA -0,63 0,17 0,65 0,07
IOC Norway -0,09 0,24 0,58 0,24
Table 8: Net present value index
When capital, human or other inputs are scarce, IOCs make use of net present value index to
rank projects. From table 8 we see that the Norwegian tax system outperforms the PSA-scheme
on this indicator, when all price outcomes are considered, because of a much better outcome at
low prices.
Given explor. success Exploration economics
IOC PSA 70 78
IOC Norway 52 55
Table 9: Break-even prices
Yet another input to investment decisions is break-even price. From Table 9 we see that the
break-even price is much lower with the Norwegian tax regime, as the government in this case
shares in the negative outcomes.
12 In technical terms, it would violate the IOC s participation constraint; see Osmundsen (2006).

Oil Price 40 80 120
IOC PSA n.a. 2021 2019
IOC Norway 2020 2019 2018
Table 10: Pay-back times
Finally, one might consider pay-back times. This criteria may have some relevance, e.g., if one
perceives the political risk to increase over time. The Norwegian regime scores slightly better on
this indicator.
9. Discussion
We have analysed the taxation of a model project with two tax systems, 1) the Norwegian tax
system (representing the OECD area), and 2) a hybrid PSA-system (representing tax systems
outside OECD). The analyses are too specific to form any precise and general conclusions, but
they illuminate some of the basic trade-offs in petroleum tax design.
We find that the Norwegian tax system performs better that the PSA-regime on a number of
decision criteria and on system properties like minimizing distortions. Still, PSA-systems are
widely used as they provide host governments with revenue at an early stage and shield the host
government from downside risk in the project. On very high prices
or alternatively with a more
prospective project
revenue with the Norwegian tax system exceeds the PSA revenue.
However, this could be adequately remedied, e.g. by signature bonuses determined through
bidding or negotiation. In general, we observe that the more attractive the resource base, the
tougher is the fiscal terms. This is the result of fiscal competition.13 Even though the petroleum
resources are immobile, resource countries compete to attract the most competent companies,
13 See Osmundsen (2006) and Nakhle (2007).

personnel and equipment. The competition is either in a free market (bidding or negotiated
terms) or in terms of legislative tax design based on comparative analyses.
Seen from the perspective of the company, the Norwegian petroleum tax system is much more
favourable than the particular PSA-regime analysed. It should be emphasised, however, that our
implicit assumption that all other features are the same in the two countries, may not be valid.
The most important element in this setting is prospectivity. A more harsh tax system may be
justified if the prospectivity
in terms of volumes in place, reservoir characteristics and costs
is more favourable. On the other hand, we have not included in our analysis contract and fiscal
elements like bidding, sliding scale and carried interest. These elements, which are prevalent in
highly prospective resource countries, entail even higher front end loading, higher downside risk,
and higher progressivity for the IOCs.
In our analyses we have assumed that the IOC and the government have the same discount rate.
The Norwegian government usually has a lower discount rate than the companies. Norway is
well funded, with some 40.000 euro per capita in an oil fund. Accordingly, the Norwegian state
is a patient player, with a low discount rate. It may therefore make good sense to bear a large
fraction of the front end investments - and get correspondingly higher tax revenue later. This is
probably the optimal intertemporal allocation of funds between government and companies for
Norway. For other resource countries, this may not be a good system. Many resource rich
countries have an acute need for public revenue, i.e., the discount rate of the government is high.
In such cases investments are typically borne by the IOCs (carried interest) and the are additional
gross tax elements
like royalties
that secure an early revenue for the government. Such fiscal
instruments were also used by Norway when the petroleum activity started forty years ago.
Much focus these days is on the revenue system that will be selected by Brazil. After several
gigantic discoveries over the last years, Brazil has stopped further licensing rounds, as the
government was not assured that the signature bonuses from auctions would secure that the

government captured a significant part of the resource rent. One of the model discussed by the
Brazilian government is a PSA-scheme, arguing that this system guarantees the government
revenue from day one of production (instead of waiting for the IOCs to come in a tax-paying
position), and at the same time that the inherent presumed progressivity better secures that the
IOCs will not capture an unreasonable part of the return in case of high oil prices or unexpected
large reservoirs.
Our simple analyses cannot be used to derive very specific advice on petroleum tax design. But
we believe they can be used as a basis for some general remarks. An important insight is that
there is not one optimal tax system. Rather, optimal tax design is state contingent. It needs to be
customized to the parties involved: Who - the government and the oil companies - are the more
risk averse? Who is able to carry downside risk? Who is the more impatient party, with respect to
revenue? The tax system also has to be curtailed to the prospectivity of the projects at hand - a
harsh tax system is only adequate for highly prospective projects.
We also demonstrate that a sustainable tax policy needs to take the entire life cycle of the project
into account. Some of the recent tax increases clearly violate this requirement. Increases in taxes
have in many cases been based solely on analyses on development projects, treating the
exploration costs and the exploration risk as sunk. The life cycle calculation may in such cases
become negative, and deter future investments. This is particularly the case if tax adjustments are
asymmetric
taxes are more quickly adjusted upwards at higher prices than downwards at lower
prices. If IOCs account for this type of government tax behaviour, exploration decisions are
likely to be deterred even if the projects are profitable.
In our project example, we have assumed that the IOC can deduct a correct amount of costs in
the tax calculations. This is not a trivial assumption. If deductible costs deviate from actual costs,
the effective tax rate can deviate from our calculations. In PSA models, the NOC usual has two

roles. It is an investor, facing the same commercial conditions as the IOCs. At the same time it
serves as a licensing authority, ad in that capacity it is up to the NOC to accept the costs that can
be covered by cost oil. We have received several independent reports that some NOCs exercises
a cyclical pattern with respect to accepting costs
cost deductions are to a larger extent denied in
periods with high oil prices. This adds to the progressivity of the effective taxation.14
The dramatic oil price increase until mid 2008 led to tax increases in most resource countries.
However, there are a few notable exceptions. The Norwegian tax system has remained stable
throughout the price increase. (Actually, breaks have been given to exploration costs for
companies without taxable income.) The explanation is two-folded. First, unlike e.g. the British
petroleum tax, the effective tax was high at the outset. Second, the Norwegian tax system is close
to a cash flow tax, and therefore automatically accommodates price changes. Another country
with a stable tax system in this period is Angola. They also started out with a high effective
taxation before the increase in the oil price. Another stabilizing element may be the systems of
signature bonuses. These have represented a very potent revenue instrument for Angola, and
have effectively accommodated the increase in oil prices. High signature bonuses will to a large
extent depend on the credibility of the remaining tax instruments, and Angola has thus had a
credible commitment structure. It is always the case that excessive short-term tax increases may
hurt future investments and revenues, but with a continuous awarding of new exploration
acreage, the cost of lost reputation would be immediate in terms of a drastic decrease in signature
bonuses.
In our comparison of tax systems we have for tractability reasons omitted several relevant
elements of project analyses. Out intentions have not been to make an accurate comparison of tax
14 As licensing authority NOCs often also have the right to approve all contracts in which costs incur. They often make sure that the contracts are assigned to companies with which the NOC has a joint venture. This intervention is also reported to be more prevalent at high oil prices.
payments, but rather to illustrate some general features of different tax systems. This may justify
simplifications, but the readers should bear in mind that we do not make a full fledge
comparison. We now discuss some of the omitted elements. For simplicity, we have applied the
same rate of return requirement (discount rate) in the two countries. Usually, oil companies
differentiate the discount rate among countries, typically with the lowest rates applied to OECD-
countries. From a strict tax perspective, non-neutral tax systems (e.g., PSA-schemes) are more
prone to change due to enhanced distortions when the oil price fluctuates, thus calling for a
higher discount rate. Alternatively, the oil companies may let the fiscal uncertainty be reflected
in cash flows, accounting for an expected tax increase in the event of higher oil prices.
Obviously, this will weaken the company s investment incentives, thus illustrating the gains to
the resource country of a credible tax policy. Also, we have not accounted for signature bonuses,
which often are one of the supplementary elements in PSA-regimes. The front-end-loading
structure of signature bonuses, combined with lack of consolidation, obviously lead to a
significant reduction in the project s expected monetary value for the IOC. Accordingly,
international comparisons of petroleum tax systems that fail to account for signature bonuses -
e.g., the comparative analyses of WoodMackenzie - can be seriously misleading.
In our study of different petroleum tax systems internationally, we find evidence of Van Meur s
rule: The administrative complexity of a fiscal system is inversely proportional to the
government s administrative capacity. The easy systems are found in countries like UK, USA,
and Norway, whereas complex systems are found in countries like Liberia, Burundi and Senegal.
On a general basis we believe it is recommendable to design simple and transparent tax systems.
They are easier to administer, and they reduce the risk premiums of the IOCs.

References
Bjerkedal, N. and T. Johnsen (2005), The petroleum tax system revisited , in Glomsrød, S. and
P. Osmundsen (2005), eds., Petroleum Industry Regulation within Stable States. Recent
Economic Analysis of Incentives in Petroleum Production and Wealth Management, Ashgate
Studies in Environmental and Natural Resource Economics, Ashgate Publishers.
Johnston, D. (2008), Changing Fiscal Landscape , Journal of World Energy Law & Business 1,
1, 31-54.
Laffont , J.-J. (1989), The economics of uncertainty and information, MIT-Press, Cambridge,
Massachusetts.
Lund, D. (2008), Rent Taxation for Nonrenewable Resources. A Critival review of the
literature , forthcoming in Annual Review of Resource Economics.
Lund, D. (2002), Petroleum tax proposals in Norway and Denmark , Energy Journal 23, 4. 37-
56.
Nahkle, C. (2007), Petroleum Taxation. Sharing the Oil Wealth: a Study of Petroleum Taxation
Yesterday, Today and Tomorrow, Routledge.
Osmundsen, P. (2005), "Optimal Petroleum Taxation - Subject to Mobility and Information Constraints", in Glomsrød, S. and P. Osmundsen, eds., Petroleum Industry Regulation within Stable States. Recent Economic Analysis of Incentives in Petroleum Production and Wealth Management, Ashgate Studies in Environmental and Natural Resource Economics, Ashgate Publishers.

Osmundsen, P. (2002), Regulation of Common Property Resources under Private Information
about Stock Externalities , Resource and Energy Economics 24, 349-366.
Osmundsen, P. (1998), Dynamic taxation of nonrenewable natural resources under asymmetric
information about reserves , Canadian Journal of Economics, 31,4, 933-951.

This document was created with Win2PDF available at http://www.win2pdf.com.The unregistered version of Win2PDF is for evaluation or non-commercial use only.This page will not be added after purchasing Win2PDF.