Embed Size (px)
Citation preview
P e r t a n i k a J o u r n a l o f
socialscience &Humanities
VOLUME 7 NO.2 SEPTEMBER 1999
A scientific journal published by Universiti Putra Malaysia Press
Pertanika Journal of Social Science and HumanitiesI About the Journal
Pertanika, the pioneer journal of UPM, began publication in 1978. Since then, it has established itself as one of the leading multidisciplinary journals in the tropics. In 1992, a decision was made to streamline Pertanika into three journals to meet the need for specialised journals in areas of study aligned with the strengths of the university. These are (i) Pertanika Journal o f Tropical Agricultural Science (ii) Pertanika Journal of Science & Technology (iii) Pertanika Journal o f Social Science Sc Humanities.
| Aims and ScopePertanikajoumal of Social Science and Humanities aims to develop as a flagship journal for the Social Sciences with a focus on emerging issues pertaining to the social and behavioral sciences as well as the humanities, particularly in the Asia Pacific region. It is published twice a year in March and September.
The objective of the journal is to promote advancements in the fields of anthropology, business studies, communications, economics, education, extension studies, psychology, sociology and the humanities. Previously unpublished original, theoretical or empirical papers, analytical reviews, book reviews
and readers critical reactions may be submitted for consideration. Articles may be in English or Bahasa Melayu.
■ Submission of ManuscriptThree complete clear copies o f the manuscript are to be submitted to
The Chief EditorPertanika Journal o f Social Science and HumanitiesUniversiti Putra Malaysia43400 UPM, Serdang, Selangor Darul EhsanMALAYSIATel: 603-89468855/89468854 Fax: 603-89416172
■ Proofs and OffprintsPage proofs, illustration proofs and the copy-edited manuscript will be sent to the author. Proofs must be checked very carefully within the specified time as they will not be proofread by the Press editors.
Authors will receive 20 offprints of each article and a copy of the journal. Additional copies can be ordered from the Secretary of the Editorial Board.
| EDITORIAL BOARD ]
Prof. Dr. Abdul Rahman Md Aroff - Chief Editor Faculty o f Hum an Ecology
Prof. Dr. Annuar Md. Nasir Faculty o f Economics & Management
Prof. Dr. Mohd. Ghazali Mohayidin Faculty o f Economics & Management
Prof. Dr. Hjh. Aminah Hj. Ahmad Faculty o f Educational Studies
Assoc. Prof. Dr. Rozumah Baharudin Faculty o f H um an Ecology
Assoc. Prof. Dr. Abdul Halin HamidFaculty o f Hum an Ecology
Assoc. Prof. Dr. Rosli TalifFaculty o f Modem Language Studies
Sumangala Pillai - Secretary Universiti Putra Malaysia Press
| INTERNATIONAL PANEL MEMBERS |
Prof. Jean Louis FloriotInternational Graduate Institute o f Agribusiness
Prof. BinaAgarwalUniversity Enclave India
Prof. V.T King University of Hull
Prof. Royal D. Colie Cornell University, Ithaca
Prof. Dr. LindaJ. Nelson Michigan State University
Prof. Dr. Yoshiro Hatano Tokyo Gakugei University
Prof. Max LanghamUniversity of Florida
Prof. Mohamed AriffMonash University Australia
Prof. Fred LuthansUniversity of Nebraska
Prof. D.H. Richie University of Toledo
Prof. Gavin W. Jones Australian National University
Prof Dr. Lehman B. Flecther Iowa State University
Prof. Ranee P.L LeeChinese University, Hong Kong
Prof. Stephen H.K.Yeh University of Hawaii at Manoa
Published by Unviersiti Putra Malaysia Press ISSN No.: 0128-7702
Prof. Graham W. ThurgoodCalifornia State University
ARCHIVE COPY(Please Do Not Remove)
Pertanika Journal of Social Science & Humanities Volume 7 Number 2 (September) 1999
Contents
Tactics o f E nvironm ental NGO s in Influencing Public Policy in Malaysia 71 - Rusli Mohd an d Kennt Cheh Sonn Lee
Perubahan Produktiviti dan Kecekapan Teknikal Industri Perkilangan 79 Elektrikal dan Elektronik di Malaysia - Alias Radam, Sazali Abu Mansor dan Sarah Salwa Adrian
Factors Influencing the O ccurrence o f Forest Offenses in a Peninsular 91 Malaysia State - Rusli Mohd
Cadangan Model Teoritikal bagi Menilai Kecekapan Pelaburan dalam 97 Pem bangunan Tanah Rizab Melayu - Nor Ghani Md. Nor dan Mohd Azlan Shah Zaidi
T echnical Efficiency Estim ates for Sarawak P ep p er Farm ing: A 103 Comparative Analysis - Alias Radam and Mohd. Mansor Ismail
D em and for Fish and its Substitutes in Malaysia: Evidence of H abit 111 Form ation and Structural Change - Nik Mustapha R Abdullah and Ahmad Zubaidi Baharomshah
> ERTAN/KA EDITORIAL OFFICE research Management Centre (RMC)
1st Floor, IDEA Tower 11 UPM-MTOC, Technology Centre
Universiti Putra Malaysiar i Se,arW Malaysia
+603 894? 1622, 8947 1619. 8947 1616
Pertanika J. Soc. Sci. & Hum. 7(2): 71 - 77 (1999) ISSN: 0128-7702 © Universiti Putra Malaysia Press
Tactics o f Environmental NGOs in Influencing Public Policy in Malaysia
RUSLI MOHD and KENNY CHEH SONN LEEFaculty of Forestry,
University Putra Malaysia,Serdang, Selangor, Malaysia
Keywords: environmental NGOs, political tactics, public policy
ABSTRAK
Pertubuhan Alam Sekitar Bukan Kerajaan di Malaysia boleh mempengaruhi pembuatan dasar awam melalui beberapa taktik politik. Kajian ini meninjau dan membandingkan taktik yang digunakan oleh tiga pertubuhan, iaitu Sahabat Alam Malaysia (SAM), Persatuan Pencinta Alam Malaysia (MNS) dan Dana Alam Semulajadi Dunia (WWF). Persatuan Otomobil Malaysia (AAM) dipilih sebagai kumpulan kawalan. Data dan maklumat dikumpul dengan menemuduga secara bersemuka ketua pegawai eksekutif pertubuhan berkenaan atau wakil mereka menggunakan soalselidik yang telah sedia terbentuk. Temuan kajian ini menunjukkan pertubuhan alam sekitar tersebut adalah berbeza dari AAM dari segi taktik mempengaruhi dasar awam. Mereka lebih cenderung menggunakan taktik langsung dalam mempengaruhi keputusan dasar awam. Taktik seperti menjalan dan mengemukakan keputusan penyeldidkan, mengemukakan pandangan peribadi, melobi dan menghubungi pegawai, sering digunakan berbanding dengan taktik seperti kempen menulis surat dan telegram, melobi pihak “grassroots”, merangka undang-undang atau menganjur konferen. Diantara pertubuhan alam sekitar, MNS menggunakan lebih taktik samada taktik langsung atau tidak langsung berbanding dengan SAM atau WWF. MNS juga mepunyai lebih banyak sumber kewangan dan ini mungkin menerangkan ia lebih banyak menggunakan banyak taktik. Kajian masa hadapan perlu menggunakan sampel yang lebih besar disamping mengkaji keberkesanan taktik yang digunakan.
ABSTRACT
Environmental non-governmental organizations (NGOs) in Malaysia can influence public policymaking through several political tactics. This study surveyed and compared the tactics used by three selected NGOs, namely, the Sahabat Alam Malaysia (SAM), the Malaysian Nature Society (MNS) and the World Wide Fund for Nature (WWF), Malaysia. The Automobile Association of Malaysia (AAM) was conveniently selected as the control group. Data and information were gathered through face-to-face interview technique with the chief executive officers of the respective organizations or their representative using a structured questionnaire. The findings reveal that the environmental NGOs are different from the AAM in their choice of tactics of influencing public policy. The former prefer to use direct tactics in influencing policy decisions. Tactics such as conducting and presenting research results, presenting personal viewpoints, lobbying and contacting officials, are often used compared to tactics like letter-writing and telegram campaigns, grassroots lobbying, drafting legislation or organizing conferences. Among the NGOs, the MNS has been the most tactical in the sense that it has used more tactics, both direct and indirect, more often than the SAM or the WWF. The MNS is also the most resourceful of the NGOs and this probably explains its capacity to employ more political tactics. Future studies should use a bigger sample as well as investigate the effectiveness of the various tactics used.
INTRODUCTIONEnvironmental non-governmental organizations (NGOs) worldwide have been recognized as influential actors in the decision-making arena
on policies related to the environment. The manner in which these NGOs influence decisionmaking vary and depends on the strength of the NGOs themselves as well as the institutions which

Rusli Mohd and Kenny Cheah Soon Lee
they target their activities (Mohd and Laarman 1994). At one extreme, there are NGOs which work closely with the public in harnessing their support to influence policies while at the other extreme there are other NGOs that directly lobby the policy makers themselves. The degree of success of environmental NGOs in influencing policy decisions vary among nations. In some countries, such as the United States of America, environmental NGOs have been responsible for bringing about the institutionalization of environmental concern. In such countries, these NGOs have permanently dotted the political landscape of the nations.
Environmental NGOs have also made their presence felt in the decision-making arena on environmental policies in Malaysia. These NGOs have started to influence decision-making either directly or otherwise. The Sahabat Alam Malaysia (Friends of the Earth, Malaysia), for example, has been organizing conferences on the environment on a regular basis during the past m any years which p u t forw ard recom m endations to be taken up by government departments and ministries. The Malaysian Nature Society (MNS), on the other hand, has played an active role in organizing expeditions to remote forest areas and has made several discoveries of new flora. The outcome of these expeditions help to educate members of the public as well as policy makers on the richness of the country’s biological diversity which need to be conserved for fu tu re generation. The World Wide Fund for Nature, Malaysia (WWF) has been freq u en tly commissioned by the government to undertake studies that would form the base for policy decisions.
Although the general tactics used by some environmental NGOs are known, there has been no systematic study to account for the similarities and differences in the specific tactics used by the different organizations in influencing policy decisions. By analyzing these specific tactics the public in general, and the members of the organizations, in particular, would be able to gauge the effectiveness of these NGOs in influencing policy decisions.
Environmental NGOs and Tactics of Influence Environmental NGOs are essentially interest groups whose main goal is, among others, to influence government decisions in favour of
the common interest that is shared by the members of the organizations. Members of these voluntary organizations are bonded together by this common interest about the environment and they will pursue it by making claims or demands upon other groups in the society, including the government. The shared interest determ ines the kind o f policies th a t the organizations will influence and also serve as a yardstick against which these organizations judge the actions or inactions of other members of the society.
In designing tactics to influence policy decisions, environm ental NGOs m ust give overriding attention to the centres of influence. The centres of influence are essentially the points where decisions are made and these generally include the legislative, executive and judicial divisions of the government. Various tactics are open to the NGOs to access the centres of influence and these can be broadly categorized into two, namely “inside” and “outside tactics” (Gais and Walker 1992).
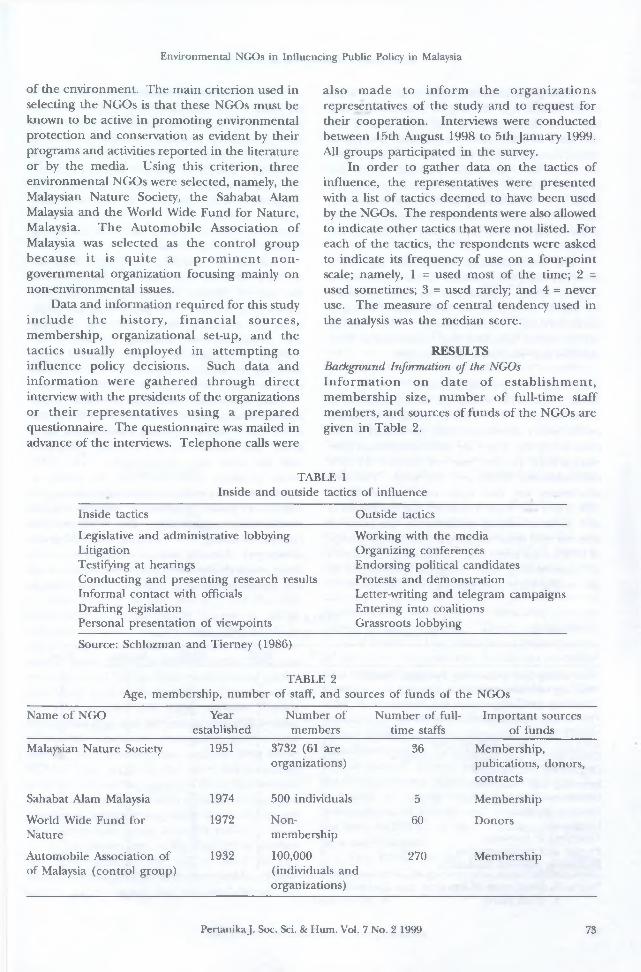
Inside tactics, or conventional lobbying, involve close consultation between the NGOs and policymakers. Through these tactics, the NGOs or their representatives communicate data or opinions to governmental decision makers in an a ttem pt to in fluence policy decisions. Representatives of the NGOs usually try to convince policymakers that some form of action should be taken to modify an established position or to change it in the midst of competing groups to change it. Hence, popular inside tactics include personal presentation of viewpoints, conducting and presenting research results and legislative and administrative lobbying. (Table 1)
In com parison, outside tactics involve “constituency lobbying”, or the use of electoral or constituency connections to exert pressure on policy decisions. Outside tactics serve as indirect efforts to exert influence upon policy processes. However, the main goal is to build support within the general public for a new set of values that may become manifest in the future policies (Gais and Walker 1992). Frequent outside tactics include letter-writing campaign, working with the media, and organizing meetings and conferences.
METHODSurveyThe focus of the study is on national NGOs concerned with the protection and conservation
72 PertanikaJ. Soc. Sci. & Hum. Vol. 7 No. 2 1999
Environmental NGOs in Influencing Public Policy in Malaysia
of the environment. The main criterion used in selecting the NGOs is that these NGOs must be known to be active in promoting environmental protection and conservation as evident by their programs and activities reported in the literature or by the media. Using this criterion, three environmental NGOs were selected, namely, the Malaysian Nature Society, the Sahabat Alam Malaysia and the World Wide Fund for Nature, Malaysia. The Autom obile Association of Malaysia was selected as the control group because it is q u ite a p ro m in e n t n o n governmental organization focusing mainly on non-environmental issues.
Data and information required for this study inc lude the h istory , fin an c ia l sources, membership, organizational set-up, and the tactics usually em ployed in attem pting to influence policy decisions. Such data and inform ation were gathered through direct interview with the presidents of the organizations or their representatives using a p repared questionnaire. The questionnaire was mailed in advance of the interviews. Telephone calls were
also m ade to in fo rm the o rg an iza tio n s representatives of the study and to request for their cooperation. Interviews were conducted between 15th August 1998 to 5th January 1999. All groups participated in the survey.
In order to gather data on the tactics of influence, the representatives were presented with a list of tactics deemed to have been used by the NGOs. The respondents were also allowed to indicate other tactics that were not listed. For each of the tactics, the respondents were asked to indicate its frequency of use on a four-point scale; namely, 1 = used most of the time; 2 = used sometimes; 3 = used rarely; and 4 = never use. The measure of central tendency used in the analysis was the median score.
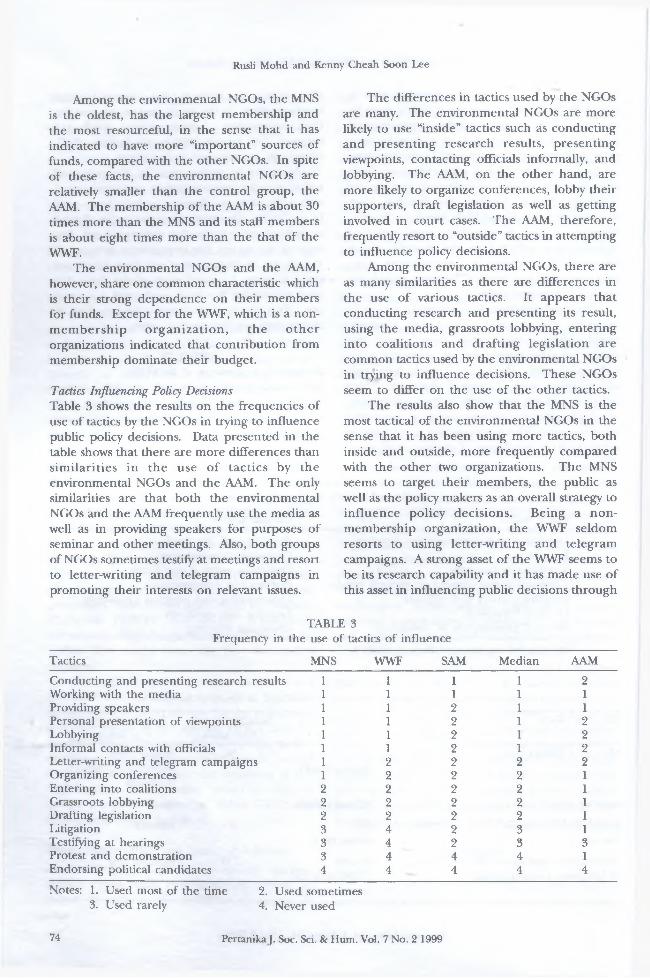
RESULTSBackground Information of the NGOs In fo rm atio n on date o f estab lishm en t, mem bership size, num ber of full-time staff members, and sources of funds of the NGOs are given in Table 2.
TABLE 1Inside and outside tactics of influence
Inside tactics Outside tactics
Legislative and administrative lobbying LitigationTestifying at hearingsConducting and presenting research results Informal contact with officials Drafting legislation Personal presentation of viewpoints
Source: Schlozman and Tierney (1986)
Working with the media Organizing conferences Endorsing political candidates Protests and demonstration Letter-writing and telegram campaigns Entering into coalitions Grassroots lobbying
TABLE 2Age, membership, number of staff, and sources of funds of the NGOs
Name of NGO Yearestablished
Number of members
Number of fulltime staffs
Important sources of funds
Malaysian Nature Society 1951 3732 (61 are organizations)
36 Membership, pubications, donors, contracts
Sahabat Alam Malaysia 1974 500 individuals 5 Membership
World Wide Fund for Nature
1972 Nonmembership
60 Donors
Automobile Association of of Malaysia (control group)
1932 100,000(individuals and organizations)
270 Membership
PertanikaJ. Soc. Sci. & Hum. Vol. 7 No. 2 1999 73
Rusli Mohd and Kenny Cheah Soon Lee
Among the environmental NGOs, the MNS is the oldest, has the largest membership and the most resourceful, in the sense that it has indicated to have more “im portant” sources of funds, compared with the other NGOs. In spite of these facts, the environmental NGOs are relatively smaller than the control group, the AAM. The membership of the AAM is about 30 times more than the MNS and its staff members is about eight times more than the that of the WWF.
The environmental NGOs and the AAM, however, share one common characteristic which is their strong dependence on their members for funds. Except for the WWF, which is a nonm em bersh ip o rgan iza tion , th e o th e r organizations indicated that contribution from membership dominate their budget.
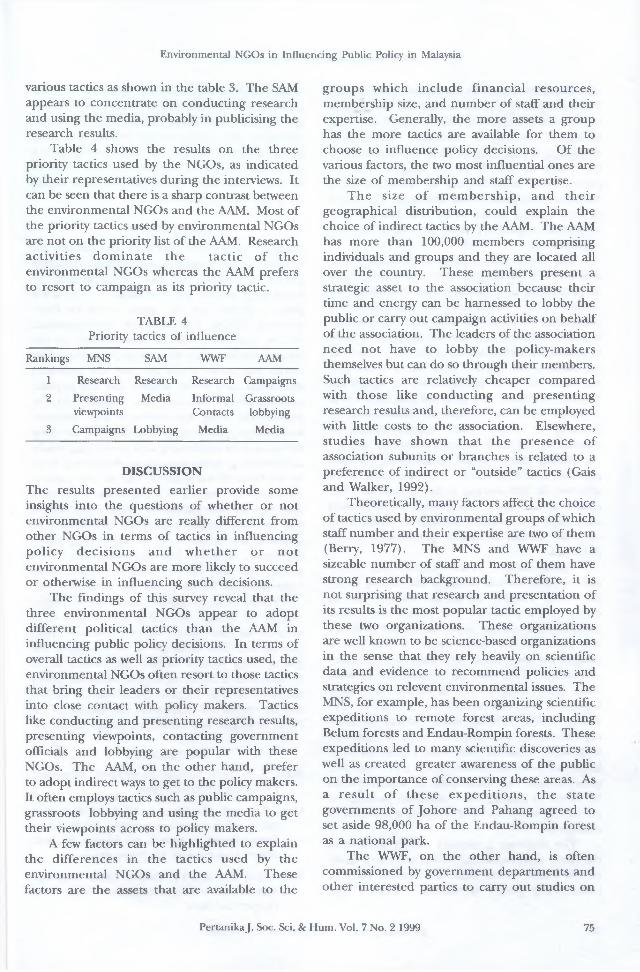
Tactics Influencing Policy Decisions Table 3 shows the results on the frequencies of use of tactics by the NGOs in trying to influence public policy decisions. Data presented in the table shows that there are more differences than sim ilarities in the use o f tactics by the environmental NGOs and the AAM. The only similarities are that both the environmental NGOs and the AAM frequently use the media as well as in providing speakers for purposes of seminar and other meetings. Also, both groups of NGOs sometimes testify at meetings and resort to letter-writing and telegram campaigns in promoting their interests on relevant issues.
The differences in tactics used by the NGOs are many. The environmental NGOs are more likely to use “inside” tactics such as conducting and presenting research results, presenting viewpoints, contacting officials informally, and lobbying. The AAM, on the other hand, are more likely to organize conferences, lobby their supporters, draft legislation as well as getting involved in court cases. The AAM, therefore, frequently resort to “outside” tactics in attempting to influence policy decisions.
Among the environmental NGOs, there are as many similarities as there are differences in the use of various tactics. It appears that conducting research and presenting its result, using the media, grassroots lobbying, entering into coalitions and drafting legislation are common tactics used by the environmental NGOs in trying to influence decisions. These NGOs seem to differ on the use of the other tactics.
The results also show that the MNS is the most tactical of the environmental NGOs in the sense that it has been using more tactics, both inside and outside, more frequently compared with the other two organizations. The MNS seems to target their members, the public as well as the policy makers as an overall strategy to influence policy decisions. Being a n onmembership organization, the WWF seldom resorts to using letter-writing and telegram campaigns. A strong asset of the WWF seems to be its research capability and it has made use of this asset in influencing public decisions through
TABLE 3Frequency in the use of tactics of influence
Tactics MNS WWF SAM Median AAMConducting and presenting research results 1 1 1 1 2Working with the media 1 1 1 1 1Providing speakers 1 1 2 1 1Personal presentation of viewpoints 1 1 2 1 2Lobbying 1 1 2 1 2Informal contacts with officials 1 1 2 1 2Letter-writing and telegram campaigns 1 2 2 2 2Organizing conferences 1 2 2 2 1Entering into coalitions 2 2 2 2 1Grassroots lobbying 2 2 2 2 1Drafting legislation 2 2 2 2 1Litigation 3 4 2 3 1Testifying at hearings 3 4 2 3 3Protest and demonstration 3 4 4 4 1Endorsing political candidates 4 4 4 4 4
Notes: 1. Used most of the time 2. Used sometimes3. Used rarely 4. Never used
74 Pertanika J. Soc. Sci. 8c Hum. Vol. 7 No. 2 1999
Environmental NGOs in Influencing Public Policy in Malaysia
various tactics as shown in the table 3. The SAM appears to concentrate on conducting research and using the media, probably in publicising the research results.
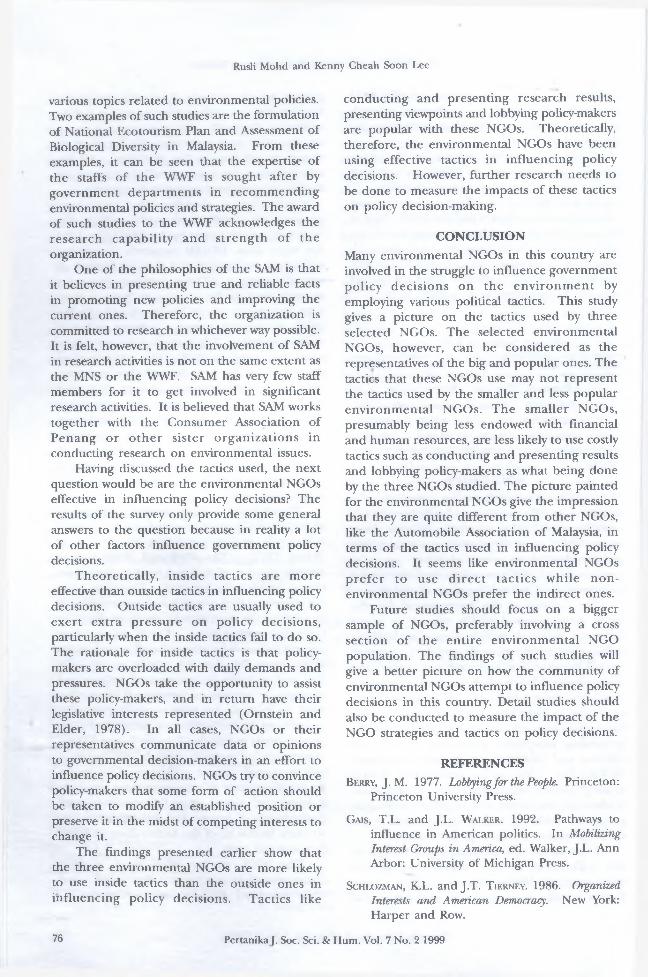
Table 4 shows the results on the three priority tactics used by the NGOs, as indicated by their representatives during the interviews. It can be seen that there is a sharp contrast between the environmental NGOs and the AAM. Most of the priority tactics used by environmental NGOs are not on the priority list of the AAM. Research activities d o m in ate the tactic o f the environmental NGOs whereas the AAM prefers to resort to campaign as its priority tactic.
TABLE 4Priority tactics of influence
Rankings MNS SAM WWF AAM
1 Research Research Research Campaigns
2 Presenting Media Informal Grassrootsviewpoints Contacts lobbying
3 Campaigns Lobbying Media Media
DISCUSSIONThe results presented earlier provide some insights into the questions of whether or not environmental NGOs are really different from other NGOs in terms of tactics in influencing policy decisions and w h e th e r o r n o t environmental NGOs are more likely to succeed or otherwise in influencing such decisions.
The findings of this survey reveal that the three environmental NGOs appear to adopt different political tactics than the AAM in influencing public policy decisions. In terms of overall tactics as well as priority tactics used, the environmental NGOs often resort to those tactics that bring their leaders or their representatives into close contact with policy makers. Tactics like conducting and presenting research results, presenting viewpoints, contacting government officials and lobbying are popular with these NGOs. The AAM, on the other hand, prefer to adopt indirect ways to get to the policy makers. It often employs tactics such as public campaigns, grassroots lobbying and using the media to get their viewpoints across to policy makers.
A few factors can be highlighted to explain the differences in the tactics used by the environmental NGOs and the AAM. These factors are the assets that are available to the
groups which include financial resources, membership size, and num ber of staff and their expertise. Generally, the more assets a group has the more tactics are available for them to choose to influence policy decisions. Of the various factors, the two most influential ones are the size of membership and staff expertise.
T he size o f m em bersh ip , and th e ir geographical distribution, could explain the choice of indirect tactics by the AAM. The AAM has more than 100,000 members comprising individuals and groups and they are located all over the country. These members present a strategic asset to the association because their time and energy can be harnessed to lobby the public or carry out campaign activities on behalf of the association. The leaders of the association need not have to lobby the policy-makers themselves but can do so through their members. Such tactics are relatively cheaper compared with those like conducting and presenting research results and, therefore, can be employed with little costs to the association. Elsewhere, studies have shown that the presence of association subunits or branches is related to a preference of indirect or “outside” tactics (Gais and Walker, 1992).
Theoretically, many factors affect the choice of tactics used by environmental groups of which staff num ber and their expertise are two of them (Berry, 1977). The MNS and WWF have a sizeable num ber of staff and most of them have strong research background. Therefore, it is not surprising that research and presentation of its results is the most popular tactic employed by these two organizations. These organizations are well known to be science-based organizations in the sense that they rely heavily on scientific data and evidence to recommend policies and strategies on relevent environmental issues. The MNS, for example, has been organizing scientific expeditions to remote forest areas, including Belum forests and Endau-Rompin forests. These expeditions led to many scientific discoveries as well as created greater awareness of the public on the importance of conserving these areas. As a re su lt o f these ex p ed itio n s, the state governments of Johore and Pahang agreed to set aside 98,000 ha of the Endau-Rompin forest as a national park.
The WWF, on the other hand, is often commissioned by government departments and other interested parties to carry out studies on
PertanikaJ. Soc. Sci. 8c Hum. Vol. 7 No. 2 1999 75
Rusli Mohd and Kenny Cheah Soon Lee
various topics related to environmental policies. Two examples of such studies are the formulation of National Ecotourism Plan and Assessment of Biological Diversity in Malaysia. From these examples, it can be seen that the expertise of the staffs of the WWF is sought after by government departm ents in recom m ending environmental policies and strategies. The award of such studies to the WWF acknowledges the research capability and s tren g th o f the organization.
One of the philosophies of the SAM is that it believes in presenting true and reliable facts in promoting new policies and improving the current ones. Therefore, the organization is committed to research in whichever way possible. It is felt, however, that the involvement of SAM in research activities is not on the same extent as the MNS or the WWF. SAM has very few staff members for it to get involved in significant research activities. It is believed that SAM works together with the Consumer Association of Penang o r o th e r sister o rgan izations in conducting research on environmental issues.
Having discussed the tactics used, the next question would be are the environmental NGOs effective in influencing policy decisions? The results of the survey only provide some general answers to the question because in reality a lot of other factors influence government policy decisions.
Theoretically, inside tactics are m ore effective than outside tactics in influencing policy decisions. Outside tactics are usually used to exert extra pressure on policy decisions, particularly when the inside tactics fail to do so. The rationale for inside tactics is that policymakers are overloaded with daily demands and pressures. NGOs take the opportunity to assist these policy-makers, and in return have their legislative interests represented (Ornstein and Elder, 1978). In all cases, NGOs or their representatives communicate data or opinions to governmental decision-makers in an effort to influence policy decisions. NGOs try to convince policy-makers that some form of action should be taken to modify an established position or preserve it in the midst of competing interests to change it.
The findings presented earlier show that the three environmental NGOs are more likely to use inside tactics than the outside ones in influencing policy decisions. Tactics like
conducting and presenting research results, presenting viewpoints and lobbying policy-makers are popular with these NGOs. Theoretically, therefore, the environmental NGOs have been using effective tactics in influencing policy decisions. However, further research needs to be done to measure the impacts of these tactics on policy decision-making.
CONCLUSIONMany environmental NGOs in this country are involved in the struggle to influence government policy decisions on the en v iro n m en t by employing various political tactics. This study gives a picture on the tactics used by three selected NGOs. The selected environmental NGOs, however, can be considered as the representatives of the big and popular ones. The tactics that these NGOs use may not represent the tactics used by the smaller and less popular environm ental NGOs. The sm aller NGOs, presumably being less endowed with financial and human resources, are less likely to use costly tactics such as conducting and presenting results and lobbying policy-makers as what being done by the three NGOs studied. The picture painted for the environmental NGOs give the impression that they are quite different from other NGOs, like the Automobile Association of Malaysia, in terms of the tactics used in influencing policy decisions. It seems like environmental NGOs p re fe r to use d irec t tactics w hile non- environmental NGOs prefer the indirect ones.
Future studies should focus on a bigger sample of NGOs, preferably involving a cross section of the entire environm ental NGO population. The findings of such studies will give a better picture on how the community of environmental NGOs attempt to influence policy decisions in this country. Detail studies should also be conducted to measure the impact of the NGO strategies and tactics on policy decisions.
REFERENCESB erry, J. M. 1977. Lobbying for the People. Princeton:
Princeton University Press.
G ais , T.L. and J.L. W alker . 1992. Pathways to influence in American politics. In Mobilizing Interest Groups in America, ed. Walker, J.L. Ann Arbor: University of Michigan Press.
S c h l o z m a n , K.L. and J .T . T ierney . 1986. Organized Interests and American Democracy. New York: Harper and Row.
76 Pertanika J. Soc. Sci. & Hum. Vol. 7 No. 2 1999
Environmental NGOs in Influencing Public Policy in Malaysia
O r n st e in , N.J. and S. E lde r . 1978. Interest Groups: M o h d , R and J.G. L aarm a n , 1994. Rainforest policies Lobbying and Policy-making. Washington, D.C.: and United States NGOs: Targets and tacticsCongressional Quarterly Press. of influence. Envir. Corner. 21(4): 320-325.
(Received: 16 May 2000)
PertanikaJ. Soc. Sci. 8c Hum. Vol. 7 No. 2 1999 77
Pertanika J. Soc. Sci. & Hum. 7(2): 79 - 89 (1999) ISSN: 0128-7702 © Universiti Putra Malaysia Press
Perubahan Produktiviti dan Kecekapan Teknikal Industri Perkilangan Elektrikal dan Elektronik di Malaysia
ALIAS RADAM*, SAZALI ABU MANSOR** dan SARAH SALWA ADNAN*** *Jabatan Pemiagaantani dan Sistem Maklumat, Universiti Putra Malaysia,
43400 UPM Serdang, Selangor; Malaysia ** Fakulti Ekonomi dan Pemiagaan, Universiti Malaysia Sarawak, Sarawak, Malaysia
*** Pusat Pengajian Siswazah Pengurusan Malaysia (MGSM),Universiti Putra Malaysia, 43400 UPM Serdang, Selangor
Kata kunci: produktiviti, pertubuhan ekonomi, teknik-teknik dan komposisi produktiviti, indeks malmquist, DEA
ABSTRAK
Kajian mengenai produktiviti terns menarik minat para penyelidik memandangkan kepentingan sumbangan produktiviti ke atas pertumbuhan ekonomi. Kajian mengenainya bukan sahaja menekankan kepada teknik-teknik pengukuran tetapi juga menumpukan kepada komposisi produktiviti. Pemahaman mengenai komponen-komponen yang terkandung dalam produktiviti dapat membantu penggubal dasar mengenai pasti punca ketidakcekapan sesebuah industri. Melalui penggunaan indeks Malmquist dan pendekatan DEA, kajian ini bertujuan mengukur produktiviti bagi sektor elekrikal dan elektronik (E&E). Melalui keadah ini, produktiviti dapat dipecahkan kepada dua komponen iaitu perubahan teknikal dan perubahan kecekapan. Produktiviti bagi sektor E&E telah mengalami pertumbuhan yang menggalakkan melalui sumbangan peningkatan dalam kecekapan dan perubahan teknikal.
ABSTRACT
The interest on the study of productivity has continued to draw considerable passion among researchers due to the significant contribution of productivity to economic growth. The studies on productivity have not only focused on the techniques of measurement, but also the composition of productivity. Understanding the components of productivity offers important insights for policy makers into the sources of inefficiency among industries. By employing the DEA technique and Malmquist index, this study attempts to measure the productivity of the electrical and electronic industry. Through this technique, productivity can be decomposed into two, namely the technical change and efficiency change. The E&E sector has experienced an encouraging productivity growth through technical and efficiency changes.
PENDAHULUANIndustri elek trikal dan e lek tron ik (E&E) merupakan salah satu sektor yang sedang tumbuh dengan pesatnya di dalam ekonomi Malaysia. Ia menguasai sektor perkilangan dari segi keluaran, pendapatan eksport dan peluang pekerjaan. Sektor ini mencapai indeks pengeluaran 262.3 di dalam tahun 1993 dan telah tumbuh pada kadar 15.7 peratus setahun antara tahun 1992 dan 1993 (Maisom, 1995). H am pir semua subsektor termasuklah pengilang radio dan
televisyen, sem ik o n d u k to r dan lain-lain komponen elektronik dan kabel serta wayar m encatatkan kadar pertum buhan dua-digit, masing-masingnya 16.6 peratus, 15.4 peratus dan 14.7 peratus antara tahun 1992 hingga 1993 (MOT, 1994).
Industri E&E menyumbang 61.4 peratus jum lah eksport pengilangan atau 45.5 peratus daripada jum lah eksport Malaysia, berjumlah RM55.1 bilion dalam tahun 1993. Sektor ini mencatatkan 39.4 peratus pertumbuhan antara
Alias Radam, Sazali Abu Mansor dan Sarah Salwa Adnan
tahun 1992 dan 1993 d engan subsektor semikonduktor dan alat elektronik penggunaan merupakan subsektor yang mempunyai kadar pertum buhan yang tertinggi dalam eksport. Eksport sektor telah melebihi sasaran Pelan Induk Perindustrian (PIP) sebanyak 10 peratus setahun. Sektor E&E juga merupakan penerima terbesar pelaburan dan penyumbang utama kepada pekerjaan di dalam sektor perkilangan. Pada tahun 1993, sektor ini menarik RM2.25 bilion pelaburan dan mewujudkan sejumlah 240,787 peluang pekerjaan.
Industri E&E diramalkan akan terns menjadi pem angkin u tam a di dalam stra teg i pembangunan industri di Malaysia. Sebagaimana yang dicadangkan oleh (UNIDO, 1992), sektor E&E akan menjadi tunjang kepada usaha-usaha pembangunan perindustrian ke arah mencapai madamat status negara perindustrian.
Walaupun sektor E&E telah memberikan sum bangan yang signifikan kepada pembangunan negara, terdapat beberapa isu dan m asalah yang b erkaitan dengan in d u stri berkenaan. Ini termasuklah isu persekitaran bahan buangan bertoksid, dominasi pelaburan luar, kurangnya penyertaan pelaburan tempatan yang besar, keperluan guna tenaga mahir dan hubungannya dengan in d u stri kecil dan sed erh an a , kebo lehan penyelid ikan dan pembangunan (P&P) tempatan dan masalah kekurangan tenaga pekerja.
Industri E&E amat bergantung kepada kom ponen-kom ponen yang diim port untuk keluaran. Ini menyumbang kepada kos yang tinggi bagi keluarannya. Kos yang tinggi bagi penghantaran, dan peningkatan upah telah meningkatkan kos input perindustrian yang memberi kesan terhadap daya saing Malaysia. Industri E&E di Malaysia perlu beroperasi dengan lebih cekap dalam usaha m en ingkatkan produktiviti dan daya saing. Oleh itu kajian ini bertujuan untuk melihat perubahan produktiviti dan kecekapan teknikal di dalam industri pembuatan elektrik dan elektronik (E&E) di Malaysia meliputi jangka masa 1983-1993.
K ajian-kajian te rh ad ap p e rtu m b u h an produktiviti telah banyak dilakukan, terutamanya bagi negara-negara maju di dalam pelbagai sektor.Antaranya kajian oleh Mao dan Koo (1996) di China, Pardey et at. (1994) dan Arnade(1994) di Amerika Syarikat, Amade (1992) di Latin Amerika dan di sektor-sektor pertanian yang lain; Berg et al (1992) di Sweden, dan
Fukuyama (1995) di Jepun di sektor perbankan. Sementara di sektor pengangkutan pula kajian- kajian telah dilakukan oleh Viton (1995) di Amerika Syarikat. Di sektor elektrik pula, kajian telah dilakukan oleh Fare et a l (1990) di Illinois, dan Yaisawarng dan Klein (1994) di Amerika Syarikat.
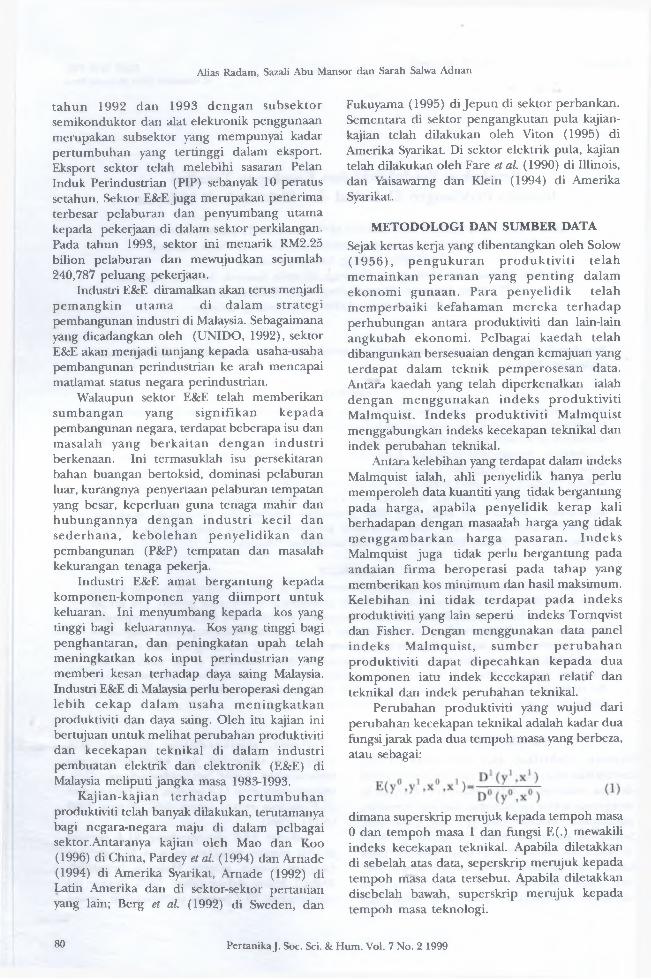
METODOLOGI DAN SUMBER DATASejak kertas keija yang dibentangkan oleh Solow (1956), p en g u k u ran p ro d u k tiv iti te lah m em ainkan peranan yang p en tin g dalam ekonom i gunaan . Para penyelid ik telah m em perbaiki kefaham an m ereka terhadap perhubungan antara produktiviti dan lain-lain angkubah ekonomi. Pelbagai kaedah telah dibangunkan bersesuaian dengan kemajuan yang terdapat dalam teknik pem perosesan data. Antara kaedah yang telah diperkenalkan ialah dengan m enggunakan indeks produktiv iti Malmquist. Indeks produktiv iti M alm quist menggabungkan indeks kecekapan teknikal dan indek perubahan teknikal.
Antara kelebihan yang terdapat dalam indeks Malmquist ialah, ahli penyelidik hanya perlu memperoleh data kuantiti yang tidak bergantung pada harga, apabila penyelidik kerap kali berhadapan dengan masaalah harga yang tidak m enggam barkan h arg a pasaran . Indeks Malmquist juga tidak perlu bergantung pada andaian firma beroperasi pada tahap yang memberikan kos minimum dan hasil maksimum. Kelebihan ini tidak te rdapat pada indeks produktiviti yang lain seperti indeks Tornqvist dan Fisher. Dengan menggunakan data panel indeks M alm quist, su m b er p e ru b ah an produktiviti dapat dipecahkan kepada dua komponen iatu indek kecekapan relatif dan teknikal dan indek perubahan teknikal.
Perubahan produktiviti yang wujud dari perubahan kecekapan teknikal adalah kadar dua fungsi jarak pada dua tempoh masa yang berbeza, atau sebagai:
dimana superskrip merujuk kepada tempoh masa 0 dan tempoh masa 1 dan fungsi E(.) mewakili indeks kecekapan teknikal. Apabila diletakkan di sebelah atas data, seperskrip merujuk kepada tempoh masa data tersebut. Apabila diletakkan disebelah bawah, superskrip merujuk kepada tempoh masa teknologi.
80 PertanikaJ. Soc. Sci. 8c Hum. Vol. 7 No. 2 1999
Perubahan Produktiviti dan Kecekapan Teknikal Industri Perkilangan Elektrikal dan Elektronik di Malaysia
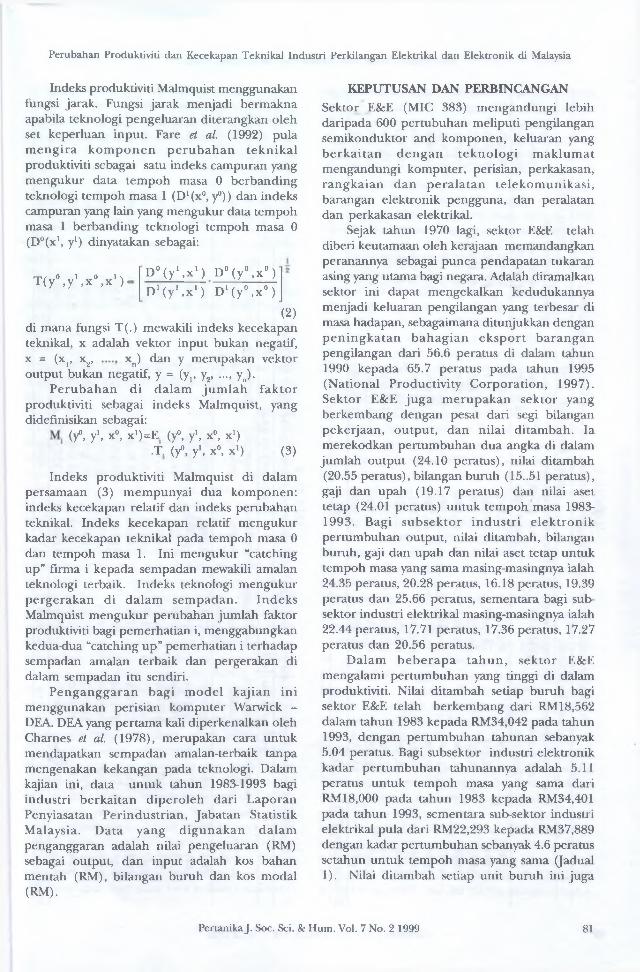
Indeks produktiviti Malmquist menggunakan fungsi jarak. Fungsi jarak menjadi bermakna apabila teknologi pengeluaran diterangkan oleh set keperluan input. Fare et al (1992) pula m eng ira k o m p o n en p e ru b ah an tekn ikal produktiviti sebagai satu indeks campuran yang mengukur data tempoh masa 0 berbanding teknologi tempoh masa 1 (D^x0, y0)) dan indeks campuran yang lain yang mengukur data tempoh masa 1 berbanding teknologi tempoh masa 0 (D°(x1, y1) dinyatakan sebagai:
T (y ° ,y 1,x ° ,x 1):D °(y1>x! ) D° (y ° ,x ° ) D1(y1jX1) D1(y°,x° )
(2)di mana fungsi T(.) mewakili indeks kecekapan teknikal, x adalah vektor input bukan negatif, x = (Xj, xg, xn) dan y merupakan vektor output bukan negatif, y = (y1? y2, ..., yn).
P eru b ah an di dalam ju m la h fak to r produktiviti sebagai indeks Malmquist, yang didefinisikan sebagai:
(y°, y1, x°, x1)=E. (y°, y1, x°, x1).T (y°, y1, x°, x1) (3)
Indeks produktiviti Malmquist di dalam persamaan (3) mempunyai dua komponen: indeks kecekapan relatif dan indeks perubahan teknikal. Indeks kecekapan relatif mengukur kadar kecekapan teknikal pada tempoh masa 0 dan tempoh masa 1. Ini mengukur “catching up” firma i kepada sempadan mewakili amalan teknologi terbaik. Indeks teknologi mengukur pergerakan di dalam sem padan. Indeks Malmquist mengukur perubahan jum lah faktor produktiviti bagi pemerhatian i, menggabungkan kedua-dua “catching u p ” pemerhatian i terhadap sempadan amalan terbaik dan pergerakan di dalam sempadan itu sendiri.
Penganggaran bagi m odel kajian ini menggunakan perisian komputer Warwick - DEA. DEA yang pertama kali diperkenalkan oleh Chames et al (1978), merupakan cara untuk mendapatkan sempadan amalan-terbaik tanpa mengenakan kekangan pada teknologi. Dalam kajian ini, data untuk tahun 1983-1993 bagi industri berkaitan diperoleh dari Laporan Penyiasatan Perindustrian, Jabatan Statistik Malaysia. Data yang d igunakan dalam penganggaran adalah nilai pengeluaran (RM) sebagai output, dan input adalah kos bahan mentah (RM), bilangan buruh dan kos modal (RM).
KEPUTUSAN DAN PERBINCANGANSektor E&E (MIC 383) mengandungi lebih daripada 600 pertubuhan meliputi pengilangan semikonduktor and komponen, keluaran yang b erk a itan d en g an tek n o lo g i m aklum at mengandungi komputer, perisian, perkakasan, rangkaian dan p era la tan telekom unikasi, barangan elektronik pengguna, dan peralatan dan perkakasan elektrikal.
Sejak tahun 1970 lagi, sektor E&E telah diberi keutamaan oleh kerajaan memandangkan peranannya sebagai punca pendapatan tukaran asing yang utama bagi negara. Adalah diramalkan sektor ini dapat mengekalkan kedudukannya menjadi keluaran pengilangan yang terbesar di masa hadapan, sebagaimana ditunjukkan dengan pen in g k a tan bah ag ian ek sp o rt baran g an pengilangan dari 56.6 peratus di dalam tahun1990 kepada 65.7 peratus pada tahun 1995 (National Productivity C orporation, 1997). Sektor E&E ju g a m erupakan sektor yang berkembang dengan pesat dari segi bilangan pekerjaan, ou tput, dan nilai ditam bah. Ia merekodkan pertum buhan dua angka di dalam jum lah output (24.10 peratus), nilai ditambah (20.55 peratus), bilangan buruh (15..51 peratus), gaji dan upah (19.17 peratus) dan nilai aset tetap (24.01 peratus) untuk tempoh masa 1983- 1993. Bagi subsek tor in d u stri e lek tron ik pertum buhan output, nilai ditambah, bilangan buruh, gaji dan upah dan nilai aset tetap untuk tempoh masa yang sama masing-masingnya ialah 24.35 peratus, 20.28 peratus, 16.18 peratus, 19.39 peratus dan 25.66 peratus, sementara bagi subsektor industri elektrikal masing-masingnya ialah 22.44 peratus, 17.71 peratus, 17.36 peratus, 17.27 peratus dan 20.56 peratus.
Dalam b eb e rap a tah u n , sek tor E&E mengalami pertum buhan yang tinggi di dalam produktiviti. Nilai ditambah setiap buruh bagi sektor E&E telah berkembang dari RM 18,562 dalam tahun 1983 kepada RM34,042 pada tahun 1993, dengan pertum buhan tahunan sebanyak 5.04 peratus. Bagi subsektor industri elektronik kadar pertum buhan tahunannya adalah 5.11 peratus untuk tempoh masa yang sama dari RM18,000 pada tahun 1983 kepada RM34,401 pada tahun 1993, sementara sub-sektor industri elektrikal pula dari RM22,293 kepada RM37,889 dengan kadar pertumbuhan sebanyak 4.6 peratus setahun untuk tempoh masa yang sama (Jadual 1). Nilai ditambah setiap unit buruh ini juga
Pertanika J. Soc. Sci. 8c Hum. Vol. 7 No. 2 1999 81

PertanikaJ. Soc. Sci. & H
um. V
ol. 7 N
o. 2 1999
JADUAL 1Produktiviti buruh industri perkilangan elektronik dan elektrikal Malaysia, 1983-1993
Industri Elektronik Industri Elektrikal Semua IndustriNilai ditambah per Output buruh Nilai ditambah per Output Nilai ditambah per Output per
unit buruh (RM’000) unit buruh buruh unit buruh buruh(RM’000) (RM’000) (RM’000) (RM’000) (RM’000)
1983 18,006 65,511 22,292 70,983 18,562 66,2201984 21,914 74,134 20,231 73,297 21,706 74,0301985 21,642 69,023 28,116 94,422 22,419 72,0721986 21,480 78,908 22,108 82,078 21,544 79,2271987 21,296 95,541 22,408 88,736 21,410 94,8421988 19,999 98,272 25,766 96,640 20,632 98,0931989 23,319 112,788 25,891 111,001 23,600 112,5931990 23,469 113,438 27,521 103,310 24,186 111,7231991 27,765 133,438 27,521 103,803 27,729 129,0381992 32,022 147,919 31,700 111,482 31,975 142,5791993 33,401 159,970 37,889 118,326 34,042 154,021
Pertumbuhan (%) 5.11 9.17 4.60 4.73 5.04 8.59
JADUAL 2Produktiviti modal, intensiti modal dan kandungan nilai ditambah industri perkilangan elektronik dan elektrik Malaysia, 1983-1993
Industri Elektronik Industri Elektrikal Semua IndustriProduktiviti Intensiti Kandungan Produktiviti Intensiti Kandungan Produktiviti Intensiti Kandungan
modal modal nilai modal modal nilai modal modal nilaiditambah ditambah ditambah
1983 1.4881 12.0998 27.49 0.7605 29.3133 31.41 4.8842 14.3315 28.031984 1.4377 15.2416 29.56 0.5812 34.8092 27.60 5.0489 17.6583 29.321985 1.1724 18.4595 31.36 0.6266 44.8702 29.78 4.1622 21.6300 31.111986 1.2881 16.6765 27.22 0.4356 50.7526 26.94 4.2094 20.1128 27.191987 1.2882 16.5311 22.29 0.4979 45.0065 25.25 4.6321 19.4555 22.571988 1.1308 17.6856 20.35 0.6279 41.0318 26.66 4.5805 20.2485 21.031989 1.1139 20.9342 20.67 0.6781 38.1800 23.32 5.6600 22.8176 20.961990 0.8853 26.5103 20.77 0.8821 32.7316 27.95 5.5638 27.3366 21.651991 0.8884 31.2517 20.81 0.6829 40.3024 26.51 4.6340 32.5955 21.491992 0.9422 33.9870 21.65 1.2000 26.4165 28.44 8.2586 32.8775 22.431993 0.9052 36.8979 20.88 0.8695 43.5756 32.02 5.4686 37.8519 22.10
Pertumbuhan (%) -5.37 10.48 -4.06 5.04 -0.44 -0.13 3.29 8.50 -3.55
Alias R
adam, Sazali Abu
Mansor
dan Sarah
Salwa A
dnan

Perubahan Produktiviti dan Kecekapan Teknikal Industri Perkilangan Elektrikal dan Elektronik di Malaysia
menggambarkan jum lah kekayaan yang dapat dijanakan oleh syarikat, berbanding bilangan pekeijanya. Ianya mempengaruhi kecekapan pengurusan, sikap pekerja, kesan harga dan permintaan terhadap barangan. Nisbah yang tinggi menunjukkan kesan keuntungan terhadap faktor buruh di dalam proses m enjanakan kekayaan. Nisbah yang rendah menunjukkan prosedur pekerjaan yang tidak menguntungkan sep erti p em belian b ahan m en tah dan perkhidmatan yang tinggi, pembaziran masa dan bahan dan kadar bayaran gaji yang tidak berpatutan.
Peningkatan di dalam nilai ditambah bagi setiap buruh di dalam tempoh masa 1983 hingga 1993 adalah disebabkan oleh peningkatan di dalam jum lah output setiap buruh dengan kadar purtumbuhan 8.5 peratus setahun dari RM66,220 kepada RM154,021. Arah aliran yang serupajuga dapat dilihat bagi subsektor industri elektronik dan industri elektrikal masing-masingnya dengan kadar pertum buhan 9.17 dan 4.73 peratus setahun. Jum lah o u tp u t setiap b u ruh ini mengukur saiz output yang dihasilkan oleh setiap pekerja di dalam syarikat. Kadar yang rendah menunjukkan polisi perniagaan menghadapi pusing ganti yang ren d ah te tap i m argin keuntungan dan nilai ditambah yang tinggi, dan profil dan kualiti keluaran yang rendah.
Walaupun terdapat peningkatan di dalam nilai output setiap buruh yang tinggi, kandungan nilai ditambah bagi sektor E&E menunjukkan arah aliran yang berkurangan dalam tempoh masa kajian. K andungan nilai d itam bah mengukur tahap penggunaan pembelian bahan mentah dan perkhidm atan serta perubahan dalam perbezaan harga antara keluaran dengan pembelian. Nisbah yang rendah menunjukkan kos yang tinggi dalam pembelian bahan mentah dan perkhidmatan, kualiti keluaran yang rendah dan persaingan harga yang rendah. Jadual 2 menunjukkan arah aliran yang berkurangan bagi kandungan nilai ditambah untuk sektor E&E. Kandungan nilai ditam bah bagi subsektor industri elektronik berkurangan dari 27.49 peratus pada tahun 1983 kepada 20.88 peratus tahun 1993. Bagi subsektor industri elektrikal, kandungan nilai ditambah berkurangan dari 31.41 peratus pada tahun 1983 kepada 28.44 peratus pada tahun 1992 dan meningkat kepada 32.02 p era tu s pada tah u n 1993. W alau bagaimanapun, purata pertumbuhan kandungan nilai ditambah bagi subsektor industri elektrikal
adalah berkurangan sebanyak 0.13 peratus untuk tempoh masa 1983 hingga 1993. Bagi sektor E&E k ese lu ru h an pula, k an d u n g an nilai d itam bah m enunjukkan arah aliran yang berkurangan, dengan kadar 3.55 peratus setahun dari 28.03 peratus kepada 22.10 peratus untuk tempoh masa yang sama.
Arah aliran yang berkurangan di dalam kandungan nilai ditambah bagi sektor E&E adalah disebabkan tingginya bahan-bahan dan komponen yang diimport. Ini berpunca dari keadaan sektor E&E di Malaysia yang dikuasai oleh syarikat-syarikat multinasional (MNC) yang terlibat terutamanya dalam pemasangan dan pembungkusan komponen-komponen elektronik yang diimport untuk dieksport semula. Kadar pem indahan teknologi yang perlahan dan penyertaan pihak swasta yang rendah dalam aktiviti penyelidikan dan pembangunan tempatan merupakan kelemahan dan rendahnya aktiviti nilai ditambah di dalam sektor E&E (National Productivity Corporation, 1997).
Pertumbuhan dua digit dalam nilai ditambah setiap buruh dan jum lah output setiap buruh dalam tempoh masa 1983-93 adalah disebabkan peranan pro-aktif yang diambil oleh sektor E&E dan permintaan yang tinggi di dalam keluaran E&E di dunia. Ia seterusnya disokong oleh usaha- usaha k erajaan u n tu k m em prom osi dan membina persekitaran yang menggalakan bagi pembangunan sektor E&E. Dasar fiskal yang d ip e rk en a lk an ialah bagi m enggalakkan pelaburan, perasingan, eksport, penyelidikan dan pembangunan (P&P), pem bangunan sumber m anusia dan m em perluaskan kem udahan infrastruktur dan daya saing.
Pertumbuhan nilai ditambah setiap buruh di dalam sek to r E&E ju g a d isebabkan peningkatan di dalam kadar aset tetap setiap buruh atau intensiti modal. Intensiti modal adalah kadar yang digunakan untuk mengukur aset tetap yang diagihkan kepada setiap buruh atau kadar modal terhadap buruh. Kadar ini digunakan untuk mengukur sama ada industri berintensifkan-modal atau berintensifkan buruh. Kadar intensiti modal yang rendah menunjukkan sesuatu industri itu bergantung kepada kaedah yang berintensifkan buruh dan menggunakan input yang berteknologi rendah. Dalam tempoh masa kajian, in tensiti m odal sektor E&E berkembang sebanyak 8.50 peratus setahun dari RM14,332 di dalam tahun 1983 kepada RM37,852 pada tahun 1993. Hal ini selaras dengan usaha-
PertanikaJ. Soc. Sci. 8c Hum. Vol. 7 No. 2 1999 83
Alias Radam, Sazali Abu Mansor dan Sarah Salwa Adnan
usaha untuk mengautomasikan aktiviti-aktiviti pengeluaran di dalam sektor ini. Di samping itu usaha kerajaan seperti mengurangkan kadar cukai korporat dari 34 peratus dalam tahun1991 kepada 30 peratus pada tahun 1995 dan pengurangan di dalam cukai pembangunan kepada 2 peratus telah memperbaiki persekitaran pelaburan negara. Ini telah menggalakkan syarikat-syarikat m eningkatkan p e laburan perniagaan mereka.
Pertumbuhan yang tinggi di dalam intensiti modal di dalam subsektor industri elektronik tidak diikuti oleh penggunaan aset yang berkesan dan seterusnya memberikan kesan kemerosotan produktiviti modal pada kadar 5.37 peratus setahun dalam tempuh 1983 - 1993. Kekurangan tenaga buruh menyumbang penggunaan kilang yang tidak optimum. Walau bagaimanapun, kadar produktiviti modal bagi subsektor-subsektor industri elektrikal dan sektor E&E keseluruhan- nya telah berkembang masing-masingnya dengan kadar 5.04 dan 3.29 peratus untuk tempoh masa 1983-1993.
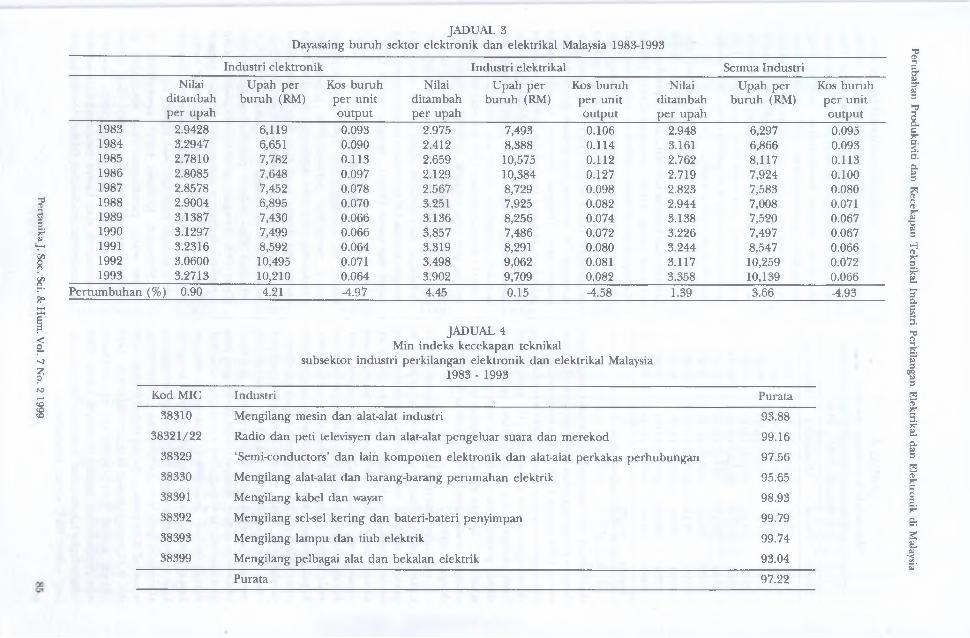
Pertumbuhan di dalam nilai ditambah setiap buruh juga menyumbang dalam pertumbuhan kadar upah bagi sektor E&E bagi setiap buruh dengan kadar pertumbuhan 3.66 peratus setahun dari RM6,297 pada tahun 1983 meningkat kepada RM10,139 pada tahun 1993. Arah aliran yang serupa juga dapat dilihat bagi kedua-dua subsektor industri elektronik dan industri elektrikal masing-masingnya meningkat dengan kadar 4.21 dan 0.15 peratus setahun (Jadual 3). Peningkatan dalam kos buruh telah disebabkan oleh persaingan dalam mendapatkan tenaga buruh di negara ini terutamanya buruh mahir dan separuh mahir. Walau bagaimanapun, nilai d itam bah setiap upah bagi sek tor E&E menunjukkan pertumbuhan dengan kadar 1.39 peratus setahun dengan indeks 2.95 pada tahun 1983 kepada 3.36 pada tahun 1993; subsektor industri elektronik berkembang 0.90 peratus setahun (2.94 pada tahun 1983 kepada 3.27 pada tahun 1993) dan subsektor elektrikal berkembang sebanyak 1.39 peratus setahun (2.98 pada tahun 1993 kepada 3.90 pada tahun 1993). Peningkatan di dalam persaingan kos buruh dapat diimbangi dengan penurunan kos buruh untuk setiap unit pengeluaran. Kos buruh seunit pengeluaran untuk sektor E&E menunjukkan arah aliran yang berkurangan dengan kadar 4.93 peratus setahun dengan 0.095 pada tahun 1983 kepada 0.066 pada tahun 1993.
INDEKS PRODUKTIVm MALMQUISTDua isu utama yang ditekankan dalam pengiraan indeks produktiviti Malmquist untuk industri E&E di Malaysia. Pertama, bagaimana untuk mengukur produktiviti dan kecekapan teknikal dalam jangka masa tertentu. Isu kedua ialah bagaimana produktiviti berubah, dan jika wujud perubahan, ia dapat dipecahkan kepada kesan ‘catching-up’ dan kesan pergerakan sempadan.
Jad u a l 4, m en u n ju k k an p u ra ta n ila i sempadan indeks kecekapan Farrell untuk setiap in d u stri. Set k em u n g k in an p en g e lu a ran mengandungi sejumlah 88 pemerhatian tetapi hanya 53.41 peratus sahaja yang berada di sempadan. Purata kecekapan teknikal untuk industri E&E di Malaysia adalah tinggi iaitu 97.22 peratus. Hanya 37.5 peratus daripada industri meijipunyai kecekapan teknikal yang kurang dari p u ra ta . In d u s tri yang m em punyai tah ap kecekapan teknikal yang tinggi termasuk industri m engilang sel-sel kering dan bateri-bateri penyimpanan (38392), industri mengilang lampu dan tiub elektrik (38393), industri radio dan peti televisyen dan alat-alat pengeluar suara dan merakam (38321/22), industri mengilang kabel dan wayar (38391) dan industri semikonduktor dan lain komponen elektronik serta alat-alat perkakas perhubungan (38329).
Industri yang berada di sempadan pengeluaran dipanggil ‘best-practice’ dan memper- lih a tk an kecekapan m aksim um dalam penggunaan sumber-sumber. Nilai indeks pada 1.000 menunjukkan sesuatu industri terletak pada sempadan yang terbaik (‘best-practice’). Nilai indeks yang kurang dari 1.000 pula menunjukkan ketidakcekapan dalam penggunaan sumber- sumber dibandingkan dengan industri yang berada di sempadan yang terbaik.
Keputusan kecekapan teknikal tahunan diringkaskan dalam Jadual 5. Ia menunjukkan industri E&E mencapai purata antara 95.58 dan 98.63 peratus output oleh industri yang mengikut amalan terbaik sepanjang tahun 1983 hingga 1993. Peningkatan yang sedikit sepanjang tempoh masa tersebut mencadangkan jurang yang sempit antara industri piawai dan industri yang mengikut amalan terbaik.
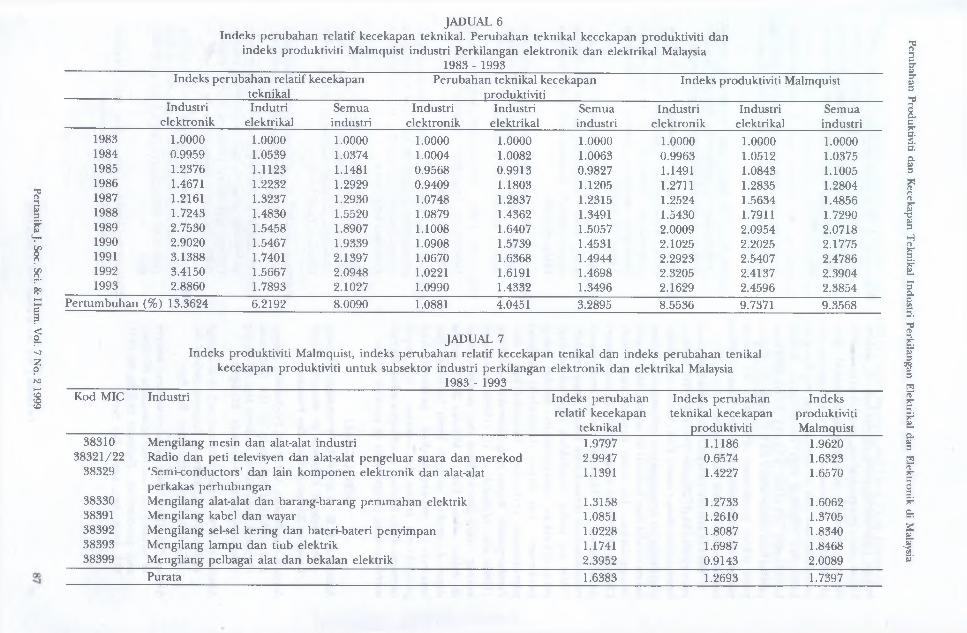
Jad u a l 6 m enun jukkan penganggaran pengiraan indeks produktiviti Malmquist, indeks perubahan relatif kecekapan teknikal dan indeks perubahan teknikal kecekapan produktiviti bagi industri E&E di Malaysia. Indeks-indeks ini m en u n ju k k an p e r tu m b u h a n p ro d u k tiv iti
84 Pertanika J. Soc. Sci. & Hum. Vol. 7 No. 2 1999
Pertanika J. Soc. Sci. &
Hum
. Vol. 7
No. 2
1999
JADUAL 3Dayasaing buruh sektor elektronik dan elektrikal Malaysia 1983-1993
Industri elektronik Industri elektrikal Semua IndustriNilai
ditambah per upah
Upah per buruh (RM)
Kos buruh per unit output
Nilai ditambah per upah
Upah per buruh (RM)
Kos buruh per unit output
Nilai ditambah per upah
Upah per buruh (RM)
Kos buruh per unit output
1983 2.9428 6,119 0.093 2.975 7,493 0.106 2.948 6,297 0.0951984 3.2947 6,651 0.090 2.412 8,388 0.114 3.161 6,866 0.0931985 2.7810 7,782 0.113 2.659 10,575 0.112 2.762 8,117 0.1131986 2.8085 7,648 0.097 2.129 10,384 0.127 2.719 7,924 0.1001987 2.8578 7,452 0.078 2.567 8,729 0.098 2.823 7,583 0.0801988 2.9004 6,895 0.070 3.251 7,925 0.082 2.944 7,008 0.0711989 3.1387 7,430 0.066 3.136 8,256 0.074 3.138 7,520 0.0671990 3.1297 7,499 0.066 3.857 7,486 0.072 3.226 7,497 0.0671991 3.2316 8,592 0.064 3.319 8,291 0.080 3.244 8,547 0.0661992 3.0600 10,495 0.071 3.498 9,062 0.081 3.117 10,259 0.0721993 3.2713 10,210 0.064 3.902 9,709 0.082 3.358 10,139 0.066
Pertumbuhan (%) 0.90 4.21 -4.97 4.45 0.15 -4.58 1.39 3.66 -4.93
JADUAL 4 Min indeks kecekapan teknikal
subsektor industri perkilangan elektronik dan elektrikal Malaysia1983 - 1993
Kod MIC Industri Purata38310 Mengilang mesin dan alat-alat industri 93.88
38321/22 Radio dan peti televisyen dan alat-alat pengeluar suara dan merekod 99.1638329 ‘Semi-conductors’ dan lain komponen elektronik dan alat-alat perkakas perhubungan 97.5638330 Mengilang alat-alat dan barang-barang perumahan elektrik 95.6538391 Mengilang kabel dan wayar 98.9338392 Mengilang sel-sel kering dan bateri-bateri penyimpan 99.7938393 Mengilang lampu dan tiub elektrik 99.7438399 Mengilang pelbagai alat dan bekalan elektrik 93.04
Purata 97.22
Perubahan Produktiviti
dan K
ecekapan T
eknikal Industri
Perkilangan E
lektrikal dan
Elektronik di
Malaysia
Alias Radam, Sazali Abu Mansor dan Sarah Salwa Adnan
JADUAL 5 Min indeks kecekapan teknikal
industri perkilangan elektronik dan elektrikal di Malaysia 1983 - 1993
Tahun Purata Maksimum Minimum
1983 97.81 100.00 (3/8) 92.301984 95.58 100.00 (4/8) 85.771985 97.07 100.00 (5/8) 86.991986 96.82 100.00 (5/8) 83.921987 96.53 100.00 (5/8) 83.741988 98.10 100.00 (6/8) 91.531989 96.51 100.00 (4/8) 88.991990 96.18 100.00 (3/8) 90.391991 97.71 100.00 (4/8) 91.121992 98.49 100.00 (4/8) 95.281993 98.63 100.00 (4/8) 95.87
Purata 97.22
disebabkan oleh perubahan teknikal yang dikira dengan menganggarkan kecekapan teknikal dari tahun 1983 hingga 1993. Kajian ini menunjukkan hubungan songsang dalam indeks teknologi yang diterangkan dalam persamaan (1), apabila nilai lebih daripada 1.0 menunjukkan peningkatan dalam produktiviti disebabkan oleh perubahan teknikal. Indeks ini menetapkan tahun 1983 sebagai tahun asas dengan indeks bersamaan dengan 1.000.
Indeks produktiviti Malmquist menunjukkan kadar pertumbuhan produktiviti sebanyak 9.36 peratus setahun bagi semua industri. Ini mencadangkan pada tahun 1993, industri E&E mengeluarkan 138.54 peratus lebih output seunit sumber yang digunakan berbanding tahun 1983. Pecahan indeks produktiviti Malmquist memberi arah untuk mengira peningkatan produktiviti. Keputusan ini menerangkan sepanjang tempoh masa kajian, suatu peningkatan dalam kecekapan produktiviti telah dicatat. Sepanjang tempoh masa itu, perubahan teknikal produktiviti m eningkat sebanyak 3.29 peratus setahun. Walaupun begitu, didapati tiada aliran yang jelas di dalam kadar perubahan kecekapan teknikal. Pertum buhan produktiviti dikaitkan dengan kesan perubahan teknikal jika industri bergerak ke arah sempadan yang baru. Indeks produktiviti Malmquist pula memperlihatkan pertumbuhan sebanyak 8.55 peratus dalam industri elektronik dan 9.74 peratus dalam industri elektrikal. Arah a liran kadar p ertu m b u h an produk tiv iti meningkat secara signifikan selepas tahun 1988 iaitu selepas tahun-tahun kemerosotan ekonomi bagi sektor E&E secara keseluruhan.
Industri elektronik menunjukkan pertum buhan sebanyak 13.36 peratus dalam indeks perubahan re la tif kecekapan teknikal dan industri e lektrikal sebanyak 6.22 peratus. M anakala secara keseluruhan sektor E&E mengalami pertum buhan 8.01 peratus iaitu p e rtu m b u h an yang am at m enggalakkan . Sementara itu dalam indeks perubahan teknikal kecekapan produktiviti, industri elektronik m encatatkan p ertu m b u h an sebanyak 1.08 peratus, elektrikal 4.04 peratus dan E&E secara keseluruhan 3.29 peratus.
Jadual 7 m enunjukkan produktiviti dan kom ponen indeks u n tu k su b sek to r E&E berdasarkan kepada kod MIC. Purata produktiviti setahun yang dikira m enggunakan indeks Malmquist untuk semua subsektor dalam industri E&E menunjukkan peningkatan. Peningkatan indeks sebanyak 1.74 m enunjukkan proses pengeluaran dalam industri E&E telah meningkat sebanyak 74 peratus jika dibandingkan dengan tahun asas. Dengan m elihat kepada setiap subsektor, industri mengilang pelbagai alat dan bekalan elektrik (38399) menunjukkan produktiviti tertinggi dengan indeks 2.0089. Selepas itu, industri mengilang mesin dan alat-alat industri (38310) dengan indeks 1.96, industri mengilang lampu dan tiub elektrik (38393) dengan 1.85 dan industri mengilang sel-sel kering dan bateri- bateri penyimpanan (38392) dengan indeks 1.83. Subsektor lain terletak pada purata produktif dengan indeks 1.6 sementara industri mengilang kabel dan wayar (38391) dengan indeks 1.37.
KESIMPULANKajian ini menggunakan Indeks Malamquist untuk m engukur pertum buhan produktiviti. Pendekatan DEA telah digunakan untuk mengira komponen fungsi jarak bagi indeks Malmquist dan membentuk sempadan amalan terbaik bagi sektor E&E di Malaysia. Indeks perubahan teknikal dan indeks perubahan kecekapan d ipero leh dengan m em bandingkan setiap subsektor terhadap sempadan amalan terbaik dengan teknologi pengeluaran yang sama. Indeks produktiviti Malmquist kemudiannya dikira sebagai hasil dari dua indeks ini.
Walaupun terdapat kajian produktiviti di dalam sektor pem buatan yang dijalankan di Malaysia seperti Maisom (1995) dan Tham(1995), kajian mereka menggunakan kaedah ekonometrik dan hanya menumpukan kepada pertumbuhan produktiviti faktor. Melalui kaedah
86 PertanikaJ. Soc. Sci. 8c Hum. Vol. 7 No. 2 1999
Pertanika J. Soc. Sci. 8c
Hum
. Vol. 7
No. 2
1999
JADUAL 6Indeks perubahan relatif kecekapan teknikal. Perubahan teknikal kecekapan produktiviti dan
indeks produktiviti Malmquist industri Perkilangan elektronik dan elektrikal Malaysia1983 - 1993
Indeks perubahan relatif kecekapan teknikal
Perubahan teknikal kecekapan produktiviti
Indeks produktiviti Malmquist
Industri Indutri Semua Industri Industri Semua Industri Industri Semuaelektronik elektrikal industri elektronik elektrikal industri elektronik elektrikal industri
1983 1.0000 1.0000 1.0000 1.0000 1.0000 1.0000 1.0000 1.0000 1.00001984 0.9959 1.0539 1.0374 1.0004 1.0082 1.0063 0.9963 1.0512 1.03751985 1.2376 1.1123 1.1481 0.9568 0.9913 0.9827 1.1491 1.0843 1.10051986 1.4671 1.2232 1.2929 0.9409 1.1803 1.1205 1.2711 1.2835 1.28041987 1.2161 1.3237 1.2930 1.0748 1.2837 1.2315 1.2524 1.5634 1.48561988 1.7243 1.4830 1.5520 1.0879 1.4362 1.3491 1.5430 1.7911 1.72901989 2.7530 1.5458 1.8907 1.1008 1.6407 1.5057 2.0009 2.0954 2.07181990 2.9020 1.5467 1.9339 1.0908 1.5739 1.4531 2.1025 2.2025 2.17751991 3.1388 1.7401 2.1397 1.0670 1.6368 1.4944 2.2923 2.5407 2.47861992 3.4150 1.5667 2.0948 1.0221 1.6191 1.4698 2.3205 2.4137 2.39041993 2.8860 1.7893 2.1027 1.0990 1.4332 1.3496 2.1629 2.4596 2.3854
Pertumbuhan (%) 13.3624 6.2192 8.0090 1.0881 4.0451 3.2895 8.5536 9.7371 9.3568
JADUAL 7Indeks produktiviti Malmquist, indeks perubahan relatif kecekapan tenikal dan indeks perubahan tenikal
kecekapan produktiviti untuk subsektor industri perkilangan elektronik dan elektrikal Malaysia1983 - 1993
Kod MIC Industri Indeks perubahan Indeks perubahan Indeksrelatif kecekapan teknikal kecekapan produktiviti
teknikal produktiviti Malmquist38310 Mengilang mesin dan alat-alat industri 1.9797 1.1186 1.9620
38321/22 Radio dan peti televisyen dan alat-alat pengeluar suara dan merekod 2.9947 0.6574 1.632338329 ‘Semi-conductors’ dan lain komponen elektronik dan alat-alat 1.1391 1.4227 1.6570
perkakas perhubungan38330 Mengilang alat-alat dan barang-barang perumahan elektrik 1.3158 1.2733 1.606238391 Mengilang kabel dan wayar 1.0851 1.2610 1.370538392 Mengilang sel-sel kering dan bateri-bateri penyimpan 1.0228 1.8087 1.834038393 Mengilang lampu dan tiub elektrik 1.1741 1.6987 1.846838399 Mengilang pelbagai alat dan bekalan elektrik 2.3952 0.9143 2.0089
Purata 1.6383 1.2693 1.7397
Perubahan Produktiviti
dan K
ecekapan T
eknikal Industri
Perkilangan Elektrikal
dan Elektronik
di M
alaysia
Alias Radam, Sazali Abu Mansor dan Sarah Salwa Adnan
bukan paramatrik yang dijalankan di dalam kajian ini, pertum buhan produktiviti boleh diam ati m elalui p eru b ah an teknikal dan p eru b ah an kecekapan . Pem bahagian ini membolehkan kita mengenai pasti sumbangan kemajuan teknikal dan pembaikkan dalam kecekapan teknikal kepada pertum buhan produktiviti dalam sektor E&E di Malaysia. Kajian pada sektor pembuatan seumpama ini hanya pernah dijalankan oleh Alias dan Shazali (1999), untuk sektor kimia di Malaysia.
Dari kajian ini didapati pertumbuhan yang m enggalakkan dalam p roduk tiv iti secara keseluruhan dalam sektor E&E. Walau bagaimana pun kajian ini menunjukkan pertumbuhan dalam faktor modal bagi industri ini adalah tidak begitu menggalakkan. Ini selari dengan kajian oleh Choong (1995) dan Tham (1995) ke atas industri p em buatan di Malaysia yang m en d ap a ti pertumbuhan produktiviti faktor yang rendah. Oleh itu polisi hendaklah dijuruskan bagi m eningkatkan p en g g u n aan m odal yang berkesan. In i dap a t d ip ero leh i m elalui pen ek an an te rh ad ap Penyelid ikan dan Pembangunan. Kajian yang dijalankan oleh Fong(1986) dan Abibulah et al. (1994) mendapati kurang usaha penyelidikan dan pembangunan di dalam sektor E&E. Melalui R&D, modal dapat digunakan dengan lebih berkesan dan seterusnya m eningkatkan p e rtu m b u h an produktiviti sektor berkenaan. Ini dapat menambahkan lebihan bandingan sektor ini dan meningkatkan penguasaan di pasaran dunia.
BIBLIOGRAFIA bibu l la h , H.S. et al 1994. Permindahan Teknologi
dalam Industri Elektronik di Malaysia. Kuala Lumpur: Dewan Bahasa dan Pustaka
A u a s , R. dan S hazali, AM. 1999. Productivity change and technical efficiency in the Malaysian chemical and related products Manufacturing industries. Jumal Produktiviti 17: 64-92.
A r n a d e , C. 1992. Productivity and technical change in Brazilian agriculture. Technical Bulletin No. 1811. U.S. Dept. Agr., Econ. Res. Serv.
A rn a d e , C .A . 1994. Using data envelopment analysis to measure international agricultural efficiency and productivity. Technical Bulletin No. 1831, U.S. Dept. Agr., Econ. Res. Serv.
B erg , S. A., F . R. F o r s u n d and E. S. J a n s e n . 1992. Malmquist indices of productivity growth during the deregulation of Norwegian banking, 1980-1989. The Scandinavian Journal of Economics 94: 211-228.
C h a r n e s , A., W. C o p p e r , and E. R h o d e s 1978 Measuring the efficiency of decision making units. European Journal of Operational Research. 2: 429-44.
C h o o n g , P.Y. 1995. Total factor productivity growth of Malaysian manufacturing industries. Economic Bulletin, 3. MARA Institute of Technology.
F ar e , R., S. G ro ssk o pf , B. L in d g r e n and P. Roos1992. Productivity changes in Swedish pharmacies, 1980-1989: A nonparam etric Malmquist approach. Journal of Productivity Analysis 3: 85-101
4
Far e , R., S. G ro ssk o pf , S. Yaisa w a r n g , S. K. Li and Z. Wang 1990. Productivity growth in Illinois electric utilities. Resources and Energy Economics 12(4): 383-398.
F arrell , M. 1957. The measurement of productive efficiency. Journal of the Royal Statistical Society. Series A, General 120. 3: 253-290.
F o n g , C.O. 1986. Technological Leap: Malaysian Industry in Transition. Singapore: Oxford University Press.
F u k u y a m a , H. 1995 Measuring efficiency and productivity growth in Japanese banking: a nonparametric approach. Applied Financial Economics 5(2): 95-107.
M a iso m , A. 1995. Total Factor Productivity in the Electrical and Electronics Industry. Third Malaysian Economic Conference, MIER, Kuala Lumpur, June 14-15.
M a lm q u ist , S. 1953. Index numbers and indifference surfaces. Tradajos de Estadistica, 4(1): 209-242.
M a o , W. and W. W. Kcx). 1996. Productivity growth, technology progress, and efficiency change in Chinese agricultural production from 1984 to1993. Agricultural Economics Report No. 362.
Ministry of International Trade and Industry, Malaysia. 1996. Second Industrial Master Plan 1996-2005. Percetakan Zainon Kassim (M) Sdn Bhd.
National Productivity Corporation. 1997. Malaysia Productivity Report 1996. Malaysia.
88 PertanikaJ. Soc. Sci. 8c Hum. Vol. 7 No. 2 1999
Perubahan Produktiviti dan Kecekapan Teknikal Industri Perkilangan Elektrikal dan Elektronik di Malaysia
P ardey , P . G., J. C. B arba r a n , and D. K la n s . 1994. A New Look at State-Level Productivity Growth in U. S. Agriculture. Evaluating Agricultural Research and Productivity in an Era of Resource Scarcity, ed. W. Burt Sundquist. Staff Report P94-2, U.S. Dept. Agr. and Applied Econ., University of Minnesota.
S o l o w , R. 1956. A contribution to the theory of econom ic growth. Quarterly Journal of Econometrics 70: 65-94.
T h a m , S.Y. 1995. Productivity growth and development in Malaysia. The Singapore Economic Review 40: 41 -63.
UNIDO 1985. Medium and Long Term Industrial Master Plan, Malaysia 1986-1995: Electronic and Electrical Industry. Report No. Vol. II Part 8, report prepared for the Government of Malaysia.
VrroN, P. A. 1995. Changes in multi-mode bus transit efficiency, 1988-1992. Working Paper. Ohio State University Department of City and Regional Planning.
Ya isa w arng , S. and J.D. K lein 1994. The effects of sulfur dioxide controls on productivity change in the U. S. electric power industry. The Review of Economics and Statistics. 76(3): 447-460.
(Received: 7 August 1998)
PertanikaJ. Soc. Sci. 8c Hum. Vol. 7 No. 2 1999 89
Pertanika J. Soc. Sci. & Hum. 7(2): 91 - 95 (1999) ISSN: 0128-7702 © Universiti Putra Malaysia Press
Factors Influencing the Occurrence o f Forest Offenses in a Peninsular Malaysia State
RUSLI MOHDDepartment of Forest Management
Faculty of Forestry Universiti Putra Malaysia, 43400 UPM Serdang,
Selangor, Malaysia
Keywords: forest law enforcement, forest offenses, illegal logging, economics of crime
ABSTRAK
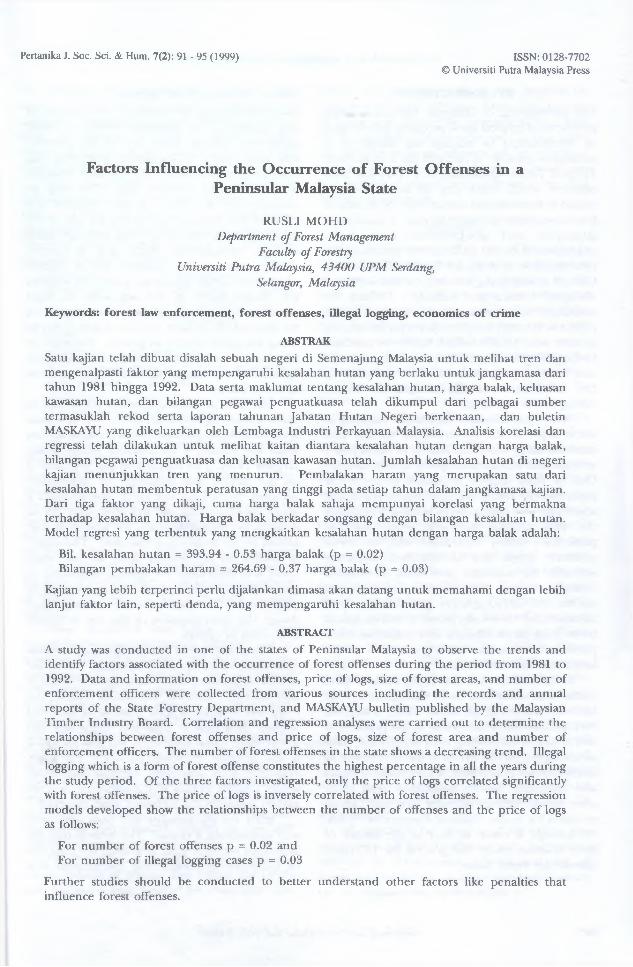
Satu kajian telah dibuat disalah sebuah negeri di Semenajung Malaysia untuk melihat tren dan mengenalpasti faktor yang mempengaruhi kesalahan hutan yang berlaku untuk jangkamasa dari tahun 1981 hingga 1992. Data serta maklumat ten tang kesalahan hutan, harga balak, keluasan kawasan hutan, dan bilangan pegawai penguatkuasa telah dikumpul dari pelbagai sumber termasuklah rekod serta laporan tahunan Jabatan Hutan Negeri berkenaan, dan buletin MASKAYU yang dikeluarkan oleh Lembaga Industri Perkayuan Malaysia. Analisis korelasi dan regressi telah dilakukan untuk melihat kaitan diantara kesalahan hutan dengan harga balak, bilangan pegawai penguatkuasa dan keluasan kawasan hutan. Jumlah kesalahan hutan di negeri kajian menunjukkan tren yang menurun. Pembalakan haram yang merupakan satu dari kesalahan hutan membentuk peratusan yang tinggi pada setiap tahun dalam jangkamasa kajian. Dari tiga faktor yang dikaji, cuma harga balak sahaja mempunyai korelasi yang bermakna terhadap kesalahan hutan. Harga balak berkadar songsang dengan bilangan kesalahan hutan. Model regresi yang terbentuk yang mengkaitkan kesalahan hutan dengan harga balak adalah:
Bil. kesalahan hutan = 393.94 - 0.53 harga balak (p = 0.02)Bilangan pembalakan haram = 264.69 - 0.37 harga balak (p = 0.03)
Kajian yang lebih terperinci perlu dijalankan dimasa akan datang untuk memahami dengan lebih lanjut faktor lain, seperti denda, yang mempengaruhi kesalahan hutan.
ABSTRACT
A study was conducted in one of the states of Peninsular Malaysia to observe the trends and identify factors associated with the occurrence of forest offenses during the period from 1981 to 1992. Data and information on forest offenses, price of logs, size of forest areas, and number of enforcement officers were collected from various sources including the records and annual reports of the State Forestry Department, and MASKAYU bulletin published by the Malaysian Timber Industry Board. Correlation and regression analyses were carried out to determine the relationships between forest offenses and price of logs, size of forest area and number of enforcement officers. The number of forest offenses in the state shows a decreasing trend. Illegal logging which is a form of forest offense constitutes the highest percentage in all the years during the study period. Of the three factors investigated, only the price of logs correlated significantly with forest offenses. The price of logs is inversely correlated with forest offenses. The regression models developed show the relationships between the number of offenses and the price of logs as follows:
For number of forest offenses p = 0.02 and For number of illegal logging cases p = 0.03
Further studies should be conducted to better understand other factors like penalties that influence forest offenses.
Rusli Mohd
INTRODUCTIONThe government of Malaysia, like many other producers of tropical wood products, has pledged its commitment to manage the forests in a sustainable manner, in line with the International Tropical Timber Organization (iT lO ) year 2000 objective which states that all wood products traded in international market must be produced from sustainably managed forests. A number of strateg ies and program m es have been implemented by the government, including the establishment of National Timber Certification Council as well as the formulation and testing of Malaysia’s criteria and indicators (MC&I) for sustainable forest management. Recendy, funds collected through timber export cess amounting to more than RM 350 million have been allocated by the government to finance forest development and research projects in an effort to speed up the a tta in m en t o f the sustainable forest management objective.
While commendable efforts are ongoing in some aspects, the government should also examine other important aspects of forest policy to make sure that they complement one another. One of these aspects is related to forest law enforcement. Forest law enforcement is a critical aspect of forest management because it regulates the re la tio n sh ip betw een m any p arties, particularly timber companies, with the forest resource. Illegal and uncontrolled harvesting activities, for example, may cause irreparable dam age to the forest which subsequently influences its long-term productivity and sustainability. Generally, forest authority should try to keep forest offenses to a minimum level, particularly those that cause great harm to the forest and the environment.
In spite of the fact that forest offenses pose obstacles to sustainable forest management, little has been studied about them. Litde, if any, has been published on the extent of the problem as well as factors influencing their occurrence. This paper highlights the trends in the occurrence of forest offenses in one state of Peninsular Malaysia and identifies factors associated with their occurrence. These offenses are only those provided for in the National Forestry Act, 1984. No attempt is made to look at the nature of these offenses under the general law of crime, namely the Penal Code.
Factors Influencing Forest Offences Forest offenses can be defined as the conduct of any activity, or its omission, which is illegal under the existing forest law of the country. The main piece of legislation governing the conduct of such activities in Peninsular Malaysia is the National Forestry Act, 1984 and its am endm ents of 1993. Forest offenses are criminal acts because they violate the law of the state and the person committing them are liable to legal punishment. According to Curzon(1979), crime is “an unlawful act or default which is an offense against the public and renders the person guilty of the act liable to legal punishment.” Forest offenses have impact on the State which, in turn, has the responsibility to bring the guilty person to justice. Theories on the economics of crime, therefore should shed light on factors which influence the occurrence of forest offenses.
The body of literature on the economics of crime focuses on two main issues. The first issue is on individuals decision about criminal activity while the second is on criminal justice policy (Hirsch 1979). The concern of the first issue is on the factors that influence an individualis decision whether or not he or she commits a crime. Studies done on this first issue try to develop the supply function for crimes or also known as the deterrence function. The object of studies on the second issue, on the other hand, is to determine the optimal probability of punishment and the optimal type and severity of punishment. Such studies entail, among other things, the determination of the loss to society as a result of crimes.
Economists argue that criminals are rational individuals who respond in a natural way to the incentives provided by the environment in which they operate. Rational individuals balance the costs and benefits of their possible actions and allocate their time to legal and illegal activities accordingly. These individuals will take an action if the benefits obtained outweigh the costs. Following such argument, rational individuals would commit crimes if the expected benefits gained outweigh the expected costs incurred.
What are the benefits and costs associated with committing a crime? The benefit that the individual stands to gain as a result of crime can be measured by establishing the amount that
92 PertanikaJ. Soc. Sci. 8c Hum. Vol. 7 No. 2 1999
Factors Influencing Forest Offenses in a Malaysian State
the offender, in a market-like setting, would have to be offered in order to pursuade him against committing the crime. Inferences about these benefits can be made by measuring the extent of change in the volume of crimes that result from a given change in costs.
T he ex p ec ted costs (o r ex p ected punishment) to the individual comprise of several parts. These are the size of punishm ent, probability of arrest and probability of conviction. Expected punishment is given by the following formula (Reynolds 1996):
Expected = Punishment Xpunishment (E.P.) Probability of Arrest
X Probability of Conviction
where:punishment = jail sentenceprobability of arrest = num ber of arrests/total num ber of offensesprobability of conviction = num ber ofconvictions/number of arrests
The discussions on benefits and costs of committing crimes presented above can suggest factors that influence forest offenses. The benefits that an offender stands to gain from committing forest offenses should be related to the revenue that he expects to obtain from the sale or processing of stolen logs. Therefore, the sale price of logs should influence the occurrence of forest offenses. It is expected that the higher the price of logs the higher will be the occurrence of forest offenses, if o ther factors remain constant.
Costs associated with forest offenses are related to the chances that an offender will be apprehended and later convicted and the penalty that he pays if he is convicted. The number of enforcement officers and the size of forest areas should influence the chances of arrest and, hence, the occurrence of forest offenses. The more the enforcement officers, the greater the likelihood for inspection activities to be carried out, and therefore, the higher probability of arrest. Consequently, the more the enforcement officers, the lesser the chances of forest offenses occurring. Therefore, it is expected that the num ber of enforcement officers is inversely related with forest offenses.
The size of forest area should also influence the probability of arrest. The bigger the forest area, the more time needed for inspection and
patrol, and the lower will be the chances for detection of forest offenses. Therefore, the size of forest area should be inversely related with the occurrence of forest offenses. In this study, the number of forest offenses will be correlated with the sale price of logs, the size of forest area and number of enforcement officers in the state forestry department.
METHODThis study was conducted in one of the states in Peninsular Malaysia and it was chosen for reason of convenience. The total forest area of the state is about 260,000 ha. and this represents about 23 percent of the total land area of the state. Income from forestry activities, particularly logging, contributes significantly to the state’s economy. For the purpose of administration, the state is divided into three forest districts.
Two categories of data were collected for the study. The first category is related to the occurrence of forest offenses in the state while the second is on factors that are predicted to influence these offenses. For the first category, data on the num ber and types of forest offenses for each year during the 1981 to 1992 period were gathered from the records kept by the State Forestry Department. Data on log prices delivered at mill gate, num ber of enforcement officers in the state and size of productive forests belong to the second category and these were collected from various sources including the records kept by the Malaysian Timber Industry Board and the State Forestry Department itself.
For purposes of analysis, forest offenses were divided into six categories based on the provisions of the National Forestry Act, 1984. These categories were: a) illegal cutting and removing of forest produce from a perm anent reserve forest or state land, b) illegal searching, collecting, removing, or manufacturing of any non-wood forest produce, c) illegal clearing for purpose of cultivation, d) trespassing, e) illegal possession of forest produce for conversion, and f) violating license conditions. Graphical analysis will be done in order to observe the trends in the occurrence of the various offenses over the study period.
Models will be developed to relate the occurrence of forest offenses with log prices, number of enforcement officers and size of forest area by means of linear regression which can be mathematically expressed as:
Pertanika J. Soc. Sci. 8c Hum. Vol. 7 No. 2 1999 93
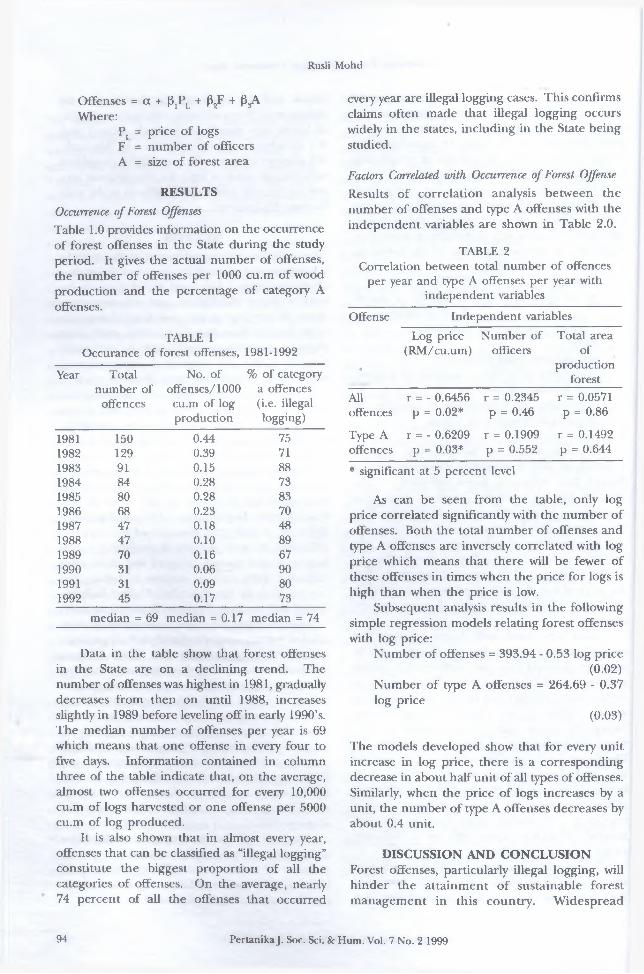
Rusli Mohd
Offenses = a + PjPL + P2F + (3^Where:
Pj = price of logs F = number of officers A = size of forest area
RESULTSOccurrence of Forest OffensesTable 1.0 provides information on the occurrence of forest offenses in the State during the study period. It gives the actual number of offenses, the number of offenses per 1000 cu.m of wood production and the percentage of category A offenses.
TABLE 1Occurance of forest offenses, 1981-1992
Year Total No. of % of categorynumber of offenses/1000 a offences
offences cu.m of log (i.e. illegalproduction Egging)
1981 150 0.44 751982 129 0.39 711983 91 0.15 881984 84 0.28 731985 80 0.28 831986 68 0.23 701987 47 0.18 481988 47 0.10 891989 70 0.16 671990 31 0.06 901991 31 0.09 801992 45 0.17 73
median = 69 median = 0.17 median = 74
Data in the table show that forest offenses in the State are on a declining trend. The number of offenses was highest in 1981, gradually decreases from then on until 1988, increases slightly in 1989 before leveling off in early 1990’s. The median number of offenses per year is 69 which means that one offense in every four to five days. Information contained in column three of the table indicate that, on the average, almost two offenses occurred for every 10,000 cu.m of logs harvested or one offense per 5000 cu.m of log produced.
It is also shown that in almost every year, offenses that can be classified as “illegal logging” constitute the biggest proportion of all the categories of offenses. On the average, nearly 74 percent of all the offenses that occurred
every year are illegal logging cases. This confirms claims often made that illegal logging occurs widely in the states, including in the State being studied.
Factors Correlated with Occurrence of Forest Offense Results of correlation analysis between the number of offenses and type A offenses with the independent variables are shown in Table 2.0.
TABLE 2Correlation between total number of offences
per year and type A offenses per year with independent variables
Offense Independent variables
A
Log price (RM/cu.um)
Number of officers
Total area of
productionforest
Alloffences
r = - 0.6456 p = 0.02*
r = 0.2345 p = 0.46
r = 0.0571 p = 0.86
Type A offences
r = - 0.6209 p = 0.03*
r = 0.1909 p = 0.552
r = 0.1492 p = 0.644
* significant at 5 percent level
As can be seen from the table, only log price correlated significantly with the num ber of offenses. Both the total num ber of offenses and type A offenses are inversely correlated with log price which means that there will be fewer of these offenses in times when the price for logs is high than when the price is low.
Subsequent analysis results in the following simple regression models relating forest offenses with log price:
Number of offenses = 393.94 - 0.53 log price(0.02)
Number of type A offenses = 264.69 - 0.37 log price
(0.03)
The models developed show that for every unit increase in log price, there is a corresponding decrease in about half unit of all types of offenses. Similarly, when the price of logs increases by a unit, the num ber of type A offenses decreases by about 0.4 unit.
DISCUSSION AND CONCLUSIONForest offenses, particularly illegal logging, will hinder the attainm ent of sustainable forest m anagem ent in this country. W idespread
94 PertanikaJ. Soc. Sci. & Hum. Vol. 7 No. 2 1999

Factors Influencing Forest Offenses in a Malaysian State
occurrence of these offenses means that the effective size of productive forest areas is decreased and this can upset the planning for sustainable harvest. In addition, a large sum of money in the form of premium is not collected by the government when the forest areas are illegally logged. Such money could have been invested in development projects that would enhance the productivity and, subsequently, the sustainability of the forest. Due to these reasons, the authority concerned should regularly inspect logging activities to ensure that the loggers abide by the rules and regulations stipulated for them.
The results presented in the earlier part of this paper should be much awaited by the authority. In terms of num ber of offenses, at least, the trend is declining. However, number of offenses alone do no t truly reflect the seriousness of the problem. There can be few incidence of illegal logging activities but the amount of logs removed or the areas cut in each of the incidence can be huge. The state forest authority, therefore, should not be complacent in its enforcement activities once they found out that the num ber of offenses is declining over the years. It should be a cause for concern in the state being studied as it was shown that illegal logging cases constitute a big proportion of the total number of offenses in the state.
The results of regression analysis do not support the hypotheses made earlier on the relationships between num ber of offenses and log price, size of forest area and num ber of enforcement officers. It was expected that forest offenses would increase with increase in log price, and that it would decrease with decrease in forest area and increase in enforcement officers. However, only log price was correlated significantly with num ber of offenses. It was found that the higher the log price the lower will be the num ber of offenses. This result shows that loggers will not be motivated to steal more logs when the price of logs increases. It can be argued that an increase in log price already provides enough incentives for the loggers to cut their own forest concession areas. There is no necessity to log other areas in order to obtain a comparable margin of profit.
As far as inspection activities are concerned, the findings indicate that these should be carried more often in times when the prices of logs are low than in times when the prices of logs are high. Inspection activities should be planned
taking into consideration the projections made for log prices. The authority should monitor the developm ent in log prices and plan inspection activities accordingly.
The above findings, however, should be treated as very preliminary and more studies should be carried out in other states to confirm them. Future studies may want to use a more disaggregated data for log price, for example, price for different groups of commercial species. Such studies should also try to determine the probability of arrests and probability of conviction for forest offenses and, consequently, analyse their influence on these offenses. More detail data will have to be collected for such studies. The ultimate aim of such studies is to find out whether or not increasing penalties deter the occurrence of forest offenses.
In conclusion, achieving sustainable forest management requires congruent and balanced efforts in many facets of forest policy. The government should not only focus on certain p rogram m es o r pro jects to enhance the productivity and sustainability of the forests but ignore other aspects which may be equally im portan t in achieving sustainable forest management. One important facet of forest policy is its enforcement. Lack of enforcement can lead to widespread occurrence of illegal activities. The occurrence of forest offenses, such as illegal logging and encroachment, can significantly hinder the attainment of sustainable forest management. As little is known on the occurrence of forest offenses in this country, more research should be carried out in the future. Comprehensive research programmes can lead to the form ulation of improved strategies to control the occurrence of forest offenses.
REFERENCESC u r z o n , L.B. 1989. Dictionary of Law. Third Edition.
Kuala Lumpur: International Law Book Services.
H irsch , Z.H. 1979. Law and Economics: An Introductory Analysis. New York: Academic Press.
R eyn o l d s , M.O. 1 9 9 6 . Crime and Punishment in Texas: Update. National Center for Public Analysis Policy Report No. 202.
(Received: 23 February 1999)
Pertanika J. Soc. Sci. & Hum. Vol. 7 No. 2 1999 95
Pertanika J. Soc. Sci. & Hum. 7(2): 97 - 102 (1999) ISSN: 0128-7702 © Universiti Putra Malaysia Press
Cadangan Model Teoritikal bagi Menilai Kecekapan Pelaburan dalam Pembangunan Tanah Rizab Melayu
NOR GHANI MD. NOR dan MOHD AZLAN SHAH ZAIDI Jabatan Ekonomi Analisis dan PoUsi Awam
Fakulti Ekonomi Universiti Kebangsaan Malaysia
43600 Bangi, Selangor, Malaysia
AHMAD ZAINUDDIN ABDULLAH Jabatan Ekonomi
Universiti Putra Malaysia 43400 UPM Serdang, Selangor, Malaysia
Kata Kunci: Tanah Rizab Melayu, oportunisme, pelaburan optimal, kos transaksi
ABSTRAK
Tanah Rizab Melayu (TRM) meliputi 33.55% tanah di Malaysia yang boleh diusahakan secara produktif. Malangnya banyak kajian yang telah dibuat menunjukkan sumber pengeluaran yang sebegini besar tidak berjaya digembleng oleh pemilik untuk mencapai potensi ekonominya yang sebenar. Penyelesaian kepada masalah ketidakcekapan penggunaan sumber ini memerlukan teori yang boleh menerangkan mengapa keadaan ini wujud. Walaupun ada beberapa idea yang telah dilontarkan untuk menjelaskan fenomena ini, idea-idea tersebut tidak berdasarkan teori ekonomi yang tegar. Kertas ini mengusulkan satu teori ekonomi yang mudah tetapi tegar, untuk menerangkan (dari segi ekonomi) mengapa pemilik-pemilik TRM membuat pelaburan yang lebih rendah dari tahap yang cekap, sekali gus menerangkan mengapa TRM kurang dibangunkan potensi ekonominya. Kertas ini menyarankan bahawa kos transaksi dan oportunisme akibat dari pemilikan bertindih boleh mengakibatkan kurang berlakunya pembangunan TRM.
ABSTRACT
The Malay Reserve (land) accounts for 33.55% of productive land in Malaysia. Unfortunately, several studies have shown that the owners of such a massive source of productive resource are not able to develop its full economic potential. The solution to this inefficient utilisation of resource requires a theory capable of explaining the source of the problem. Even though several ideas have been put forward to explain this phenomenon, few if any, are based on rigorous economic theory. This paper proposes a simple (but rigorous) theory to explain why economically rational owners of the Malay Reserve land make suboptimal investment for the development of their land. In doing so, the theory explains the underdevelopment of the Malay Reserve land. It was found that transaction cost and opportunism arising from multiple ownership and small numbers bargaining are the major factors contributing to underdevelopment of Malay Reserve land.
PENGENALANDi Malaysia, Tanah Rizab Melayu (TRM) meliputi 33.55% tanah yang boleh diusahakan secara produktif. Malangnya banyak kajian yang telah dibuat (Nik Mohd Zain Nik Yusof 1996; Shaik Mohd N or Alam 1996; Nik H ashim Nik
Mustapha, et al., 1996) menunjukkan sumber yang sebegitu besar itu tidak dapat digembleng untuk m encapai potensi ekonom inya yang sebenar. Implikasi ketidakcekapan penggunaan faktor pengeluaran ini kepada pertum buhan negara di masa akan datang sepatutnya mendapat
Nor Ghani Md. Nor, Mohd Azlan Shah Zaidi dan Ahmad Zainuddin Abdullah
perhatian penggubal dasar. Tambahan pula, ketidakcekapan ini juga mempunyai kesan kepada pengagihan pendapatan antara kaum dan antara kelas kerana pemilikan TRM adalah jelas tidak merata.
Isu dan m asalah pem bangunan TRM m em ang sering dibahaskan dan te rdapat beberapa faktor yang telah dilontarkan oleh penyelidik lepas (Nik Mohd Zain Nik Yusof 1996; Shaik Mohd Nor Alam 1996; Nik Hashim Nik Mustapha, et al., 1996) sebagai penghalang kepada pembangunan TRM. Antara faktor-faktor penghalang ini adalah mekanisma perwarisan tanah yang selalu mengakibatkan pemilikan bertindih dan pembahagian kepada lot-lot yang kecil yang tidak ekonomik untuk diusahakan. Faktor-faktor lain adalah lokasi TRM yang tidak strategik dan kurangnya pengetahuan pemilik ten tang cara-cara membangunkan tanah.
Satu kekurangan yang ketara di dalam lontaran-lontaran idea di atas adalah ketiadaan usaha un tuk m em pertahankannya dengan menggunakan kerangka teori dan prinsip asas ekonom i yang tegar (rigorous). D aripada perspektif teori, kegagalan membangunkan TRM membawa implikasi bahawa terdapat lebihan yang masih belum dieksploitasi. Persoalan yang masih belum terjawab adalah mengapakah keadaan ini wujud sedangkan agen-agen ekonomi dianggap rasional dan sentiasa berusaha untuk memaksimumkan kebajikan diri. Kertas ini akan cuba menjawab persoalan di atas sekali gus mengatasi kelemahan yang ada.
Seperti yang telah dinyatakan, salah satu masalah yang sering diutarakan sebagai halangan kepada pembangunan TRM ialah pemilikan aset bertindih (multiple ownership). Kertas ini akan m engukuhkan p an d an g an ini dengan mengemukakan satu model teoretikal yang akan digunakan untuk menerangkan mengapa TRM tidak dapat dibangunkan potensi ekonominya ke tahap yang lebih tinggi akibat daripada pemilikan bertindih. Model ini dibentuk dengan menggunakan kerangka asas teori kos transaksi (Coase, 1952 dan Williamson, 1975). Melalui model ini, kami akan menunjukkan bahawa pembangunan TRM yang bertindih pemilikannya adalah terhalang akibat daripada kos transaksi dan kewujudan oportunisme di kalangan pemilik- pemiliknya. Adalah penting diperhatikan bahawa keputusan ini terhasil dari pilihan bebas pemilik- pem ilik yang rasional dan m em entingkan kebajikan diri.
Kertas ini diatur secara berikut. Seksyen 2 akan memberikan statistik umum mengenai TRM dan sejarah kewujudannya. Seksyen 3 pula akan m enam pilkan m odel ekonom i b e rse rta perbincangan mengenai implikasi empirikal. Akhir sekali, Seksyen 4, merupakan kesimpulan kertas ini.
LATABELAKANG TANAH RIZAB MELAYUTanah Rizab Melayu (TRM) boleh ditakrifkan sebagai tanah-tanah yang dimiliki oleh orang Melayu dalam sempadan sesuatu negeri di Malaysia yang mana hak miliknya hanya boleh dipegang atau dipindah kepada orang Melayu sahaja2. Ia telah wujud di Tanah Melayu sebelum merdeka lagi melalui enakmen-enakmen yang telah digubal oleh pentadbiran kolonial British.3
TRM diwujudkan semasa pem erintahan penjajah (1890-1956) kerana pemilikan tanah oleh orang Melayu m ula terancam akibat kemasukan orang asing yang semakin meningkat. Selain itu, pengaruh perkembangan pertanian perladangan oleh orang bukan Melayu seperti getah telah menggalakkan orang Melayu menjual tanah mereka kepada orang bukan Melayu. Pada masa yang sama juga, di sesetengah negeri peningkatan industri bijih timah yang lebih lumayan telah menggalakkan orang Melayu menukar haluan keija dan akibatnya, banyak tanah orang Melayu yang tidak diusahakan dan ditinggalkan yang boleh dibeli dengan harga yang rendah. Oleh itu, peruntukan pemilikan tanah kepada orang Melayu melalui Enakmen 1913 adalah bertujuan untuk memastikan tanah- tanah yang dimiliki oleh orang Melayu tidak dipindah milik kepada orang bukan Melayu demi menjaga kependngan para petani, ladang-ladang dan kerajaan penjajah pada ketika itu (Nik Mohd Zain Nik Yusof, 1996). Terdapat juga pandangan yang menyatakan bahawa TRM diwujudkan oleh penjajah untuk memastikan kawasan-kawasan padi terus diusahakan oleh orang-orang Melayu sebagai sumber makanan kepada penduduk Malaya yang kian meningkat ketika itu (Nik Mohd Zain Nik Yusof, 1996).
Status TRM terus dikekalkan selepas zaman penjajah dan Jadual 1 menunjukkan keluasan TRM mengikut negeri di Semenanjung Malaysia pada tahun 1995. Secara aggregatnya jum lah keluasan telah berkurangan pada Januari 1995, tetapi kekurangannya adalah kecil iaitu tidak sampai 3%. Namun begitu, perlu juga diingatkan bahawa pengekalan keluasan TRM ini tidak
98 Pertanika J. Soc. Sci. & Hum. Vol. 7 No. 2 1999
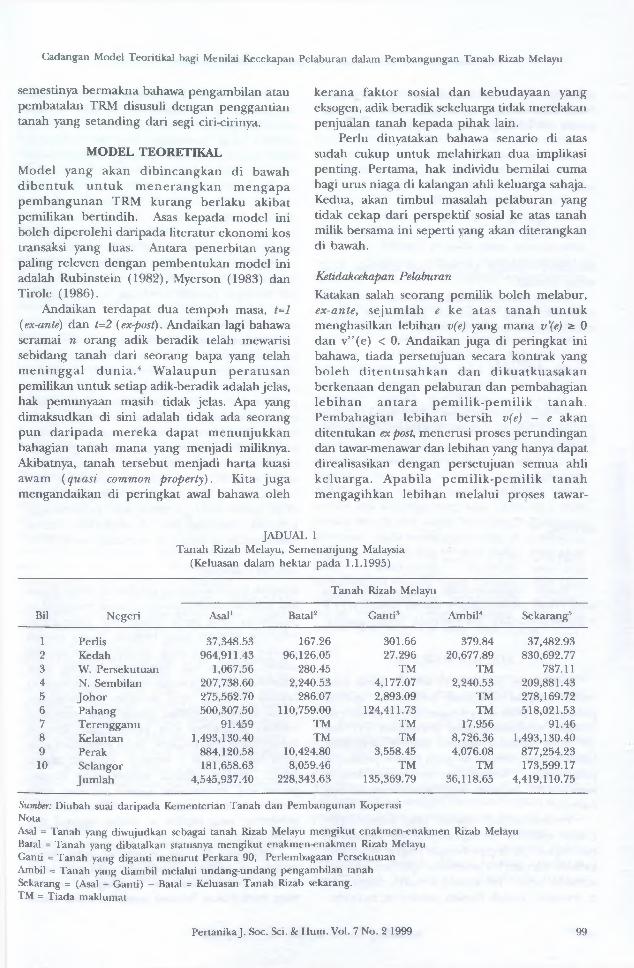
Cadangan Model Teoritikal bagi Menilai Kecekapan Pelaburan dalam Pembangungan Tanab Rizab Melayu
semestinya bermakna bahawa pengambilan atau pembatalan TRM disusuli dengan penggantian tanah yang setanding dari segi ciri-cirinya.
MODEL TEORETIKALModel yang akan dibincangkan di bawah d ib en tu k u n tu k m en eran g k an m engapa pem bangunan TRM kurang berlaku akibat pemilikan bertindih. Asas kepada model ini boleh diperolehi daripada literatur ekonomi kos transaksi yang luas. Antara penerbitan yang paling releven dengan pembentukan model ini adalah Rubinstein (1982), Myerson (1983) dan Tirole (1986).
Andaikan terdapat dua tempoh masa, t=l (ex-ante) dan t=2 (ex-post). Andaikan lagi bahawa seramai n orang adik beradik telah mewarisi sebidang tanah dari seorang bapa yang telah m eninggal d u n ia .4 W alaupun p era tu san pemilikan untuk setiap adik-beradik adalah jelas, hak pemunyaan masih tidak jelas. Apa yang dimaksudkan di sini adalah tidak ada seorang pun daripada m ereka dapat m enunjukkan bahagian tanah mana yang menjadi miliknya. Akibatnya, tanah tersebut menjadi harta kuasi awam (quasi common property). Kita juga mengandaikan di peringkat awal bahawa oleh
kerana faktor sosial dan kebudayaan yang eksogen, adik beradik sekeluarga tidak merelakan penjualan tanah kepada pihak lain.
Perlu dinyatakan bahawa senario di atas sudah cukup untuk melahirkan dua implikasi penting. Pertama, hak individu bemilai cuma bagi urus niaga di kalangan ahli keluarga sahaja. Kedua, akan timbul masalah pelaburan yang tidak cekap dari perspektif sosial ke atas tanah milik bersama ini seperti yang akan diterangkan di bawah.
Ketidakcekapan PelaburanKatakan sal ah seorang pemilik boleh melabur, ex-ante, sejum lah e ke atas tan ah u n tu k menghasilkan lebihan v(e) yang mana v'(e) * 0 dan v” (e) < 0. Andaikan juga di peringkat ini bahawa, tiada persetujuan secara kontrak yang boleh d iten tu sah k an dan dikuatkuasakan berkenaan dengan pelaburan dan pembahagian leb ih an an ta ra pem ilik-pem ilik tan ah . Pembahagian lebihan bersih v(e) - e akan ditentukan ex post, menerusi proses perundingan dan tawar-menawar dan lebihan yang hanya dapat direalisasikan dengan persetujuan semua ahli keluarga. A pabila pem ilik-pem ilik tan ah m engagihkan lebihan melalui proses tawar-
JADUAL 1Tanah Rizab Melayu, Sem enanjung Malaysia
(Keluasan dalam hektar pada 1.1.1995)
Bil N egeri
Tanah Rizab Melayu
Asal1 Batal2 Ganti8 Am bil4 Sekarang5
1 Perlis 37,348.53 167.26 301.66 379.84 37,482.932 Kedah 964,911.43 96,126.05 27.296 20,677.89 830,692.773 W. Persekutuan 1,067.56 280.45 TM TM 787.114 N. Sem bilan 207,738.60 2,240.53 4,177.07 2,240.53 209,881.435 Johor 275,562.70 286.07 2,893.09 TM 278,169.726 Pahang 500,307.50 110,759.00 124,411.73 TM 518,021.537 T erengganu 91.459 TM TM 17.956 91.468 Ke lan tan 1,493,130.40 TM TM 8,726.36 1,493,130.409 Perak 884,120.58 10,424.80 3,558.45 4,076.08 877,254.2310 Selangor 181,658.63 8,059.46 TM TM 173,599.17
Jum lah 4,545,937.40 228,343.63 135,369.79 36,118.65 4,419,110.75
Sumber: Diubah suai daripada Kementerian Tanah dan Pembangunan Koperasi NotaAsal = Tanah yang diwujudkan sebagai tanah Rizab Melayu mengikut enakmen-enakmen Rizab MelayuBatal = Tanah yang dibatalkan statusnya mengikut enakmen-enakmen Rizab MelayuGanti = Tanah yang diganti menurut Perkara 90, Perlembagaan PersekutuanAmbil = Tanah yang diambil melalui undang-undang pengambilan tanahSekarang = (Asal + Ganti) - Batal = Keluasan Tanah Rizab sekarang.TM = Tiada maklumat
PertanikaJ. Soc. Sci. & Hum. Vol. 7 No. 2 1999 99

Nor Ghani Md. Nor, Mohd Azlan Shah Zaidi dan Ahmad Zainuddin Abdullah
menawar ini maka diandaikan keseimbangan Nash akan tercapai (dan kuasa tawar-menawar antara ahli keluarga adalah serupa5) sehinggakan:
v(e) - (s + e) = (n - l)s (1)
atau
s = ”(gl z £ (2)n
dengan s = jumlah lebihan yang diterima oleh setiap pemilik
Untuk memaksimumkan lebihan bersihnya, individu yang m em buat p e lab u ran akan menyelesaikan masalah berikut:
M a x - e (3). \ n )
Adalah mudah untuk menunjukkan bahawa pilihan pelaburan, e, yang optimal berlaku dalam keadaan di mana:
/v (g) r r \ . i . o (4)\ n j
oleh itu,
v’(e) = n + 1 (5)
Walau bagaimanapun, tingkat pelaburan yang cekap memerlukan e dipilih supaya v(e) n e dimaksimumkan. Ini hanyalah benar apabila:
v’(e) = 1 (6)
iPersamaan (5) dan (6) adalah syarat biasa untuk tingkat optim um pelaburan apabila pulangan adalah sama dengan kos sut pelaburan. Dengan membandingkan persamaan (5) dan (6) jelas didapati bahawa tingkat pelaburan individu lebih rendah daripada tingkat pelaburan yang cekap. Kesimpulan ini dibuat dengan m enyedari bahawa v(e) adalah cem bung (concave).
Perhatikan juga apabila nilai n meningkat (iaitu apabila bilangan pem ilik bertind ih meningkat), jurang perbezaan tingkat pelaburan individu dan tingkat pelaburan optimum menjadi semakin besar. Ini kerana semakin tinggi nilai w, semakin rendah tingkat pelaburan individu.
Secara intuitif, kekurangan pelaburan (dan dengan itu pem bangunan) berlaku kerana seseorang pelabur tidak dapat meraih kesemua lebihan yang dihasilkan oleh pelaburannya. Sikap oportunistik ahli keluarga menyebabkan m ereka “m en u m p an g d en g an p e rc u m a ” sebahagian dari hasil pelaburan fyang dilakukan oleh ahli keluarga lain. Oleh kerana pengagihan lebihan dilakukan ex post melalui proses tawar- menawar dan lebihan hanya boleh direalisasikan dengan persetujuan semua, maka model di atas menjangkakan kurangnya pembangunan TRM. Bahkan keadaan ini akan menjadi lebih buruk jika bilangan pemilik berdndih, n, meningkat.
Kontrak Pelaburan OptimalDalam model yang telah dibincangkan, ketiadaan kon trak yang b o leh d iten tu sah k an dan dikuatkuasakan telah menyebabkan wujudnya oportunism e yang membawa kepada tahap pelaburan dan pembangunan yang rendah. Oleh itu masalah ini boleh diatasi secara prinsipnya melalui pemeteraian kontrak yang sesuai untuk menghasilkan pelaburan yang optimal. Bahagian ini akan membincangkan dua bentuk kontrak yang sebegini; iaitu kontrak pelaburan dan kontrak jualan. Di samping itu bahagian ini juga akan m enerangkan m engapa pem eteraian kon trak sep e rti ini d ijangkakan sukar dilaksanakan di kalangan pemilik-pemilik TRM.
Kontrak PelaburanMasalah ketidakcekapan pelaburan boleh diatasi jika kontrak ditulis, ex-ante, untuk menyatakan pelaburan yang perlu dibuat dan pengagihan sebarang lebihan yang terhasil. Suatu contoh kontrak pelaburan yang mudah tetapi optimal adalah dimana hak pemilikan lebihan yang dihasilkan dari pelaburan semata-mata diberikan kepada individu yang melabur. Disebabkan hanya individu pelabur sahaja yang m endapat lebihan pelaburan dan pemeteraian kontrak menghalang oportunisme, maka ketidakcekapan pelaburan tidak akan berlaku. Didalam kes ini fungsi objektif pelabur adalah sama dengan perancang masyarakat (social planner) iaitu memaksimumkan v(e) - e. Oleh itu tahap pelaburan yang dipilih, e, adalah optimal dan lebih tinggi.
Satu lagi kontrak pelaburan yang boleh membawa kepada pelaburan optim al ialah dengan pemeteraian satu perjanjian, ex ante, yang menyatakan bahawa semua pemilik, selain
100 PertanikaJ. Soc. Sci. & Hum. Vol. 7 No. 2 1999

Cadangan Model Teoritikal bagi Menilai Kecekapan Pelaburan dalam Pembangungan Tanab Rizab Melayu
pelabur, akan menerima sejumlah lebihan yang nilainya (katakan k) tidak berubah dengan jum lah pelaburan. Oleh kerana oportunisme terhalang dengan kontrak ini, pelaburan yang akan dibuat adalah optimal. Ini dapat dilihat sekali lagi dengan menyedari bahawa fungsi objektif pelabur adalah memaksimumkan \{e) - e - k di mana k ialah pemalar. Agak mudah untuk m enunjukkan bahawa pilihan tahap pelaburan, e> adalah optimal dalam kes ini.
Malangnya, adalah dijangkakan ke dua-dua jenis kontrak tersebut di atas (dalam kes TRM), sangat sukar untuk direalisasikan oleh pemilik- pemilik kerana dua sebab utama. Pertama oleh kerana faktor budaya dan keadaan hidup sosial berkeluarga, para pemilik (adik-beradik) akan mendapati sukar untuk menulis satu kontrak untuk menyatakan hak dan tanggungjawab k erana p en u lisan k o n trak yang boleh d iten tu sah k an dan d ikuatkuasakan oleh mahkamah menimbulkan kos sosial yang tinggi. Ahli keluarga sukar bahkan enggan menulis kontrak kerana ia mewujudkan suasana yang berbentuk atau mirip perniagaan (businesslike environment) dan mengancam lebihan lain yang dikecapi hasil dari hubungan kekeluargaan yang sedia terjalin. Isu ini adalah sama seperti yang dibincangkan oleh Williamson (1975) yang mana kelakuan altruistik akan berkurangan jika ia d icem ari d en g an keg iatan lain yang berorientasikan pasaran. Tambahan lagi, terdapat pula kos yang p erlu d itan g g u n g u n tu k menyediakan dan memeterai kontrak.
Malah jik a k o n trak d ap a t d im ete ra i sekalipun, ada k em u n g k in an ia tidak dikuatkuasakan dengan setegasnya secara u n d an g -u n d an g jik a p e rb a lah an tim bul. Sebaliknya perbalahan itu akan diselesaikan secara arbitrasi dalam an yang dijangkakan berakhir dengan tolak ansur kerana kos sosial b erkaitan d en g an k eh ilan g an suasana kekeluargaan mungkin terlalu tinggi. Tolak ansur yang berlaku, ex post, membawa implikasi bahawa pembahagian lebihan masih bergantung kepada tingkat pelaburan seperti dalam model asal sekaligus mengekalkan masalah ketidakcekapan pelaburan.
Kontrak JualanWalaupun kemungkinan penjualan tanah kepada pihak luar telah digugurkan dalam model di atas, pemilik yang ingin membuat pelaburan
masih boleh membuat tawaran untuk membeli kesemua tanah daripada pemilik lain. Melalui kontrak yang sebegini, sebarang lebihan yang d ijana dari p e lab u ran akan d ip e ro le h i sepenuhnya oleh pelabur. Oleh itu pelaburan yang optimal akan berlaku kerana kesan kontrak jualan ini kepada tahap pelaburan adalah sama sebagaimana kontrak pem bahagian lebihan ex ante secara te tap sep e rti yang te lah d ib incangkan6. Ini dapat d ilihat dengan menyedari bahawa pemilik akan menentukan tahap pelaburan dengan m em aksim um kan v(e) - e yang akan menghasilkan pelaburan optimal.
Walau bagaim anapun, perun tukan ini te rd e d ah kepada m asalah “p en u n g g an g percum a”. Setiap pihak mengetahui bahawa taw aran u n tu k m em beli bahag iannya mem buktikan bahawa nilai pegangan akan meningkat setelah ahli keluarga lain menjual bahagian mereka dan pelaburan dilakukan. Setiap pemilik akan membiarkan pihak yang lain untuk menjual hak mereka dengan harapan persetujuan kemudiannya dapat dibuat untuk mereka menikmati lebihan yang lebih besar. Bagaimanapun, jika ini benar untuk seseorang ahli keluarga maka ia juga mesti benar untuk semua ahli keluarga yang lain. Akhirnya, oleh kerana semua ahli ingin “menunggang dengan percuma”, tiada seorangpun yang akan menjual bahagian mereka dan kontrak jualan tidak akan m enjad i kenyataan . K eadaan ini ada kesamaannya dengan hujah Grossman dan Hart(1980) di dalam isu “penunggang percuma” dalam kegagalan pengambilalihan firma yang diurus oleh pengurus yang tidak cekap.
IMPLIKASI EMPIRIKModel yang ditunjukkan di atas m em beri sekurang-kurangnya dua implikasi yang boleh diuji secara empirik.
Pertama, jika model ini benar dan dengan mengawal semua faktor lain yang mempengaruhi nilai TRM, maka kita akan dapati bahawa pem bangunan (nilai) TRM adalah berkadar songsang dengan bilangan pemilik bertindih. Ini dapat dilihat dengan membandingkan tingkat pelaburan dalam persamaan (5) dan (6) apabila nilai n diubah. Sebagai huraian, tanah yang dimiliki oleh hanya seorang pemilik lebih ce n d e ru n g u n tu k d ib an g u n k an (m ela lu i p e lab u ran ) ke tah ap yang leb ih tinggi
Pertanika J. Soc. Sci. &: Hum. Vol. 7 No. 2 1999 101
Nor Ghani Md. Nor, Mohd Azlan Shah Zaidi dan Ahmad Zainuddin Abdullah
sehinggakan nilai pasarannya lebih besar berbanding dengan tanah yang sama tetapi dimiliki secara bertindih oleh ramai pemilik.
Kedua, model ini juga membawa implikasi bahawa TRM yang dimiliki secara bertindih lebih tinggi nilainya jika pemilik-pemiliknya telah berjaya m enulis kon trak yang boleh dikuatkuasakan berbanding dengan tanah milik keluarga yang gagal berbuat demikian. Kejayaan mewujudkan kontrak ex ante akan menghalang oportunisme dan menggalakkan peningkatan nilai pelaburan.
Tentu sekali ujian empirik ini perlu dirangka sebegitu rupa sehinggakan ia berupaya untuk mengawal semua faktor lain yang dijangka mempengaruhi nilai TRM untuk mengelak dari kesilapan inferens.
KESIMPULANKertas ini telah membincangkan latar belakang TRM dan m embentangkan model teoritikal u n tu k m eneran g k an m engapa pem ilikan bertindih merupakan salah satu daripada punca m asalah pem bangunan TRM. Model ini menunjukkan bahawa akibat dari kekangan yang tertentu, pemilik-pemilik yang rasional memilih untuk membuat pelaburan tambah nilai yang tidak optimal terhadap tanah milik mereka. Isu- isu seperti tawar-menawar ex post, oportunisme dan kos transaksi telah dikaitkan dengan permasalahan pelaburan yang tidak optimal ini. Akhir sekali kertas ini menyatakan dua implikasi yang boleh digunakan untuk menguji secara empirik model yang telah dibentuk.
RUJUKANC o a se , RH. 1952. The Nature of Firm. In Readings
in Price Theory ed. G.J. Stigler and K.E. Boulding. Illinois: Richard Irwin.
G r o ssm a n , S . and O.D. H a r t . 1980. Takeover bids, the Free-Rider problem and the theory of the corporation. Bell Journal of Economics 14: 119- 138.
M y er so n , R. and M . S a t t er t h w a it e . 1983. Efficient mechanisms for bilateral trading. Journal of Economic Theory 28: 265-281.
N ik H ash im N ik M u sta ph a et al. 1996. Pembangunan Tanah Milik Orang Melayu. Dalam Persidangan Pembangunan Tanah Rizab Melayu, 9 November 1996 di Pusat Perdagangan Dunia Putra (PWTC)
N ik M o h d Z ain N ik Y u so f 1996. Pembangunan Tanah Rizab Melayu dari Perspektif Sejarah, Perundangan dan Pembangunan masa depan. Dalam Persidangan Pembangunan Tanah Rizab Melayu, 9 November 1996 di Pusat Perdagangan Dunia Putra (PWTC).
R u b in s t e in , A . 1982. Perfect equilibrium in a bargaining model. Econometrica 50: 97-109.
S h aik M o h d N o r A lam . 1996. Pembangunan Tanah Rizab Melayu dari Perspektif Undang-undang. Dalam Persidangan Pembangunan Tanah Rizab Melayu, 9 November 1996 di Pusat Perdagangan Dunia Putra (PWTC)
T ir o le , J. 1986. Procurement and renegotiation. Journal of Political Economy 94: 235-259.
W il l ia m so n , O.E. 1975. Markets and Hierarchies, Analysis and Antitrust Implications. New York: Macmillan.
(Received: 15 November 1999)
102 PertanikaJ. Soc. Sci. & Hum. Vol. 7 No. 2 1999
Pertanika J. Soc. Sci. & Hum. 7(2): 103 - 110 (1999) ISSN: 0128-7702 © Universiti Putra Malaysia Press
Technical Efficiency Estimates for Sarawak Pepper Farming: A Comparative Analysis
ALIAS RADAM and MOHD. MANSOR ISMAIL Jabatan Pemiagaantani dan Sistem Maklumat,
Fakulti Ekonomi & Pengurusan,Universiti Putra Malaysia, 43400 UPM, Serdang,
Selangor, Malaysia
Keywords: technical efficiency, Sarawak pepper farming, comparative analysis
ABSTRAK
Menganggar kecekapan teknikal teknologi pengeluaran adalah penting untuk tujian polisi. Empat fungsi sempadan (frontier) pengeluaran terdiri dari fungsi berparameter dan tidak berparameter dianalisis untuk menganggar kadar kecekapan teknikal ke atas sampel ladang lada hitam di Sarawak. Metadologi yang digunakan memberi anggaran taburan dan ‘ranking’ kadar kecekapan yang berbeza. Anggaran fungsi tidak berparameter adalah lebih tinggi berbanding anggaran fungsi berparameter kecuali di bawah kaedah stokastik berparameter. Disebabkan oleh perbezaan yang ketara didalam keputusan kecekapan teknikal, cadangan untuk tujuan polisi tidak boleh dibuat tanpa terlebih dahulu dibuat analisis terperinci bagi setiap kaedah yang digunakan.
ABSTRACT
Estimating technical efficiency of production technology is important for policy purposes. Four production frontiers consisting of parametric and nonparametric functions were analysed to estimate technical efficiency ratios on a sample of pepper farms in Sarawak. The methodologies employed produced different estimates, distributions, and rankings of efficiency ratios. The nonparametric estimates were greater than parametric estimates except under stochastic parametric method. Due to the large differences in technical efficiency results, recommendation for policy purpose should not be made without prior detailed analysis of each method.
INTRODUCTIONThe modeling of production activities has long occupied a central role in applied economic research, both as an area in which existing statistical estimators may be applied and in providing a stimulus for the development of new methods. In standard microeconomic theory, p roduction technology is rep resen ted by transform ation (production) function that defines the maximum attainable outputs from different combinations of inputs. Hence, the transformation function describes a boundary or a frontier. Given that the production function to be estimated had constant returns to scale, Farrell (1957) assumed that observed input per unit of output values for firms would be above the so-called unit isoquant. The unit isoquant defines the input per unit output ratios associated
with the most efficient use of inputs to produce the output involved. The deviation of observed input per unit output ratios from the unit isoquant is considered to be associated with technical efficiency. On the o ther hand, technical inefficiency is defined as a firm’s failure to produce maximum output from a given set of inputs (Forsund et al, 1980).
A more general presentation of Farrells’ concept of production (or frontier) is depicted in Fig. 1 involving the original input and output values. The observed input-output values are below the production frontier, given that firms do not attain the maximum output possible for the inputs involved, for a given technology. A measure of technical efficiency of the firm which produce output, y, with input, x, denoted by point A, is given by y/y*, where y* is frontier

Alias Radam and Mohd. Mansor Ismail
Fig. 1. Technical efficiency of firms in input-output space
output associated with the level of input, x, (point B). Thus, the ratio of observed output and frontier output is a measure of technical efficiency for the input involved.
In recent years, many empirical studies using frontier function methodologies have been undertaken with the purpose of measuring farm efficiency. Recent differences in farm efficiency measurements may have been the result of numerous factors, including the time period analysed, the degree of sample homogeneity, output aggregation and the method employed (Neff et al., 1991). For example, Bravo-Ureta and Rieger (1990) examine New England and New York farm efficiency using four production frontier methods. The result of their analysis indicates that, while large differences exist between estimated average firm efficiency ratios, all four sets of efficiency ratios are highly correlated within two time periods.
Kalaitzandonakes et al. (1992) examined the relationship between firm size and technical efficiency on a sample of Missouri grain farms using three production frontiers. There are strong differences between estimated average efficiency ratios from the three methods. Byrnes et al. (1987), using a nonparametric radial output efficiency measure, find that south-central Illinois grain farms are producing only four percent below their efficient levels. However, Aly et al.
(1987) and Neff et al. and Hornbaker (1991) using a deterministic parametric frontier, find that farms are producing at approximately 60-65 percent of their efficiency level. Finally, Grabowski et al. (1990) employing a stochastic parametric frontier, find that a sample of Illinois grain farms are producing at 82 percent of their efficient levels.
Given the result of previous studies, the purpose of this paper is to provide a comparison of the most commonly used fronder methods utilizing four production frontier methods, namely:
a. Deterministic Parametric Frontier (COLS)b. Linear Programming Parametric Frontier
(LP)c. Nonparametric Frontier (NPAR), andd. Stochastic Parametric Frontier (SPF)
This paper proceeds as follows. The next section focuses on the methodology that are used in this study. Section three presents the data and estimation followed by the empirical results. The last section concludes the study with the implications of the findings.
METHODOLOGYDeterministic Parametric FrontierLet y represent the output of a firm and let xdenotes a vector of input utilized in the
104 PertanikaJ. Soc. Sci. & Hum. Vol. 7 No. 2 1999
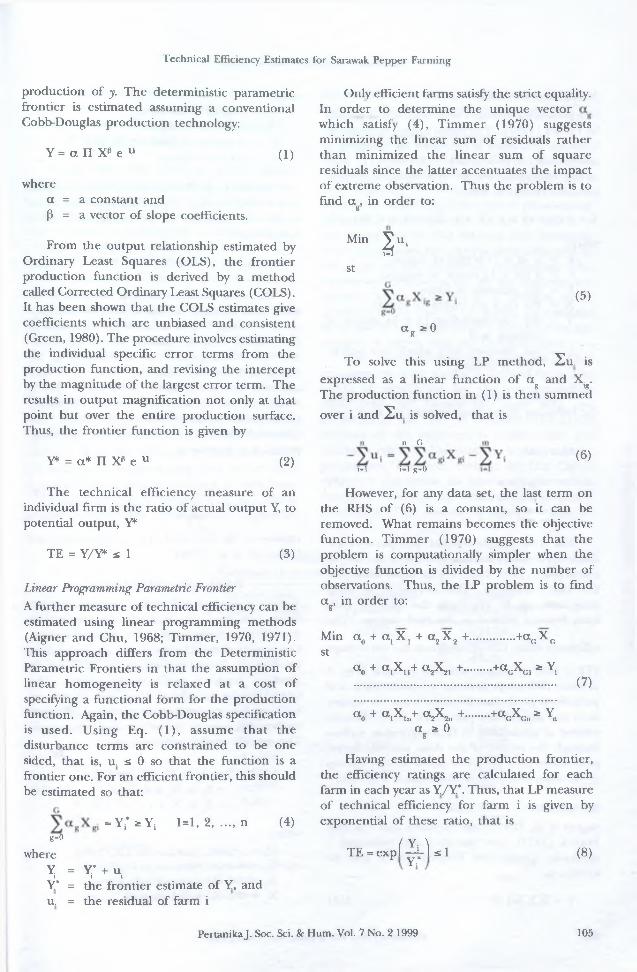
Technical Efficiency Estimates for Sarawak Pepper Farming
production of y. The deterministic parametric frontier is estimated assuming a conventional Cobb-Douglas production technology:
Y = a II Xp e u (1)
wherea = a constant and P = a vector of slope coefficients.
From the output relationship estimated by Ordinary Least Squares (OLS), the frontier production function is derived by a method called Corrected Ordinary Least Squares (COLS). It has been shown that the COLS estimates give coefficients which are unbiased and consistent (Green, 1980). The procedure involves estimating the individual specific error terms from the production function, and revising the intercept by the magnitude of the largest error term. The results in output magnification not only at that point but over the entire production surface. Thus, the frontier function is given by
Y* = a* fl Xp e u (2)
The technical efficiency measure of an individual firm is the ratio of actual output Y, to potential output, Y*
TE = Y/Y* ^ 1 (3)
Linear Programming Parametric Frontier A further measure of technical efficiency can be estimated using linear programming methods (Aigner and Chu, 1968; Timmer, 1970, 1971). This approach differs from the Deterministic Parametric Frontiers in that the assumption of linear homogeneity is relaxed at a cost of specifying a functional form for the production function. Again, the Cobb-Douglas specification is used. Using Eq. (1), assume that the disturbance terms are constrained to be one sided, that is, u. £ 0 so that the function is a frontier one. For an efficient frontier, this should be estimated so that:
=Y i* i Y i 1=1, 2 , . . . , n (4)g=o
whereY = Y* + u.i i iY* = the frontier estimate of Y, andu. = the residual of farm i
Only efficient farms satisfy the strict equality. In order to determine the unique vector which satisfy (4), T im m er (1970) suggests minimizing the linear sum of residuals rather than minimized the linear sum of square residuals since the latter accentuates the impact of extreme observation. Thus the problem is to fmd a , in order to: g
Min ^ j u i
st
« g * °
(5)
To solve this using LP method, 2 u . is expressed as a linear function of a and X. .
r g *g The production function in (1) is then summed over i and 2 u is solved, that is
n G
(6)i=l i-1 g»0
However, for any data set, the last term on the RHS of (6) is a constant, so it can be removed. What remains becomes the objective function. Tim mer (1970) suggests that the problem is computationally simpler when the objective function is divided by the number of observations. Thus, the LP problem is to find a , in order to:
g’
Min a0 + a 1X 1 + a2X g +.............+ac ^Gst
a0 + a,X11+ a.X,, +........+aGXG1 * Y, ................................................................ (7)
a o + a ix .„+ “ A , + ......... + a cX cn * Y„a :► 0
g
Having estimated the production frontier, the efficiency ratings are calculated for each farm in each year as Y/Y*. Thus, that LP measure of technical efficiency for farm i is given by exponential of these ratio, that is
TE = e x p f ^ L l (8)
PertanikaJ. Soc. Sci. 8c Hum. Vol. 7 No. 2 1999 105
Alias Radam and Mohd. Mansor Ismail
Nonparametric FrontierNonparametric frontiers were originally proposed by Farrell (1957). The radial output measure of technical efficiency is estimated by assuming a nonparametric production technology (T) with strong disposable output and inputs, and nonconstant return to scale:
T = {(x,y): zY ;> y, zX -s x, 2z. = 1, z G R+) (9)
wherexykxY
z =
a (n x 1) vector of inputsa (m x 1) vector of outputsthe number of farmsthe (n x m) matrix of inputsthe corresponding (n x k) matrix ofoutputs, andthe intensity with which any activity (x,y) is utilized.
Technical efficiency i estimated by solving the following linear programming for each farm
Max 0 ■st
zY st 0.y. zX ^ x.2 z. = i
(10)
For the sing le-ou tpu t n o n p aram etric efficiency measure used here, there is one output constraint in (10). There are six input constraint fo r the m easures. The solu tion to each programming, ©, represent the ratio of each farm frontier output to observed output. The
efficiency ratio, TE= , indicates the percentage
(TE x 100) of output achieved by each firm. A primary difference between nonparametric and parametric production frontiers is that the former does not assume any parametric form. Hence, instead of attempting to fit a regression surface through the center of the data, nonparametric procedures lay a piecewise linear surface on top of the observation (Kalaitzandonakes et al. 1992).
Stochastic Parametric Frontier Aigner et al., (1977) and Meeusen and Van den Broeck (1977) have specified and estimated a stochastic production frontier which can be written as:
whereY = output of ith farmsX. = a vector of inputs,p. = a vector of parameters, ande. = an error termsi
The stochastic frontier is also called composed error model, because it postulates that the error terms (i is composed of two independent error component:
e. = v - u. ( 12)
The error component vi is assumed to be distributed normally with mean zero and variance a v2 (v. ~ N(0,ov2)) and account for variability in the frontier due to random shocks or noise. The error com ponent ui is assumed to be distributed half-normally (u.~|N(0, ,Ou2|) and assumed to capture firm’ inefficiency, that is deviation from the stochastic frontier. Equation (4) is estimated using maximum likelihood. The technical efficiency related to the stochastic production frontier is
Y;F (x i ,|3i )ev
(13)
capture by the one sided error component u. ^ 0 (Jondrow et al., 1992).
DATA AND ESTIMATIONA cross section of 159 sample Sarawak pepper farms was used to estimate the production frontier models discussed in the previous section. Our empirical model consists of a single equation production function, which is justified by invoking expected profit maximization. The Cobb-Douglas functional form was chosen, as has been the practice in most published efficiency studies, because of its well-known advantages. The specific model estimated is:
ln Q = P „ + P , In X, + P2 ln X , + p, In X3 + p4 In X4 + P* In X,+ e
(14)
whereQx
Y = F ( X , p i ) e'i ( 11)
= pepper production (kg/year) j = the fertilizer used (kg/year)
X2 = the weedicide used (lt/year) X3 = the chemical used (lt/year)
106 PertanikaJ. Soc. Sci. & Hum. Vol. 7 No. 2 1999
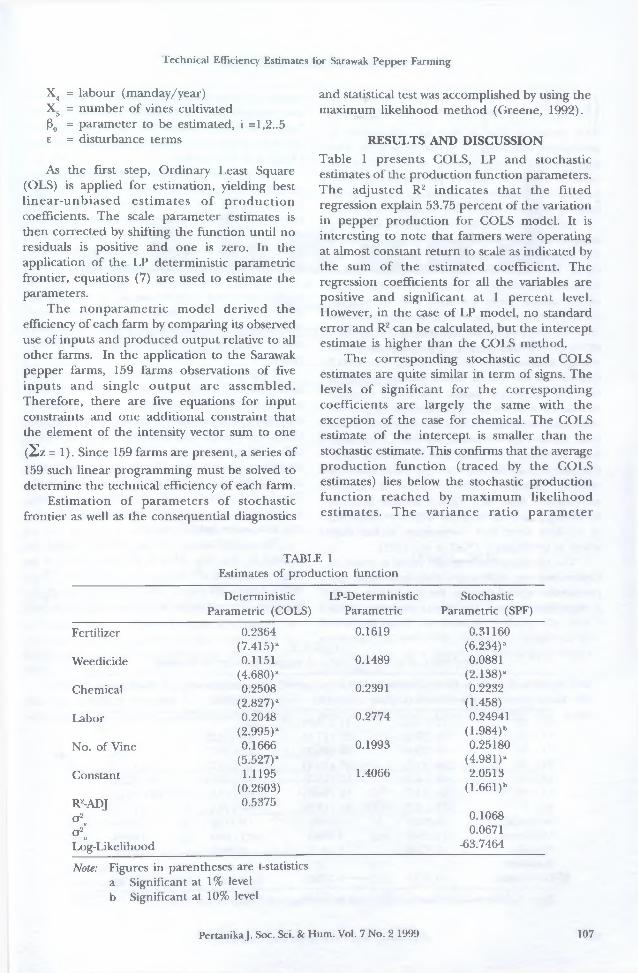
Technical Efficiency Estimates for Sarawak Pepper Farming
X4 = labour (manday/year)X5 = num ber of vines cultivated(30 = parameter to be estimated, i =1,2..5e = disturbance terms
As the first step, Ordinary Least Square (OLS) is applied for estimation, yielding best lin ear-u n b iased estim ates o f p ro d u c tio n coefficients. The scale parameter estimates is then corrected by shifting the function until no residuals is positive and one is zero. In the application of the LP deterministic parametric frontier, equations (7) are used to estimate the parameters.
The nonparam etric m odel derived the efficiency of each farm by comparing its observed use of inputs and produced output relative to all other farms. In the application to the Sarawak pepper farms, 159 farms observations of five inputs and single o u tp u t are assem bled. Therefore, there are five equations for input constraints and one additional constraint that the element of the intensity vector sum to one(Zz =1). Since 159 farms are present, a series of 159 such linear programming must be solved to determine the technical efficiency of each farm.
Estimation o f param eters of stochastic frontier as well as the consequential diagnostics
and statistical test was accomplished by using the maximum likelihood method (Greene, 1992).
RESULTS AND DISCUSSIONTable 1 presents COLS, LP and stochastic estimates of the production function parameters. The adjusted R2 indicates th a t the fitted regression explain 53.75 percent of the variation in pepper production for COLS model. It is interesting to note that farmers were operating at almost constant return to scale as indicated by the sum of the estimated coefficient. The regression coefficients for all the variables are positive and significant at 1 percent level. However, in the case of LP model, no standard error and R2 can be calculated, but the intercept estimate is higher than the COLS method.
The corresponding stochastic and COLS estimates are quite similar in term of signs. The levels of significant for the corresponding coefficients are largely the same with the exception of the case for chemical. The COLS estimate of the intercept is smaller than the stochastic estimate. This confirms that the average production function (traced by the COLS estimates) lies below the stochastic production function reached by maxim um likelihood estim ates. T he variance ra tio p a ram ete r
TABLE 1Estimates of production function
Deterministic Parametric (COLS)
LP-DeterministicParametric
Stochastic Parametric (SPF)
Fertilizer 0.2364 0.1619 0.31160(7.415)a (6.234)a
Weedicide 0.1151 0.1489 0.0881(4.680)a (2.138)a
Chemical 0.2508 0.2391 0.2232(2.827)a (1.458)
Labor 0.2048 0.2774 0.24941(2.995)a (1.984)b
No. of Vine 0.1666 0.1993 0.25180(5.527)a (4.981)a
Constant 1.1195 1.4066 2.0513(0.2603) (1.661)b
R2-ADJ 0.5375a 2 0.1068
Va 2u 0.0671Log-Likelihood -63.7464
Note: Figures in parentheses are t-statistics a Significant at 1% level b Significant at 10% level
PertanikaJ. Soc. Sci. 8c Hum. Vol. 7 No. 2 1999 107

Alias Radam and Mohd. Mansor Ismail
, a measure to indicate the extent of
total variation that is due to differences in production efficiency, is found to be 0.78. This suggests that a high portion of the differences between farmers’ realized production and the maximum possible productions are due to farming practices rather than random behaviour.
Table 2 presents the results of the efficiency analyses for four frontier models. At first glance, the results show considerable variability in the value of m ean technical efficiency across methods. On average, the mean efficiency ratios of the sample farms are high, over 80 percent for SPF measures. The NPAR measure indicates that the pepper farms are almost 80 percent efficient, which is about 1 -2 percent lower than average measures for the SPF model. The COLS frontier method has the lowest average efficiency ratio for the pepper farms. The COLS measure indicates that farms are approximately 62 percent efficient on average, about 3 - 4 percent lower than the average measures for the LP method. Both measures are about 20 - 22 percent lower than the average measure for the NPAR and SPF models. Efficiency ratios from the SPF model are higher than the COLS model because modeling the error term in SPF as a composite of random error and inefficiency, rather than solely as inefficiency (Neff et al., 1993).
The nonparametric model tends to result in higher average efficiency measures than the parametric model (except for the SPF model). A significant reason for this is that the NPAR
model analyses construct a different frontier for every sample farm. This result is consistent with Neff et al. (1993) where the NPAR model is a piecewise-linear, not a smooth function as in the COLS and SPF models.
The standard deviation for SPF model is the smallest com pared to o ther th ree models. Consequently, the SPF model provides farm efficiency estimates with much lower variability than any of the other methods. For the SPF model, the technical inefficiency of each farm is a point estimate, that is, the mean of the co n d itio n a l d is trib u tio n s o f each fa rm ’s inefficiency error component (u.) given its total error term (e.). The mean for the conditional distributions (u|e.) of the sample farms are very similar resulting in low variability in the efficiency ratios.
4
Table 2 and Fig. 2 represent distributions of farm efficiency ratios. The COLS and LP models is almost normally distributed. Approximately only 8 percent of the farms are very efficient (ER 2s 90 percent) and 28 percent are inefficient (ER *£ 50 percent) for COLS model. For LP models, approximately 13 percent of the farms are very efficient and 24 percent are inefficient. The COLS model, which is parametric, results in only one farm being on the frontier (ER =1) and two farms for LP models.
The distribution of the NPAR model is skewed to the left. This is primarily due to a large number of efficient, or very efficient (ER ^ 90%), farms associated with the nonparametric frontiers. The results indicate that a large number
TABLE 2Frequency of efficiency ratio of pepper farming in Sarawak
Deterministic LP Parametric Non-Parametric StochasticParametric (COLS) (LP) (NPAR) Parametric (SPF)
31 - 40 12 ( 7.5) 11 ( 6.9)41 - 50 33 (20.8) 28 (17.6) 13 ( 8.2)51 - 60 45 (28.3) 40 (25.2) 17 (10.7) 1 ( 0.6)61 - 70 23 (14.5) 26 (16.4) 25 (15.7) 2 ( 1.3)71 - 80 13 ( 8.2) 17 (10.7) 17 (10.7) 50 (31.4)81 - 90 20 (12.6) 16 (10.1) 20 (12.6) 104 (65.4)91 - 100 13 ( 8.2) 21 (13.2) 67 (42.1) 2 ( 1.3)Minimum 0.3398 0.3605 0.4106 0.5878Maximum 1.0000 1.0000 1.0000 0.9064Average 0.6162 0.6415 0.7999 0.8168StandardDeviation 0.1712 0.1823 0.1923 0.0536Note: Figures in parenthesis represent percentage of total sample
108 PertanikaJ. Soc. Sci. 8c Hum. Vol. 7 No. 2 1999

Technical Efficiency Estimates for Sarawak Pepper Farming
31-40 41-50 51-60 61-70 71-80 81-90 91-100Efficiency Ratio
H Deterministic Parametric (COLS) f l Non- Parametric (NPAR)H LP Parametric (LP) E3 Stochastic Parametric (SPF)
Fig. 2. Distribution of efficiency ratio
of farms being on the frontier. For the NPAR model, there are 55 farms with ER = 1. In part, this is a result of piecewise-linear m anner in which the n o n p a ram e tric f ro n tie rs are constructed where each farm observation has its own frontier.
The distribution of the efficiency ratio for the SPF model is in contrast to the other three measures. Over 65 percent of the sample farms are concentrated in the 80 - 90 percent efficiency region. On average, it appears that none of the sample farms in the SPF model have efficiency level less than 50 percent and also none are perfectly efficient. This is because the frontier is stochastic, and a portion of the total error is attributable to random behaviour (Neff et al., 1993).
Table 3 presents summary statistics of the differences (DER) between the efficiency ratios estimated by the four frontier methods. A large
number positive differences indicate that, in general, the efficiency ratio of four models are ranked as SPF > NPAR > LP > COLS. There are large differences between the efficiency ratios of the COLS, LP and NPAR models. NPAR efficiency ratios are 16 percent and 19 percent higher on average, respectively, than those of COLS and LP methods.
CONCLUSIONThe purpose of this paper is to compare the results derived from alternative production frontier estimation methods. The Cobb-Douglas functional form was used to evaluate the four methods that have been frequently employed in the literature, on a sample of 159 pepper farms in Sarawak.
In general, all the four models indicate that Sarawak pepper farms are producing at 60 - 80 percent efficiency ratio. However, the study
TABLE 3Summary statistics of difference in efficiency ratio (DER) between four frontier models
COLS-LP
COLS-NPAR
COLS-SPF
LP-NPAR
LP-SPF
NPAR-SPF
Der > 0 37 1 20 0 30 74Der a 0 122 158 139 159 129 85
Difference in Efficiency RatioAverage -0.03 -0.18 -0.20 -0.16 -0.18 -0.02Minimum -0.15 -0.59 -0.42 -0.61 -0.45 -0.36Maximum 0.11 0.01 0.14 0.00 0.14 0.41
PertanikaJ. Soc. Sci. & Hum. Vol. 7 No. 2 1999 109
Alias Rad am and Mohd. Mansor Ismail
revealed that systematic differences in the efficiency measures are attributable to the m ethod used. Differences also exist in the distribution of efficiency measures and the relative rankings of the farms by various models. The distributions of the COLS and LP measures are widely dispersed and m ore norm ally distributed. In contrast, the distribution of efficiency ratios from the stochastic parametric method is highly concentrated around 70 - 90 percent efficiency rate. This is in part due to the need to estimate inefficiency using the Jondrow et al. (1992) decomposition. However, in the case of nonparam etric frontier, the results indicate that 35 percent of the sample farms are perfecdy efficient (ER = 1 ). This is because the frontier is more flexible; that is, it is a piecewise- linear instead of continuous, functional form; and it constructs a different frontier for each observation.
In summary, the results indicate that frontier production functions proved significant in computing efficiency level in pepper production. The results can assist those involved in the industry’s decision making to formulate strategy in abating inefficiency in order to enhance productivity. For example, a low level of technical efficiency indicates that increasing production would require new innovations or high-tech farming system. However, the absolute level, the distribution and the relative ranking of farm efficiency as shown in this study are influenced by the method employed. Thus, before any remedies can be suggested, the precision of predictors for individual technical efficiency should be carefully considered.
REFERENCESA jg n e r , D.J. and S.F. C h u . 1968. On estimating the
industry production function. Amer. Econ. Rev. 58: 826-839.
A ly, H.Y., K B albase , R. G rabow ski, and S. K raft .
1987. The technical efficiency of Illinois grain farms: an application of a Ray-homothetic production function. Southern J. Agric. Econ. 19: 69-78.
B ravo - U r eta , B .E . and L. R ieg er . 1990. Alternative production frontier methodologies and dairy farm efficiencies. J. Agric. Econ. 41: 215-226.
B yrnes, P. R. F are and S. G rasskopf . 1987. Technical efficiency and Size: The case of Illinois Grain farms. Euro. Rev. of Agric. Econ. 14: 367-381.
F arrell , M.J. 1957. The measurement of productive efficiency. J. Royal Statistic Soc. Series. A, 120: 253-290.
F o r s u n d , F .R ., CA.K L o v el l , and P. S c h m id t . 1980. A survey of frontier production functions and of their relationship to efficiency measurement. J. Econ. 13: 5-25.
G r a b o w sk i, R. A. K r a f t , C. P a s u r k a , and H.Y. A ly. 1990. A Ray-Homothetic and efficiency: grain farms in southern Illinois. Euro. Rev. of Agric. Econ. 17(4): 435-448.
G reene , W.H. 1980. Maximum likelihood estimation of econometric frontier functions. J. Econ. 13: 27-56.
G ree ne , W.H. (1992) LIMDEP: User's Manual and Reference Guide, Version 6.0. Econometric Software, Inc., New York.
J o n d r o w , J . , C.A.K L o vell , I .S . M a t e r o v , and P .
Sc h m id t . 1992. On the estimation of technical inefficiency in the stochastic fro n tie r production function model. J. Econ. 19: 233- 238.
K ala itzando nak es , N.G., S. Wu, and J. M a . 1992. The relationship between technical efficiency and farm size revisted. J. Agric. Econ. 40: 427- 442.
M ee u sen , W. and J. V A n den B roeck . 1977. Efficiency estimation from Cobb-Douglas production functions with composed error. Int. Econ. Rev. 18: 435-444.
N eff, D.L., P . G arcia , and R.H. H o n b a k e r . 1991. Efficiency measure using the Ray-Homothetic function: a multi period analysis. J. Agric. Econ. 23: 113-121.
N eff, D.L., P. G arcia , and C.H. N e l s o n . 1993. Technical efficiency: a com parision of production frontier methods. J. Agric. Econ. 44: 479-489.
T im m e r , C.P. 1970. On measuring technical efficiency. Food Res. Inst. Studies, 9: 99-171.
T im mer , C.P. 1971. Using a probabilistic frontier function to measure technical efficiency. J. Political Econ. 79: 776-794.
(Received: 30 November 1995)
110 Pertanika J. Soc. Sci. & Hum. Vol. 7 No. 2 1999

Pertanika J. Soc. Sci. & Hum. 7(2): 111 -119 (1999) ISSN: 0128-7702 © Universiti Putra Malaysia Press
Demand for Fish and its Substitutes in Malaysia: Evidence of Habit Formation and Structural Change
NIK MUSTAPHA R. ABDULLAH and AHMAD ZUBAIDI BAHAROMSHAHFaculty of Economics and Management
Universiti Putra Malaysia 43400 UPM Serdang, Selangor, Malaysia
Keywords: demand, fish, habit formation, structural change
ABSTRAK
Kajian ini membincangkan isu perubahan citarasa pengguna terhadap permintaan ikan dan daging di Malaysia. Kedua-dua kesan tabiat berterusan dan perubahan struktur mengenai kegemaran pengguna terhadap ikan dan penggantinya dikaji secara empirik dengan menggunakan data dari 1960 hingga 1990 dan pendekatan Sistem Permintaan Hampir Unggul (AIDS). Dengan menggunakan model dinamik AIDS, terdapat pembentukan tabiat yang berterusan di dalam permintaan terhadap ikan, ayam dan khinzir tetapi kuantiti daging lembu dan daging kambing yang dibeli dimasa lepas akan mengurangkan agihan belanjawan semasa ke atas daging-daging tersebut. Perubahan struktur mengenai kegemaran pengguna diuji dengan menggunakan prosedur CUSUMSQdan didapati tiada terdapat selangan struktur bagi persamaan ikan. Ini menunjukkan bahawa citarasa pengguna tidak berubah terhadap ikan, konsisten dengan anggapan a priori, tetapi penduduk yang lebih peka kepada cara hidup yang lebih sihat, mengubah kegemaran mereka daripada daging merah dan sekarang meminta lebih banyak daging putih, termasuk ikan.
ABSTRACT
This paper addresses the issue of changes in consumers’ tastes in the demand for fish and meat products in Malaysia. Both, habit persistent effect and structural change in consumers’ preferences towards fish and its substitutes are empirically examined using data from 1960 to 1990 with an Almost Ideal Demand System (AIDS) approach. In the dynamic AIDS model, it was found that there was a pervasiveness of habit formation in the demand for fish, chicken and pork but the amount of beef and mutton purchased during the last period tends to lower current budget allocation on these meat products. The structural change in consumers’ preferences were tested using CUSUMSQ procedure and it was found that there was no structural break in the fish equation. This indicates that consumers’ tastes do not change with respect to fish, consistent with a priori expectation, but the more health-conscious population are changing their preferences away from the red meats and currently demanding a bigger amount of white meat, which includes fish.
INTRODUCTIONMalaysia is a comparatively small, multi-racial and multi-religious country in Southeast Asia. For the past several years, the Malaysian economy has been growing at the rate of eight per cent per annum . Slightly less than half of its population are Malays, followed by Chinese, Indians and other minority races. The Malays being Moslems cannot eat pork while the Indians being predominantly Hindus are prohibited from consuming beef. Whilst meat-based protein
consumption is dependent on the racial and religious fabrics of the population fish is basically acceptable to all irrespective of income levels. Thus, it is only natural to expect that fish tends to dominate over other meat consumption in this country.
Around mid-seventies and early eighties there was a sudden increase in the demand for seafood worldwide. This shift in the consumption pattern was partly attributed to a very important discovery in the medical field on the relationship
Nik Mustapha R. Abdullah and Ahmad Zubaidi Baharomshah
between saturated fats and nutrition and health. Seafood was found to be particularly healthy because of its Omega-3 fatty acids which was often associated with reduced heart disease and neuro logical d isorders (Lees, 1988). The discovery has affected the pattern of meat consumption worldwide including many of the developing economies.
The importance of fish products (white meat) in the consumer’s diet and budget share is not entirely new in Malaysia. Being a relatively poor country then and maritime in nature, fish has naturally been a life line for the majority of its p o p u la tio n . In 1990 p er cap ita fish consumption was estimated at 37.5 kg per annum while per capita consumption for beef, poultry, mutton and pork were relatively lower at 3.49kg, 20.40kg, 0.50kg and 10.29kg, respectively (DVS, 1992). The high per capita consumption of fish relative to other meat products is not only a manifestation of the health concerns but most importantly fish is the cheapest form of protein meat available and acceptable to all races and religions in Malaysia.
Figs. 1 and 2 illustrate the per capita consumption trends for fish and other meats in Malaysia from 1960 to 1990. The summary statistics of these trends are given in Table 1. The most striking feature in these diagrams is the steady increase in the per capita consumption of fish and chicken, both of which are categorized as white meat, while the consumption of other red meats remains steady or even declining. The per capita fish consumption in particular has increased almost threefold since 1960 while chicken consumption has doubled during the same period. One possible explanation for this phenom ena is that the relative prices of chicken to beef, and fish to beef have declined over the sampled period. In terms of average budget share, fish captures 57.09% of the consumers’ total meat expenditures, pork 32.9%, chicken 13.45% while beef and mutton account for 4.36% and 2.09%, respectively. Coincidentally this consumption pattern is similar compared to those in other countries of the Pacific rim region where the principal product is unequivocally fishery products (Capps et al., 1994).
Since the introduction of the almost ideal dem an d system (AIDS) by D eaton and Muellbauer (1980), many applications of this model have been made to analyze consumer demand for food. These have included studies
TABLE 1Average per capita consumption and budget
shares for fish and meat products in Malaysia, 1960-1990
Commodity Average per capita
consumption (kg)
Average budget share of meat products (%)
Fish 37.35 57.09Chicken 9.84 13.45Pork 15.88 32.9Beef 1.67 4.36Mutton 0.65 2.09
by Blanciforti and Green (1983), Eales and Unnevehr (1988), Fulponi (1989), Moschini and Meilke (1989), and Chalfant et al. (1989). Several studies have also been carried out in this region using the same model. Examples are studies by Ahmad Zubaidi and Zainal Abidin Mohamed (1993) and Nik Mustapha et al. (1994). Except for Blanciforti and Green (1983), all these studies have applied the linear approximation of AIDS model (LA/AIDS) by using the Stone’s index to obtain price and income elasticity estimates.
Most of these applications however utilized static demand model (static AIDS) in which consum ers are assum ed to fully and instantaneously adjust their optimal purchase of commodities to current changes in prices and income. One problem of the static AIDS model is that it ignores the features of persistence in habits and the possibility of dynamic behavior in consumer demand. It has been suggested that inappropriate specification of the dynamic behavior may account for the rejection of theoretically based demand conditions (Deaton and Muellbauer, 1980). Several studies that have successfully incorporated this habit formation problem were Blanciforti and Green (1983), Burton and Young (1992) and Molina (1994), among others.
Another important aspect of demand studies is the issue of structural change in demand for fish and meat products. Statistical instability is often interpreted to mean that some underlying parameters in the utility function have changed. For example, changes in own-price elasticity (taste) or income elasticity affect the stability of the demand equations. Structural instability may result in model that may be correct in one sample period but not in another period. Structural change in Malaysian fish and meat
112 PertanikaJ. Soc. Sci. & Hum. Vol. 7 No. 2 1999

Demand for Fish and its Substitutes in Malaysia: Evidence o f Habit Formation and Structural Change
Fig. 1. Per capita consumption for fish and meat, 1960-1990
Fig. 2. Budget share for fish and meat, 1960-1990
demand is an important concern because such changes may necessitate corresponding changes in the fish and meat industry. The industry’s responses however should be based on sound economic modeling and economic forecast. Models that do not explicitly account for the changing nature of fish and meat demand may be inappropriate, and thus may suggest industry changes that are inconsistent with economic reality. Previous studies that dealt with this issue using different statistical approaches include Martin and Porter (1985), Chalfant and Alston(1988), Moschini and Meilke (1989), Chen and Veeman (1991), Burton and Young (1992) and Edwards (1992). However, the results reported in these earlier studies were mixed.
No previous studies have so far been carried out to investigate these issues in this part of the world. This study is believed to be the first attempt in this country to address such research
which undoubtedly can be very useful towards understanding consumers’ behavior in many developing countries concerning demand for protein-based meats. The objective of this paper is therefore two folds: The dynamic form of AIDS that incorporates a habit effect in the consumer expenditure function will first be estimated empirically. The purpose is to examine whether this specification yields empirical results that are consistent with the economic theory of consumer behavior. The other objective is to demonstrate evidence of structural change in the demand for fish and meat products, to assess whether or not consumers’ preferences (tastes) towards fish and other meat products have changed over the past three decades.
This paper is organized as follows. Section two discusses the specification of dynamic AIDS model. This is followed by the description of the data used in the study and the estimation
Pertanika J. Soc. Sci. 8c Hum. Vol. 7 No. 2 1999 113
Nik Mustapha R. Abdullah and Ahmad Zubaidi Baharomshah
procedure. A brief note on the testing for structural change is given in section four. Section five presents the empirical results and discussion while the last section provides the concluding comments.
MODEL SPECIFICATIONThe Almost Ideal Demand System developed by Deaton and Muellbauer (1980) as expressed in expenditure share form is:
S» - a , + ^ YijlnP j + P i ( ln E - ln P ) (1)
wherei, j = 1 , .... . n refers to meat groupsSi = the expenditure share of the ith
meat groupPj = pricesE = to ta l ex p e n d itu re on all
commodities in the system, anda., p.., p.= d em and p aram eters to be
estimated.In equation (1), P is a price index defined by
In P = a 0 + 2 )ak lnPk +k j
X S S Y jk ln P k ln P j (2)
To be consistent with the fundamental postulates of demand theory, the following conditions must hold in terms of parameter restrictions:
2a. = 1, 2 Y ij = 0, Zp. = 0 (adding-up) (2a)
S Y y = 0, (homogeneity) (2b)
Yy = Yjj (symmetry) (2c)
The standard AIDS specification in (1) is often described as static AIDS.
To incorporate consumption habit variables into the AIDS model, the “dynamic translating” procedure proposed by Poliak (1970) and Poliak and Wales (1981) is adopted here. Following this procedure, the original demand function is replaced by a new system that contains translating parameters, and it is assumed that only the (i parameters depend on the habit persistence variables. Applying this procedure to the AIDS m odel and specifying the linear dynamic translating parameter as a. = a.* + d.q , where di is the coefficient that measures the impact of previous co n su m p tio n on the c u rre n t expenditure share of meat type i, the habit persistence version of the AIDS model becomes:
S i = a , *+<1^,,-! + S Y i j l n P j +
Pi (In E -In P), i,j = l . . . ,5 (3)
whereIn P = a 0 + 2 ( a i * + d iq it_1)ln P j +
j
K 2 2 InPilHPj (4)> j
Equation (3) is popularly known as the dynamic AIDS.
The adding-up condition in the modified system applies if:
Z a * = 1, 2 y9 = 2 p, = 2 d q M = 0 (5)As in the case of the original AIDS model,
the adding up restrictions hold only locally. The restriction 2 d.q.t = 0 requires that at least one of the d. is negative. While a positive sign indicates habit persistence, a negative sign implies inventory depletion effects. The condition of homogeneity and symmetry remain as 2 y.. = 0 and Yy = Y respectively. The habit persistence extension adds n parameters to the static AIDS model.
THE DATA AND ESTIMATION PROCEDURES
The dynamic AIDS model will be estimated in this paper. The annual time series data from 1960-1990 on prices for fish and four other meat groups namely chicken, pork, beef and mutton, and income were used in this study. Consumption figures were obtained from the Department of the Veterinary Services (DVS), while data on prices were obtained from various Federal A gricultural M arketing A uthority (FAMA) bulletins. Population, income and consumer price index (CPI) were collected from various Malaysia Plans and Economic Reports. All retail prices and income data were deflated by CPI (1980=100). The per capita consumption figures were derived by dividing the total consumption for fish and each of the other meat groups with total consuming population.
The AIDS system summarized in equation (3) is non-linear in parameters. In order to permit this equation to be expressed in linear form equation (4) is often replaced by an index developed by Stone (1953). The index is:
l n P * - J j w k logPk (6)
where wk is the mean of the budget share of the k* commodity.
114 Pertanika J. Soc. Sci. 8c Hum. Vol. 7 No. 2 1999
Demand for Fish and its Substitutes in Malaysia: Evidence o f Habit Formation and Structural Change
In this paper, the dynamic AIDS model with homogeneity and symmetry restriction imposed was estimated using the Zellner’s Seemingly Unrelated Regression (SUR) m ethod.1 This permits cross equation restrictions to be imposed and with iterative solutions, estim ates are Maximum Likelihood. The mutton equation was deleted due to the adding-up restrictions.
TEST OF STRUCTURAL CHANGEThere have been many developments which could have resulted in a systematic change in the demand for fish and meat. For example, the attitude of some consumers towards red meat appears to have changed following the discovery of the relationship between saturated fats and health. The health concerns may have produced a shift in fish and meat preferences. In addition, recent developments in the fast-food industry, for example, have introduced new forms of products available to consumers and this may have directly affected the demand for fish and meat.
In this study we examined the stability (or constancy of parameters) of the meat demand equations using tests based on recursive residuals introduced by Brown, Durbin and Evan (1975). The testing was undertaken using single equation m ethod to avoid the sp illover o f any misspecification from one equation to another. The approach has the advantage over the others (for example, Chow tests) since it does not require prior knowledge of the shifts but tests for the presence of such occurrence over the sample period.2
Briefly, the cumulative sum (CUSUM) and cumulative sum of squares (CUSUMSQ) are based on the one-step-ahead forecast errors derived using recursive updated param eter estimates. Accordingly, a change in the structure overtime will result in the recursive residuals to have non-zero m ean . T he CUSUM and CUSUMSQ of these residuals are used to test for
structural change. If the plot of the CUSUM or CUSUMSQ sample path moves outside critical region, and in this case 5% significant level, the null hypothesis of stability overtime of the in tercept and slope param eters is rejected (assuming the model is correctly specified).3 In this study we only report the CUSUMSQ since it is known to be more powerful than the CUSUM test.
RESULTS AND DISCUSSIONEstimates of the structural parameters for the dynamic AIDS model are given in Table 2. Some very interesting results can be summarized from this table. Nineteen of the thirty coefficients estimated are significantly different from zero and the minimum budget shares, a., are all between zero and one for each meat type, indicating satisfactory fit. The coefficient p. are all negative and highly significant for each meat type except mutton. This implies that with the exception of mutton, fish and all other meat products are necessities.
The Durbin-Watson (D.W.) statistics in all except the pork equation are quite high, suggesting that serial correlation is not a problem. The low D.W statistic in the pork equation may suggest some sort of misspecification problem. We also compare the results of dynamic AIDS model with the static AIDS model. Based upon likelihood ratio test, it was found that the dynamic specification is preferred over the static model. The R2 values for the fish, chicken, pork and beef equations are 0.87, 0.93, 0.86 and 0.86, respectively, indicating that the model performs reasonably well in terms of explanatory power. This suggests that the AIDS model with habit formation variable (i.e. the Dynamic AIDS) is an acceptable specification of the demand model for meats.
It is also interesting to note that the habit persistence variable, d., are positive and statistically significant for fish, chicken and pork
1 The demand restrictions were tested using the log-likelihood ratio tests. In general the results obtained reject these restrictions. At conventional significant levels, these restrictions were imposed in the final estimations o f the dynamic AIDS model.
2 A major weakness o f this approach is that it is difficult to distinguish between the effects o f true structural change and model misspecification. To overcome this problem we examined alternative specifications such as static, dynamic and dynamic with diagonal autoregressive AIDS models. The results o f our preliminary investigations suggest that the dynamic AIDS specification is the preferred model based on conventional standards.
3 The CUSUMSQ has a beta distribution with mean o f (t-k)/(T-K). For more detailed discussion on the test, see Harvey (1990).
PertanikaJ. Soc. Sci. 8c Hum. Vol. 7 No. 2 1999 115
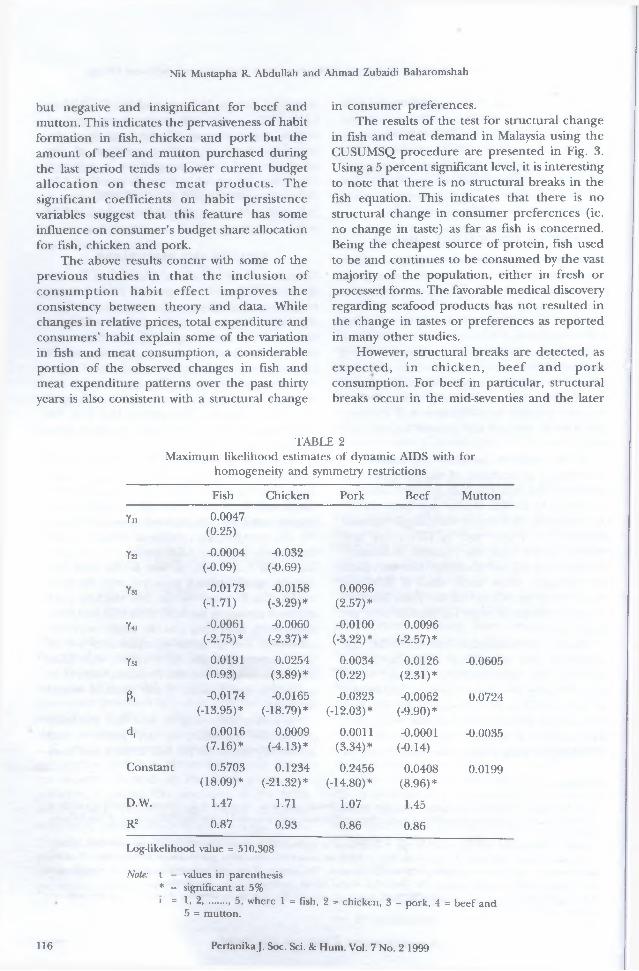
Nik Mustapha R. Abdullah and Ahmad Zubaidi Baharomshah
but negative and insignificant for beef and mutton. This indicates the pervasiveness of habit formation in fish, chicken and pork but the amount of beef and mutton purchased during the last period tends to lower current budget alloca tion on these m eat products. The significant coefficients on habit persistence variables suggest that this feature has some influence on consumer’s budget share allocation for fish, chicken and pork.
The above results concur with some of the previous studies in tha t the inclusion of co n su m p tio n h ab it effect im proves the consistency between theory and data. While changes in relative prices, total expenditure and consumers’ habit explain some of the variation in fish and meat consumption, a considerable portion of the observed changes in fish and meat expenditure patterns over the past thirty years is also consistent with a structural change
in consumer preferences.The results of the test for structural change
in fish and meat demand in Malaysia using the CUSUMSQ procedure are presented in Fig. 3. Using a 5 percent significant level, it is interesting to note that there is no structural breaks in the fish equation. This indicates that there is no structural change in consumer preferences (ie. no change in taste) as far as fish is concerned. Being the cheapest source of protein, fish used to be and continues to be consumed by the vast majority of the population, either in fresh or processed forms. The favorable medical discovery regarding seafood products has not resulted in the change in tastes or preferences as reported in many other studies.
However, structural breaks are detected, as expected , in ch icken , b ee f and p o rk consumption. For beef in particular, structural breaks occur in the mid-seventies and the later
TABLE 2Maximum likelihood estimates of dynamic AIDS with for
homogeneity and symmetry restrictions
Fish Chicken Pork Beef Mutton
Yu 0.0047(0.25)
Y21 -0.0004(-0.09)
-0.032(-0.69)
Ysi -0.0173(-1-71)
-0.0158(-3.29)*
0.0096(2.57)*
Y41 -0.0061(-2.75)*
-0.0060(-2.37)*
-0.0100(-3.22)*
0.0096(-2.57)*
Ysi 0.0191(0.93)
0.0254(3.89)*
0.0034(0.22)
0.0126(2.31)*
-0.0605
P, -0.0174(-13.95)*
-0.0165(-18.79)*
-0.0323(-12.03)*
-0.0062(-9.90)*
0.0724
d, 0.0016(7.16)*
0.0009(-4.13)*
0.0011(3.34)*
-0.0001(-0.14)
-0.0035
Constant 0.5703(18.09)*
0.1234(-21.32)*
0.2456(-14.80)*
0.0408(8.96)*
0.0199
D.W. 1.47 1.71 1.07 1.45R2 0.87 0.93 0.86 0.86
Log-likelihood value = 510.308
Note: t - values in parenthesis* - significant at 5%* = 1 . 2 ........... 5, where 1 = fish, 2 = chicken, 3 = pork, 4 = beef and
5 = mutton.
116 PertanikaJ. Soc. Sci. & Hum. Vol. 7 No. 2 1999
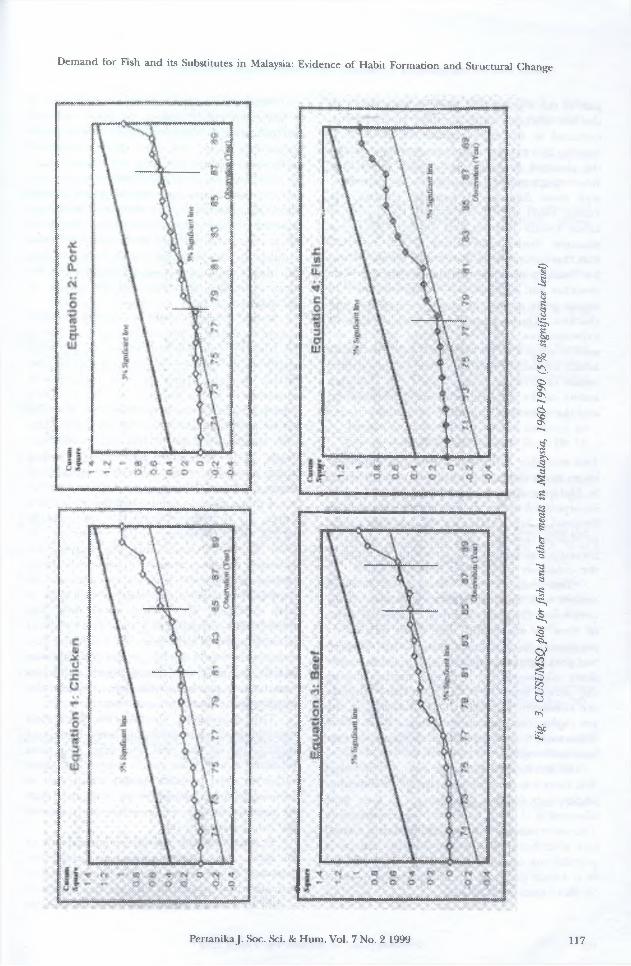
Demand for Fish and its Substitutes in Malaysia: Evidence o f Habit Formation and Structural Change
PertanikaJ. Soc. Sci. & Hum. Vol. 7 No. 2 1999 117
Fig.
3. CU
SUM
SQpl
ot fo
r fis
h and
oth
er me
ats
in M
alay
sia,
1960
-199
0 (5%
sig
nifica
nce
level)
Nik Mustapha R. Abdullah and Ahmad Zubaidi Baharomshah
part of the eighties. For pork, it was evident in the late seventies while the same phenomenon occurred in the early eighties for chicken. It appears that structural changes may have caused the demand for some red meats to decline. Interestingly enough, these trends are consistent with those findings in Australia (Martin and Porter, 1985), the USA (Edwards, 1992) and the Great Britain (Burton and Young, 1992). For example, Burton and Young (1992) reported that there was a reduction in the budget shares for beef, pork and m utton during the late seventies and eighties, but changes in tastes in recent years tended to be in favor of fish and chicken. These changes in fish and m eat expenditures and consum ption pattern are usually alleged to be associated with increasing health concerns regarding diets. O ther possible causes of these changes include the changing nature of the poultry, beef and pork products and the growth of the fast food outlets.
CONCLUSIONThis study has addressed at least two important issues in the demand for fish and meat products in Malaysia. Aspects of consumers’ tastes were incorporated in the analysis of the Almost Ideal Demand System (AIDS) for fish and other meat p roducts th rough the inclusion of hab it formation variable. The structural changes in the consumer preferences were also tested.
The results of the Almost Ideal Demand System with habit formation (dynamic AIDS) performed creditably from the statistical point of view. It was found that there was strong persistence in the consumption for fish, chicken and pork but past purchases tend to lower budget share allocations for beef and mutton during the period from 1960 to 1990. These findings are consistent with the trends observed in the per capita consumption and budget share where fish, chicken and pork tend to dominate over beef and mutton.
In the structural change tests, it was found that there was no structural change in consumer preferences for fish but changes in taste were observed in chicken, beef and pork consumption. This occurrence is consistent with studies carried out elsewhere, where the health conscious populations are now consuming lesser amount of red meat products but an increasing quantity of white meat such as fish.
Both results suggest several point of interest to Malaysian policy makers, planners and fish and meat traders. The consumers are persistently demanding more fish and their tastes and preferences towards fish have not changed over the past three decades. Fish remains as the most popular meat item and has acquired a very important position in the diet. It is therefore imperative that continuous and stable supply of fish at reasonable price be made available to the population. Any short fall in the supply of fish will bound to have a negative impact on the consumer’s diet, nutrition and the health of Malaysians at large.
Several strategies could be adopted by policy makers to ensure a sustainable supply of fish in this country. Increase importation of fish from neighboring countries would probably be the easiest op tion . However this op tio n will unnecessarily put a pressure on the country’s already strained balance of payment, and will not be politically and economically viable. The other alternative is to increase fish production locally. This proposition however will further create problems on our already overexploited fishery resources. Increasing fish price and the use of more efficient fishing technology will not redress the problem at hand but unnecessarily putting severe pressure on fish resources. In order to ensure sustainable fish supply, this renewable resources must be managed efficiently. Various management regimes are discussed in many fishery economics literatures and some of them especially the fishing effort reduction measures are currently being instituted by fishery administrators. In some areas the results are very encouraging where the fish production improves and in the long run, these fishery resources conservation measures will help mitigate the growing fish demand in this country.
The m ovem ent towards an increased importance of white meats has some important implications on the beef and other red meat industries as well. Our results suggest that these industries need to make quality adjustment in production since consumers are concerned with the potential danger of large intake of cholesterol and other saturated fats.
Further research should be carried out in this aspect using other approaches. Consumers’ responses to price and income changes before and after the structural change has occurred should be studied before any effective policies
118 Pertanika J. Soc. Sci. & Hum. Vol. 7 No. 2 1999
Demand for Fish and its Substitutes in Malaysia: Evidence o f Habit Formation and Structural Change
regarding fish and meat industries be drawn up and implemented to satisfy the presendy more effluent and health-conscious consumers in this country.
REFERENCESA h m a d Z u ba id i B. and Z a in a l A b id in M o h a m e d . 1993.
Demand for meat in Malaysia: an application of the almost demand system analysis. Pertanika J. Soc. Sci & Humanities 1: 91-95.
B la n c ifo r ti, L. and R. G r e e n . 1983. The almost ideal demand system incorporating habits. An analysis of expenditure on food and aggregate commodity groups. Rev. Econ. and Statistics 5: 511-515.
B r o w n , R.L., J. D u r b in , and J.M. E v a n s . 1975. Technique for testing the constancy of regression relationships over time. Royal Statistical Soc. J. Series B 37: 149-163.
B u r t o n , M. and T revor Yo u n g . 1992. The structure of changing tastes for meat and fish in Great Britain. Euro. Rev. of Agric. Econ. 19: 165-180.
C a p ps , O., R. T sa i, R. K irby and G.W. W illiam . 1994. A comparison of demands for meat products in the Pacific rim region. J. of Agric. Resource Econ. 19: 120-224.
C h a l f a n t , J a m e s A. and J .M . A l s t o n . 1988. Accounting for changes in tastes. J. of Poli. Econ. 96: 391-410.
C halfant , J., R* G ray and K W h it e . 1989. Evaluating Prior Beliefs in a Demand System: The Case of Meats Demand in Canada. Working Paper 483. Berkeley: Universiti of California, Department of A griculture Economics and Natural Resources.
C h e n , P.Y. and M.M. V e e m a n . 1991. An almost ideal demand system analysis for meats with habit formation and structural change. Can.J. Agric. Econ. 39: 223-235.
D e a t o n , A. and J. M u e l l b a u e r . 1980. An almost ideal demand system. Amer. Econ. Rev. 70: 312- 326.
D epartm ent o f V eterinary S ervices (D V S ) . 1992. Livestock Statistics. Ministry of Agriculture, Malaysia.
E ales , J.S. and L.J. U n n e v e h r . 1988. Demand for beef and chicken: separability and structural change. Amer. f. Agric. Econ. 70: 521-532.
E dw ards , S te ven F. 1992. Evidence of structural change in preference for seafood. Marine Resource Econ. 7: 141-151.
F u l p o n i , L. 1989. The almost ideal demand system: an application to food and meat groups for France. J. Agric. Econ. 40: 82-92.
H arvey, A. 1990. The Econometric Analysis of Time Series. 2 edn. Cambridge: MIT Press.
L ees , R.S. 1988. The Impact of Dietary Fat on Human Health. MITSG 88-3, Massachusetts Institute of Technology Sea Grant, Massachusetts Institute of Technology, Cambridge, MA.
M a r t in , W ill and D. P o r t e r . 1985. Testing for changes in the structure of the demand for meat in australia. Austr. J. Agric. Econ. 29: 16- 31.
M o l in a , J.A. 1994. Food Demand and Spain. An application of the almost ideal system. J. Agric. Econ. 45: 252-258.
M o s c h in i , G. and KD. M eilke. 1989. Modelling the pattern of structural change in the U.S. meat demand. Amer. J. Agric. Econ. 71: 253-261.
N ik M u st a p h a R . A., A.G. R o sl a n and D. P o e r w o n o .
1994. An almost ideal demand system analysis of fresh fish in Semarang, Indonesia. J. Intn. Food and Agribusiness Marketing 6: 19-28.
P ollak , R.A 1970. Habit formation and the dynamic demand functions. J. Polit. Econ. 78: 745-763.
P o llak , R.A. and T. W ale s . 1981. Demographic variables in demand analysis. Econometrica 49: 1533-1551.
S t o n e , J .R .N . 1953. The Measurement of Consumers' Expenditure and Behaviour in the United Kingdom, 1920-1938. Vol. 1, Cambridge: Cambridge University Press.
(Received: 30 October 1996)
Pertanika J. Soc. Sci. 8c Hum. Vol. 7 No. 2 1999 119

Subject Index for Volume 7 Nos. 1 and 2, 1999
AAM see Automobile Association of MalaysiaAcademic performance 11-18Achievement test 21-28AIDS see Almost Ideal Demand SystemAlmost Ideal Demand System 111-116, 118Assessment 21-28Attitudes 43-48, 50, 52-55Automobile Association of Malaysia 71-76
Back translation 59, 64
Child developmental knowledge 11-19 Children 11-18 Comparative analysis 103-110 Consumers 111-113, 116, 119 Cummulative sum see CUSUMSQ CUSUMSQ 111, 115-116, 117
DEA 79, 81, 86 Demand 111-113, 115 Dual earner families 1-6
Effectiveness 43-46, 51, 53, 55-56 Elektrikal 79-88 Elektronik 79-88 Enforcement 91-93, 95 Environmental NGOs see Environmental
non-govermental organizations Environmental non-govermental
organizations 71-76
Family background 11-18 Fish 111-113, 115-119 Forest 91-95
Gaji 59-68Gender role attitude 1-9 Gender role orientation 1-9
Habit formation 111-113 Higher education 21-28 Home environment 11-18
Illegal logging 91-95 Indeks Malmquist 79-81, 84-85, 87 Individual differences 45, 48, 53-55 Instructor made test 21-28 Instructors 21-28 Interrole conflict scale 2-4
JDI see Job Descriptive Index Job Descriptive Index 59, 64
Karangan 31-40Kemahiran menulis 31-33, 37-39Kenaikan pangkat 59, 62-68Kepuasan kerja 59-64, 66-68Kilang 79-88Knowledge 43-55Komposisi 79Kos transaksi 97, 101-102
Law 91, 92
Malays 11-18Malaysian Nature Society 71-76 Meat products 111-113, 115-119 Mengarang 31-40MNS see Malaysian Nature Society Mothers 11-18
Nurses 3-7
Offenses 91-95Oportunisme 97-98, 100, 102
Parenting 43-47, 50-56 Parenting knowledge 11-19, 47-48, 52, 54-55 Parenting module 43-48, 51-52, 55-56 Parents 43-44, 48-53, 55-56Pearson’s product moment correlation analysis 6-7Pelaburan optimal 97-102Pelajar 31-40Pengajaran 31, 34-39Penyeliaan 59, 61-68Pepper farming 103-110Perceptions 46, 48-49, 51-52, 54-55Perlakuan 31-40Pertumbuhan ekonomi 79-81, 83-86, 88Political tactics 71-76Practices 43-46, 48, 50, 52-55Pramenulis 31-40Produktiviti 79-82, 84-88Proses 31-40Public policy 71-76
Rakan sekerja 59, 61-68 Relationships 11-18 Role episode model 6-7
Pertanika J. Soc. Sci. & Hum. Vol. 6 No. 2 1998 121
Sahabat Alam Malaysia 71-76 SAM see Sahabat Alam Malaysia Sarawak 103-110 Skills 43-48, 50-55 Stimulation 11-18Structural change 111-114, 116, 118 Suasana kerja 59-61, 63-68
Tanah Rizab Melayu 97-102 Technical efficiency 103-110 Teknik-teknik pengukuran 80-81 Testing 21-28TRM see Tanah Rizab Melayu
University 21-28
Work family conflict 1-6 Working husbands 1-6 Working wives 1-6 Working women 1-6
122 Pertanika J. Soc. Sci. 8c Hum. Vol. 6 No. 2 1998
Author Index for Volume 7 Nos. 1 and 2, 1999
Ahmad Zainuddin Abdullah 97-102 Ahmad Zubaidi Baharomshah 111-119 Alias Radam 79-89, 103-110 Aminah Ahmad 1-19 Anjli Panalal K Doshi
Nik Mustapha R. Abdullah 111-119 Nor Ghani Md. Nor 97-102
Rozumah Baharudin 11-19, 43-57 Rusli Mohd 71-77, 91-95
Cheh, Kenny Sonn Lee 71-77 Sarah Salwa Adnan 79-89Sazali Abu Mansor 79-89
Kenny Cheh Sonn Lee see Cheh, Kenny Sonn Lee Sidek Mohd Noah 59-70
Mardiana Hj. Muhamad 59-70 Marohaini Yusoff 31-41 Mohamad Sahari 21-29 Mohd Azlan Shah Zaidi 97-102 Mohd Mansor Ismail 103-110
PertanikaJ. Soc. Sci. 8c Hum. Vol. 6 No. 2 1998
Acknowledgement
T he Editorial Board acknowledges the assistance of the following reviewers in the preparation o f Volume 7, Num bers 1 & 2 o f this jou rnal
Assoc. Prof. Dr. Abd Majid KontingAdilah Abdul RazakAssoc. Prof. Dr. Ahm ad ShuibAssoc. Prof. Dr. Ahm ad Zubaidi BaharomshahAsmah BeeProf. Dr. Chew Teck Aun Assoc. Prof. Dr. Fatimah Daud Dr. Hashim Kamil Dr. Jam al O thm an Assoc. Prof. Dr. Juriah Long Dr. Khaidzir Hj. Ismail
Dr. Kham aruddin Mohd. NoorAssoc. Prof. Dr. Lili Mastura Hj. H arunDr. Mad Nasir ShamsuddinAssoc. Prof. Dr. M uzafarshah HabibullahDr. R um ayajuhariDr. Sharifah Norazizan Syed YahyaProf. Dr. Shaikh Mohd. Noor AlamDr. Tai Tze YewAssoc. Prof. Dr. Wan SalihinZaiton AliAssoc. Prof. Dr. Zulkifli A. M anaf
124 Pertanika J. Soc. Sci. & Hum. Vol. 6 No. 2 1998

Preparation of Manuscript
Typing and PaperThe manuscript should be typed double spaced on A4 paper with 4cm margins on all sides, it should be limited to 25 pages including tables, illustrations and references.
Title pageThe title o f the paper, name o f author and full address o f the institution where the work was carried out should appear on this page. A short title not exceeding 60 characters should be provided for the running headlines.
AbstractEnglish and Bahasa Melayu abstracts o f 200 words each should follow the title page. Papers from outside Malaysia may be submitted with an English abstract only.
KeywordsAbout six to ten keywords are required and these should be placed directly above the abstract.
TablesTables should be typed on separate pages and numbered using Arabic numerals. Each table should be referred to in the text, has a brief title and include explanatory notes, if necessary, below it. Vertical rules should not be used. Footnotes in tables should be designated by symbols or superscript small italic letters. Tables should conform to page size.
EquationsThese must be clearly typed, triple-spaced. They should be identified by numbers in square brackets placed flush with the right margin.
Illustrations & PhotographsIllustrations including diagrams and graphs are to be referred to in the text as ‘figures’ and photographs as ‘plates’ and numbered consecutively in Arabic numerals. All photographs (glossy black and white prints) should be supplied with appropriate scales.
Illustrations should be o f print quality; output from dotmatrix printers is not acceptable, Illustrations should be on separate sheets, about twice the size in print. All letters, numbers and legends must be included on the illustration with the author’s name, short title o f the paper, and figure number written on the verso. A list o f captions should be provided on a separate sheet.
Spelling & MeasurementsThe Oxford English Dictionary should be consulted for spelling. Metric units must be used for empirical measurements.
Citations and ReferencesCitations to the literature in the text should to be indicated by the author’s nam e and year o f publication in parentheses, e.g. (Barnett and Lewis 1982). If an author is quoted in the text, the year o f publication should immediately follow in parentheses, e.g. Barnett and
Lewis (1982) state that “............” Citation of a particularpage follows the date and is preceded by a comma, e.g. Humphrey 1990, p. 26*27.
For works with multiple authors, the first author’s surname is used followed by et a l The full form of citation is used for two authors.
If two or more works by the same author are cited together, the author’s name is followed by the various years o f publication arranged in chronological order e.g. (Sulaiman 1979, 1980, 1981). In case o f citing an author with several works published in the same year, the works should be distinguished by the addition of a small letter e.g. Choa (1979a); Choa (1979b).
When several authors are cited, they are to be arranged in chronological order and separated by semicolons, e.g. Zaharah 1960; Yong 1980; Lewis 1990.
Serials are to be abbreviated as in the World List of Scientific Periodicals. The abbreviation for Pertanika Journal o f Social Science and Humanities is PertanikaJ. Soc. Sci. Hum.
The following reference style is to be observed:
BookShamsher M ohamed, Shamsuddin Ismail 8c Annuar Mohd. Nassir. 1989. Asas Belanjawan Modal 197p. Serdang: Universiti Pertanian Malaysia Press.
Chapter in Edited BookZahid Emby. 1990. The Orang Asli Regrouping Scheme- converting sw iddeners to com m erical farmers. In Margins and Minorities - The Peripheral Areas and Peoples of Malaysia, ed. V. T King 8c M.J.G. Parnwell, p. 94- 109. Hull: Hull University Press.
Unpublished Materials (e.g. theses, reports, documents) Shahwahid, H.O. 1989. Price com petitiveness and demand behaviour o f Malaysia Meranti lumber and hardwood plywood in the United States’ import market. Ph.D. D issertation, State University o f New York. Syracuse.
Ministry o f National Unity. 1973. A socio-economic survey on the new villages in Perak and Melaka. 67p. Malaysia.
SerialsNoran Fauziah Yaakub. 1990. A multivariate analysis of attitude towards teaching. Pertanika 13(2): 267-273.
Conference ProceedingsAmir Awang. 1992. C ounselling, hum an resorces development and counseling services. In Proceeding of Asia Pacific Conference on Human Resource Development, ed. Sulaiman M. Yassin, Yahya Mat Hassan Kamariah Abu Bakar, Esah Munji anda Sabariah Mohd Rashid, p. 243- 246. Serdang: Universiti Pertanian Malaysia.
Pertanika Journal of Social Science & Humanities
Volume 7 Number 2 (September) 1999
Contents
Tactics of Environmental NGOs in Influencing Public Policy in Malaysia ~ Rush Mohd and Kenny Cheh Sonn Lee
Perubahan Prodnktiviti dan Kecekapan Teknikal lndustri Perkilangan Elektrikal dan Elektronik di Malaysia - Alias Radam, Sazali Aim Mansor dan Sarah Salwa Adrian
Factors Influencing the O ccurrence o f Forest Offenses in a Peninsular Malaysia State - Rush Mohd
Cadangan Model Teoritikal bagi Menilai Kecekapan Pelaburan dalam Pem bangunan Tanah Rizab Melayu - Nor Ghani Md. Nor dan Mohd Azlan Shah Zaidi
T echnical Efficiency Estim ates for Sarawak P epper Fanning: A Comparative Analysis — Alias Radam and Mohd. Mansor Ismail
Demand for Fish and its Substitutes in Malaysia: Evidence o f Habit Formation and Structural Change -• Nik Mustapha R. Abdullah and Ahmad Zubaidi Baharomshah
I S S N D 1 2 A - 7 7 D 2
0 9
9 7 7 0 1 2 8 7 7 0 0 6 2