Embed Size (px)
Citation preview
Persuasion and Influence Practical Exercise
Seahorses©
2010 Page 1
PERSUASION
and
INFLUENCE
(The Science and Art of
Effective Presentation)
PRACTICAL EXERCISE
This handout should be read in conjunction with the book,
Persuasion and Influence, the Science and Art of Effective
Presentation. Therefore, some aspects discussed here will not
make sense unless you read the related Chapter in the book first.
If you do not already possess a copy of the book, it can be
purchased online at the following web site:
http://www.amazon.com/gp/product/B00GWC00AA
This document also refers to the related Seahorses Website, which provides a
range of supporting files and documents. The web page that contains these links
is at:
http://www.seahorses-consulting.com/persuasion_influence.html
Persuasion and Influence Practical Exercise
Seahorses©
2010 Page 2
Background
The solutions provided in this book can be applied readily to almost any situation in which
you want to successfully deliver information to other people. We could actually demonstrate
this through a wide range of scenarios. However, the practical approach that you can use to
implement the methodologies described in the Field Guide (Chapters 7 to 16), can all be
shown through the creation of a sales presentation.
The following sections give you an overview of the straightforward step-by-step approach,
which you can use to rapidly develop a truly persuasive sales presentation. However, you
can just as easily apply the same techniques to the creation of any other type of message.
Just pick the elements of this approach that suit your needs.
Each of these following sections aligns to the specific Chapters within the Field Guide, so
you can go through this scenario all at once, or you can read the book and look at the
practical implications chapter-by-chapter.
The Scenario
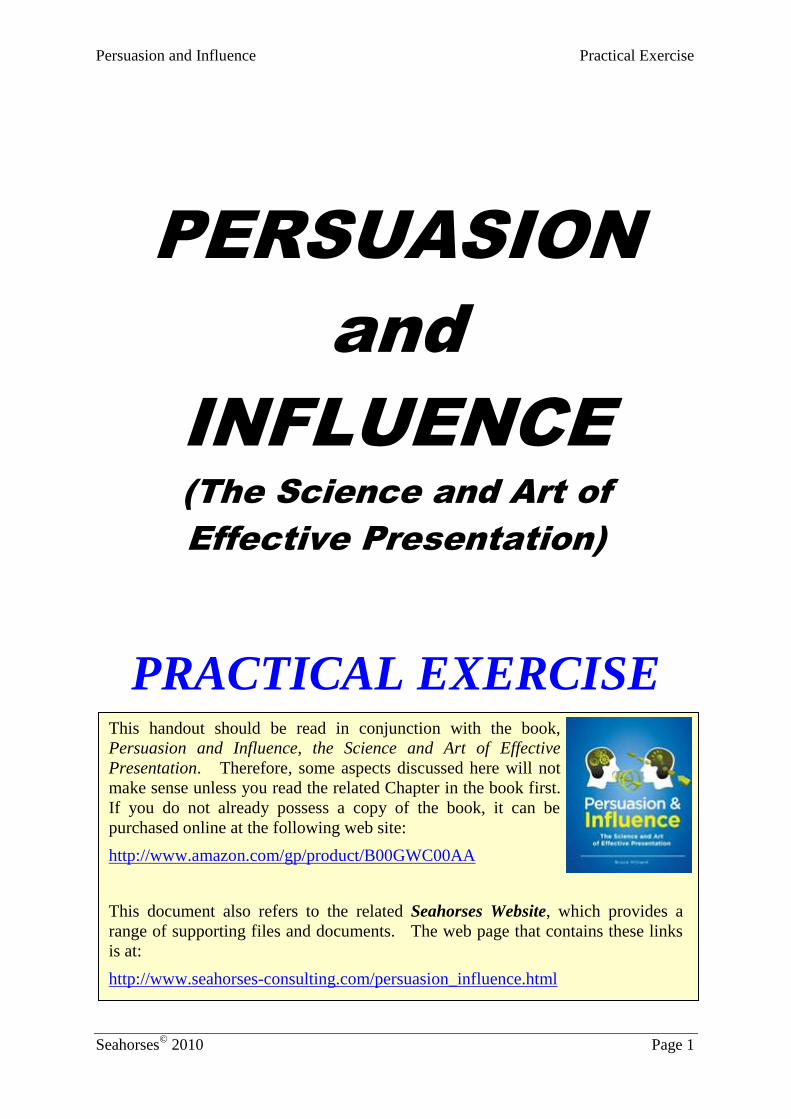
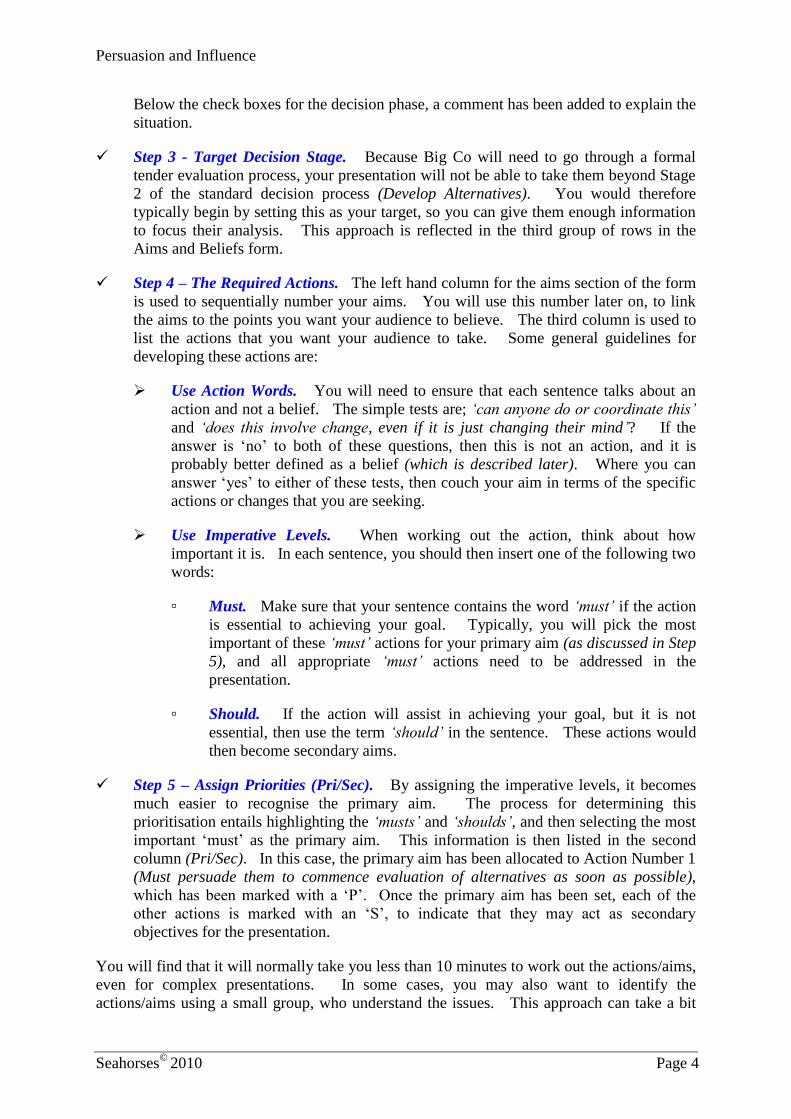
Let’s begin by looking at our scenario. In this case, you are working for a
company called Buildem, Usem and Fixem (or BUF for short), which
makes a variety of different building support and repair products. The
flagship of this range of products is the Super Widget, which is fitted into
older buildings, to stop them collapsing due to faults in their original
construction.
BUF has identified that a global organisation known as Big Co may be an ideal candidate to
buy Super Widgets, because their buildings are now getting old. More importantly, these
buildings may have the types of structural flaws that can be readily fixed by Super Widgets.
Your mission (should you decide to accept it) is to persuade Big Co to purchase $1 Million
worth of Super Widgets this year, and ideally make them an ongoing BUF customer.
Here is what you know about the situation so far:
They don’t appear to know about the possible structural flaws, and the risks that these
present.
Two companies make products that could fix the type of structural problems that may
affect Big Co’s buildings (one is BUF, and the other is our prime competitor).
Big Co probably doesn’t know anything about Super Widgets or our competitor’s
product.
Because of their internal regulations, Big Co will invariably need to formally evaluate
the problem and go to tender. Ideally, they should conduct this evaluation using the
criteria that will show the Super Widgets in the best light.
So let’s see how we can use this very broad outline and the streamlined approach provided in
this book to quickly develop a highly persuasive message.
SuperWidgets& You
SuperWidgets& You
Persuasion and Influence Defining the Aims and Beliefs
Seahorses©
2010 Page 3
Chapter 8 DEFINING THE AIMS
The first part of this process entails two very
straightforward tasks. Firstly, you will identify the aims
you want to achieve from your presentation. Next, you
will quickly work out what your audience will need to
believe, before they will support your aims.
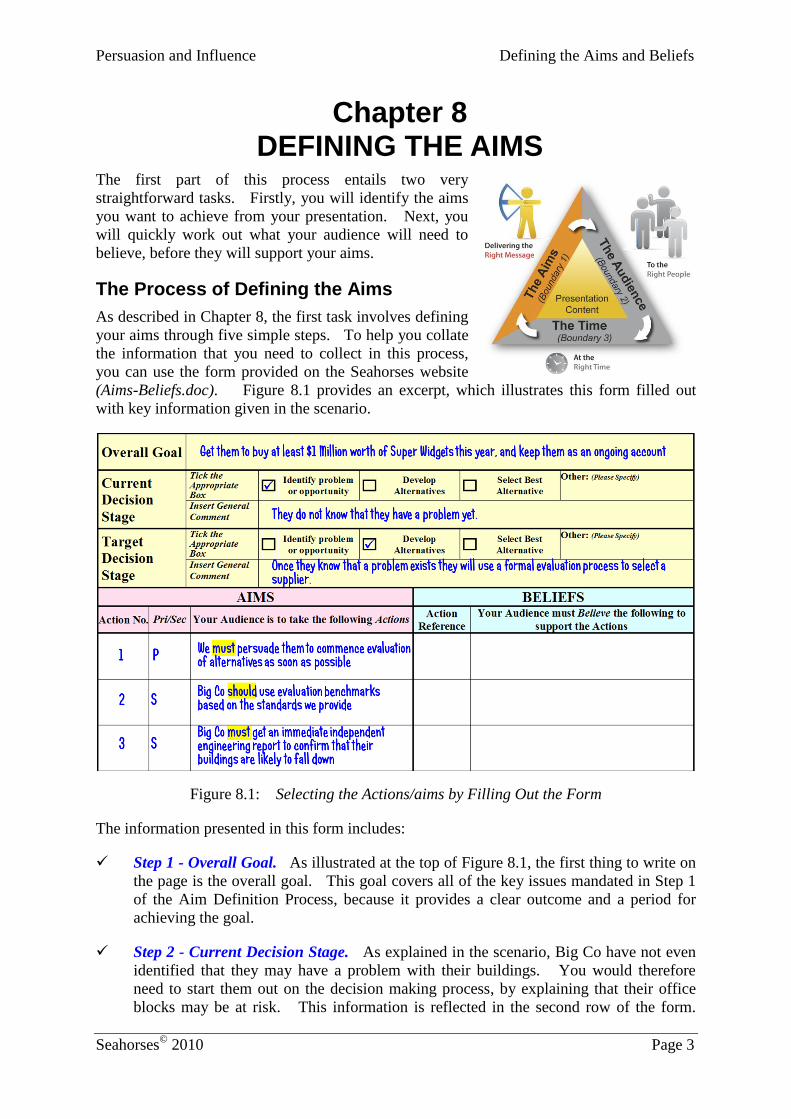
The Process of Defining the Aims
As described in Chapter 8, the first task involves defining
your aims through five simple steps. To help you collate
the information that you need to collect in this process,
you can use the form provided on the Seahorses website
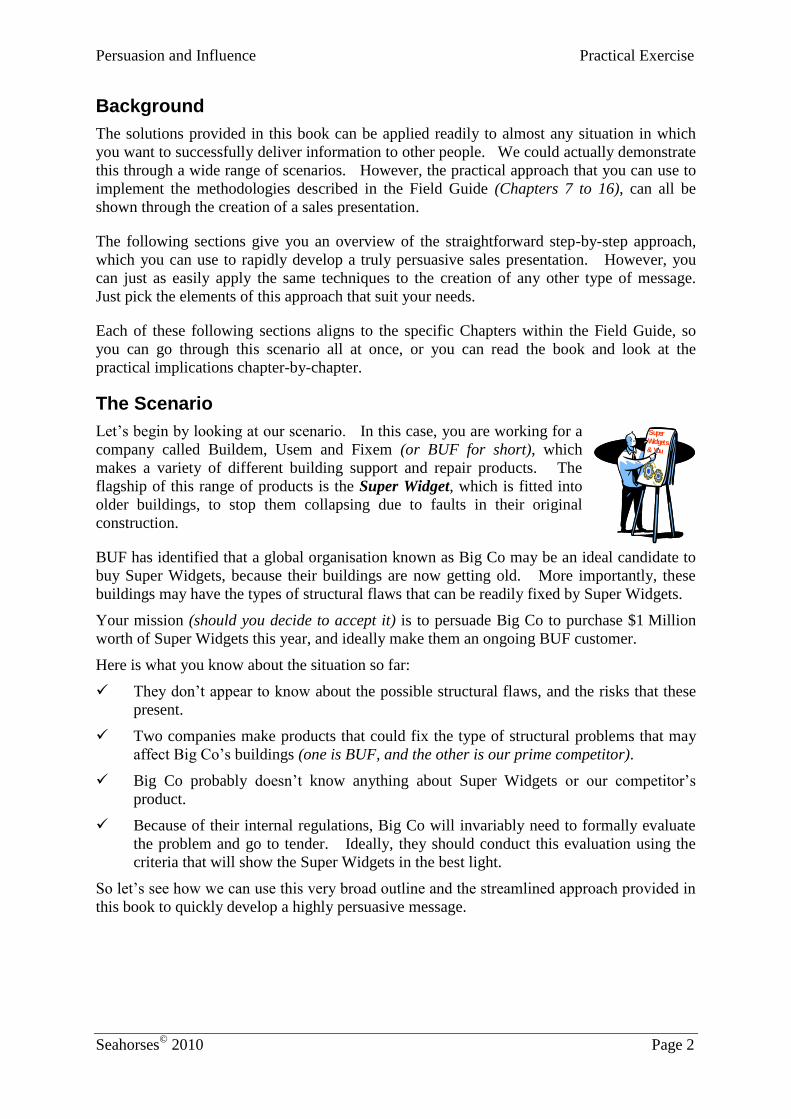
(Aims-Beliefs.doc). Figure 8.1 provides an excerpt, which illustrates this form filled out
with key information given in the scenario.
Figure 8.1: Selecting the Actions/aims by Filling Out the Form
The information presented in this form includes:
Step 1 - Overall Goal. As illustrated at the top of Figure 8.1, the first thing to write on
the page is the overall goal. This goal covers all of the key issues mandated in Step 1
of the Aim Definition Process, because it provides a clear outcome and a period for
achieving the goal.
Step 2 - Current Decision Stage. As explained in the scenario, Big Co have not even
identified that they may have a problem with their buildings. You would therefore
need to start them out on the decision making process, by explaining that their office
blocks may be at risk. This information is reflected in the second row of the form.
Persuasion and Influence
Seahorses©
2010 Page 4
Below the check boxes for the decision phase, a comment has been added to explain the
situation.
Step 3 - Target Decision Stage. Because Big Co will need to go through a formal
tender evaluation process, your presentation will not be able to take them beyond Stage
2 of the standard decision process (Develop Alternatives). You would therefore
typically begin by setting this as your target, so you can give them enough information
to focus their analysis. This approach is reflected in the third group of rows in the
Aims and Beliefs form.
Step 4 – The Required Actions. The left hand column for the aims section of the form
is used to sequentially number your aims. You will use this number later on, to link
the aims to the points you want your audience to believe. The third column is used to
list the actions that you want your audience to take. Some general guidelines for
developing these actions are:
Use Action Words. You will need to ensure that each sentence talks about an
action and not a belief. The simple tests are; ‘can anyone do or coordinate this’
and ‘does this involve change, even if it is just changing their mind’? If the
answer is ‘no’ to both of these questions, then this is not an action, and it is
probably better defined as a belief (which is described later). Where you can
answer ‘yes’ to either of these tests, then couch your aim in terms of the specific
actions or changes that you are seeking.
Use Imperative Levels. When working out the action, think about how
important it is. In each sentence, you should then insert one of the following two
words:
▫ Must. Make sure that your sentence contains the word ‘must’ if the action
is essential to achieving your goal. Typically, you will pick the most
important of these ‘must’ actions for your primary aim (as discussed in Step
5), and all appropriate ‘must’ actions need to be addressed in the
presentation.
▫ Should. If the action will assist in achieving your goal, but it is not
essential, then use the term ‘should’ in the sentence. These actions would
then become secondary aims.
Step 5 – Assign Priorities (Pri/Sec). By assigning the imperative levels, it becomes
much easier to recognise the primary aim. The process for determining this
prioritisation entails highlighting the ‘musts’ and ‘shoulds’, and then selecting the most
important ‘must’ as the primary aim. This information is then listed in the second
column (Pri/Sec). In this case, the primary aim has been allocated to Action Number 1
(Must persuade them to commence evaluation of alternatives as soon as possible),
which has been marked with a ‘P’. Once the primary aim has been set, each of the
other actions is marked with an ‘S’, to indicate that they may act as secondary
objectives for the presentation.
You will find that it will normally take you less than 10 minutes to work out the actions/aims,
even for complex presentations. In some cases, you may also want to identify the
actions/aims using a small group, who understand the issues. This approach can take a bit
Defining the Aims and Beliefs
Seahorses©
2010 Page 5
longer, but it often brings out many more actions, and produces more accurate prioritisation
of the aims for really complex messages.
Once you complete this stage, you are ready to identify what the audience will need to
believe if they are going to take each action.
What Does the Audience Need to Believe
Understanding what an audience needs to believe is generally very straightforward. Just
begin by putting yourself in the audience’s position and ask yourself this question: ‘What
would I have to believe to take that action?’ To show you how simple this is; go to Figure
8.1 (on Page 3), and think about the issues Big Co would need to believe, to take each action,
before you continue to read this section.
As I’m sure this small exercise showed you, many ideas jumped into your head when you
started to work out what your audience would need to believe. In most cases, the major
problem that arises in developing beliefs is making sure that they are all collated
appropriately. This is where the Aims and Beliefs form comes in handy. The right hand
side of this form allows you to identify the audience beliefs you will need to generate in the
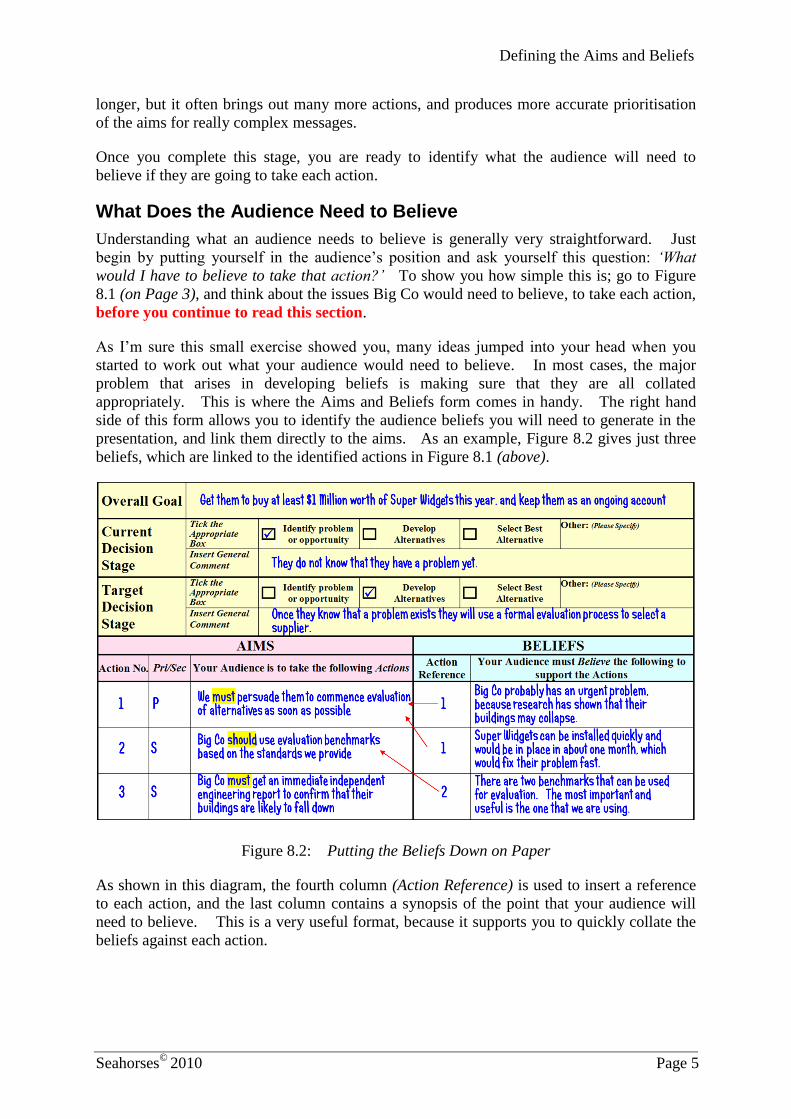
presentation, and link them directly to the aims. As an example, Figure 8.2 gives just three
beliefs, which are linked to the identified actions in Figure 8.1 (above).
Figure 8.2: Putting the Beliefs Down on Paper
As shown in this diagram, the fourth column (Action Reference) is used to insert a reference
to each action, and the last column contains a synopsis of the point that your audience will
need to believe. This is a very useful format, because it supports you to quickly collate the
beliefs against each action.
Persuasion and Influence
Seahorses©
2010 Page 6
In most cases, it takes less than 30 minutes to comprehensively work out the aims and beliefs,
even for very complex messages. In many cases, you can achieve this step in much less
time. At the end of this process, you will have a good outline of the issues that need to be
addressed during the presentation.
HINT If you use this method with a group analysis, load the Microsoft
® Word
®
template provided on the Seahorses web site, and then link the computer to a
data projector, so everyone can see the screen. You can then workshop the
aims and beliefs, and enter the data directly into the Word form. This makes
it very simple for all participants to see the content, and to collate the data on
completion (just get the computer to sort the data in the Beliefs columns in
relation to the Action Reference column).
Persuasion and Influence Profiling the Audience
Seahorses©
2010 Page 7
Chapter 9 PROFILING THE AUDIENCE
Applying the Six Steps
As described in Chapter 9, you can rapidly gain very
useful insights into your audience, by applying six easy
steps. Although each of these steps is described in
Chapter 9 in a sequential fashion, many of these typically
take place in parallel. For example, as discussed shortly,
Steps 3 and 4 typically happen together. Just as
importantly, you will often begin collecting detailed
information (Step 5), while conducting the activities
mandated in Step 2 (collecting basic information). By
carrying out these activities in parallel, you can typically
achieve your objectives more rapidly, and create a much
more influential message.
Each of the steps in this process is covered in the following sections.
Step 1 – Scope the Information Required
As this is a very important presentation, you have decided to put some real effort
into identifying the audience. This activity will then allow you to develop the
most influential message.
To support the first step, you would contact Big Co and identify an appropriate sponsor. In
this case, we have found that Ms Dee Bunk (Big Co’s Quality Assurance Officer) is interested
in the problem, and is willing to assist in setting up the presentation. She has recommended
a relatively small group of personnel to attend, and this allows you to move on to Step 2, so
you can begin collecting the information you need.
Step 2 – Collect and Collate Basic Information
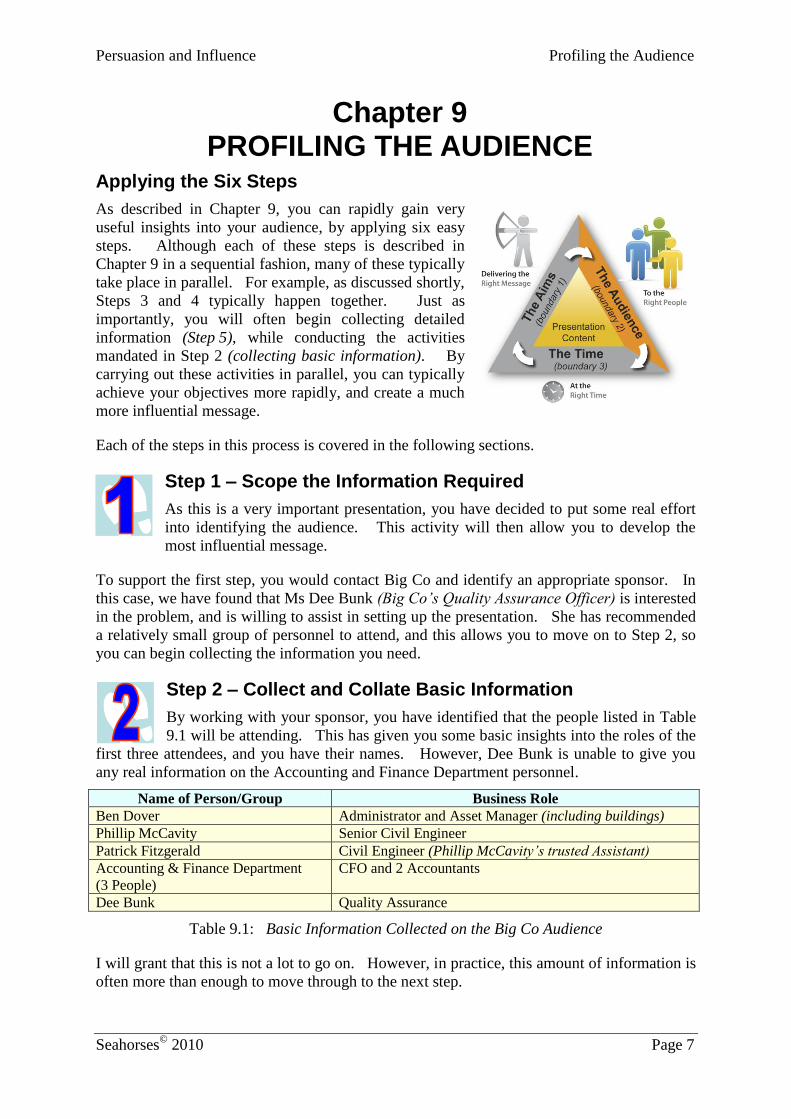
By working with your sponsor, you have identified that the people listed in Table
9.1 will be attending. This has given you some basic insights into the roles of the
first three attendees, and you have their names. However, Dee Bunk is unable to give you
any real information on the Accounting and Finance Department personnel.
Name of Person/Group Business Role
Ben Dover Administrator and Asset Manager (including buildings)
Phillip McCavity Senior Civil Engineer
Patrick Fitzgerald Civil Engineer (Phillip McCavity’s trusted Assistant)
Accounting & Finance Department
(3 People)
CFO and 2 Accountants
Dee Bunk Quality Assurance
Table 9.1: Basic Information Collected on the Big Co Audience
I will grant that this is not a lot to go on. However, in practice, this amount of information is
often more than enough to move through to the next step.
Persuasion and Influence
Seahorses©
2010 Page 8
Steps 3 & 4 - Identify and Prioritise Clusters
Although Chapter 9 treats steps three and four separately (to simplify
the description of the process), you often need to carry out these two
steps in parallel to get the best results. So let’s see how this works in practice.
As an extension to our scenario, further discussions with Dee Bunk have allowed you to get
the information you need in relation to developing an understanding of the clusters. For
instance, you have used the information gained from her to identify each person’s likely role
in the decision process. These roles are:
Deciders. There are two deciders in this situation. One is Ben Dover (the Asset
Manager) and the other is Phillip McCavity (the Senior Civil Engineer for the
business).
Accounting Influence. The three accountants include the CFO and two of his senior
finance managers. Because Big Co’s corporate culture focuses on the bottom line, this
group will play an important role. This is particularly true, as Dee Bunk has indicated
that Ben Dover is also clearly focussed on financial issues.
Other Direct Influencers. Patrick Fitzgerald is Phillip McCavity’s trusted assistant.
Patrick may therefore have a strong influence on his boss. This is particularly true as
he is also likely to be the implementer of the project to fit the Super-Widgets.
Additionally, Dee Bunk may also be influential in the final decision, due to her Quality
Assurance role.
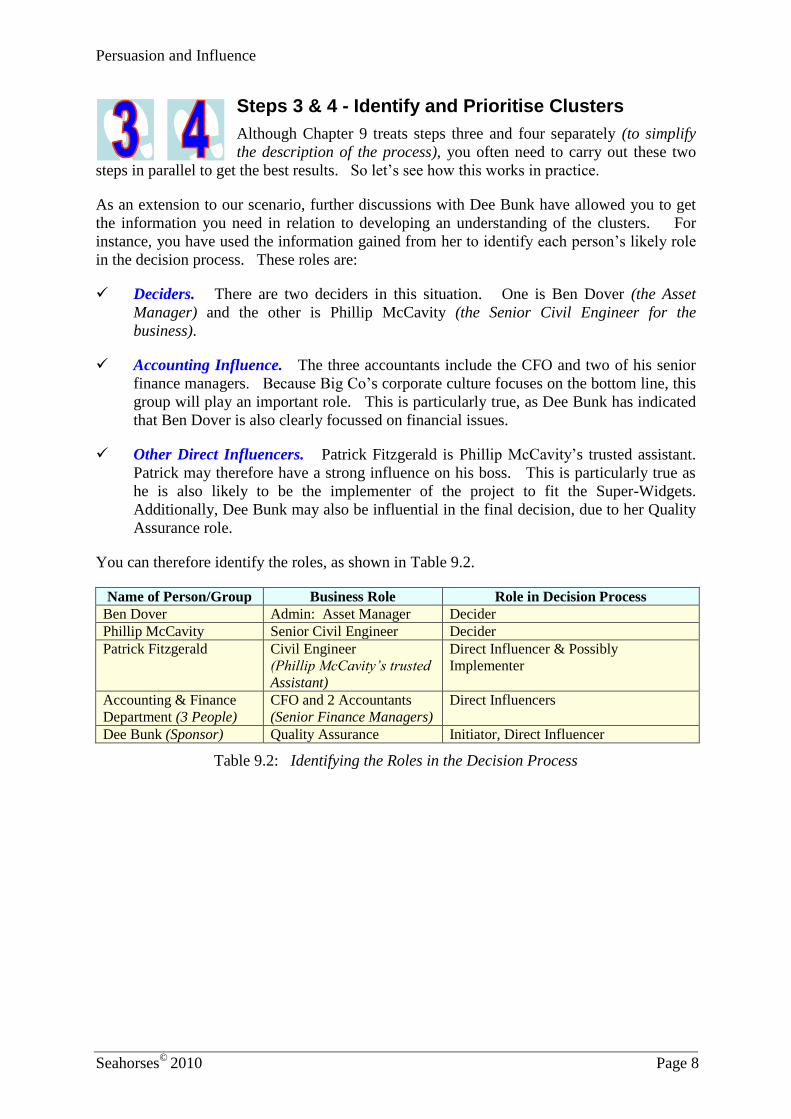
You can therefore identify the roles, as shown in Table 9.2.
Name of Person/Group Business Role Role in Decision Process
Ben Dover Admin: Asset Manager Decider
Phillip McCavity Senior Civil Engineer Decider
Patrick Fitzgerald Civil Engineer
(Phillip McCavity’s trusted
Assistant)
Direct Influencer & Possibly
Implementer
Accounting & Finance
Department (3 People)
CFO and 2 Accountants
(Senior Finance Managers)
Direct Influencers
Dee Bunk (Sponsor) Quality Assurance Initiator, Direct Influencer
Table 9.2: Identifying the Roles in the Decision Process
Profiling the Audience
Seahorses©
2010 Page 9
As you start to collate the information in this way, you will often begin to see natural clusters
within the target audience. For example, you could cluster this target audience as shown in
Table 9.3.
Cluster
Number
Members Roles in Decision
Process
Clustered by
1 Ben Dover &
3 Accountants
Decider & Direct
Influencers
Knowledge (Business/Finance focus),
Agenda (Bottom Line focus)
2 Phillip McCavity &
Patrick Fitzgerald
Decider & Direct
Influencer
Knowledge (Civil Engineering), Agenda
(Strong relationship between the two)
3 Dee Bunk Direct Influencer She does not fit into the other clusters
directly.
Table 9.3: Identified Clusters
In this case, you have applied the available knowledge within the profiling pyramid shown in
Chapter 9 (e.g. looking at human nature, culture, knowledge, agendas and personality type),
to identify the following clusters:
Cluster 1. Cluster 1 includes Ben Dover and the three accountants/finance people. In
this case, the accountants were clustered with Ben, because they are likely to have a
common business perspective, with a focus on administration and financial issues. We
could be relatively confident about this grouping, because of the information provided
by Dee.
Cluster 2. The second cluster contains both of the engineers. This cluster is quite
natural, because both of these people are bound by their relationship, and by their
common knowledge and experience. It would therefore be logical to group these
personnel into a single cluster.
Cluster 3. The final cluster consists of Dee Bunk, because she does not appear to fit
into any of the other groups.
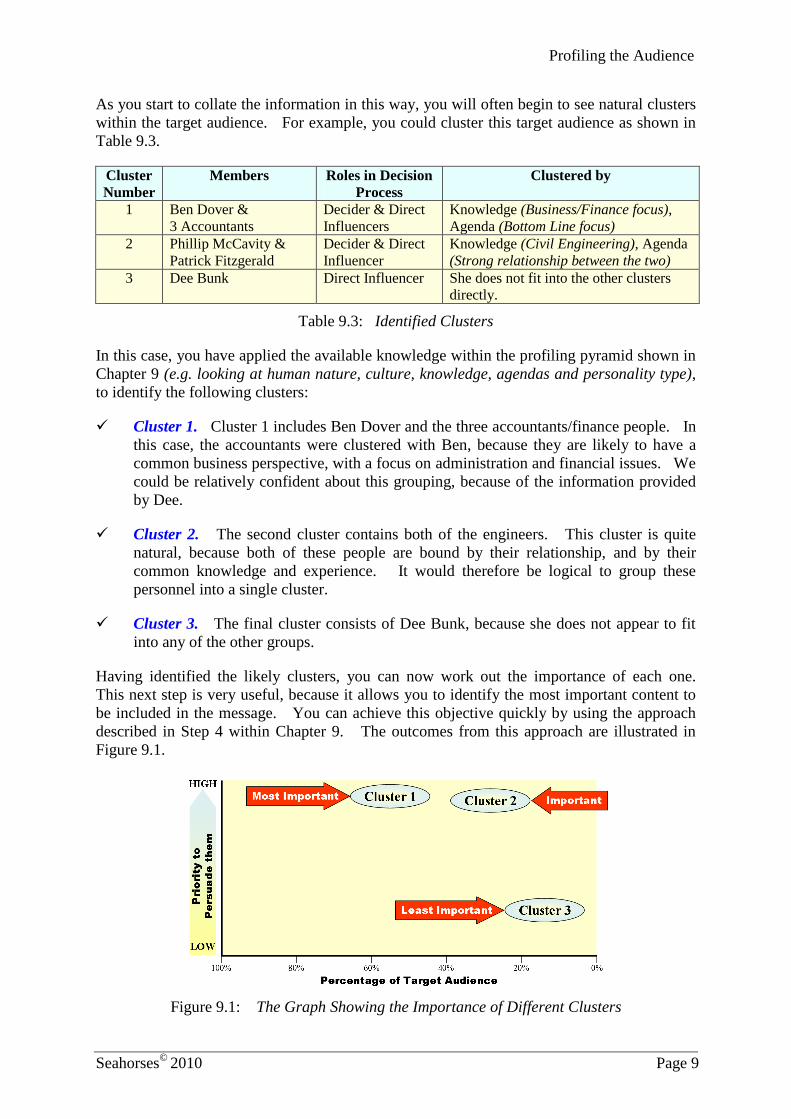
Having identified the likely clusters, you can now work out the importance of each one.
This next step is very useful, because it allows you to identify the most important content to
be included in the message. You can achieve this objective quickly by using the approach
described in Step 4 within Chapter 9. The outcomes from this approach are illustrated in
Figure 9.1.
Figure 9.1: The Graph Showing the Importance of Different Clusters
Persuasion and Influence
Seahorses©
2010 Page 10
We have aligned each Cluster in this way for the following reasons:
Cluster 1. Cluster 1 contains Ben Dover, who is one of the two deciders.
Additionally, the accountants in this cluster will have an important influence on the
decision, because Big Co focuses on financial issues. I have therefore placed Cluster 1
near the top of the vertical scale. The horizontal location of this cluster is shown in
relation to the number of people in the cluster (e.g. Cluster 1 contains four people,
which forms about 58% of the total target audience of seven people).
Cluster 2. Cluster 2 is almost as important, because it comprises two of the company’s
civil engineers. These people will undoubtedly be responsible for making the technical
decision. However, there are fewer people in this influential cluster, so the horizontal
position is further to the right than shown for Cluster 1. This position aligns to the fact
that Cluster 2 makes up only about 28 percent of the audience.
Cluster 3. It is unclear how much influence Dee Bunk will have on the final decision,
but it is apparent that she is not a decider, so we have placed this cluster lower on the
vertical scale. Additionally, because there is only one person in this cluster (about
14% of the total audience) it is positioned to the right of the other two clusters.
Once you have plotted these clusters, you can determine the overall importance of each
grouping, by simply looking at their position. For example, Clusters that are higher and
further to the left will be more important than those that are lower and to the right. From this
information, you can:
identify the groups on which you will need to focus, while collecting the more detailed
information (in Step 5); and
tailor the message to best fit with the needs of the most important clusters (e.g.
focussing on risk and cost issues in your presentation, because this is such an important
factor for the key Cluster).
Step 5 - Collect and Collate Detailed Information
Although you will typically begin collecting information in Step 2, it is often not
worth putting substantial effort into this aspect until you have identified the most
important Clusters. To achieve this objective, you can apply the very practical
information collection techniques described through Step 5 in Chapter 9.
To help you to collate the information, an Audience Profiling Form (ProfilingForm.doc) has
been provided on the Seahorses web site. All you need to do is follow the prompts in this
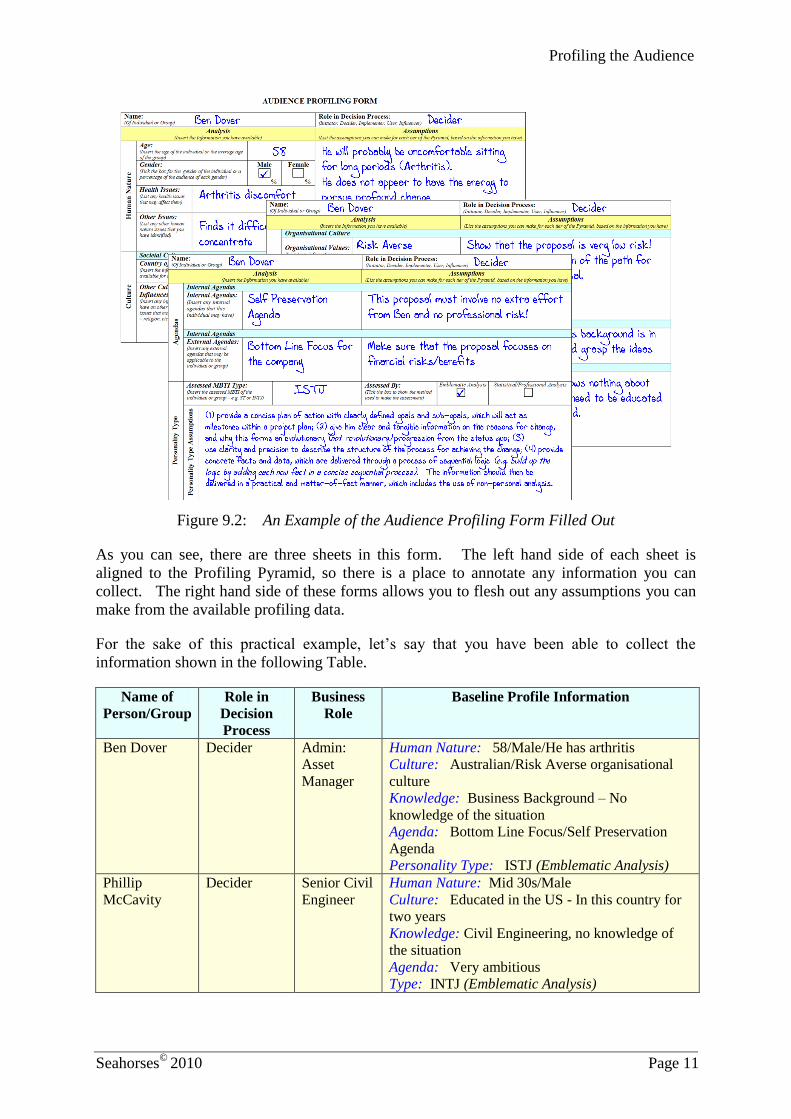
form, and add any information you collect. For example, Figure 9.2 (overleaf) shows the
data collected for Ben Dover.
Profiling the Audience
Seahorses©
2010 Page 11
Figure 9.2: An Example of the Audience Profiling Form Filled Out
As you can see, there are three sheets in this form. The left hand side of each sheet is
aligned to the Profiling Pyramid, so there is a place to annotate any information you can
collect. The right hand side of these forms allows you to flesh out any assumptions you can
make from the available profiling data.
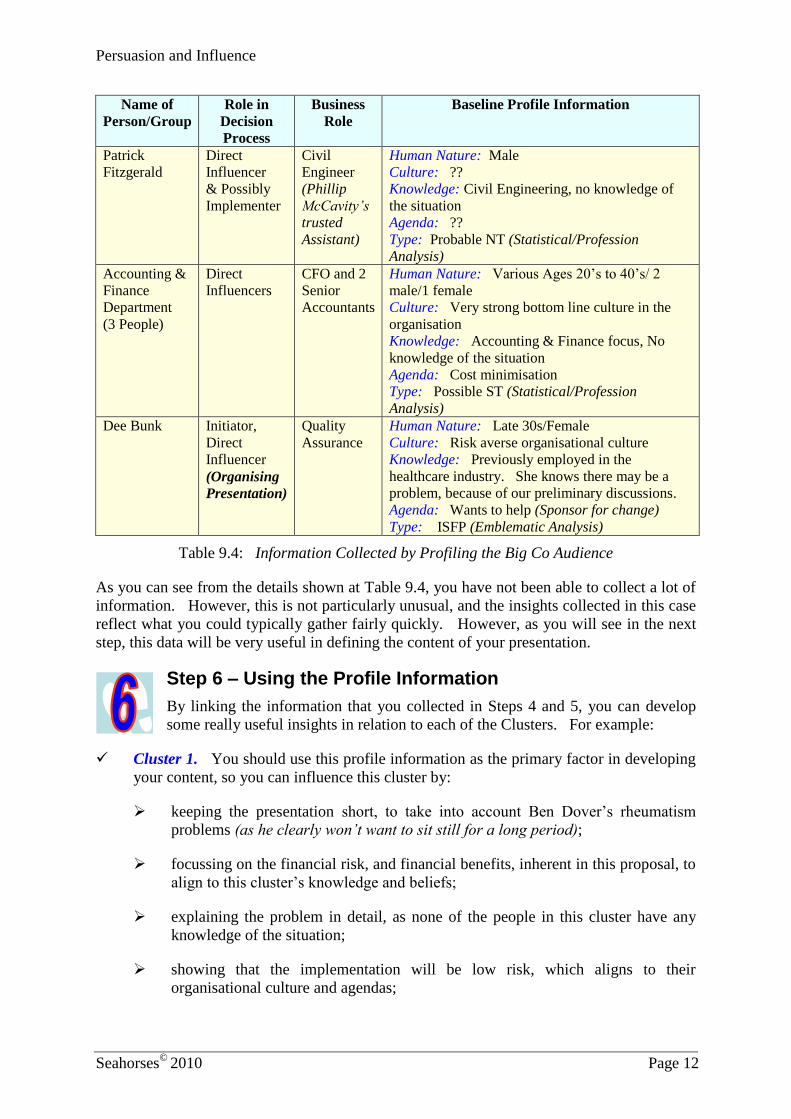
For the sake of this practical example, let’s say that you have been able to collect the
information shown in the following Table.
Name of
Person/Group
Role in
Decision
Process
Business
Role
Baseline Profile Information
Ben Dover Decider Admin:
Asset
Manager
Human Nature: 58/Male/He has arthritis
Culture: Australian/Risk Averse organisational
culture
Knowledge: Business Background – No
knowledge of the situation
Agenda: Bottom Line Focus/Self Preservation
Agenda
Personality Type: ISTJ (Emblematic Analysis)
Phillip
McCavity
Decider Senior Civil
Engineer
Human Nature: Mid 30s/Male
Culture: Educated in the US - In this country for
two years
Knowledge: Civil Engineering, no knowledge of
the situation
Agenda: Very ambitious
Type: INTJ (Emblematic Analysis)
Persuasion and Influence
Seahorses©
2010 Page 12
Name of
Person/Group
Role in
Decision
Process
Business
Role
Baseline Profile Information
Patrick
Fitzgerald
Direct
Influencer
& Possibly
Implementer
Civil
Engineer
(Phillip
McCavity’s
trusted
Assistant)
Human Nature: Male
Culture: ??
Knowledge: Civil Engineering, no knowledge of
the situation
Agenda: ??
Type: Probable NT (Statistical/Profession
Analysis)
Accounting &
Finance
Department
(3 People)
Direct
Influencers
CFO and 2
Senior
Accountants
Human Nature: Various Ages 20’s to 40’s/ 2
male/1 female
Culture: Very strong bottom line culture in the
organisation
Knowledge: Accounting & Finance focus, No
knowledge of the situation
Agenda: Cost minimisation
Type: Possible ST (Statistical/Profession
Analysis)
Dee Bunk Initiator,
Direct
Influencer
(Organising
Presentation)
Quality
Assurance
Human Nature: Late 30s/Female
Culture: Risk averse organisational culture
Knowledge: Previously employed in the
healthcare industry. She knows there may be a
problem, because of our preliminary discussions.
Agenda: Wants to help (Sponsor for change)
Type: ISFP (Emblematic Analysis)
Table 9.4: Information Collected by Profiling the Big Co Audience
As you can see from the details shown at Table 9.4, you have not been able to collect a lot of
information. However, this is not particularly unusual, and the insights collected in this case
reflect what you could typically gather fairly quickly. However, as you will see in the next
step, this data will be very useful in defining the content of your presentation.
Step 6 – Using the Profile Information
By linking the information that you collected in Steps 4 and 5, you can develop
some really useful insights in relation to each of the Clusters. For example:
Cluster 1. You should use this profile information as the primary factor in developing
your content, so you can influence this cluster by:
keeping the presentation short, to take into account Ben Dover’s rheumatism
problems (as he clearly won’t want to sit still for a long period);
focussing on the financial risk, and financial benefits, inherent in this proposal, to
align to this cluster’s knowledge and beliefs;
explaining the problem in detail, as none of the people in this cluster have any
knowledge of the situation;
showing that the implementation will be low risk, which aligns to their
organisational culture and agendas;
Profiling the Audience
Seahorses©
2010 Page 13
making sure that the audience knows that fitting the Super-Widgets will actually
minimise their work (let’s face it, agreeing to fit the Super-Widgets will require
less work than explaining why their buildings fell down), which aligns to Ben
Dover’s self preservation agenda; and
tailoring the primary structure and communications approach, to align to the ST
personality type, by taking into account the information provided in the latter part
of Chapter 9.
Cluster 2. Although the primary cluster will be used to focus the content for the
message, you would also need to build attention, desire, belief, and understanding in the
second cluster as follows:
ensure that the presentation contains enough technical information to explain and
substantiate the problem (Note: as these are NTs you will not have to give a large
amount of detail, simply provide the framework and enough information to let
them flesh out their own mental model);
make sure that Phillip McCavity can take the kudos for implementing the
decision, so this proposal supports his ambition for promotion; and
allow time to explain the strategic benefits of the proposal, so these NTs see how
it all fits into the big picture.
Cluster 3. To ensure that you do not alienate Dee Bunk, you should also ideally
provide a very short values statement in the introduction and conclusion. This will
help to align elements of your message to her SF personality type. Additionally, you
should spend a short time highlighting the quality aspects of the proposal, so the
message matches her expectations.
As you can see from this example, even a small amount of audience profile information can
help you to work out the content for your presentation. Typically, this bounding activity
does not take long, but you will be surprised how persuasive your presenting becomes when
you consider this type of information.
Persuasion and Influence Accounting for Time
Seahorses©
2010 Page 14
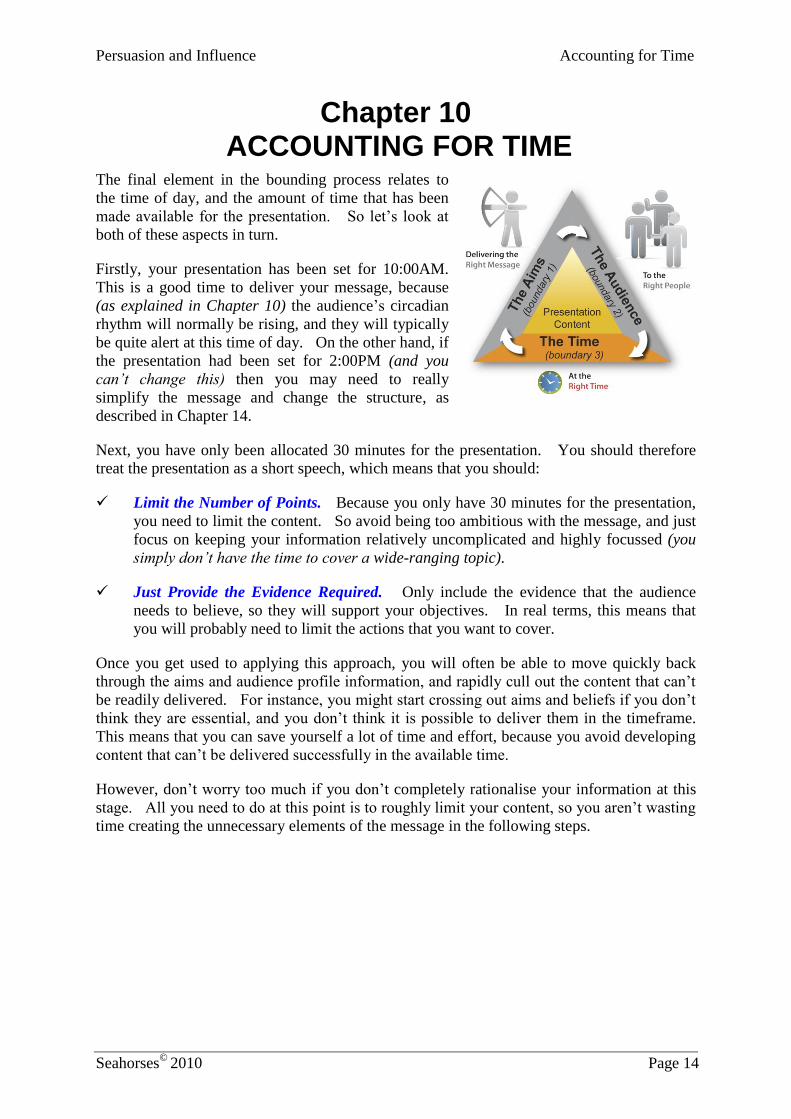
Chapter 10 ACCOUNTING FOR TIME
The final element in the bounding process relates to
the time of day, and the amount of time that has been
made available for the presentation. So let’s look at
both of these aspects in turn.
Firstly, your presentation has been set for 10:00AM.
This is a good time to deliver your message, because
(as explained in Chapter 10) the audience’s circadian
rhythm will normally be rising, and they will typically
be quite alert at this time of day. On the other hand, if
the presentation had been set for 2:00PM (and you
can’t change this) then you may need to really
simplify the message and change the structure, as
described in Chapter 14.
Next, you have only been allocated 30 minutes for the presentation. You should therefore
treat the presentation as a short speech, which means that you should:
Limit the Number of Points. Because you only have 30 minutes for the presentation,
you need to limit the content. So avoid being too ambitious with the message, and just
focus on keeping your information relatively uncomplicated and highly focussed (you
simply don’t have the time to cover a wide-ranging topic).
Just Provide the Evidence Required. Only include the evidence that the audience
needs to believe, so they will support your objectives. In real terms, this means that
you will probably need to limit the actions that you want to cover.
Once you get used to applying this approach, you will often be able to move quickly back
through the aims and audience profile information, and rapidly cull out the content that can’t
be readily delivered. For instance, you might start crossing out aims and beliefs if you don’t
think they are essential, and you don’t think it is possible to deliver them in the timeframe.
This means that you can save yourself a lot of time and effort, because you avoid developing
content that can’t be delivered successfully in the available time.
However, don’t worry too much if you don’t completely rationalise your information at this
stage. All you need to do at this point is to roughly limit your content, so you aren’t wasting
time creating the unnecessary elements of the message in the following steps.
Persuasion and Influence Focussing the Presentation
Seahorses©
2010 Page 15
Chapter 11 FOCUSSING THE PRESENTATION
Having set a rough boundary around the content for your presentation, you are
now ready to begin focussing your message. As described in Chapter 11, this
entails identifying a theme, a title, and the points that you want to cover.
The Theme
The following focus box shows the theme selected for this presentation.
This theme meets the requirements specified in Chapter 11 for the following reasons:
The Theme Meets the Primary Aim. The primary aim of this
presentation is to ‘persuade the audience to commence evaluation of
alternatives as soon as possible’ (as specified in Figure 8.1 on Page 3).
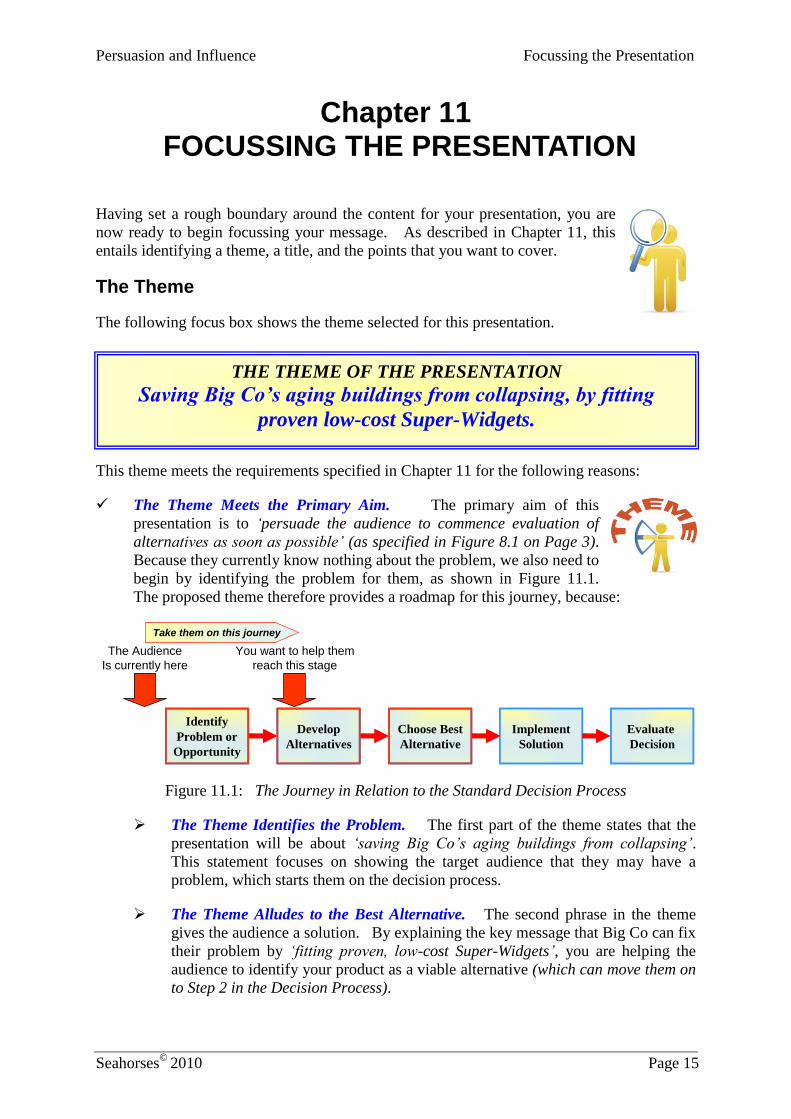
Because they currently know nothing about the problem, we also need to
begin by identifying the problem for them, as shown in Figure 11.1.
The proposed theme therefore provides a roadmap for this journey, because:
Identify
Problem or
Opportunity
Develop
Alternatives
Choose Best
Alternative
Implement
Solution
Evaluate
Decision
Identify
Problem or
Opportunity
Develop
Alternatives
Choose Best
Alternative
Implement
Solution
Evaluate
Decision
The Audience
Is currently here
You want to help them
reach this stage
Take them on this journey
Figure 11.1: The Journey in Relation to the Standard Decision Process
The Theme Identifies the Problem. The first part of the theme states that the
presentation will be about ‘saving Big Co’s aging buildings from collapsing’.
This statement focuses on showing the target audience that they may have a
problem, which starts them on the decision process.
The Theme Alludes to the Best Alternative. The second phrase in the theme
gives the audience a solution. By explaining the key message that Big Co can fix
their problem by ‘fitting proven, low-cost Super-Widgets’, you are helping the
audience to identify your product as a viable alternative (which can move them on
to Step 2 in the Decision Process).
THE THEME OF THE PRESENTATION
Saving Big Co’s aging buildings from collapsing, by fitting
proven low-cost Super-Widgets.
Persuasion and Influence
Seahorses©
2010 Page 16
The Theme Relates to the Audience. The theme relates to the audience,
because it addresses issues identified through the profiling process. For
instance, the people in Cluster 1 will be looking for a low risk solution
that minimises costs. You have addressed these issues in your theme by
using words like ‘proven’ (which alludes to it being low risk, and this is
also a Hot Word for the STs in this Cluster), and ‘low-cost’ (which will get the finance
people interested).
The Theme can be supported in the Time Available. The general scope
of the journey illustrated by this theme is achievable in the 30 minutes set
aside for the presentation.
The Theme Conforms to the General Rules. We have also achieved the
General Rules for selecting a theme, because it is clear and concise, and
it is likely to be of real interest to the audience. Just as importantly, the
theme is achievable, because the Super-Widgets can fix the problem.
You will want to mention the entire theme, or elements of it, consistently throughout the
presentation, so your audience is most likely to understand and remember this key part of
your message (due to the effects of repetition).
The Title
From this theme, the title in the following focus box was developed.
This title was selected for the following reasons:
It Should Capture their Attention and Interest.
Undoubtedly, the first thing you noticed when
you read the title was the term SwiftSure. This
is likely to have caught your attention, because
on first reading this word, you do not know what SwiftSure
is. However, the word is both intriguing, and it has positive
connotations. As shown to the left, the word SwiftSure is an
acrostic. Each letter therefore has a meaning. More
importantly, each element in this word can have another
meaning for the audience (e.g. SWIFT-Rapid resolution of
their problem and SURE-Reliable/Proven). Every time you
use the term SwiftSure, you will therefore be reinforcing a
positive image*. Te first part of the title (Saving Money,
Lives and Assets) should also positively motivate your target
audience. This title is therefore likely to get the audience’s
* The BuildingAcrostics.pdf file on the Seahorses web site provides a straightforward
process for developing powerful Acrostics.
THE TITLE OF THE PRESENTATION
Saving Money, Lives and Assets with
UPER
IDGET
NTEGRAL
ASTENING
ECHNOLOGY for
TRUCTURAL
PKEEP
EPAIR
MERGENCIES
and
Focussing the Presentation
Seahorses©
2010 Page 17
attention and interest.
It is Positive. This title generates a positive feeling, because it is all
about ‘Saving’ things. The title therefore avoids falling into a trap, by
using negative words. Because of this approach, you are more likely to
build desire through transference.
It Suggests Action. You will note that the sentence used in the title
focuses on action. This works from the first word, because ‘Saving’ is an
active verb. Additionally the first part of the acrostic ‘Swift’ also infers
activity, which reinforces the action orientation of the title.
It is Catchy and Easy to Remember. The title is relatively catchy and
quite memorable. For example, most people will tend to remember the
term SwiftSure, particularly after the acrostic is explained to them.
It is Short and Simple. The title contains only seven words, and the
message is simple to understand and remember. In particular, the acrostic
greatly simplifies the title, while still giving the audience a great deal of
underlying meaning.
None of the steps taken to create the title was particularly difficult, and the whole process
actually took less than 26 minutes, including the development of the acrostic. However, I
think you will agree that it is worth the effort, because this title can help to interest and
persuade the audience.
HINT In many cases, you will not need to develop an acrostic to make the idea or
concept more appealing. This step was added to give you an example of what
can be done quickly, to spice up your presentation title and make it more
memorable and interesting.
When applying this approach within a marketing context you will need to be sure that you
are not creating another product name, which could confuse the organisation’s marketing
strategy. Additionally, you need to be careful that you are not going to be breaching a
specifically trademarked name.
Within these limitations, techniques such as acrostics and acronyms can often be useful
when you are trying to encapsulate a concept, so it becomes more persuasive.
Persuasion and Influence
Seahorses©
2010 Page 18
The Points
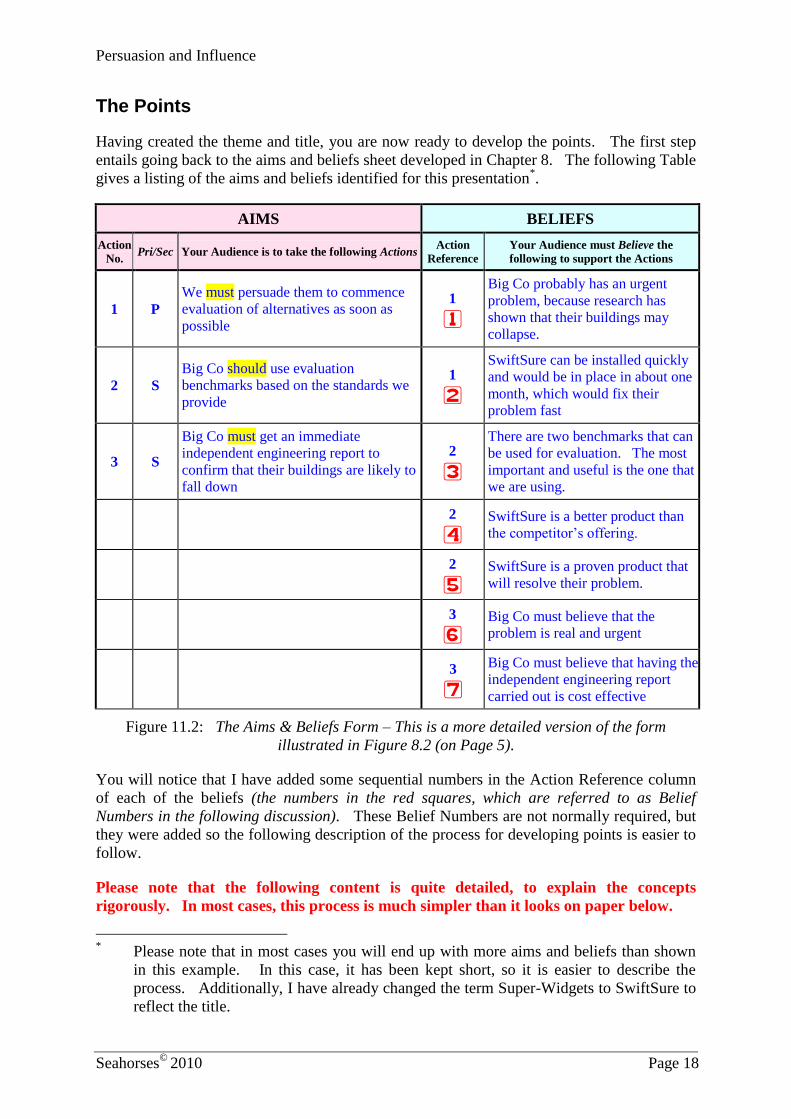
Having created the theme and title, you are now ready to develop the points. The first step
entails going back to the aims and beliefs sheet developed in Chapter 8. The following Table
gives a listing of the aims and beliefs identified for this presentation*.
AIMS BELIEFS
Action
No. Pri/Sec Your Audience is to take the following Actions
Action
Reference
Your Audience must Believe the
following to support the Actions
1 P
We must persuade them to commence
evaluation of alternatives as soon as
possible
1
1
Big Co probably has an urgent
problem, because research has
shown that their buildings may
collapse.
2 S
Big Co should use evaluation
benchmarks based on the standards we
provide
1
2
SwiftSure can be installed quickly
and would be in place in about one
month, which would fix their
problem fast
3 S
Big Co must get an immediate
independent engineering report to
confirm that their buildings are likely to
fall down
2
3
There are two benchmarks that can
be used for evaluation. The most
important and useful is the one that
we are using.
2
4
SwiftSure is a better product than
the competitor’s offering.
2
5
SwiftSure is a proven product that
will resolve their problem.
3
6
Big Co must believe that the
problem is real and urgent
3
7
Big Co must believe that having the
independent engineering report
carried out is cost effective
Figure 11.2: The Aims & Beliefs Form – This is a more detailed version of the form
illustrated in Figure 8.2 (on Page 5).
You will notice that I have added some sequential numbers in the Action Reference column
of each of the beliefs (the numbers in the red squares, which are referred to as Belief
Numbers in the following discussion). These Belief Numbers are not normally required, but
they were added so the following description of the process for developing points is easier to
follow.
Please note that the following content is quite detailed, to explain the concepts
rigorously. In most cases, this process is much simpler than it looks on paper below.
* Please note that in most cases you will end up with more aims and beliefs than shown
in this example. In this case, it has been kept short, so it is easier to describe the
process. Additionally, I have already changed the term Super-Widgets to SwiftSure to
reflect the title.
Focussing the Presentation
Seahorses©
2010 Page 19
I began this process by assessing each of these beliefs using the six questions described in
Chapter 11. At the end of this process, I was able to develop three groups of points, which
addressed all of the issues we want the audience to believe. This approach has also addressed
other factors, such as the audience’s expectations, and their issues and knowledge. The
three groups of points developed in this scenario are:
Points Group 1. As indicated in
Figure 11.2 (above), we want Big
Co to believe that they probably
have an urgent problem, because
research has shown that their
buildings may collapse (Belief 1).
Additionally, Big Co must believe
that the problem is real and urgent,
so they will get an immediate
independent engineering report
(Belief 6). However, before they
commission this independent engineering report, it is likely that they will want to
believe that doing so would be cost effective (Belief 7). Each of these three points fit
together quite well, because the aims/actions they support (Aims 1 and 3) are closely
related. By grouping the points in this way, you can minimise the amount of time
needed to get the message across. To support this point, the following evidence should
be included:
(Belief 1) Explain the Problem. When explaining the problem to this audience
you will need to:
▫ Provide Specific Facts. The STs in Cluster 1 will need to receive concrete
facts, before they believe that they have a problem. Additionally, the
engineers in Cluster 2 will require clear technical information, to support
their decision making process. If time is available, you could also include
some evidence that comes from a respected person, because Dee Bunk (an
SF type) may be swayed by the opinions of other people.
▫ Explain the Implications. The NTs in Cluster 2 are likely to understand
the implications very quickly (because they will typically assess the
consequences against their mental model). You should therefore not need
to cover the implications for this group in too much detail. However, you
may want to explain the repercussions to the members of Cluster 1 in terms
of risk (in particular financial risk), so they can link to their knowledge and
paradigm more effectively.
(Belief 6) Explain the Urgency. You have already shown that the problem is
very real, so the next step is to explain the urgency of the problem and describe
the implications if they do nothing. Remember, the very real risk of the roof
landing on their heads soon (if no action is taken), can be a strong motivator.
(Belief 7) The Next Step can be Low Risk & Cost Effective. Although there is a
chance that Big Co’s buildings might be at risk, there will be no direct evidence
until an engineering survey is conducted. You can therefore explain to the target
audience that getting the engineering report first is a low risk and low cost
Focussing the Points
(Points Group 1) The first group of points focuses
on getting Big Co to commence the
evaluation quickly (Aim 1). However, it is
unlikely they will commence the evaluation
until an engineering analysis is conducted
(Aim3). Aim 1 is therefore dependent on
Aim 3, so it is logical to group these issues.

Persuasion and Influence
Seahorses©
2010 Page 20
approach, because they can quickly determine their exposure to this problem.
This conforms to the audience’s paradigm (particularly in regard to the risk
averse approach that characterise the Cluster 1 personnel), which means that
they are more likely to directly supports your aims.
Points Group 2. The second
grouping of points is designed to
explain that SwiftSure is a proven
product that will help to resolve
their problem (Belief 5). Just as
importantly, SwiftSure can be
installed quickly, which could fix
Big Co’s predicament fast (Belief 2).
Both of these points focus on
showing SwiftSure as a viable
alternative for assessment. To
persuade the audience, the following
supporting evidence should be included:
(Belief 5) SwiftSure is Proven. To demonstrate that SwiftSure is a proven
product, you firstly need to show that the Super-Widgets have already been
effective when used in similar circumstances. You will then need to:
▫ Provide Data. You will need to provide factual evidence that SwiftSure is
a proven solution to both the Cluster 1 (ST) and Cluster 2 (NT) personnel.
This will allow you to leverage the Thinking (T) preferences of these two
groups, to aid acceptance of your message.
▫ Deliver Testimonials. Additionally, testimonials from trusted people are
likely to have a persuasive effect, particularly on Dee Bunk, because she is
an SF type.
▫ Link to Audience Knowledge. When discussing SwiftSure as a proven
product, you would typically need to play up specific factors such as; low
initial and ongoing costs (targeting Cluster 1), well engineered design and
the use of titanium to increase strength (targeting Cluster 2), and the
application of integrated quality assurance to guarantee superior
construction and fitment (targeting Cluster 3). In each case, you are
leveraging the audience knowledge to help ensure that they accept your
information more readily.
(Belief 2) Quick Implementation. When explaining the proven qualities of
SwiftSure, you should also explain to the audience that the products can be fitted
quickly. In covering this issue you will need to:
▫ Explain the Fitment Approach. You will typically only need to provide a
high-level description of the fitment process. This need stems from the
fact that the NTs (in Cluster 2) are less likely to be interested in the low-
level detail during this presentation. Additionally, Clusters 1 and 3 may
feel that this detailed description is beyond the scope of their roles.
Focussing the Points
(Points Group 2) The first group of points explained
that there was a problem that needed to be
addressed (Step 1 in the standard decision
process). The second group of points will
help the audience to understand that
SwiftSure is a viable solution, so you are
helping them develop alternatives (Step 2 in
the standard decision process).
Focussing the Presentation
Seahorses©
2010 Page 21
However, you would need to be ready to answer specific questions at the
end of the presentation, to give details of the systematic process.
▫ Use an Implementation Example. When describing the fitment approach,
you should ideally do this by explaining it in terms of a completed project.
This will give the ST members of Cluster 1 the feeling that the rapid fitment
approach you are describing is concrete, so they will be more willing to
accept the information.
▫ Explain the Work they would Need to do. The key decider in Cluster 1
(Ben Dover) is likely to be averse to a proposal that indicated that they
would have to do extra work. When describing the implementation process
you would therefore want to emphasise the fact that this recommended
approach will actually minimise their workload.
▫ Explain that they could get the Kudos. It was clear from the audience
profiling that Phillip McCavity (the senior engineer in Cluster 2) was
ambitious, and would be more willing to support your recommendations if
he was going to get the kudos. You would therefore want to allude to this
during the presentation.
Points Group 3. There are two
remaining beliefs identified in
Figure 11.2 (on Page 18), which
should be covered if time is
available. Firstly, you want the
audience to believe that there are
two benchmarks applicable to their
evaluation. The most suitable and
useful is the one that we are using
(Belief 3). Finally, SwiftSure is a
better product than the competitor’s
offering (Belief 4). To get the
audience to believe these two
points, the following supporting evidence should be provided:
(Belief 3) Explain the Benchmarks. In this situation, you would need to explain
the two benchmarks that Big Co could use to assess the alternatives. In
explaining the benchmarks, you would want the audience to reach the conclusion
that there is really only one suitable solution for their case (and this benchmark is
the one that will show SwiftSure in the best light). In particular, you would want
to target the Cluster 2 engineers, by providing key technical information (as this
group is most likely to be interested in this aspect). You can also optimise
acceptance by Clusters 1 and 3, by showing that the recommended benchmark
would pose the least risk.
(Belief 4 – Part 1) Identify the Alternatives for Big Co. For the audience to
effectively assess the SwiftSure product, you would first have to explain the
alternative product. You would therefore need to provide a dispassionate and
matter-of-fact explanation of the two available solutions.
Focussing the Points
(Points Group 3) The final group of points aims to
shape the evaluation criteria that Big Co will
use to assess the alternatives. Additionally,
by assessing SwiftSure in relation to the
recommended benchmarks, you are helping
Big Co understand the best alternative,
thereby setting them up to move quickly
through to Step 3 of the standard decision
process.
Persuasion and Influence
Seahorses©
2010 Page 22
(Belief 4 – Part 2) SwiftSure is a Better Product. This point is dependent on
firstly describing the two alternatives (otherwise, they can’t put your information
into context). You can then show that SwiftSure is the best solution for Big Co,
by giving the following additional evidence:
▫ Assess the Two Products Against the Recommended Benchmark. You
can quickly show the audience how the two alternate products stack up
against the recommended benchmark. This type of information should be
delivered in a practical and matter-of fact way, so it conforms to the way
the Thinking (T) types (ST/NT) will want the data delivered.
▫ Highlight SwiftSure’s Use of Advanced Innovation. Finally, the NT
engineers are likely to look positively at a product that is highly innovative
and ingenious. You would therefore need to highlight this aspect when
comparing the two products against the benchmarks.
You typically would not need to define the points using the level of detail shown in the
preceding discussion. I included this detail so you can get a feel for the thought processes
involved. In most cases, you will be able to bypass this step entirely and simply fit your
points (as defined in the Aims and Beliefs form) into the dominant Template that you
select using the approach described in the following Chapter.
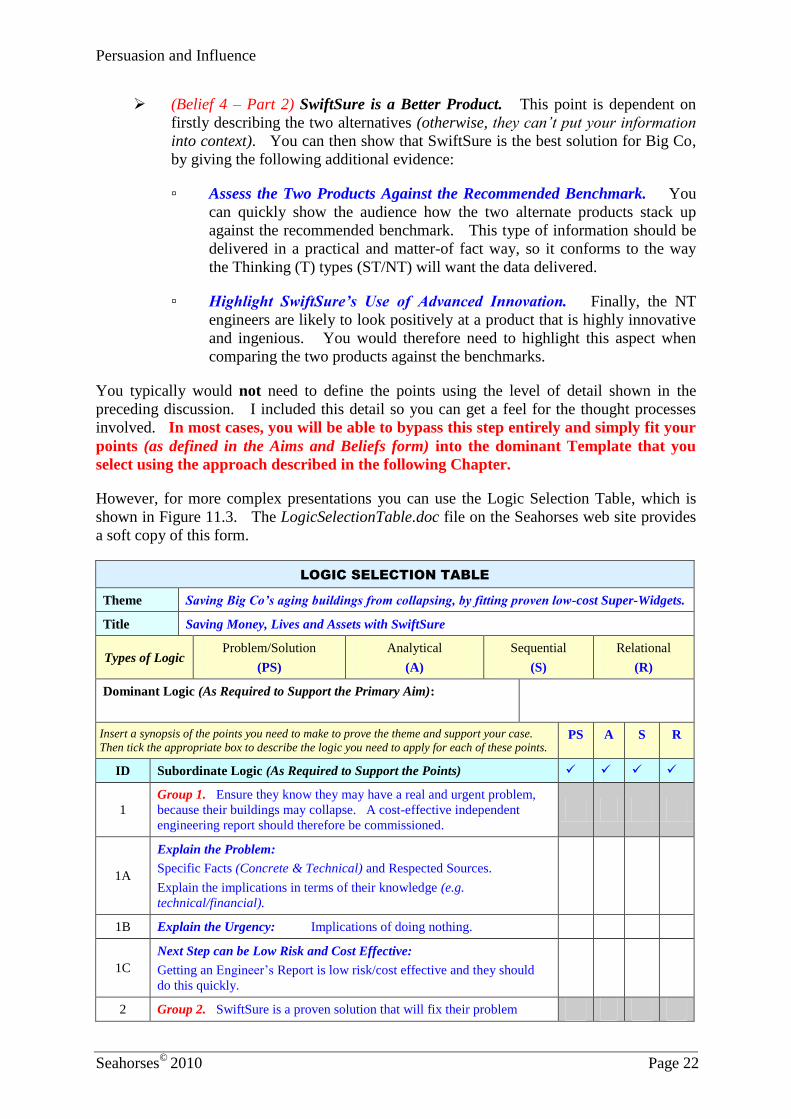
However, for more complex presentations you can use the Logic Selection Table, which is
shown in Figure 11.3. The LogicSelectionTable.doc file on the Seahorses web site provides
a soft copy of this form.
LOGIC SELECTION TABLE
Theme Saving Big Co’s aging buildings from collapsing, by fitting proven low-cost Super-Widgets.
Title Saving Money, Lives and Assets with SwiftSure
Types of Logic Problem/Solution
(PS)
Analytical
(A)
Sequential
(S)
Relational
(R)
Dominant Logic (As Required to Support the Primary Aim):
Insert a synopsis of the points you need to make to prove the theme and support your case.
Then tick the appropriate box to describe the logic you need to apply for each of these points. PS A S R
ID Subordinate Logic (As Required to Support the Points)
1
Group 1. Ensure they know they may have a real and urgent problem,
because their buildings may collapse. A cost-effective independent
engineering report should therefore be commissioned.
1A
Explain the Problem:
Specific Facts (Concrete & Technical) and Respected Sources.
Explain the implications in terms of their knowledge (e.g.
technical/financial).
1B Explain the Urgency: Implications of doing nothing.
1C
Next Step can be Low Risk and Cost Effective:
Getting an Engineer’s Report is low risk/cost effective and they should
do this quickly.
2 Group 2. SwiftSure is a proven solution that will fix their problem
Focussing the Presentation
Seahorses©
2010 Page 23
LOGIC SELECTION TABLE
Theme Saving Big Co’s aging buildings from collapsing, by fitting proven low-cost Super-Widgets.
Title Saving Money, Lives and Assets with SwiftSure
Types of Logic Problem/Solution
(PS)
Analytical
(A)
Sequential
(S)
Relational
(R)
Dominant Logic (As Required to Support the Primary Aim):
Insert a synopsis of the points you need to make to prove the theme and support your case.
Then tick the appropriate box to describe the logic you need to apply for each of these points. PS A S R
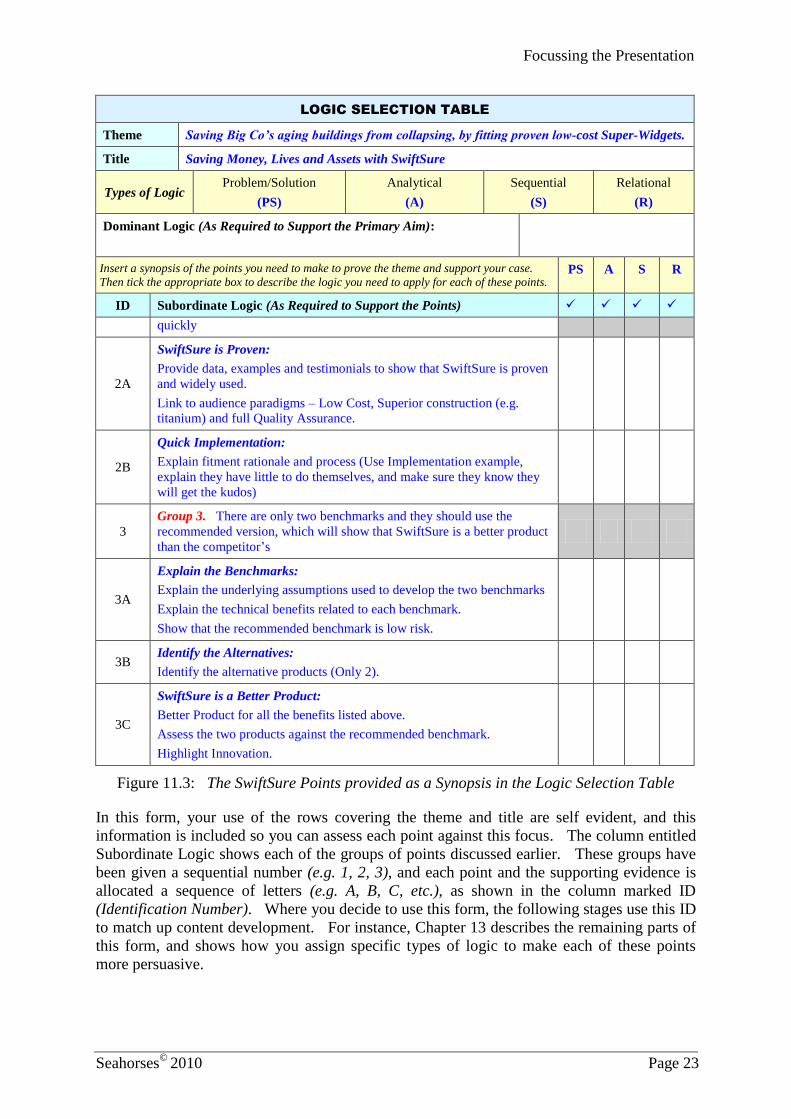
ID Subordinate Logic (As Required to Support the Points)
quickly
2A
SwiftSure is Proven:
Provide data, examples and testimonials to show that SwiftSure is proven
and widely used.
Link to audience paradigms – Low Cost, Superior construction (e.g.
titanium) and full Quality Assurance.
2B
Quick Implementation:
Explain fitment rationale and process (Use Implementation example,
explain they have little to do themselves, and make sure they know they
will get the kudos)
3
Group 3. There are only two benchmarks and they should use the
recommended version, which will show that SwiftSure is a better product
than the competitor’s
3A
Explain the Benchmarks:
Explain the underlying assumptions used to develop the two benchmarks
Explain the technical benefits related to each benchmark.
Show that the recommended benchmark is low risk.
3B Identify the Alternatives:
Identify the alternative products (Only 2).
3C
SwiftSure is a Better Product:
Better Product for all the benefits listed above.
Assess the two products against the recommended benchmark.
Highlight Innovation.
Figure 11.3: The SwiftSure Points provided as a Synopsis in the Logic Selection Table
In this form, your use of the rows covering the theme and title are self evident, and this
information is included so you can assess each point against this focus. The column entitled
Subordinate Logic shows each of the groups of points discussed earlier. These groups have
been given a sequential number (e.g. 1, 2, 3), and each point and the supporting evidence is
allocated a sequence of letters (e.g. A, B, C, etc.), as shown in the column marked ID
(Identification Number). Where you decide to use this form, the following stages use this ID
to match up content development. For instance, Chapter 13 describes the remaining parts of
this form, and shows how you assign specific types of logic to make each of these points
more persuasive.
Persuasion and Influence Setting the Structure
Seahorses©
2010 Page 24
Chapter 12 SETTING THE STRUCTURE
Now that you have an outline of the points you want to make, you can
begin to look at the high-level structure of your message. As discussed
in Chapter 12, this entails setting the broad outline of the content for the
Preliminaries, Introduction, Body, Conclusion, Question Answer and
Discussion (QA&D) period, and Follow-Up.
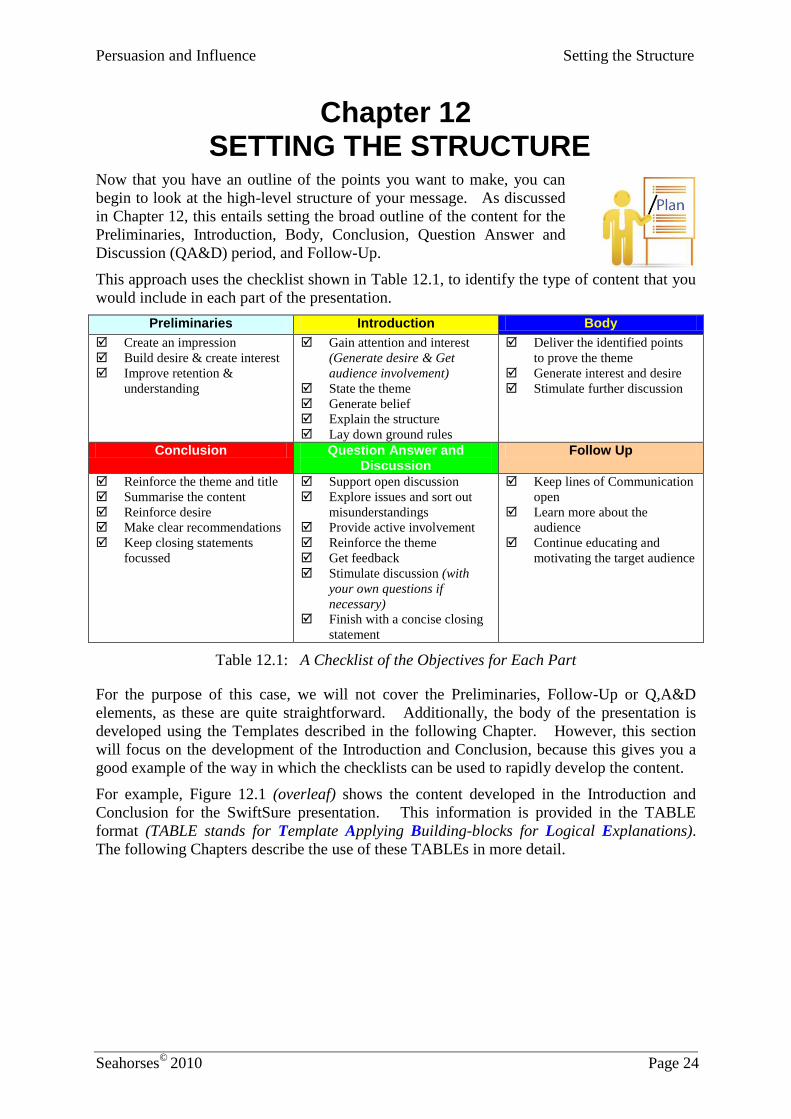
This approach uses the checklist shown in Table 12.1, to identify the type of content that you
would include in each part of the presentation.
Preliminaries Introduction Body
Create an impression
Build desire & create interest
Improve retention &
understanding
Gain attention and interest
(Generate desire & Get
audience involvement)
State the theme
Generate belief
Explain the structure
Lay down ground rules
Deliver the identified points
to prove the theme
Generate interest and desire
Stimulate further discussion
Conclusion Question Answer and Discussion
Follow Up
Reinforce the theme and title
Summarise the content
Reinforce desire
Make clear recommendations
Keep closing statements
focussed
Support open discussion
Explore issues and sort out
misunderstandings
Provide active involvement
Reinforce the theme
Get feedback
Stimulate discussion (with
your own questions if
necessary)
Finish with a concise closing
statement
Keep lines of Communication
open
Learn more about the
audience
Continue educating and
motivating the target audience
Table 12.1: A Checklist of the Objectives for Each Part
For the purpose of this case, we will not cover the Preliminaries, Follow-Up or Q,A&D
elements, as these are quite straightforward. Additionally, the body of the presentation is
developed using the Templates described in the following Chapter. However, this section
will focus on the development of the Introduction and Conclusion, because this gives you a
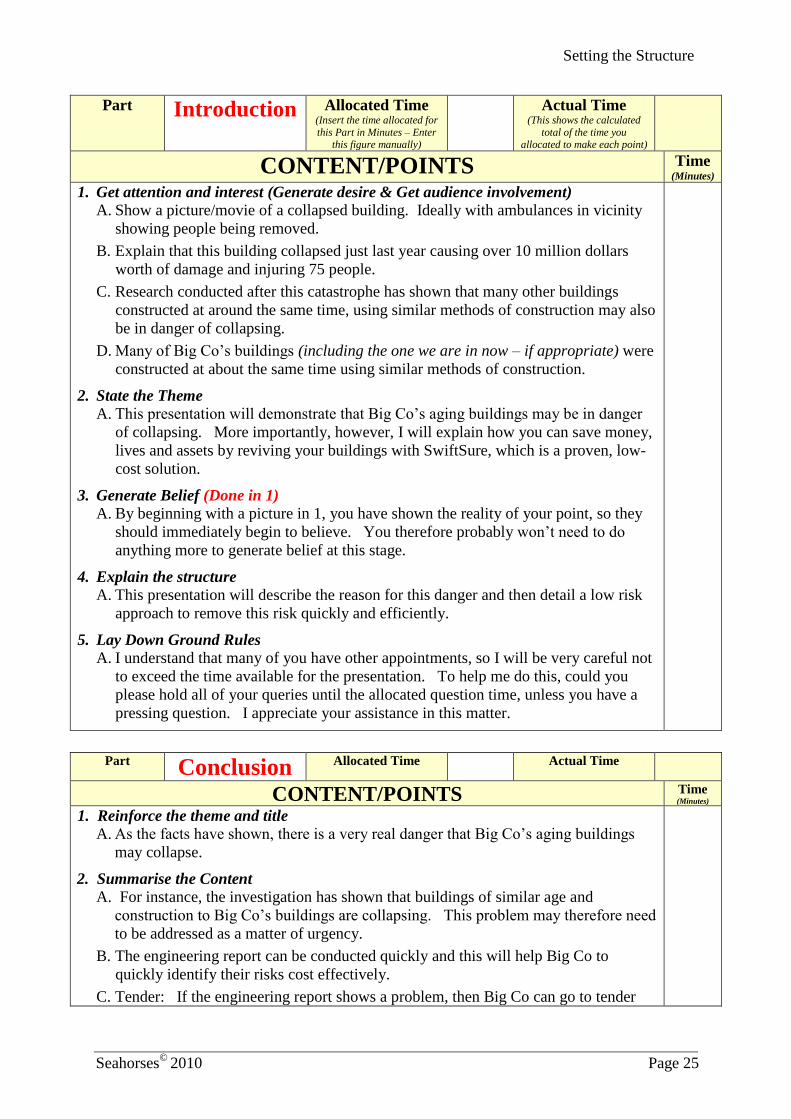
good example of the way in which the checklists can be used to rapidly develop the content.
For example, Figure 12.1 (overleaf) shows the content developed in the Introduction and
Conclusion for the SwiftSure presentation. This information is provided in the TABLE
format (TABLE stands for Template Applying Building-blocks for Logical Explanations).
The following Chapters describe the use of these TABLEs in more detail.
Setting the Structure
Seahorses©
2010 Page 25
Part
Introduction Allocated Time
(Insert the time allocated for
this Part in Minutes – Enter this figure manually)
Actual Time (This shows the calculated
total of the time you allocated to make each point)
CONTENT/POINTS Time
(Minutes)
1. Get attention and interest (Generate desire & Get audience involvement)
A. Show a picture/movie of a collapsed building. Ideally with ambulances in vicinity
showing people being removed.
B. Explain that this building collapsed just last year causing over 10 million dollars
worth of damage and injuring 75 people.
C. Research conducted after this catastrophe has shown that many other buildings
constructed at around the same time, using similar methods of construction may also
be in danger of collapsing.
D. Many of Big Co’s buildings (including the one we are in now – if appropriate) were
constructed at about the same time using similar methods of construction.
2. State the Theme
A. This presentation will demonstrate that Big Co’s aging buildings may be in danger
of collapsing. More importantly, however, I will explain how you can save money,
lives and assets by reviving your buildings with SwiftSure, which is a proven, low-
cost solution.
3. Generate Belief (Done in 1)
A. By beginning with a picture in 1, you have shown the reality of your point, so they
should immediately begin to believe. You therefore probably won’t need to do
anything more to generate belief at this stage.
4. Explain the structure
A. This presentation will describe the reason for this danger and then detail a low risk
approach to remove this risk quickly and efficiently.
5. Lay Down Ground Rules
A. I understand that many of you have other appointments, so I will be very careful not
to exceed the time available for the presentation. To help me do this, could you
please hold all of your queries until the allocated question time, unless you have a
pressing question. I appreciate your assistance in this matter.
Part Conclusion
Allocated Time
Actual Time
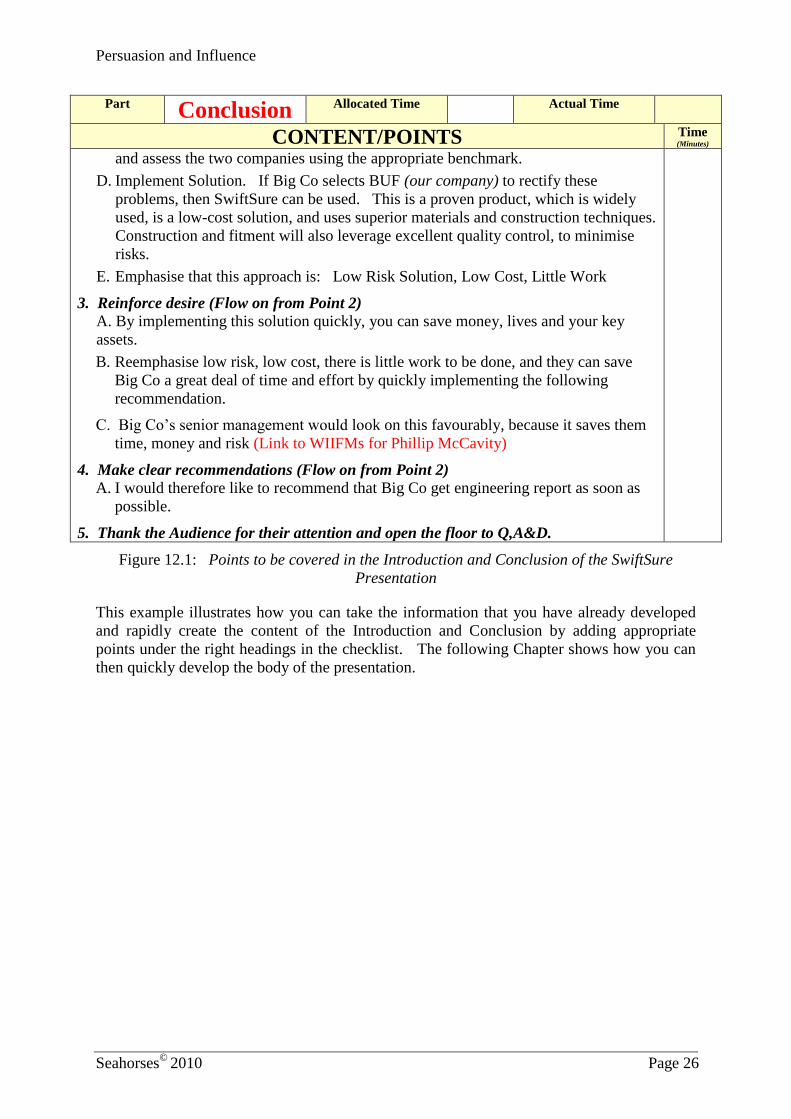
CONTENT/POINTS Time (Minutes)
1. Reinforce the theme and title
A. As the facts have shown, there is a very real danger that Big Co’s aging buildings
may collapse.
2. Summarise the Content
A. For instance, the investigation has shown that buildings of similar age and
construction to Big Co’s buildings are collapsing. This problem may therefore need
to be addressed as a matter of urgency.
B. The engineering report can be conducted quickly and this will help Big Co to
quickly identify their risks cost effectively.
C. Tender: If the engineering report shows a problem, then Big Co can go to tender
Persuasion and Influence
Seahorses©
2010 Page 26
Part Conclusion Allocated Time
Actual Time
CONTENT/POINTS Time (Minutes)
and assess the two companies using the appropriate benchmark.
D. Implement Solution. If Big Co selects BUF (our company) to rectify these
problems, then SwiftSure can be used. This is a proven product, which is widely
used, is a low-cost solution, and uses superior materials and construction techniques.
Construction and fitment will also leverage excellent quality control, to minimise
risks.
E. Emphasise that this approach is: Low Risk Solution, Low Cost, Little Work
3. Reinforce desire (Flow on from Point 2)
A. By implementing this solution quickly, you can save money, lives and your key
assets.
B. Reemphasise low risk, low cost, there is little work to be done, and they can save
Big Co a great deal of time and effort by quickly implementing the following
recommendation.
C. Big Co’s senior management would look on this favourably, because it saves them
time, money and risk (Link to WIIFMs for Phillip McCavity)
4. Make clear recommendations (Flow on from Point 2)
A. I would therefore like to recommend that Big Co get engineering report as soon as
possible.
5. Thank the Audience for their attention and open the floor to Q,A&D.
Figure 12.1: Points to be covered in the Introduction and Conclusion of the SwiftSure
Presentation
This example illustrates how you can take the information that you have already developed
and rapidly create the content of the Introduction and Conclusion by adding appropriate
points under the right headings in the checklist. The following Chapter shows how you can
then quickly develop the body of the presentation.
Persuasion and Influence Selecting the Templates
Seahorses©
2010 Page 27
Chapter 13 SELECTING THE TEMPLATES
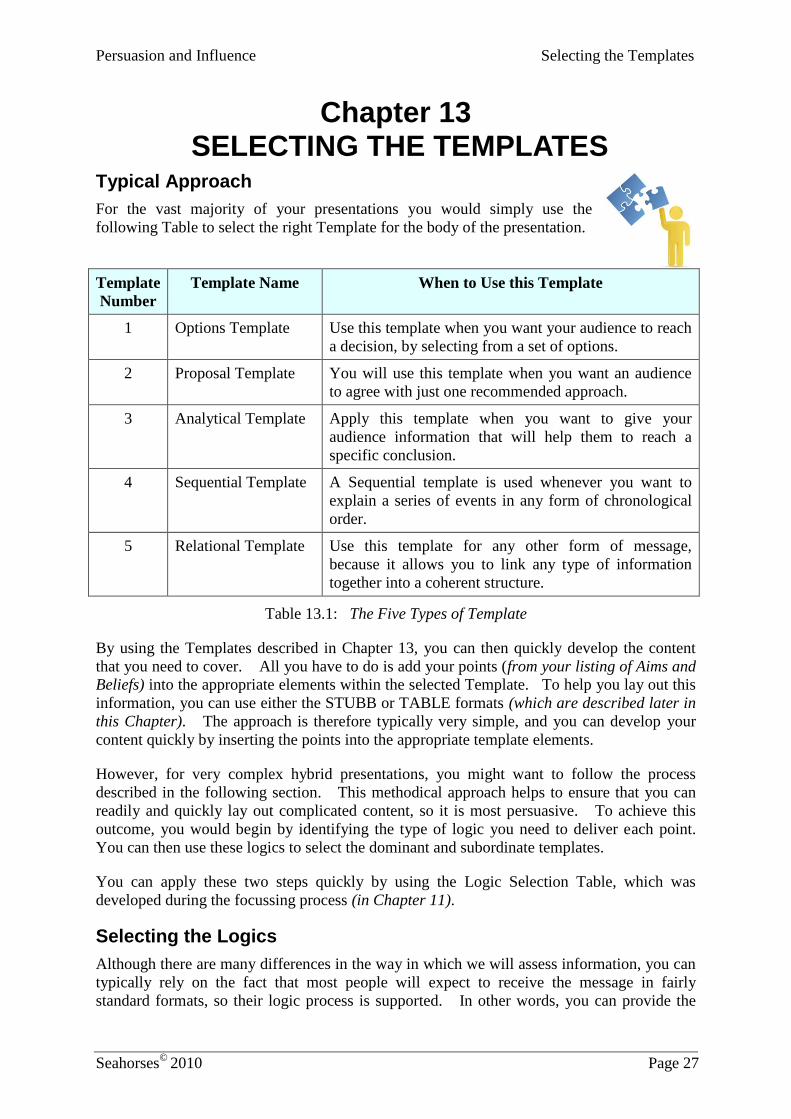
Typical Approach
For the vast majority of your presentations you would simply use the
following Table to select the right Template for the body of the presentation.
Template
Number
Template Name When to Use this Template
1 Options Template Use this template when you want your audience to reach
a decision, by selecting from a set of options.
2 Proposal Template You will use this template when you want an audience
to agree with just one recommended approach.
3 Analytical Template Apply this template when you want to give your
audience information that will help them to reach a
specific conclusion.
4 Sequential Template A Sequential template is used whenever you want to
explain a series of events in any form of chronological
order.
5 Relational Template Use this template for any other form of message,
because it allows you to link any type of information
together into a coherent structure.
Table 13.1: The Five Types of Template
By using the Templates described in Chapter 13, you can then quickly develop the content
that you need to cover. All you have to do is add your points (from your listing of Aims and
Beliefs) into the appropriate elements within the selected Template. To help you lay out this
information, you can use either the STUBB or TABLE formats (which are described later in
this Chapter). The approach is therefore typically very simple, and you can develop your
content quickly by inserting the points into the appropriate template elements.
However, for very complex hybrid presentations, you might want to follow the process
described in the following section. This methodical approach helps to ensure that you can
readily and quickly lay out complicated content, so it is most persuasive. To achieve this
outcome, you would begin by identifying the type of logic you need to deliver each point.
You can then use these logics to select the dominant and subordinate templates.
You can apply these two steps quickly by using the Logic Selection Table, which was
developed during the focussing process (in Chapter 11).
Selecting the Logics
Although there are many differences in the way in which we will assess information, you can
typically rely on the fact that most people will expect to receive the message in fairly
standard formats, so their logic process is supported. In other words, you can provide the
Persuasion and Influence
Seahorses©
2010 Page 28
information in the order needed by the audience to support their logical analysis. If you
provide the information in this way, it makes it easier for your audience to accept, understand
and believe your message.
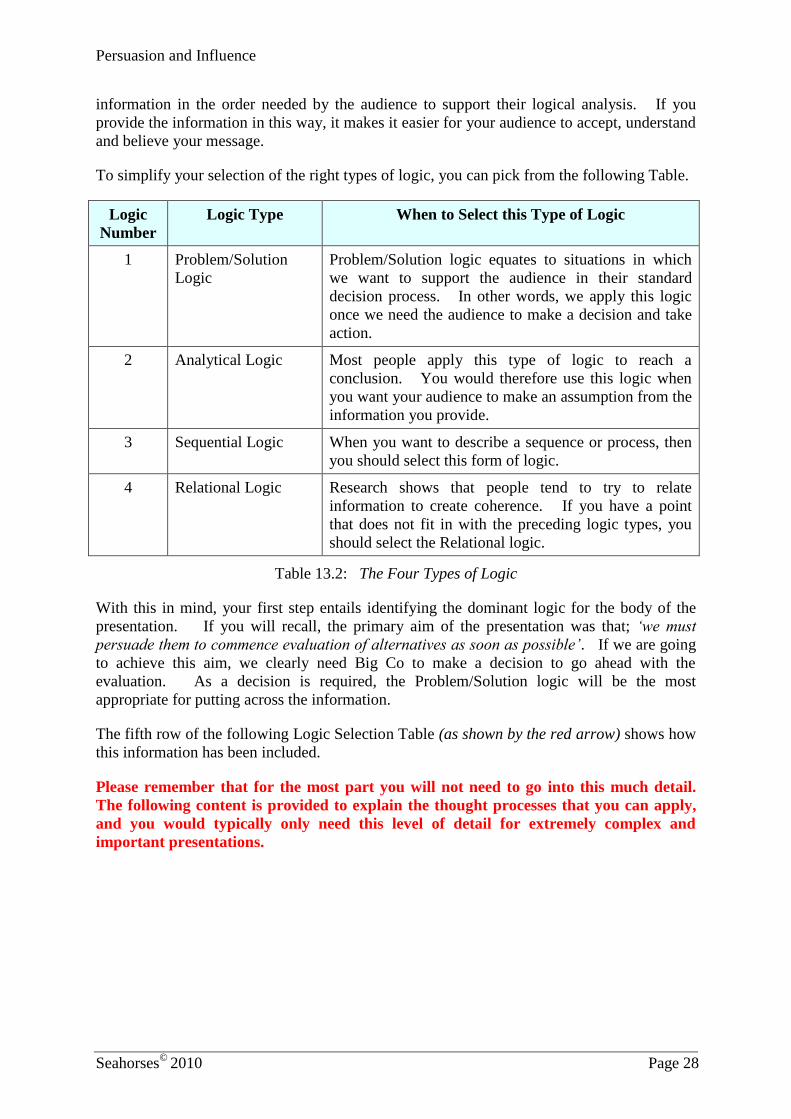
To simplify your selection of the right types of logic, you can pick from the following Table.
Logic
Number
Logic Type When to Select this Type of Logic
1 Problem/Solution
Logic
Problem/Solution logic equates to situations in which
we want to support the audience in their standard
decision process. In other words, we apply this logic
once we need the audience to make a decision and take
action.
2 Analytical Logic Most people apply this type of logic to reach a
conclusion. You would therefore use this logic when
you want your audience to make an assumption from the
information you provide.
3 Sequential Logic When you want to describe a sequence or process, then
you should select this form of logic.
4 Relational Logic Research shows that people tend to try to relate
information to create coherence. If you have a point
that does not fit in with the preceding logic types, you
should select the Relational logic.
Table 13.2: The Four Types of Logic
With this in mind, your first step entails identifying the dominant logic for the body of the
presentation. If you will recall, the primary aim of the presentation was that; ‘we must
persuade them to commence evaluation of alternatives as soon as possible’. If we are going
to achieve this aim, we clearly need Big Co to make a decision to go ahead with the
evaluation. As a decision is required, the Problem/Solution logic will be the most
appropriate for putting across the information.
The fifth row of the following Logic Selection Table (as shown by the red arrow) shows how
this information has been included.
Please remember that for the most part you will not need to go into this much detail.
The following content is provided to explain the thought processes that you can apply,
and you would typically only need this level of detail for extremely complex and
important presentations.
Selecting the Templates
Seahorses©
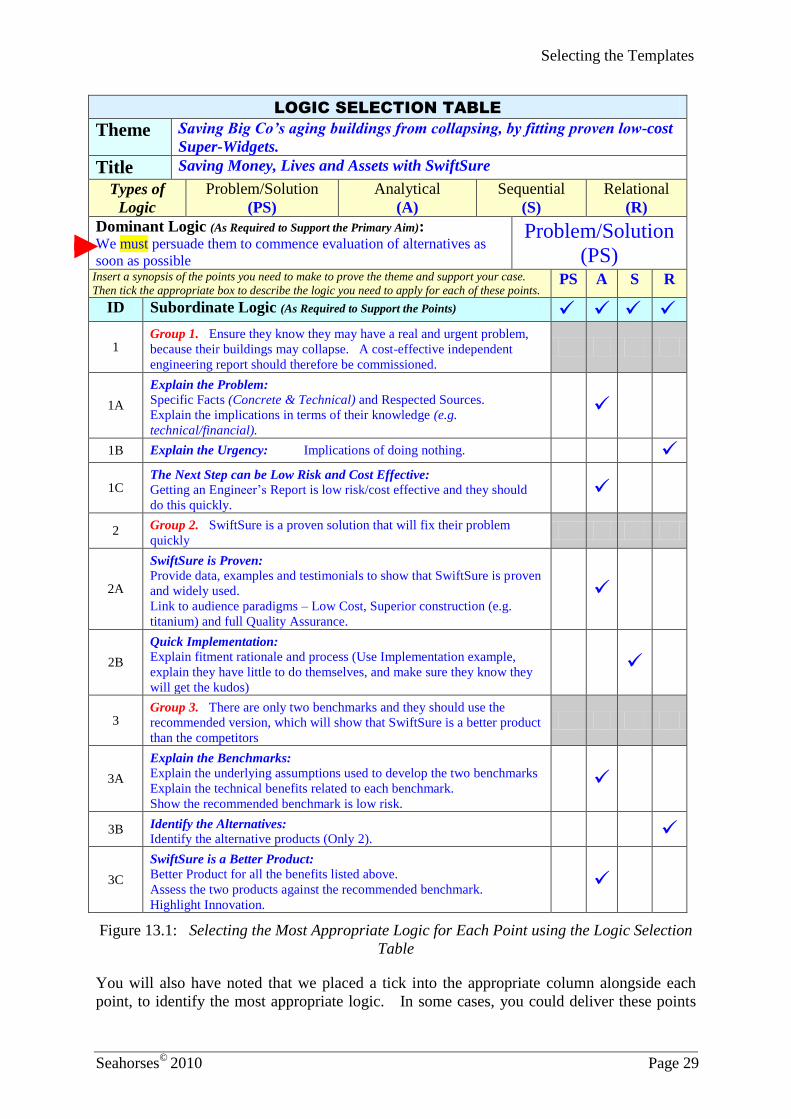
2010 Page 29
LOGIC SELECTION TABLE
Theme Saving Big Co’s aging buildings from collapsing, by fitting proven low-cost
Super-Widgets.
Title Saving Money, Lives and Assets with SwiftSure
Types of
Logic
Problem/Solution
(PS)
Analytical
(A)
Sequential
(S)
Relational
(R)
Dominant Logic (As Required to Support the Primary Aim): We must persuade them to commence evaluation of alternatives as
soon as possible
Problem/Solution
(PS) Insert a synopsis of the points you need to make to prove the theme and support your case.
Then tick the appropriate box to describe the logic you need to apply for each of these points. PS A S R
ID Subordinate Logic (As Required to Support the Points)
1 Group 1. Ensure they know they may have a real and urgent problem,
because their buildings may collapse. A cost-effective independent
engineering report should therefore be commissioned.
1A
Explain the Problem:
Specific Facts (Concrete & Technical) and Respected Sources.
Explain the implications in terms of their knowledge (e.g.
technical/financial).
1B Explain the Urgency: Implications of doing nothing.
1C The Next Step can be Low Risk and Cost Effective:
Getting an Engineer’s Report is low risk/cost effective and they should
do this quickly.
2 Group 2. SwiftSure is a proven solution that will fix their problem
quickly
2A
SwiftSure is Proven: Provide data, examples and testimonials to show that SwiftSure is proven
and widely used.
Link to audience paradigms – Low Cost, Superior construction (e.g.
titanium) and full Quality Assurance.
2B
Quick Implementation:
Explain fitment rationale and process (Use Implementation example,
explain they have little to do themselves, and make sure they know they
will get the kudos)
3 Group 3. There are only two benchmarks and they should use the
recommended version, which will show that SwiftSure is a better product
than the competitors
3A
Explain the Benchmarks:
Explain the underlying assumptions used to develop the two benchmarks
Explain the technical benefits related to each benchmark.
Show the recommended benchmark is low risk.
3B Identify the Alternatives:
Identify the alternative products (Only 2).
3C
SwiftSure is a Better Product:
Better Product for all the benefits listed above.
Assess the two products against the recommended benchmark.
Highlight Innovation.
Figure 13.1: Selecting the Most Appropriate Logic for Each Point using the Logic Selection
Table
You will also have noted that we placed a tick into the appropriate column alongside each
point, to identify the most appropriate logic. In some cases, you could deliver these points
Persuasion and Influence
Seahorses©
2010 Page 30
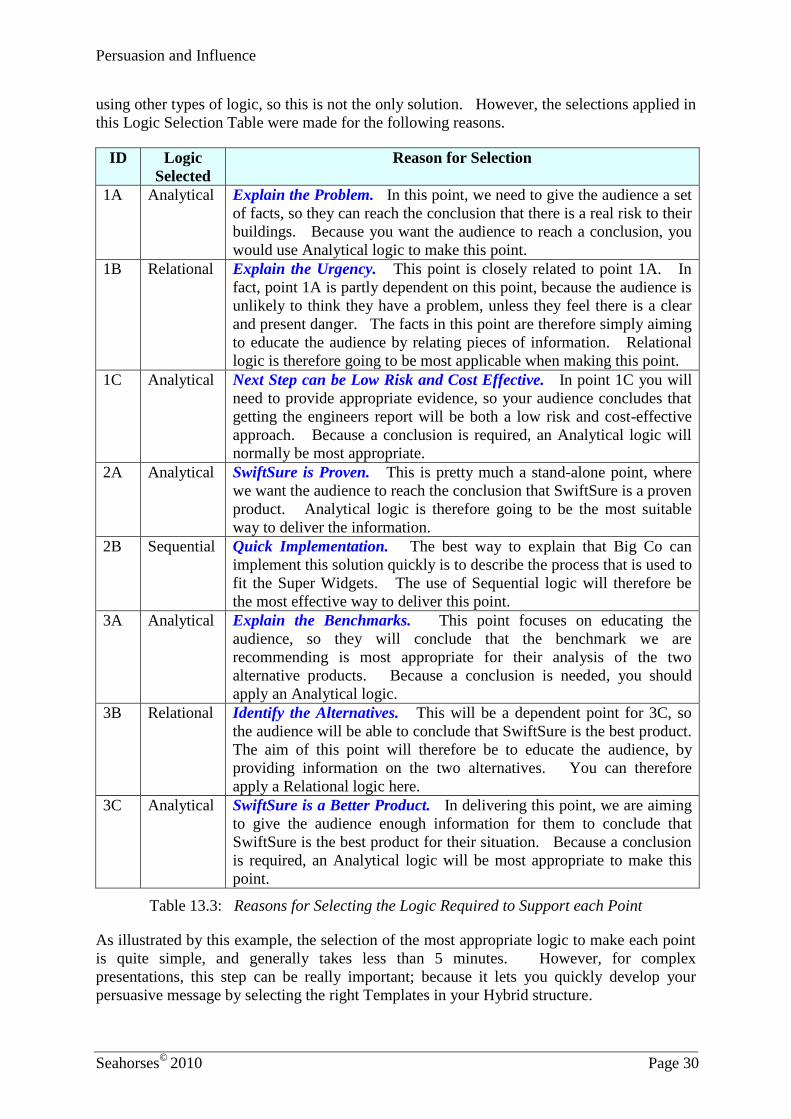
using other types of logic, so this is not the only solution. However, the selections applied in
this Logic Selection Table were made for the following reasons.
ID Logic
Selected
Reason for Selection
1A Analytical Explain the Problem. In this point, we need to give the audience a set
of facts, so they can reach the conclusion that there is a real risk to their
buildings. Because you want the audience to reach a conclusion, you
would use Analytical logic to make this point.
1B Relational Explain the Urgency. This point is closely related to point 1A. In
fact, point 1A is partly dependent on this point, because the audience is
unlikely to think they have a problem, unless they feel there is a clear
and present danger. The facts in this point are therefore simply aiming
to educate the audience by relating pieces of information. Relational
logic is therefore going to be most applicable when making this point.
1C Analytical Next Step can be Low Risk and Cost Effective. In point 1C you will
need to provide appropriate evidence, so your audience concludes that
getting the engineers report will be both a low risk and cost-effective
approach. Because a conclusion is required, an Analytical logic will
normally be most appropriate.
2A Analytical SwiftSure is Proven. This is pretty much a stand-alone point, where
we want the audience to reach the conclusion that SwiftSure is a proven
product. Analytical logic is therefore going to be the most suitable
way to deliver the information.
2B Sequential Quick Implementation. The best way to explain that Big Co can
implement this solution quickly is to describe the process that is used to
fit the Super Widgets. The use of Sequential logic will therefore be
the most effective way to deliver this point.
3A Analytical Explain the Benchmarks. This point focuses on educating the
audience, so they will conclude that the benchmark we are
recommending is most appropriate for their analysis of the two
alternative products. Because a conclusion is needed, you should
apply an Analytical logic.
3B Relational Identify the Alternatives. This will be a dependent point for 3C, so
the audience will be able to conclude that SwiftSure is the best product.
The aim of this point will therefore be to educate the audience, by
providing information on the two alternatives. You can therefore
apply a Relational logic here.
3C Analytical SwiftSure is a Better Product. In delivering this point, we are aiming
to give the audience enough information for them to conclude that
SwiftSure is the best product for their situation. Because a conclusion
is required, an Analytical logic will be most appropriate to make this
point.
Table 13.3: Reasons for Selecting the Logic Required to Support each Point
As illustrated by this example, the selection of the most appropriate logic to make each point
is quite simple, and generally takes less than 5 minutes. However, for complex
presentations, this step can be really important; because it lets you quickly develop your
persuasive message by selecting the right Templates in your Hybrid structure.
Persuasion and Influence Selecting the Templates
Seahorses©
2010 Page 31
Selecting the Templates
Having filled out your Logic Selection Table you can then use the information in this form to
quickly select the most appropriate Templates to deliver your message. This is actually very
simple, because (as I’m sure you’ve already noticed) each type of logic maps to a particular
Template. For instance, the Analytical, Sequential, and Relational logics are directly linked
to the Templates of the same name. The only real difference comes with the
Problem/Solution logic. For this type of logic, you can either apply the Proposal (when
presenting a single solution), or an Options (for situations in which you want to deliver a
range of alternatives) Template.
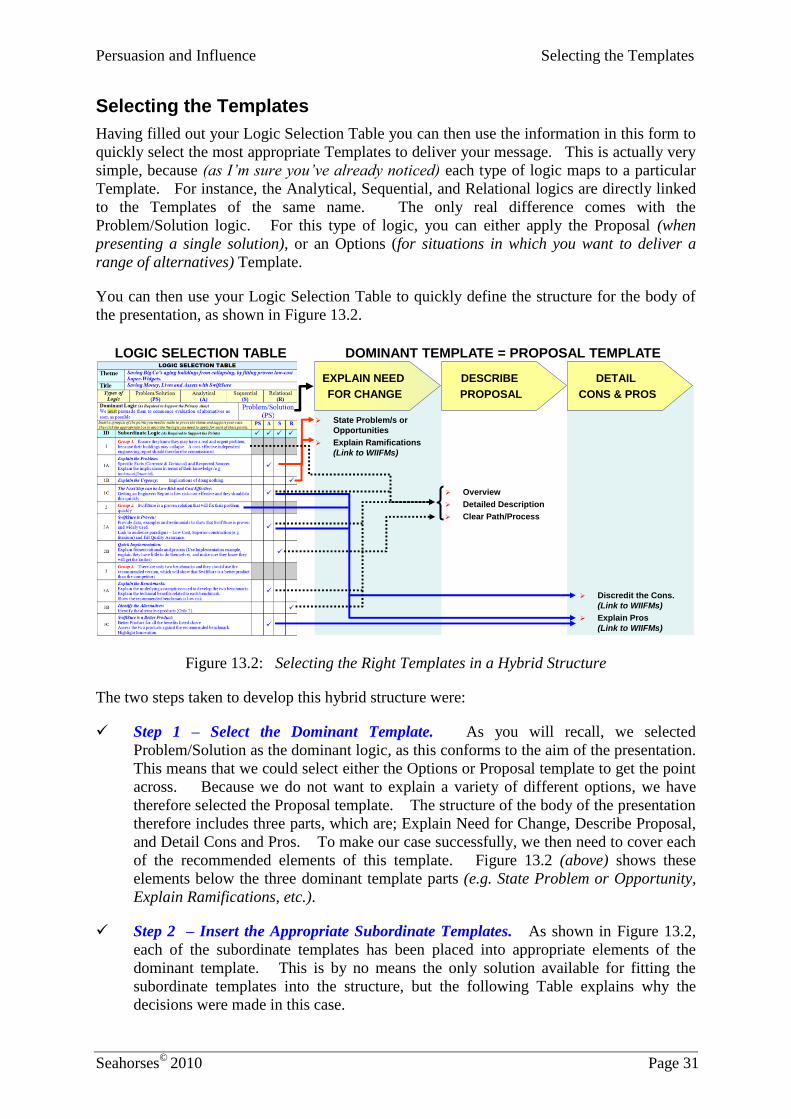
You can then use your Logic Selection Table to quickly define the structure for the body of
the presentation, as shown in Figure 13.2.
EXPLAIN NEED
FOR CHANGE
DETAIL
CONS & PROS
DESCRIBE
PROPOSAL
Overview
Detailed Description
Clear Path/Process
Discredit the Cons. (Link to WIIFMs)
Explain Pros (Link to WIIFMs)
State Problem/s
Explain Ramifications (Link to WIIFMs)
Overview
Detailed Description
Clear Path/Process
Discredit the Cons.
(Link to WIIFMs)
Explain Pros
(Link to WIIFMs)
State Problem/s or
Opportunities
Explain Ramifications
(Link to WIIFMs)
LOGIC SELECTION TABLE DOMINANT TEMPLATE = PROPOSAL TEMPLATE
Figure 13.2: Selecting the Right Templates in a Hybrid Structure
The two steps taken to develop this hybrid structure were:
Step 1 – Select the Dominant Template. As you will recall, we selected
Problem/Solution as the dominant logic, as this conforms to the aim of the presentation.
This means that we could select either the Options or Proposal template to get the point
across. Because we do not want to explain a variety of different options, we have
therefore selected the Proposal template. The structure of the body of the presentation
therefore includes three parts, which are; Explain Need for Change, Describe Proposal,
and Detail Cons and Pros. To make our case successfully, we then need to cover each
of the recommended elements of this template. Figure 13.2 (above) shows these
elements below the three dominant template parts (e.g. State Problem or Opportunity,
Explain Ramifications, etc.).
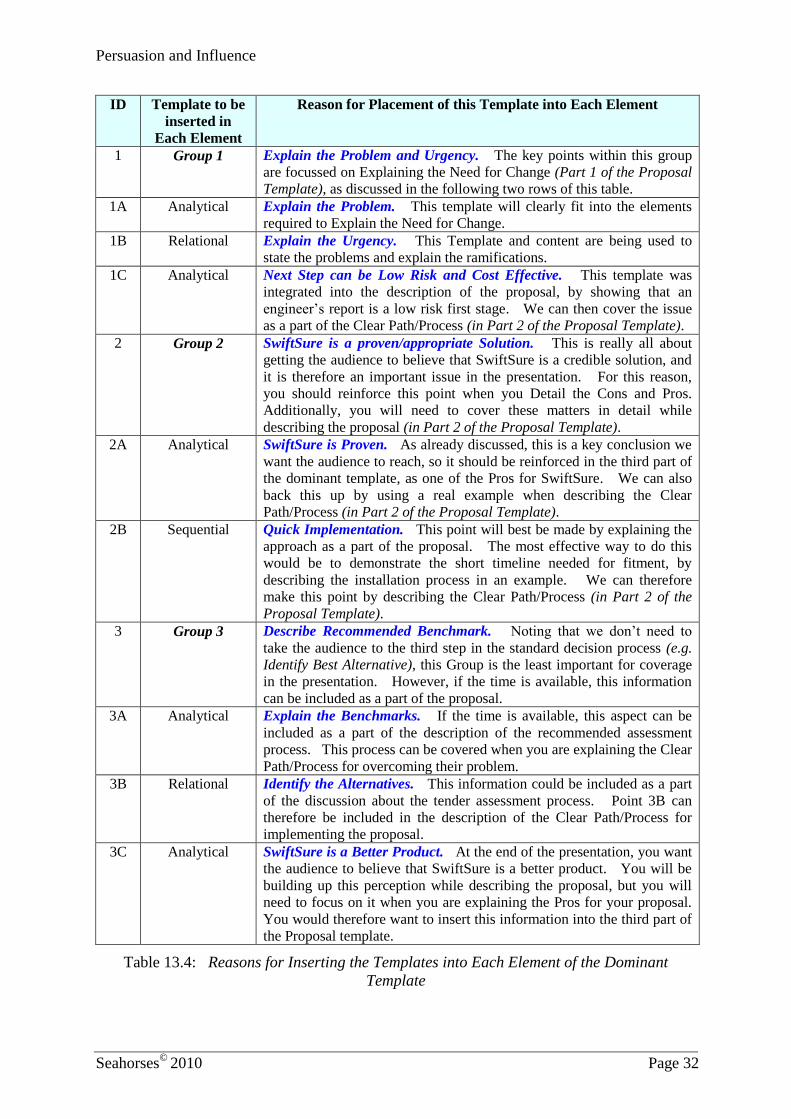
Step 2 – Insert the Appropriate Subordinate Templates. As shown in Figure 13.2,
each of the subordinate templates has been placed into appropriate elements of the
dominant template. This is by no means the only solution available for fitting the
subordinate templates into the structure, but the following Table explains why the
decisions were made in this case.
Persuasion and Influence
Seahorses©
2010 Page 32
ID Template to be
inserted in
Each Element
Reason for Placement of this Template into Each Element
1 Group 1 Explain the Problem and Urgency. The key points within this group
are focussed on Explaining the Need for Change (Part 1 of the Proposal
Template), as discussed in the following two rows of this table.
1A Analytical Explain the Problem. This template will clearly fit into the elements
required to Explain the Need for Change.
1B Relational Explain the Urgency. This Template and content are being used to
state the problems and explain the ramifications.
1C Analytical Next Step can be Low Risk and Cost Effective. This template was
integrated into the description of the proposal, by showing that an
engineer’s report is a low risk first stage. We can then cover the issue
as a part of the Clear Path/Process (in Part 2 of the Proposal Template).
2 Group 2 SwiftSure is a proven/appropriate Solution. This is really all about
getting the audience to believe that SwiftSure is a credible solution, and
it is therefore an important issue in the presentation. For this reason,
you should reinforce this point when you Detail the Cons and Pros.
Additionally, you will need to cover these matters in detail while
describing the proposal (in Part 2 of the Proposal Template).
2A Analytical SwiftSure is Proven. As already discussed, this is a key conclusion we
want the audience to reach, so it should be reinforced in the third part of
the dominant template, as one of the Pros for SwiftSure. We can also
back this up by using a real example when describing the Clear
Path/Process (in Part 2 of the Proposal Template).
2B Sequential Quick Implementation. This point will best be made by explaining the
approach as a part of the proposal. The most effective way to do this
would be to demonstrate the short timeline needed for fitment, by
describing the installation process in an example. We can therefore
make this point by describing the Clear Path/Process (in Part 2 of the
Proposal Template).
3 Group 3 Describe Recommended Benchmark. Noting that we don’t need to
take the audience to the third step in the standard decision process (e.g.
Identify Best Alternative), this Group is the least important for coverage
in the presentation. However, if the time is available, this information
can be included as a part of the proposal.
3A Analytical Explain the Benchmarks. If the time is available, this aspect can be
included as a part of the description of the recommended assessment
process. This process can be covered when you are explaining the Clear
Path/Process for overcoming their problem.
3B Relational Identify the Alternatives. This information could be included as a part
of the discussion about the tender assessment process. Point 3B can
therefore be included in the description of the Clear Path/Process for
implementing the proposal.
3C Analytical SwiftSure is a Better Product. At the end of the presentation, you want
the audience to believe that SwiftSure is a better product. You will be
building up this perception while describing the proposal, but you will
need to focus on it when you are explaining the Pros for your proposal.
You would therefore want to insert this information into the third part of
the Proposal template.
Table 13.4: Reasons for Inserting the Templates into Each Element of the Dominant
Template

Selecting the Templates
Seahorses©
2010 Page 33
Practical Approach to Laying Out Your Structure
The preceding Table explains how you would build up your hybrid structure, but this tabular
format it is not a really practical approach to laying out your content. In fact, the only reason
it is included is to explain the reasoning behind the structure developed in this case. To help
you fast track the collation of this information you can use two different types of form, which
are provided on the Seahorses web site. These forms are:
STUBB. The first method is the simplest and fastest
approach, because it provides a high-level outline of the
content you want to include. This type of outline is called a
STUBB, which stands for a Short Template Using Building
Blocks (I think you will agree it sounds much better when you
call it a STUBB).
TABLE. I call the alternative approach a TABLE
outline (TABLE stands for Template Applying
Building-blocks for Logical Explanations). The
TABLE approach is far more detailed, and therefore
somewhat more time consuming than creating a STUBB. However, it does provide a
very comprehensive outline, which can greatly simplify script development for very
complicated presentations.
The following subsections describe the use of a STUBB or TABLE, to quickly develop a
coherent and logical presentation.
STUBB
It is possible to build a STUBB by starting with a blank piece of
paper. However, it is often easier to use the STUBB form provided
on the Seahorses web site (STUBB.doc). Additionally, you can
build your STUBB by simply filling in the appropriate elements
from your selected Template. However, the STUBB is particularly
useful for complex messages (e.g. for hybrid or mandated structures), such as the one you are
developing in this example.
As illustrated in Figure 13.3 (overleaf), there are places set aside at the top of the STUBB
form, where you can write the theme, title, dominant template, and the time allocated for the
presentation. Below the top two rows, the form is delineated into three groups of columns,
covering the Introduction, Body and Conclusion. Each of these groups of columns contains
a space to insert an outline of the content. Another column in each part can be used to record
the time allocated to make each point. Chapter 14 discusses the time columns in more detail.
TH
E P
ER
FE
CT
PR
ES
EN
TA
TIO
N
STUBB
T A B L ET A B L E
TH
E P
ER
FE
CT
PR
ES
EN
TA
TIO
N
STUBB
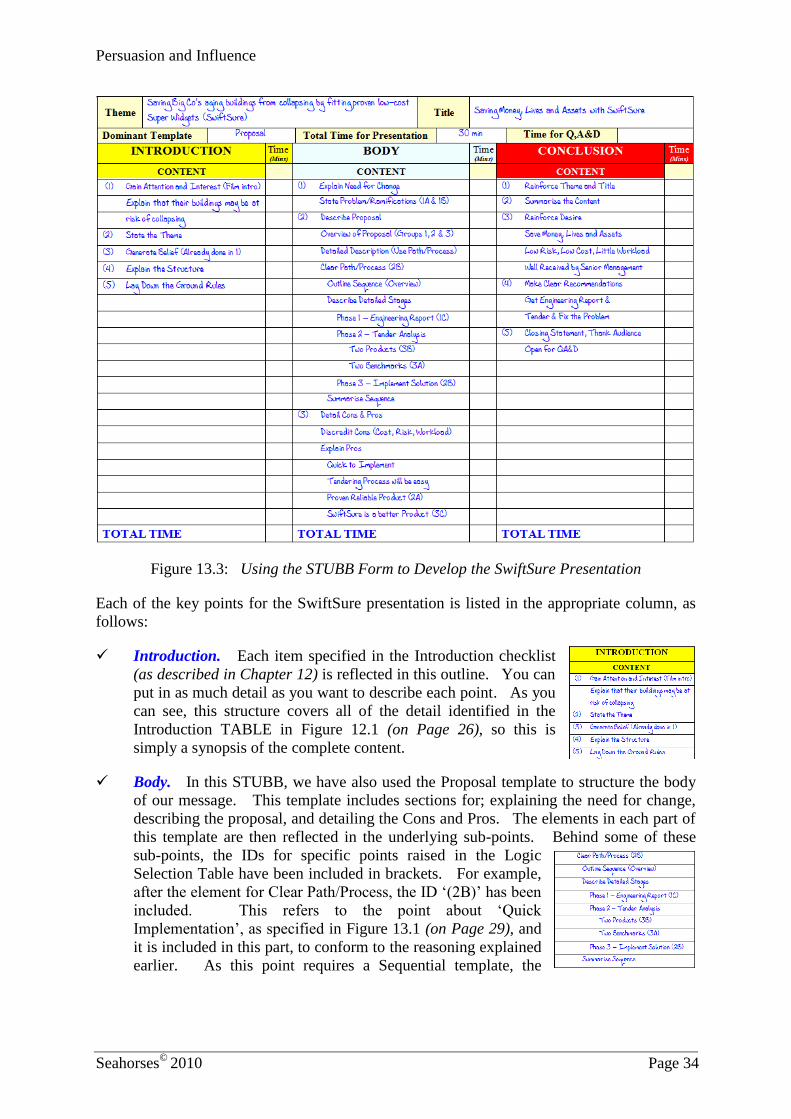
Persuasion and Influence
Seahorses©
2010 Page 34
Figure 13.3: Using the STUBB Form to Develop the SwiftSure Presentation
Each of the key points for the SwiftSure presentation is listed in the appropriate column, as
follows:
Introduction. Each item specified in the Introduction checklist
(as described in Chapter 12) is reflected in this outline. You can
put in as much detail as you want to describe each point. As you
can see, this structure covers all of the detail identified in the
Introduction TABLE in Figure 12.1 (on Page 26), so this is
simply a synopsis of the complete content.
Body. In this STUBB, we have also used the Proposal template to structure the body
of our message. This template includes sections for; explaining the need for change,
describing the proposal, and detailing the Cons and Pros. The elements in each part of
this template are then reflected in the underlying sub-points. Behind some of these
sub-points, the IDs for specific points raised in the Logic
Selection Table have been included in brackets. For example,
after the element for Clear Path/Process, the ID ‘(2B)’ has been
included. This refers to the point about ‘Quick
Implementation’, as specified in Figure 13.1 (on Page 29), and
it is included in this part, to conform to the reasoning explained
earlier. As this point requires a Sequential template, the
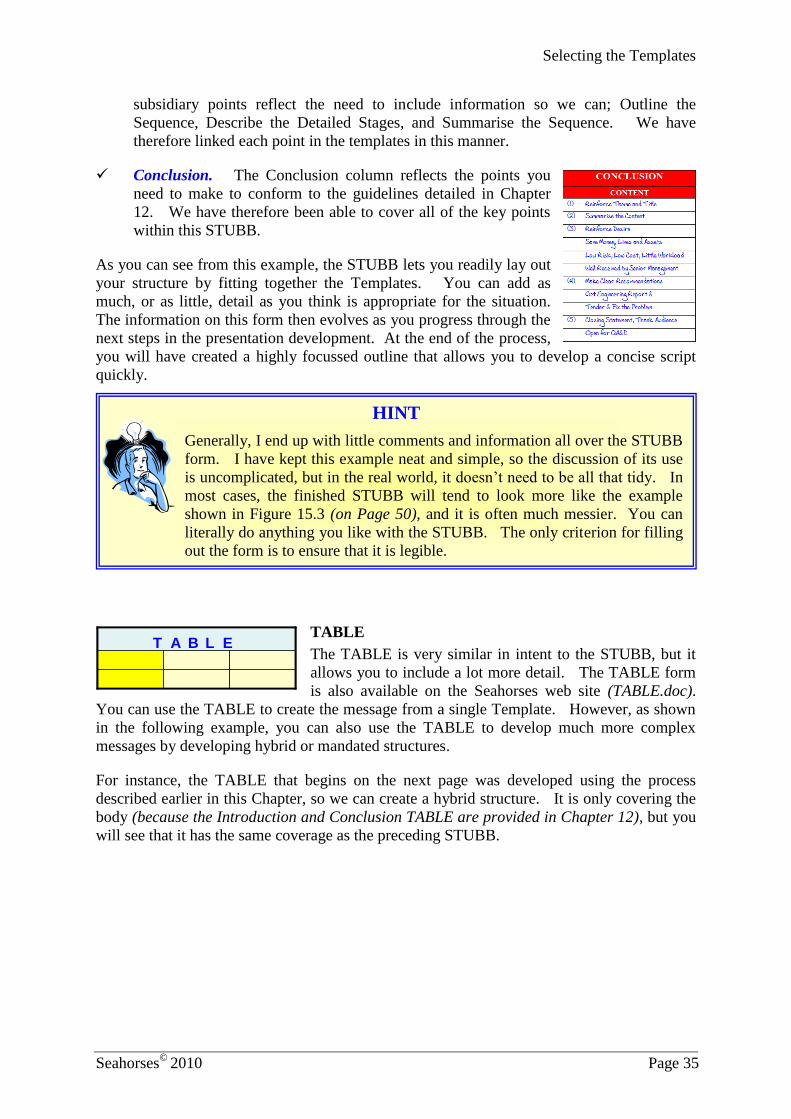
Selecting the Templates
Seahorses©
2010 Page 35
subsidiary points reflect the need to include information so we can; Outline the
Sequence, Describe the Detailed Stages, and Summarise the Sequence. We have
therefore linked each point in the templates in this manner.
Conclusion. The Conclusion column reflects the points you
need to make to conform to the guidelines detailed in Chapter
12. We have therefore been able to cover all of the key points
within this STUBB.
As you can see from this example, the STUBB lets you readily lay out
your structure by fitting together the Templates. You can add as
much, or as little, detail as you think is appropriate for the situation.
The information on this form then evolves as you progress through the
next steps in the presentation development. At the end of the process,
you will have created a highly focussed outline that allows you to develop a concise script
quickly.
TABLE
The TABLE is very similar in intent to the STUBB, but it
allows you to include a lot more detail. The TABLE form
is also available on the Seahorses web site (TABLE.doc).
You can use the TABLE to create the message from a single Template. However, as shown
in the following example, you can also use the TABLE to develop much more complex
messages by developing hybrid or mandated structures.
For instance, the TABLE that begins on the next page was developed using the process
described earlier in this Chapter, so we can create a hybrid structure. It is only covering the
body (because the Introduction and Conclusion TABLE are provided in Chapter 12), but you
will see that it has the same coverage as the preceding STUBB.
T A B L ET A B L E
HINT
Generally, I end up with little comments and information all over the STUBB
form. I have kept this example neat and simple, so the discussion of its use
is uncomplicated, but in the real world, it doesn’t need to be all that tidy. In
most cases, the finished STUBB will tend to look more like the example
shown in Figure 15.3 (on Page 50), and it is often much messier. You can
literally do anything you like with the STUBB. The only criterion for filling
out the form is to ensure that it is legible.
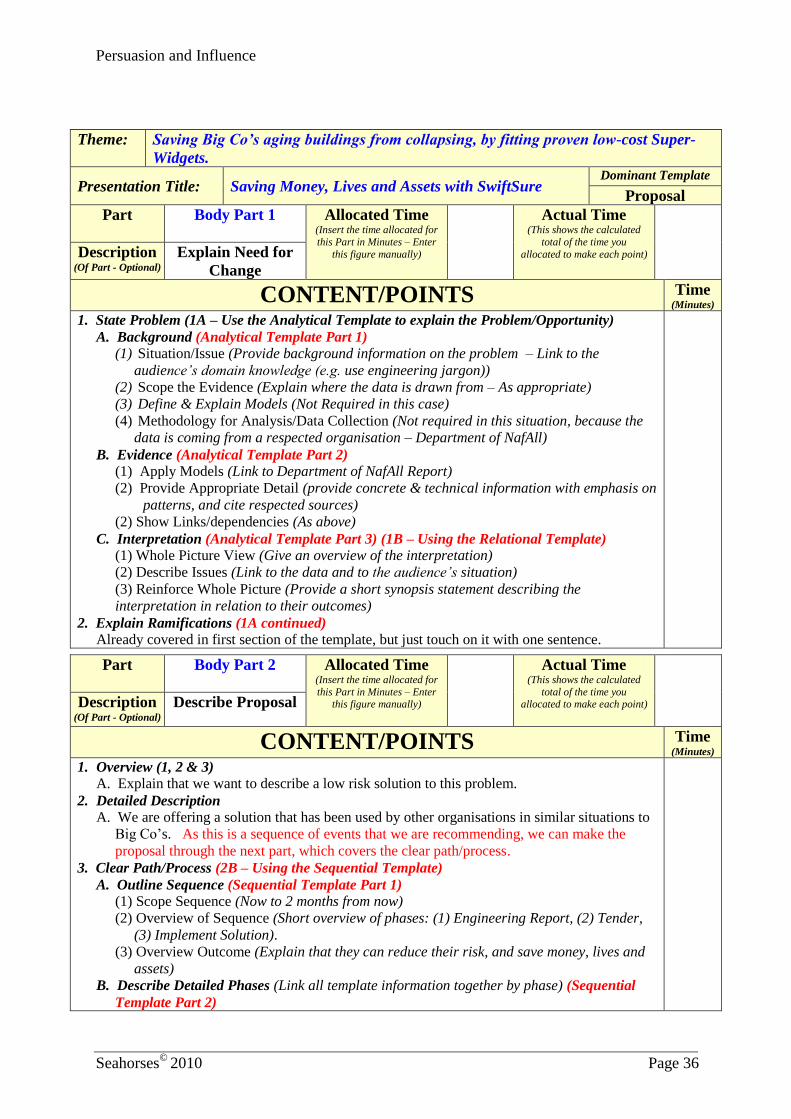
Persuasion and Influence
Seahorses©
2010 Page 36
Theme: Saving Big Co’s aging buildings from collapsing, by fitting proven low-cost Super-
Widgets.
Presentation Title: Saving Money, Lives and Assets with SwiftSure Dominant Template
Proposal
Part
Body Part 1 Allocated Time (Insert the time allocated for
this Part in Minutes – Enter
this figure manually)
Actual Time (This shows the calculated
total of the time you
allocated to make each point)
Description (Of Part - Optional)
Explain Need for
Change
CONTENT/POINTS Time
(Minutes)
1. State Problem (1A – Use the Analytical Template to explain the Problem/Opportunity)
A. Background (Analytical Template Part 1)
(1) Situation/Issue (Provide background information on the problem – Link to the
audience’s domain knowledge (e.g. use engineering jargon))
(2) Scope the Evidence (Explain where the data is drawn from – As appropriate)
(3) Define & Explain Models (Not Required in this case)
(4) Methodology for Analysis/Data Collection (Not required in this situation, because the
data is coming from a respected organisation – Department of NafAll)
B. Evidence (Analytical Template Part 2)
(1) Apply Models (Link to Department of NafAll Report)
(2) Provide Appropriate Detail (provide concrete & technical information with emphasis on
patterns, and cite respected sources)
(2) Show Links/dependencies (As above)
C. Interpretation (Analytical Template Part 3) (1B – Using the Relational Template)
(1) Whole Picture View (Give an overview of the interpretation)
(2) Describe Issues (Link to the data and to the audience’s situation)
(3) Reinforce Whole Picture (Provide a short synopsis statement describing the
interpretation in relation to their outcomes)
2. Explain Ramifications (1A continued)
Already covered in first section of the template, but just touch on it with one sentence.
Part
Body Part 2 Allocated Time (Insert the time allocated for
this Part in Minutes – Enter this figure manually)
Actual Time (This shows the calculated
total of the time you allocated to make each point)
Description
(Of Part - Optional) Describe Proposal
CONTENT/POINTS Time
(Minutes)
1. Overview (1, 2 & 3)
A. Explain that we want to describe a low risk solution to this problem.
2. Detailed Description
A. We are offering a solution that has been used by other organisations in similar situations to
Big Co’s. As this is a sequence of events that we are recommending, we can make the
proposal through the next part, which covers the clear path/process.
3. Clear Path/Process (2B – Using the Sequential Template)
A. Outline Sequence (Sequential Template Part 1)
(1) Scope Sequence (Now to 2 months from now)
(2) Overview of Sequence (Short overview of phases: (1) Engineering Report, (2) Tender,
(3) Implement Solution).
(3) Overview Outcome (Explain that they can reduce their risk, and save money, lives and
assets)
B. Describe Detailed Phases (Link all template information together by phase) (Sequential
Template Part 2)
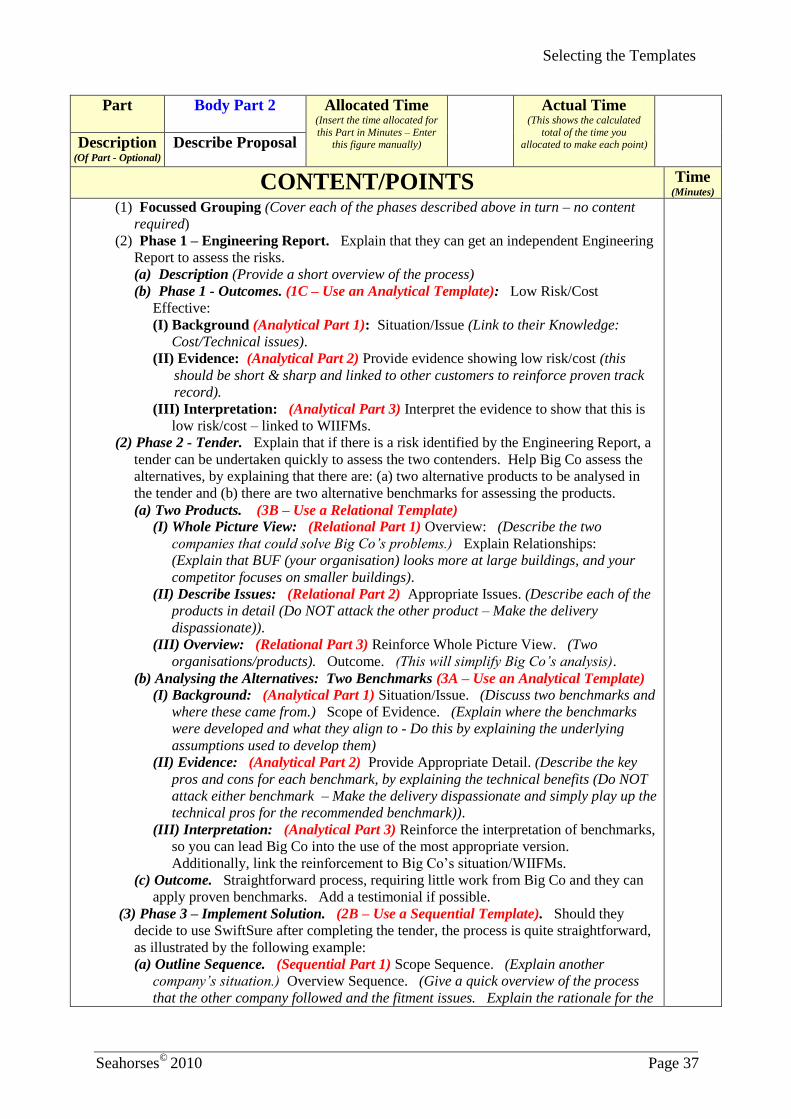
Selecting the Templates
Seahorses©
2010 Page 37
Part
Body Part 2 Allocated Time (Insert the time allocated for
this Part in Minutes – Enter this figure manually)
Actual Time (This shows the calculated
total of the time you allocated to make each point)
Description
(Of Part - Optional) Describe Proposal
CONTENT/POINTS Time
(Minutes)
(1) Focussed Grouping (Cover each of the phases described above in turn – no content
required)
(2) Phase 1 – Engineering Report. Explain that they can get an independent Engineering
Report to assess the risks.
(a) Description (Provide a short overview of the process)
(b) Phase 1 - Outcomes. (1C – Use an Analytical Template): Low Risk/Cost
Effective:
(I) Background (Analytical Part 1): Situation/Issue (Link to their Knowledge:
Cost/Technical issues).
(II) Evidence: (Analytical Part 2) Provide evidence showing low risk/cost (this
should be short & sharp and linked to other customers to reinforce proven track
record).
(III) Interpretation: (Analytical Part 3) Interpret the evidence to show that this is
low risk/cost – linked to WIIFMs.
(2) Phase 2 - Tender. Explain that if there is a risk identified by the Engineering Report, a
tender can be undertaken quickly to assess the two contenders. Help Big Co assess the
alternatives, by explaining that there are: (a) two alternative products to be analysed in
the tender and (b) there are two alternative benchmarks for assessing the products.
(a) Two Products. (3B – Use a Relational Template)
(I) Whole Picture View: (Relational Part 1) Overview: (Describe the two
companies that could solve Big Co’s problems.) Explain Relationships:
(Explain that BUF (your organisation) looks more at large buildings, and your
competitor focuses on smaller buildings).
(II) Describe Issues: (Relational Part 2) Appropriate Issues. (Describe each of the
products in detail (Do NOT attack the other product – Make the delivery
dispassionate)).
(III) Overview: (Relational Part 3) Reinforce Whole Picture View. (Two
organisations/products). Outcome. (This will simplify Big Co’s analysis).
(b) Analysing the Alternatives: Two Benchmarks (3A – Use an Analytical Template)
(I) Background: (Analytical Part 1) Situation/Issue. (Discuss two benchmarks and
where these came from.) Scope of Evidence. (Explain where the benchmarks
were developed and what they align to - Do this by explaining the underlying
assumptions used to develop them)
(II) Evidence: (Analytical Part 2) Provide Appropriate Detail. (Describe the key
pros and cons for each benchmark, by explaining the technical benefits (Do NOT
attack either benchmark – Make the delivery dispassionate and simply play up the
technical pros for the recommended benchmark)).
(III) Interpretation: (Analytical Part 3) Reinforce the interpretation of benchmarks,
so you can lead Big Co into the use of the most appropriate version.
Additionally, link the reinforcement to Big Co’s situation/WIIFMs.
(c) Outcome. Straightforward process, requiring little work from Big Co and they can
apply proven benchmarks. Add a testimonial if possible.
(3) Phase 3 – Implement Solution. (2B – Use a Sequential Template). Should they
decide to use SwiftSure after completing the tender, the process is quite straightforward,
as illustrated by the following example:
(a) Outline Sequence. (Sequential Part 1) Scope Sequence. (Explain another
company’s situation.) Overview Sequence. (Give a quick overview of the process
that the other company followed and the fitment issues. Explain the rationale for the
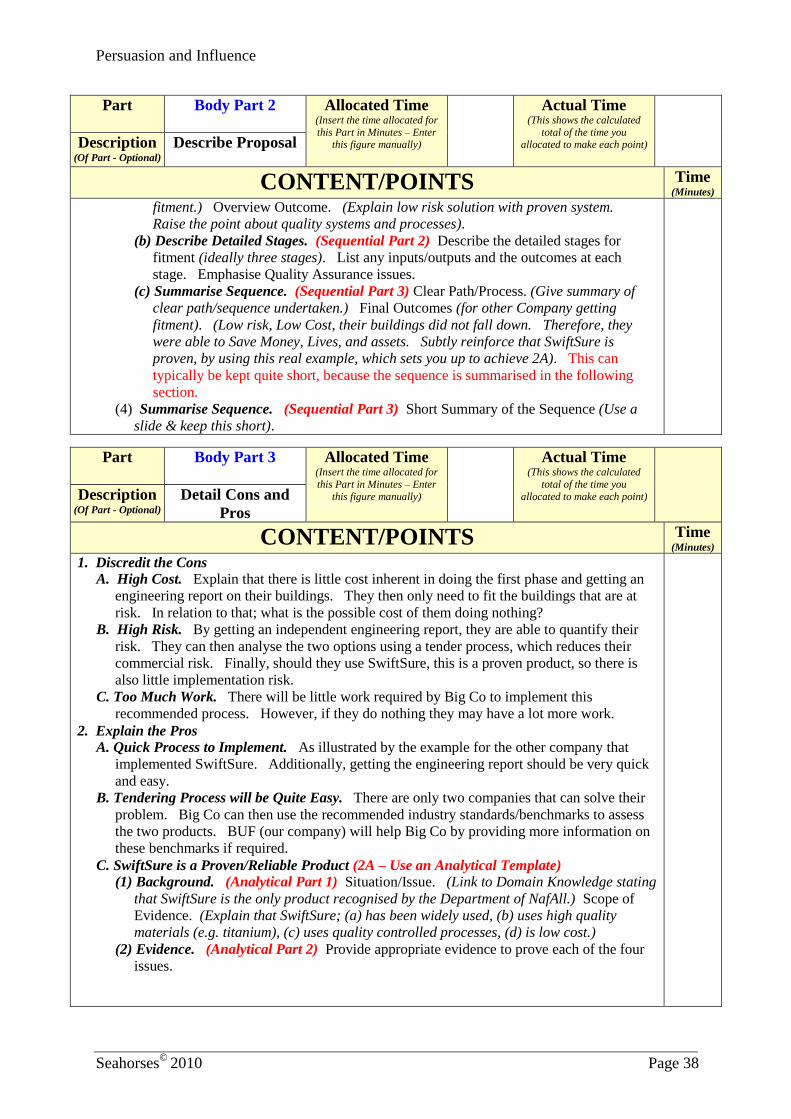
Persuasion and Influence
Seahorses©
2010 Page 38
Part
Body Part 2 Allocated Time (Insert the time allocated for
this Part in Minutes – Enter this figure manually)
Actual Time (This shows the calculated
total of the time you allocated to make each point)
Description
(Of Part - Optional) Describe Proposal
CONTENT/POINTS Time
(Minutes)
fitment.) Overview Outcome. (Explain low risk solution with proven system.
Raise the point about quality systems and processes).
(b) Describe Detailed Stages. (Sequential Part 2) Describe the detailed stages for
fitment (ideally three stages). List any inputs/outputs and the outcomes at each
stage. Emphasise Quality Assurance issues.
(c) Summarise Sequence. (Sequential Part 3) Clear Path/Process. (Give summary of
clear path/sequence undertaken.) Final Outcomes (for other Company getting
fitment). (Low risk, Low Cost, their buildings did not fall down. Therefore, they
were able to Save Money, Lives, and assets. Subtly reinforce that SwiftSure is
proven, by using this real example, which sets you up to achieve 2A). This can
typically be kept quite short, because the sequence is summarised in the following
section.
(4) Summarise Sequence. (Sequential Part 3) Short Summary of the Sequence (Use a
slide & keep this short).
Part
Body Part 3 Allocated Time (Insert the time allocated for
this Part in Minutes – Enter
this figure manually)
Actual Time (This shows the calculated
total of the time you
allocated to make each point)
Description (Of Part - Optional)
Detail Cons and
Pros
CONTENT/POINTS Time
(Minutes)
1. Discredit the Cons
A. High Cost. Explain that there is little cost inherent in doing the first phase and getting an
engineering report on their buildings. They then only need to fit the buildings that are at
risk. In relation to that; what is the possible cost of them doing nothing?
B. High Risk. By getting an independent engineering report, they are able to quantify their
risk. They can then analyse the two options using a tender process, which reduces their
commercial risk. Finally, should they use SwiftSure, this is a proven product, so there is
also little implementation risk.
C. Too Much Work. There will be little work required by Big Co to implement this
recommended process. However, if they do nothing they may have a lot more work.
2. Explain the Pros
A. Quick Process to Implement. As illustrated by the example for the other company that
implemented SwiftSure. Additionally, getting the engineering report should be very quick
and easy.
B. Tendering Process will be Quite Easy. There are only two companies that can solve their
problem. Big Co can then use the recommended industry standards/benchmarks to assess
the two products. BUF (our company) will help Big Co by providing more information on
these benchmarks if required.
C. SwiftSure is a Proven/Reliable Product (2A – Use an Analytical Template)
(1) Background. (Analytical Part 1) Situation/Issue. (Link to Domain Knowledge stating
that SwiftSure is the only product recognised by the Department of NafAll.) Scope of
Evidence. (Explain that SwiftSure; (a) has been widely used, (b) uses high quality
materials (e.g. titanium), (c) uses quality controlled processes, (d) is low cost.)
(2) Evidence. (Analytical Part 2) Provide appropriate evidence to prove each of the four
issues.

Selecting the Templates
Seahorses©
2010 Page 39
Part
Body Part 3 Allocated Time (Insert the time allocated for
this Part in Minutes – Enter this figure manually)
Actual Time (This shows the calculated
total of the time you allocated to make each point)
Description
(Of Part - Optional) Detail Cons and
Pros
CONTENT/POINTS Time
(Minutes)
(3) Interpretation. (Analytical Part 3) Provide Clear Analysis. (Conclude that each of
these issues illustrates that SwiftSure is a proven/reliable product.) Link to
Situation/Issue. (Emphasise that this means that SwiftSure is low risk and low cost,
which are their key WIIFMs).
D. SwiftSure is the Better Product. (3C – Use an Analytical Template)
(1) Background. (Analytical Part 1) Situation/Issue. (Explain that SwiftSure is better
because it is technically better and more cost effective – Link to audience paradigms.)
Scope of the Evidence. (The information already provided, and an analysis of the two
products against the recommended benchmark).
(2) Evidence. (Analytical Part 2) Provide Appropriate Detail. (Show a side-by-side
comparison of the two products against the recommended benchmark).
(3) Interpretation. (Analytical Part 3) Provide Clear Analysis. (Explain that this shows
that SwiftSure is the better product for Big Co’s situation, if the Engineering Report
shows that they have a problem). Then lead into the conclusion.
Figure 13.4: Using the TABLE Form to Develop the SwiftSure Presentation
As you can see from this TABLE, the structure is the same as that shown in the STUBB.
However, there is a substantial amount of information available in this TABLE outline,
which is only inferred in the STUBB. The TABLE therefore provides a much clearer
synopsis of the presentation content.
Although it typically takes longer to create a TABLE, this layout still provides a relatively
quick solution once you get used to the process. For example, this detailed version of the
SwiftSure TABLE took just over 48 minutes to create, and this made putting the rest of the
presentation together very fast.
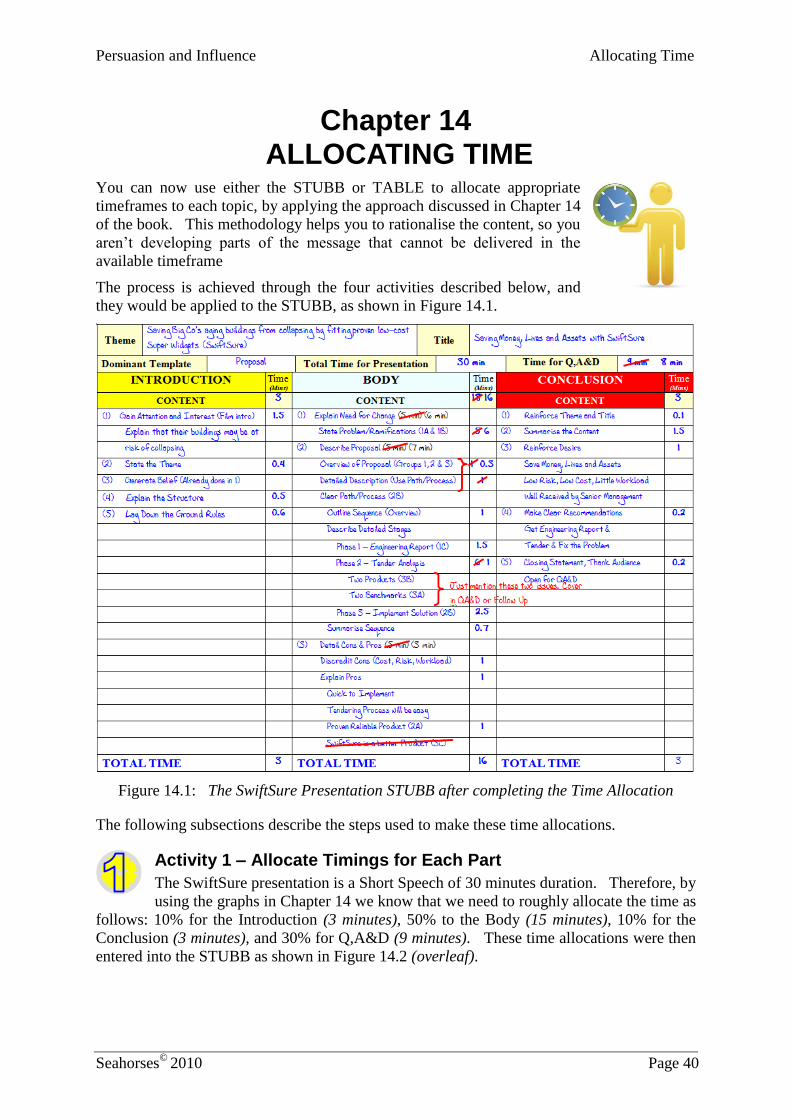
Persuasion and Influence Allocating Time
Seahorses©
2010 Page 40
Chapter 14 ALLOCATING TIME
You can now use either the STUBB or TABLE to allocate appropriate
timeframes to each topic, by applying the approach discussed in Chapter 14
of the book. This methodology helps you to rationalise the content, so you
aren’t developing parts of the message that cannot be delivered in the
available timeframe
The process is achieved through the four activities described below, and
they would be applied to the STUBB, as shown in Figure 14.1.
Figure 14.1: The SwiftSure Presentation STUBB after completing the Time Allocation
The following subsections describe the steps used to make these time allocations.
Activity 1 – Allocate Timings for Each Part
The SwiftSure presentation is a Short Speech of 30 minutes duration. Therefore, by
using the graphs in Chapter 14 we know that we need to roughly allocate the time as
follows: 10% for the Introduction (3 minutes), 50% to the Body (15 minutes), 10% for the
Conclusion (3 minutes), and 30% for Q,A&D (9 minutes). These time allocations were then
entered into the STUBB as shown in Figure 14.2 (overleaf).
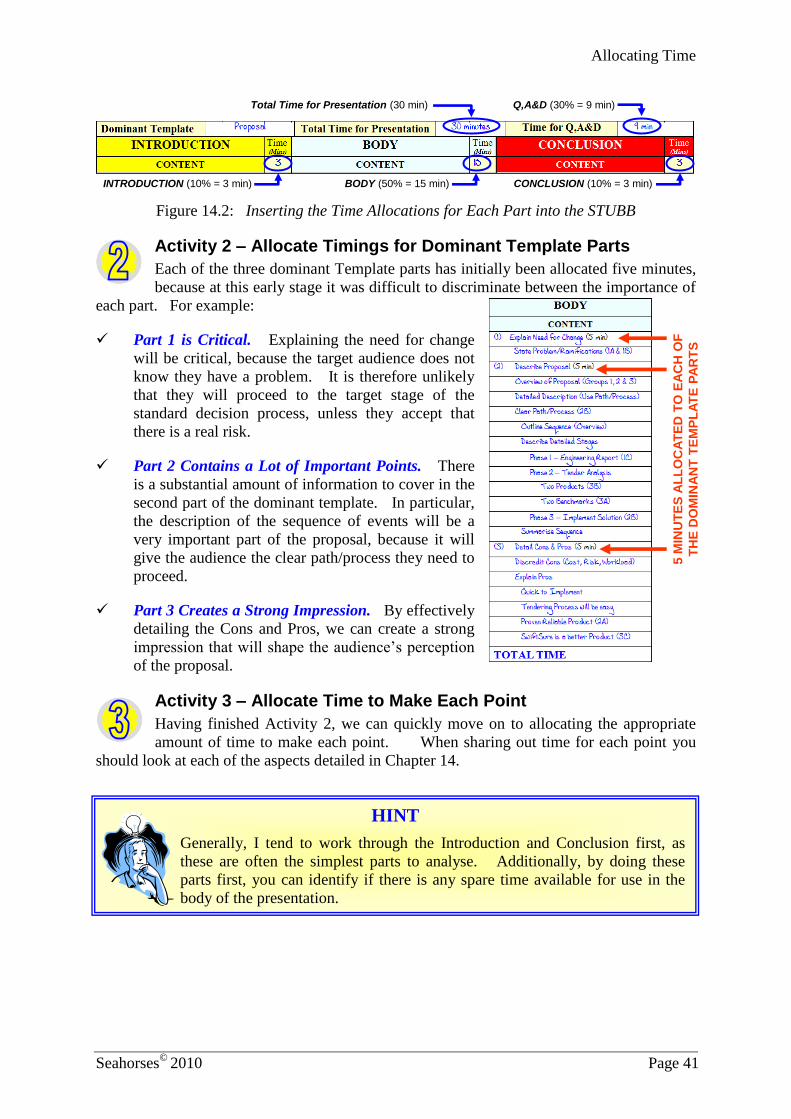
Allocating Time
Seahorses©
2010 Page 41
INTRODUCTION (10% = 3 min) BODY (50% = 15 min) CONCLUSION (10% = 3 min)
Total Time for Presentation (30 min) Q,A&D (30% = 9 min)
Figure 14.2: Inserting the Time Allocations for Each Part into the STUBB
Activity 2 – Allocate Timings for Dominant Template Parts
Each of the three dominant Template parts has initially been allocated five minutes,
because at this early stage it was difficult to discriminate between the importance of
each part. For example:
Part 1 is Critical. Explaining the need for change
will be critical, because the target audience does not
know they have a problem. It is therefore unlikely
that they will proceed to the target stage of the
standard decision process, unless they accept that
there is a real risk.
Part 2 Contains a Lot of Important Points. There
is a substantial amount of information to cover in the
second part of the dominant template. In particular,
the description of the sequence of events will be a
very important part of the proposal, because it will
give the audience the clear path/process they need to
proceed.
Part 3 Creates a Strong Impression. By effectively
detailing the Cons and Pros, we can create a strong
impression that will shape the audience’s perception
of the proposal.
Activity 3 – Allocate Time to Make Each Point
Having finished Activity 2, we can quickly move on to allocating the appropriate
amount of time to make each point. When sharing out time for each point you
should look at each of the aspects detailed in Chapter 14.
HINT
Generally, I tend to work through the Introduction and Conclusion first, as
these are often the simplest parts to analyse. Additionally, by doing these
parts first, you can identify if there is any spare time available for use in the
body of the presentation.
5 M
INU
TE
S A
LL
OC
AT
ED
TO
EA
CH
OF
TH
E D
OM
INA
NT
TE
MP
LA
TE
PA
RT
S
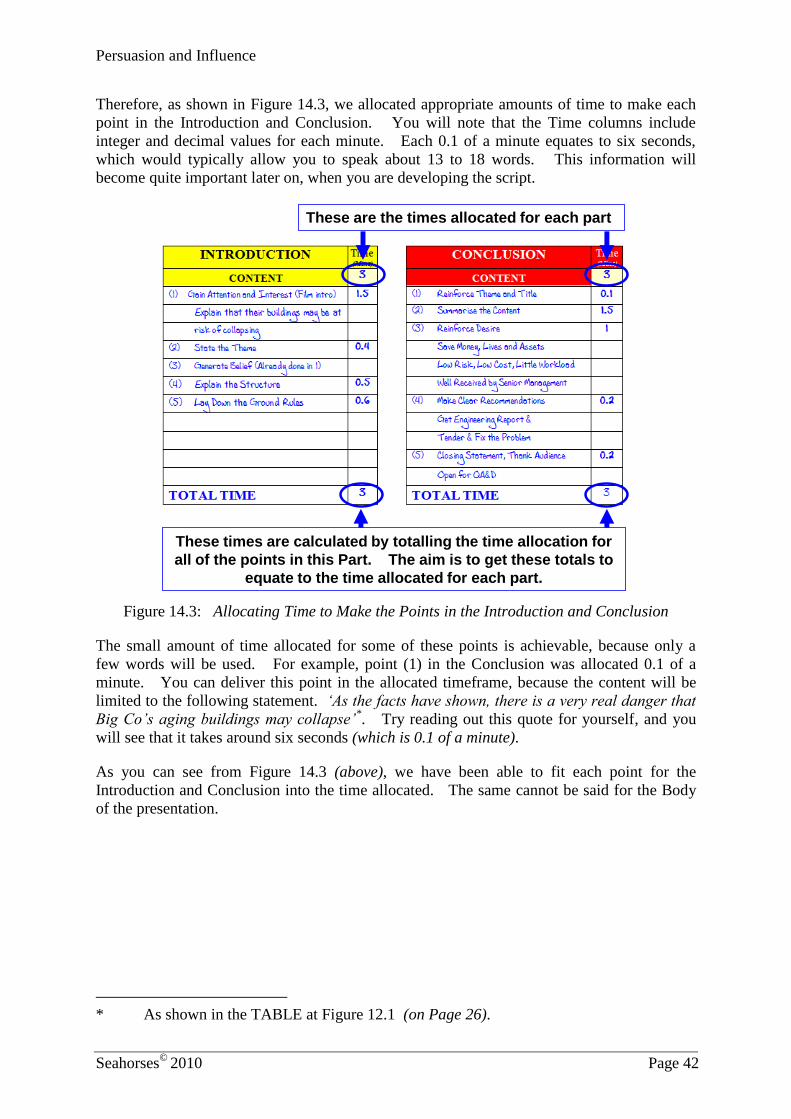
Persuasion and Influence
Seahorses©
2010 Page 42
Therefore, as shown in Figure 14.3, we allocated appropriate amounts of time to make each
point in the Introduction and Conclusion. You will note that the Time columns include
integer and decimal values for each minute. Each 0.1 of a minute equates to six seconds,
which would typically allow you to speak about 13 to 18 words. This information will
become quite important later on, when you are developing the script.
These are the times allocated for each part
These times are calculated by totalling the time allocation for
all of the points in this Part. The aim is to get these totals to
equate to the time allocated for each part.
Figure 14.3: Allocating Time to Make the Points in the Introduction and Conclusion
The small amount of time allocated for some of these points is achievable, because only a
few words will be used. For example, point (1) in the Conclusion was allocated 0.1 of a
minute. You can deliver this point in the allocated timeframe, because the content will be
limited to the following statement. ‘As the facts have shown, there is a very real danger that
Big Co’s aging buildings may collapse’*. Try reading out this quote for yourself, and you
will see that it takes around six seconds (which is 0.1 of a minute).
As you can see from Figure 14.3 (above), we have been able to fit each point for the
Introduction and Conclusion into the time allocated. The same cannot be said for the Body
of the presentation.
* As shown in the TABLE at Figure 12.1 (on Page 26).
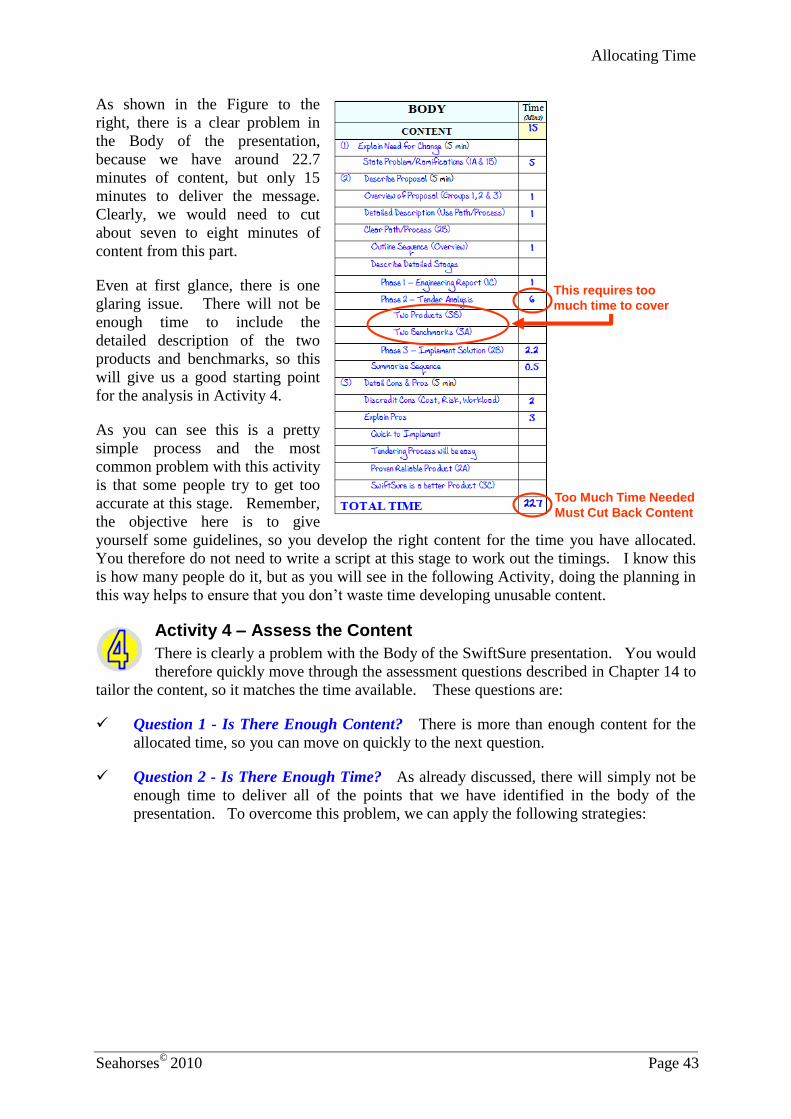
Allocating Time
Seahorses©
2010 Page 43
As shown in the Figure to the
right, there is a clear problem in
the Body of the presentation,
because we have around 22.7
minutes of content, but only 15
minutes to deliver the message.
Clearly, we would need to cut
about seven to eight minutes of
content from this part.
Even at first glance, there is one
glaring issue. There will not be
enough time to include the
detailed description of the two
products and benchmarks, so this
will give us a good starting point
for the analysis in Activity 4.
As you can see this is a pretty
simple process and the most
common problem with this activity
is that some people try to get too
accurate at this stage. Remember,
the objective here is to give
yourself some guidelines, so you develop the right content for the time you have allocated.
You therefore do not need to write a script at this stage to work out the timings. I know this
is how many people do it, but as you will see in the following Activity, doing the planning in
this way helps to ensure that you don’t waste time developing unusable content.
Activity 4 – Assess the Content
There is clearly a problem with the Body of the SwiftSure presentation. You would
therefore quickly move through the assessment questions described in Chapter 14 to
tailor the content, so it matches the time available. These questions are:
Question 1 - Is There Enough Content? There is more than enough content for the
allocated time, so you can move on quickly to the next question.
Question 2 - Is There Enough Time? As already discussed, there will simply not be
enough time to deliver all of the points that we have identified in the body of the
presentation. To overcome this problem, we can apply the following strategies:
Too Much Time Needed
Must Cut Back Content
This requires too
much time to cover
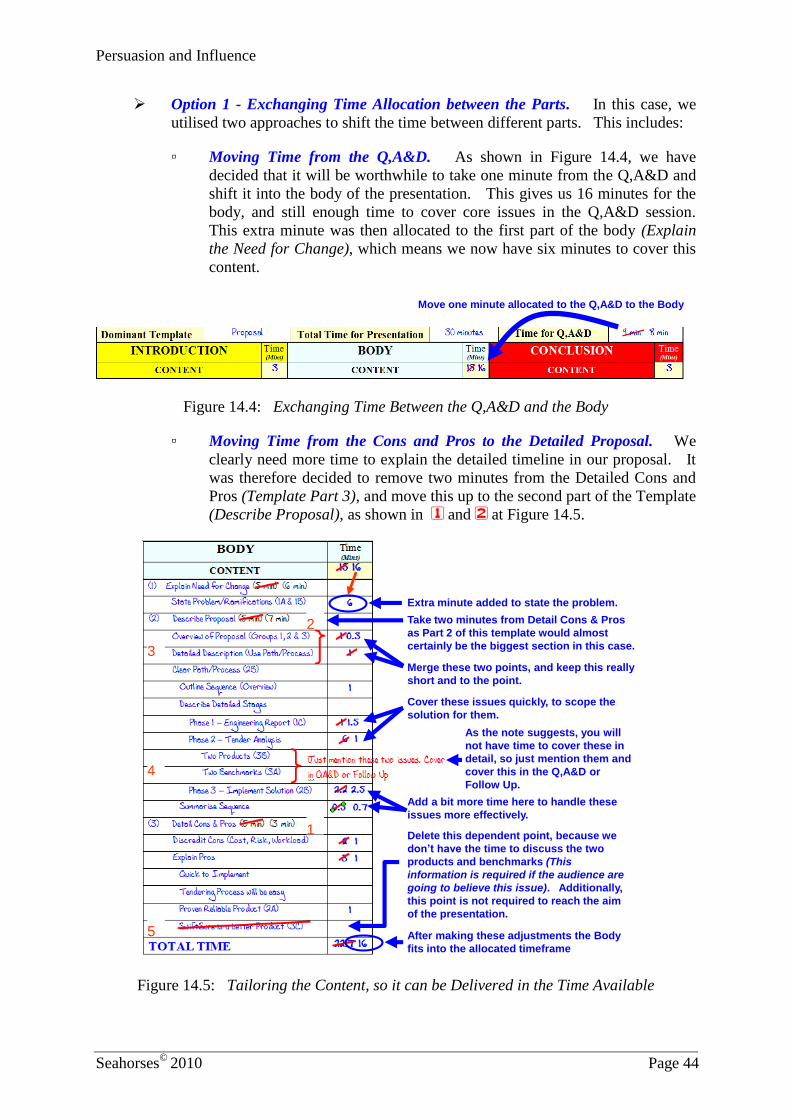
Persuasion and Influence
Seahorses©
2010 Page 44
Move one minute allocated to the Q,A&D to the Body
Option 1 - Exchanging Time Allocation between the Parts. In this case, we
utilised two approaches to shift the time between different parts. This includes:
▫ Moving Time from the Q,A&D. As shown in Figure 14.4, we have
decided that it will be worthwhile to take one minute from the Q,A&D and
shift it into the body of the presentation. This gives us 16 minutes for the
body, and still enough time to cover core issues in the Q,A&D session.
This extra minute was then allocated to the first part of the body (Explain
the Need for Change), which means we now have six minutes to cover this
content.
Figure 14.4: Exchanging Time Between the Q,A&D and the Body
▫ Moving Time from the Cons and Pros to the Detailed Proposal. We
clearly need more time to explain the detailed timeline in our proposal. It
was therefore decided to remove two minutes from the Detailed Cons and
Pros (Template Part 3), and move this up to the second part of the Template
(Describe Proposal), as shown in 1 and 2 at Figure 14.5.
Extra minute added to state the problem.
Take two minutes from Detail Cons & Pros
as Part 2 of this template would almost
certainly be the biggest section in this case.
Merge these two points, and keep this really
short and to the point.
As the note suggests, you will
not have time to cover these in
detail, so just mention them and
cover this in the Q,A&D or
Follow Up.
After making these adjustments the Body
fits into the allocated timeframe
Delete this dependent point, because we
don’t have the time to discuss the two
products and benchmarks (This
information is required if the audience are
going to believe this issue). Additionally,
this point is not required to reach the aim
of the presentation.
3
4
5
Cover these issues quickly, to scope the
solution for them.
Add a bit more time here to handle these
issues more effectively.
1
2
Figure 14.5: Tailoring the Content, so it can be Delivered in the Time Available
Allocating Time
Seahorses©
2010 Page 45
Option 2 - Trimming the Content. However, this does not resolve the entire
problem, so some of the content will need to be trimmed and re-formed. For
example, as shown at 3 at Figure 14.5 (above), we have decided to merge the
Overview and the Detailed Description introduction and then trim this down. As
a result of this decision, we have kept this section very short, so it simply acts as a
lead-in for the more detailed information that follows (e.g. keeping this to about
45-50 words). This approach will save over a minute and a half.
Option 3 - Transfer Content. It is clear that we can’t cover the detailed
discussion of the two products and two benchmarks in the timeframe available.
However, it will be important to give the audience this information, so we can
shape their evaluation. It will be worthwhile to transfer this content to another
part of the presentation. We have therefore decided to just mention the issues in
the body and prepare to cover it in detail during the Q,A&D and/or Follow Up as
shown in 4 at Figure 14.5 (above).
Option 4 - Cutting Out Content. Because you won’t be covering the two
products and the benchmarks in detail, you won’t be giving the audience the
information they need to believe and understand point 3C. This point should
therefore be cut out, as shown at 5 at Figure 14.5 (above), so some of the other
positive aspects of the proposal can be described in more detail.
Question 3 - Is There Enough Diversity in Content? In this case, we will be changing
topics at intervals of seven minutes or less. For this reason, we would not need to
tailor the content further to generate diversity.
As shown in Figure 14.5 (above) these changes have allowed us to tailor the message so it
can successfully be delivered in the time available. You can then use these timing guidelines
to develop your script, and deliver your persuasive message in the period available.
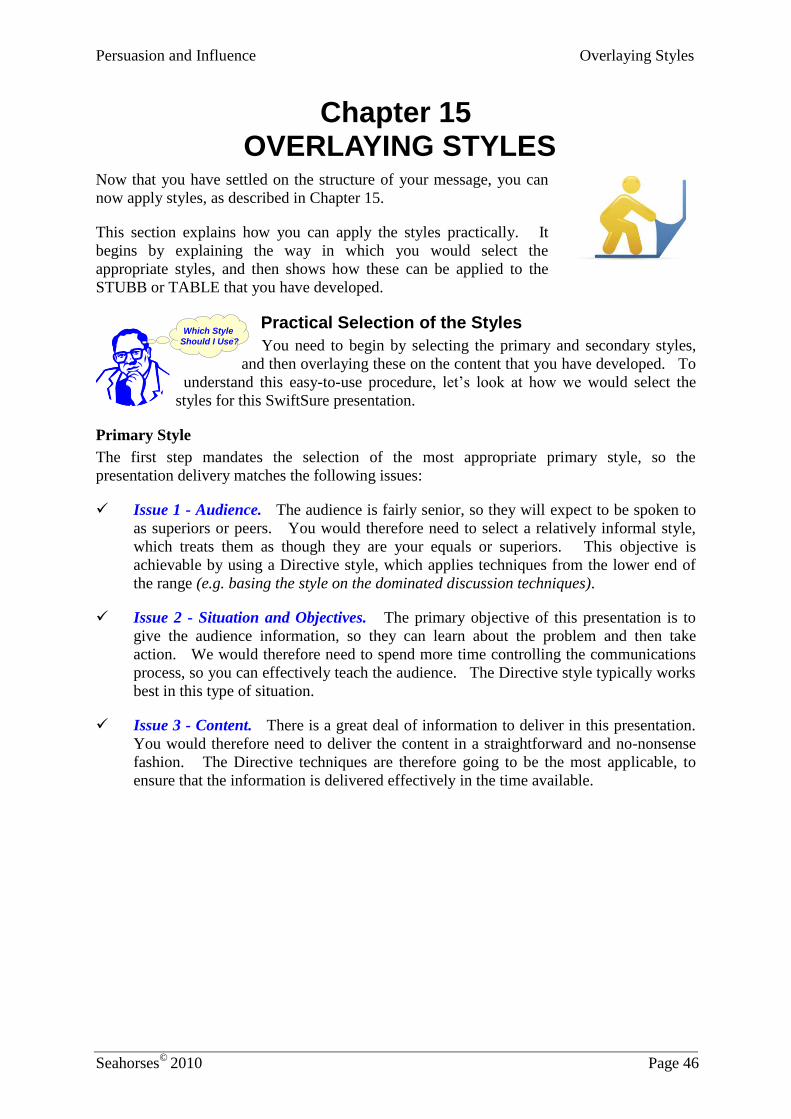
Persuasion and Influence Overlaying Styles
Seahorses©
2010 Page 46
Which Style
Should I Use?
Chapter 15 OVERLAYING STYLES
Now that you have settled on the structure of your message, you can
now apply styles, as described in Chapter 15.
This section explains how you can apply the styles practically. It
begins by explaining the way in which you would select the
appropriate styles, and then shows how these can be applied to the
STUBB or TABLE that you have developed.
Practical Selection of the Styles
You need to begin by selecting the primary and secondary styles,
and then overlaying these on the content that you have developed. To
understand this easy-to-use procedure, let’s look at how we would select the
styles for this SwiftSure presentation.
Primary Style
The first step mandates the selection of the most appropriate primary style, so the
presentation delivery matches the following issues:
Issue 1 - Audience. The audience is fairly senior, so they will expect to be spoken to
as superiors or peers. You would therefore need to select a relatively informal style,
which treats them as though they are your equals or superiors. This objective is
achievable by using a Directive style, which applies techniques from the lower end of
the range (e.g. basing the style on the dominated discussion techniques).
Issue 2 - Situation and Objectives. The primary objective of this presentation is to
give the audience information, so they can learn about the problem and then take
action. We would therefore need to spend more time controlling the communications
process, so you can effectively teach the audience. The Directive style typically works
best in this type of situation.
Issue 3 - Content. There is a great deal of information to deliver in this presentation.
You would therefore need to deliver the content in a straightforward and no-nonsense
fashion. The Directive techniques are therefore going to be the most applicable, to
ensure that the information is delivered effectively in the time available.
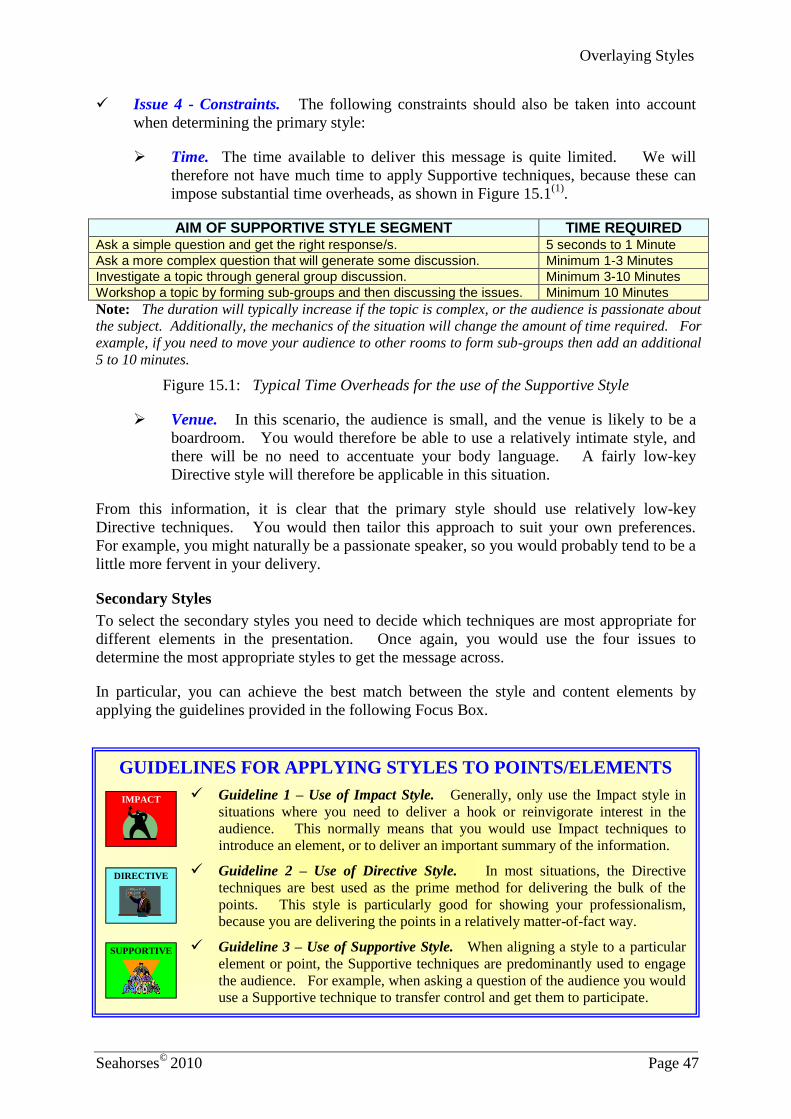
Overlaying Styles
Seahorses©
2010 Page 47
Issue 4 - Constraints. The following constraints should also be taken into account
when determining the primary style:
Time. The time available to deliver this message is quite limited. We will
therefore not have much time to apply Supportive techniques, because these can
impose substantial time overheads, as shown in Figure 15.1(1)
.
AIM OF SUPPORTIVE STYLE SEGMENT TIME REQUIRED Ask a simple question and get the right response/s. 5 seconds to 1 Minute
Ask a more complex question that will generate some discussion. Minimum 1-3 Minutes
Investigate a topic through general group discussion. Minimum 3-10 Minutes
Workshop a topic by forming sub-groups and then discussing the issues. Minimum 10 Minutes
Note: The duration will typically increase if the topic is complex, or the audience is passionate about
the subject. Additionally, the mechanics of the situation will change the amount of time required. For
example, if you need to move your audience to other rooms to form sub-groups then add an additional
5 to 10 minutes.
Figure 15.1: Typical Time Overheads for the use of the Supportive Style
Venue. In this scenario, the audience is small, and the venue is likely to be a
boardroom. You would therefore be able to use a relatively intimate style, and
there will be no need to accentuate your body language. A fairly low-key
Directive style will therefore be applicable in this situation.
From this information, it is clear that the primary style should use relatively low-key
Directive techniques. You would then tailor this approach to suit your own preferences.
For example, you might naturally be a passionate speaker, so you would probably tend to be a
little more fervent in your delivery.
Secondary Styles
To select the secondary styles you need to decide which techniques are most appropriate for
different elements in the presentation. Once again, you would use the four issues to
determine the most appropriate styles to get the message across.
In particular, you can achieve the best match between the style and content elements by
applying the guidelines provided in the following Focus Box.
GUIDELINES FOR APPLYING STYLES TO POINTS/ELEMENTS
Guideline 1 – Use of Impact Style. Generally, only use the Impact style in
situations where you need to deliver a hook or reinvigorate interest in the
audience. This normally means that you would use Impact techniques to
introduce an element, or to deliver an important summary of the information.
Guideline 2 – Use of Directive Style. In most situations, the Directive
techniques are best used as the prime method for delivering the bulk of the
points. This style is particularly good for showing your professionalism,
because you are delivering the points in a relatively matter-of-fact way.
Guideline 3 – Use of Supportive Style. When aligning a style to a particular
element or point, the Supportive techniques are predominantly used to engage
the audience. For example, when asking a question of the audience you would
use a Supportive technique to transfer control and get them to participate.
SUPPORTIVE
DIRECTIVE
IMPACT
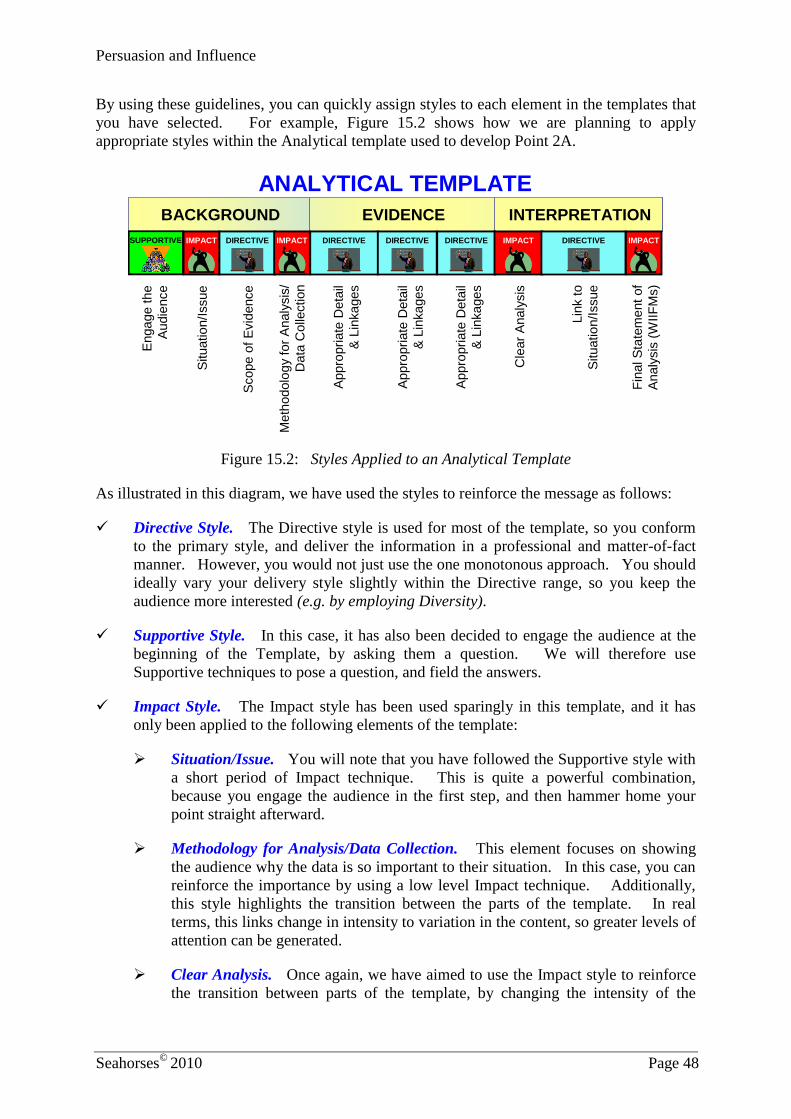
Persuasion and Influence
Seahorses©
2010 Page 48
By using these guidelines, you can quickly assign styles to each element in the templates that
you have selected. For example, Figure 15.2 shows how we are planning to apply
appropriate styles within the Analytical template used to develop Point 2A.
ANALYTICAL TEMPLATE
BACKGROUND EVIDENCE INTERPRETATIONBACKGROUND EVIDENCE INTERPRETATION
Scope
of
Evid
ence
Meth
odolo
gy f
or
Analy
sis
/
Data
Colle
ction
Enga
ge
th
e
Audie
nce
Situatio
n/I
ssue
Appro
pri
ate
Deta
il
& L
inka
ges
Cle
ar
Analy
sis
Lin
k t
o
Situatio
n/I
ssue
Fin
al S
tate
me
nt
of
Analy
sis
(W
IIF
Ms)
DIRECTIVEIMPACTSUPPORTIVE DIRECTIVE DIRECTIVE DIRECTIVE IMPACT DIRECTIVE IMPACTIMPACT
Appro
pri
ate
Deta
il
& L
inka
ges
Appro
pri
ate
Deta
il
& L
inka
ges
Figure 15.2: Styles Applied to an Analytical Template
As illustrated in this diagram, we have used the styles to reinforce the message as follows:
Directive Style. The Directive style is used for most of the template, so you conform
to the primary style, and deliver the information in a professional and matter-of-fact
manner. However, you would not just use the one monotonous approach. You should
ideally vary your delivery style slightly within the Directive range, so you keep the
audience more interested (e.g. by employing Diversity).
Supportive Style. In this case, it has also been decided to engage the audience at the
beginning of the Template, by asking them a question. We will therefore use
Supportive techniques to pose a question, and field the answers.
Impact Style. The Impact style has been used sparingly in this template, and it has
only been applied to the following elements of the template:
Situation/Issue. You will note that you have followed the Supportive style with
a short period of Impact technique. This is quite a powerful combination,
because you engage the audience in the first step, and then hammer home your
point straight afterward.
Methodology for Analysis/Data Collection. This element focuses on showing
the audience why the data is so important to their situation. In this case, you can
reinforce the importance by using a low level Impact technique. Additionally,
this style highlights the transition between the parts of the template. In real
terms, this links change in intensity to variation in the content, so greater levels of
attention can be generated.
Clear Analysis. Once again, we have aimed to use the Impact style to reinforce
the transition between parts of the template, by changing the intensity of the
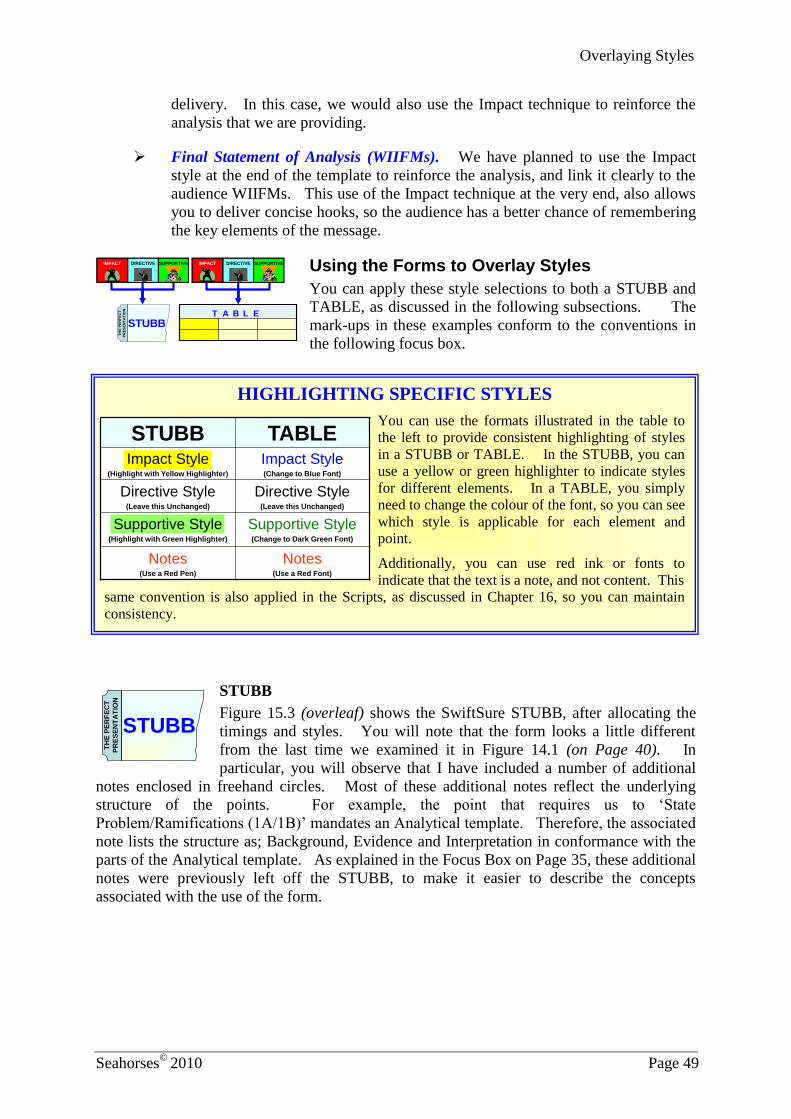
Overlaying Styles
Seahorses©
2010 Page 49
delivery. In this case, we would also use the Impact technique to reinforce the
analysis that we are providing.
Final Statement of Analysis (WIIFMs). We have planned to use the Impact
style at the end of the template to reinforce the analysis, and link it clearly to the
audience WIIFMs. This use of the Impact technique at the very end, also allows
you to deliver concise hooks, so the audience has a better chance of remembering
the key elements of the message.
Using the Forms to Overlay Styles
You can apply these style selections to both a STUBB and
TABLE, as discussed in the following subsections. The
mark-ups in these examples conform to the conventions in
the following focus box.
STUBB
Figure 15.3 (overleaf) shows the SwiftSure STUBB, after allocating the
timings and styles. You will note that the form looks a little different
from the last time we examined it in Figure 14.1 (on Page 40). In
particular, you will observe that I have included a number of additional
notes enclosed in freehand circles. Most of these additional notes reflect the underlying
structure of the points. For example, the point that requires us to ‘State
Problem/Ramifications (1A/1B)’ mandates an Analytical template. Therefore, the associated
note lists the structure as; Background, Evidence and Interpretation in conformance with the
parts of the Analytical template. As explained in the Focus Box on Page 35, these additional
notes were previously left off the STUBB, to make it easier to describe the concepts
associated with the use of the form.
HIGHLIGHTING SPECIFIC STYLES
You can use the formats illustrated in the table to
the left to provide consistent highlighting of styles
in a STUBB or TABLE. In the STUBB, you can
use a yellow or green highlighter to indicate styles
for different elements. In a TABLE, you simply
need to change the colour of the font, so you can see
which style is applicable for each element and
point.
Additionally, you can use red ink or fonts to
indicate that the text is a note, and not content. This
same convention is also applied in the Scripts, as discussed in Chapter 16, so you can maintain
consistency.
TH
E P
ER
FE
CT
PR
ES
EN
TA
TIO
N
STUBB
TH
E P
ER
FE
CT
PR
ES
EN
TA
TIO
N
STUBB T A B L ET A B L E
SUPPORTIVESUPPORTIVEIMPACTIMPACT DIRECTIVEDIRECTIVESUPPORTIVESUPPORTIVEIMPACTIMPACT DIRECTIVEDIRECTIVE
STUBB TABLEImpact Style
(Highlight with Yellow Highlighter)
Impact Style(Change to Blue Font)
Directive Style(Leave this Unchanged)
Directive Style(Leave this Unchanged)
Supportive Style(Highlight with Green Highlighter)
Supportive Style(Change to Dark Green Font)
Notes(Use a Red Pen)
Notes(Use a Red Font)
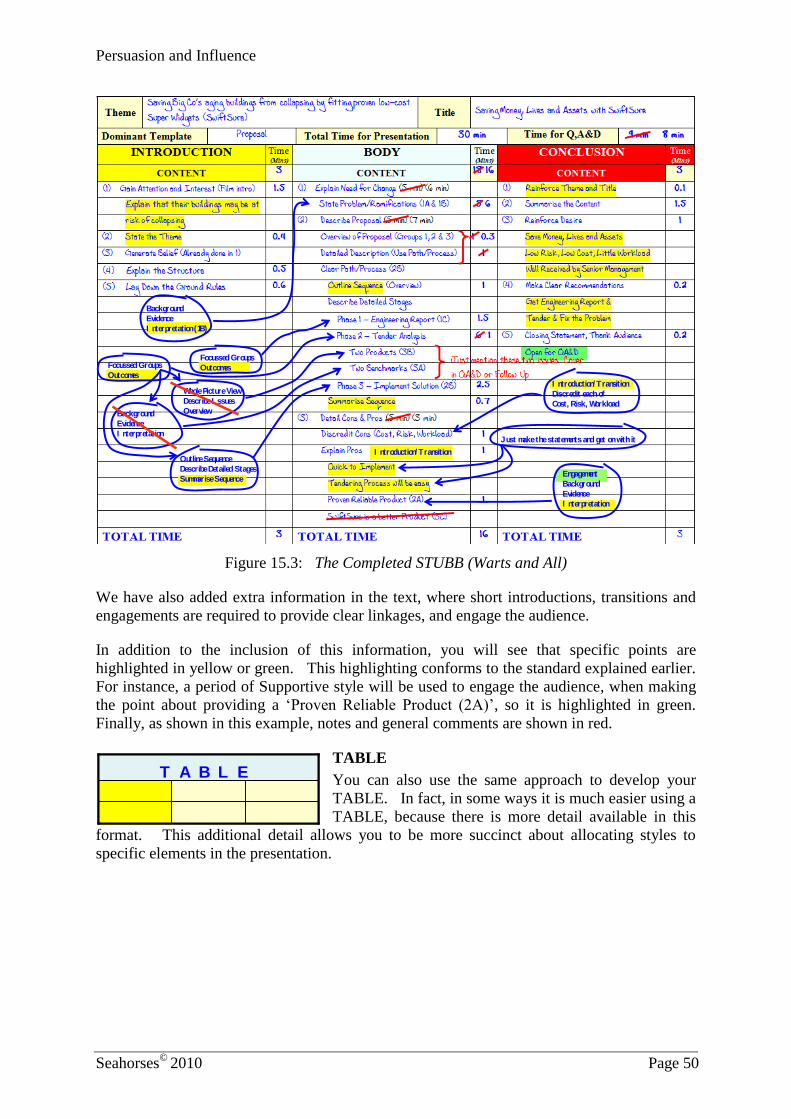
Persuasion and Influence
Seahorses©
2010 Page 50
Background
Evidence
I nterpretation (1B)
Focussed Groups
Outcomes
Whole Picture View
Describe I ssues
Overview
Outline Sequence
Describe Detailed Stages
Summarise Sequence
Background
Evidence
I nterpretation
Focussed Groups
OutcomesI ntroduction/ Transition
Discredit each of
Cost, Risk, Workload
I ntroduction/ Transition
Engagement
Background
Evidence
I nterpretation
Just make the statements and get on with it
Figure 15.3: The Completed STUBB (Warts and All)
We have also added extra information in the text, where short introductions, transitions and
engagements are required to provide clear linkages, and engage the audience.
In addition to the inclusion of this information, you will see that specific points are
highlighted in yellow or green. This highlighting conforms to the standard explained earlier.
For instance, a period of Supportive style will be used to engage the audience, when making
the point about providing a ‘Proven Reliable Product (2A)’, so it is highlighted in green.
Finally, as shown in this example, notes and general comments are shown in red.
TABLE
You can also use the same approach to develop your
TABLE. In fact, in some ways it is much easier using a
TABLE, because there is more detail available in this
format. This additional detail allows you to be more succinct about allocating styles to
specific elements in the presentation.
T A B L ET A B L E
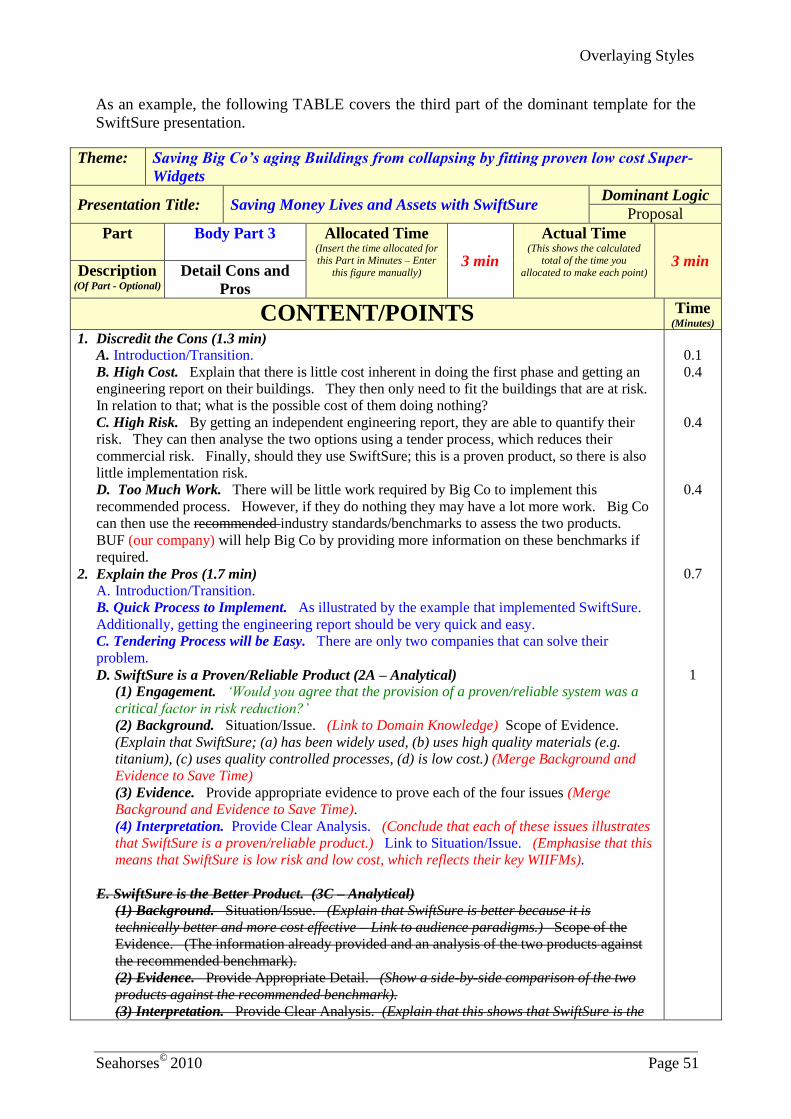
Overlaying Styles
Seahorses©
2010 Page 51
As an example, the following TABLE covers the third part of the dominant template for the
SwiftSure presentation.
Theme: Saving Big Co’s aging Buildings from collapsing by fitting proven low cost Super-
Widgets
Presentation Title: Saving Money Lives and Assets with SwiftSure Dominant Logic
Proposal
Part
Body Part 3 Allocated Time (Insert the time allocated for this Part in Minutes – Enter
this figure manually) 3 min
Actual Time (This shows the calculated
total of the time you
allocated to make each point) 3 min
Description (Of Part - Optional)
Detail Cons and
Pros
CONTENT/POINTS Time
(Minutes)
1. Discredit the Cons (1.3 min)
A. Introduction/Transition.
B. High Cost. Explain that there is little cost inherent in doing the first phase and getting an
engineering report on their buildings. They then only need to fit the buildings that are at risk.
In relation to that; what is the possible cost of them doing nothing?
C. High Risk. By getting an independent engineering report, they are able to quantify their
risk. They can then analyse the two options using a tender process, which reduces their
commercial risk. Finally, should they use SwiftSure; this is a proven product, so there is also
little implementation risk.
D. Too Much Work. There will be little work required by Big Co to implement this
recommended process. However, if they do nothing they may have a lot more work. Big Co
can then use the recommended industry standards/benchmarks to assess the two products.
BUF (our company) will help Big Co by providing more information on these benchmarks if
required.
2. Explain the Pros (1.7 min)
A. Introduction/Transition.
B. Quick Process to Implement. As illustrated by the example that implemented SwiftSure.
Additionally, getting the engineering report should be very quick and easy.
C. Tendering Process will be Easy. There are only two companies that can solve their
problem.
D. SwiftSure is a Proven/Reliable Product (2A – Analytical)
(1) Engagement. ‘Would you agree that the provision of a proven/reliable system was a
critical factor in risk reduction?’
(2) Background. Situation/Issue. (Link to Domain Knowledge) Scope of Evidence.
(Explain that SwiftSure; (a) has been widely used, (b) uses high quality materials (e.g.
titanium), (c) uses quality controlled processes, (d) is low cost.) (Merge Background and
Evidence to Save Time)
(3) Evidence. Provide appropriate evidence to prove each of the four issues (Merge
Background and Evidence to Save Time).
(4) Interpretation. Provide Clear Analysis. (Conclude that each of these issues illustrates
that SwiftSure is a proven/reliable product.) Link to Situation/Issue. (Emphasise that this
means that SwiftSure is low risk and low cost, which reflects their key WIIFMs).
E. SwiftSure is the Better Product. (3C – Analytical)
(1) Background. Situation/Issue. (Explain that SwiftSure is better because it is
technically better and more cost effective – Link to audience paradigms.) Scope of the
Evidence. (The information already provided and an analysis of the two products against
the recommended benchmark).
(2) Evidence. Provide Appropriate Detail. (Show a side-by-side comparison of the two
products against the recommended benchmark).
(3) Interpretation. Provide Clear Analysis. (Explain that this shows that SwiftSure is the
0.1
0.4
0.4
0.4
0.7
1
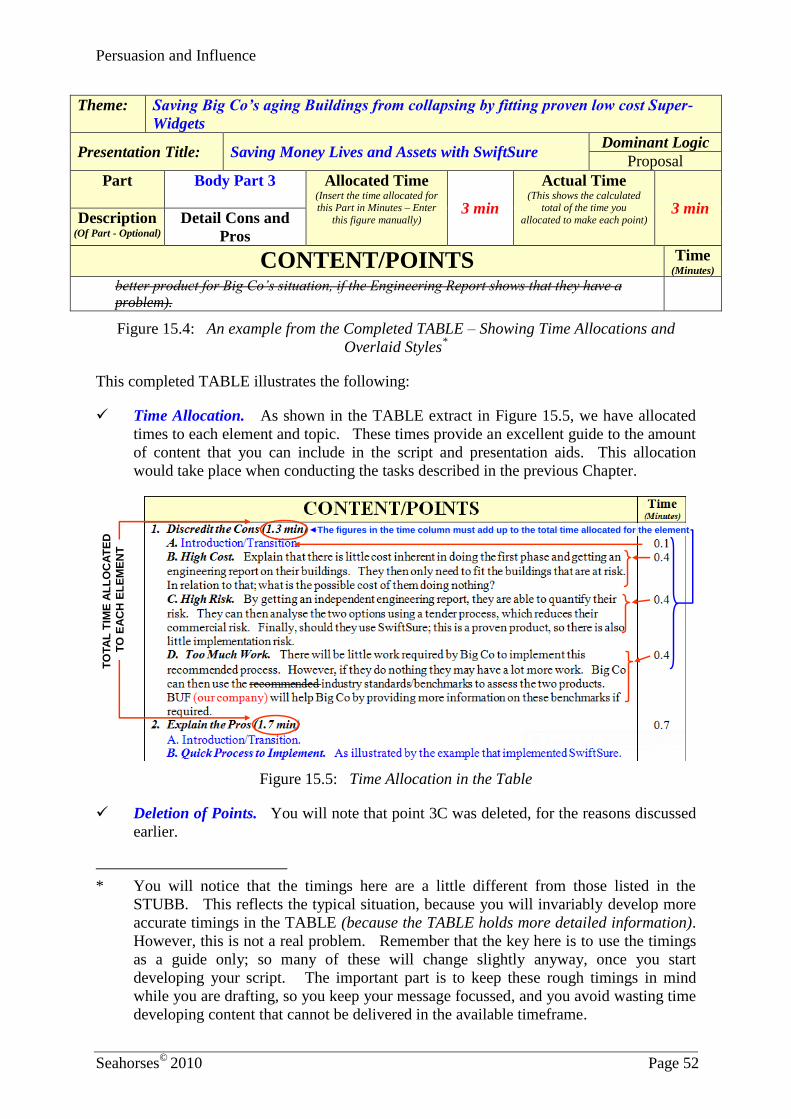
Persuasion and Influence
Seahorses©
2010 Page 52
Theme: Saving Big Co’s aging Buildings from collapsing by fitting proven low cost Super-
Widgets
Presentation Title: Saving Money Lives and Assets with SwiftSure Dominant Logic
Proposal
Part
Body Part 3 Allocated Time (Insert the time allocated for this Part in Minutes – Enter
this figure manually) 3 min
Actual Time (This shows the calculated
total of the time you
allocated to make each point) 3 min
Description (Of Part - Optional)
Detail Cons and
Pros
CONTENT/POINTS Time
(Minutes)
better product for Big Co’s situation, if the Engineering Report shows that they have a
problem).
Figure 15.4: An example from the Completed TABLE – Showing Time Allocations and
Overlaid Styles*
This completed TABLE illustrates the following:
Time Allocation. As shown in the TABLE extract in Figure 15.5, we have allocated
times to each element and topic. These times provide an excellent guide to the amount
of content that you can include in the script and presentation aids. This allocation
would take place when conducting the tasks described in the previous Chapter.
The figures in the time column must add up to the total time allocated for the element
TO
TA
L T
IME
AL
LO
CA
TE
D
TO
EA
CH
EL
EM
EN
T
Figure 15.5: Time Allocation in the Table
Deletion of Points. You will note that point 3C was deleted, for the reasons discussed
earlier.
* You will notice that the timings here are a little different from those listed in the
STUBB. This reflects the typical situation, because you will invariably develop more
accurate timings in the TABLE (because the TABLE holds more detailed information).
However, this is not a real problem. Remember that the key here is to use the timings
as a guide only; so many of these will change slightly anyway, once you start
developing your script. The important part is to keep these rough timings in mind
while you are drafting, so you keep your message focussed, and you avoid wasting time
developing content that cannot be delivered in the available timeframe.
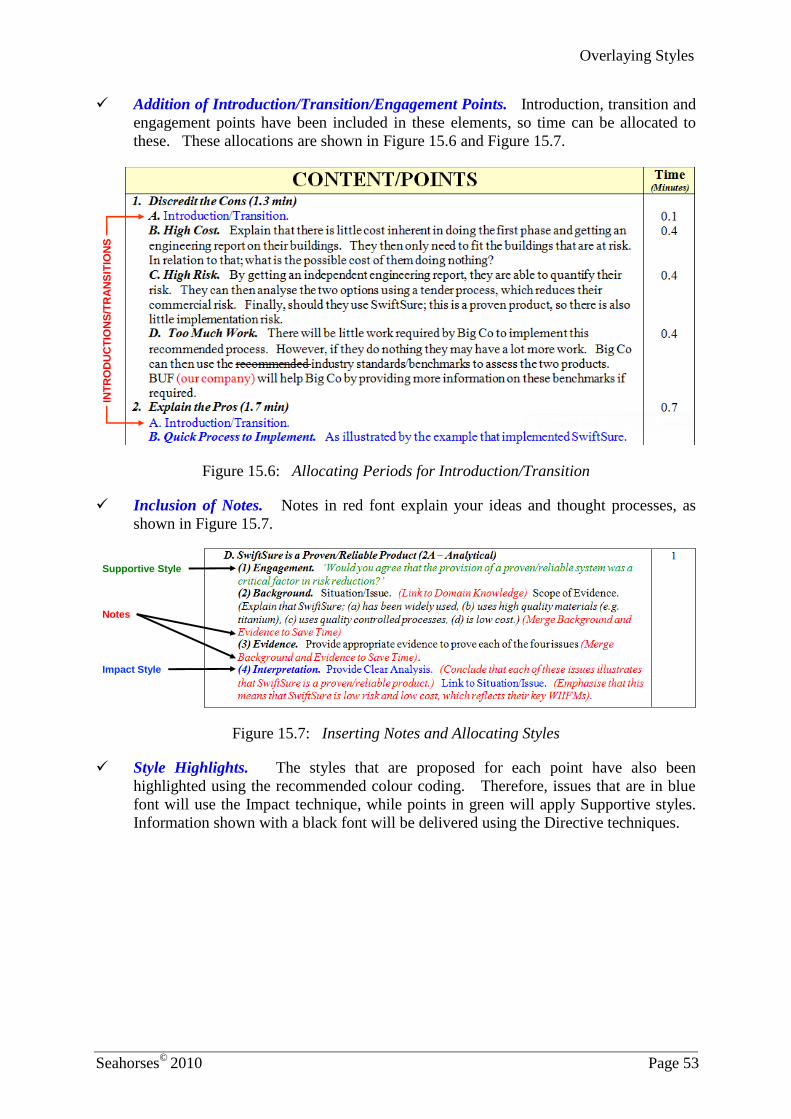
Overlaying Styles
Seahorses©
2010 Page 53
Addition of Introduction/Transition/Engagement Points. Introduction, transition and
engagement points have been included in these elements, so time can be allocated to
these. These allocations are shown in Figure 15.6 and Figure 15.7.
INT
RO
DU
CT
ION
S/T
RA
NS
ITIO
NS
Figure 15.6: Allocating Periods for Introduction/Transition
Inclusion of Notes. Notes in red font explain your ideas and thought processes, as
shown in Figure 15.7.
Supportive Style
Impact Style
Notes
Figure 15.7: Inserting Notes and Allocating Styles
Style Highlights. The styles that are proposed for each point have also been
highlighted using the recommended colour coding. Therefore, issues that are in blue
font will use the Impact technique, while points in green will apply Supportive styles.
Information shown with a black font will be delivered using the Directive techniques.
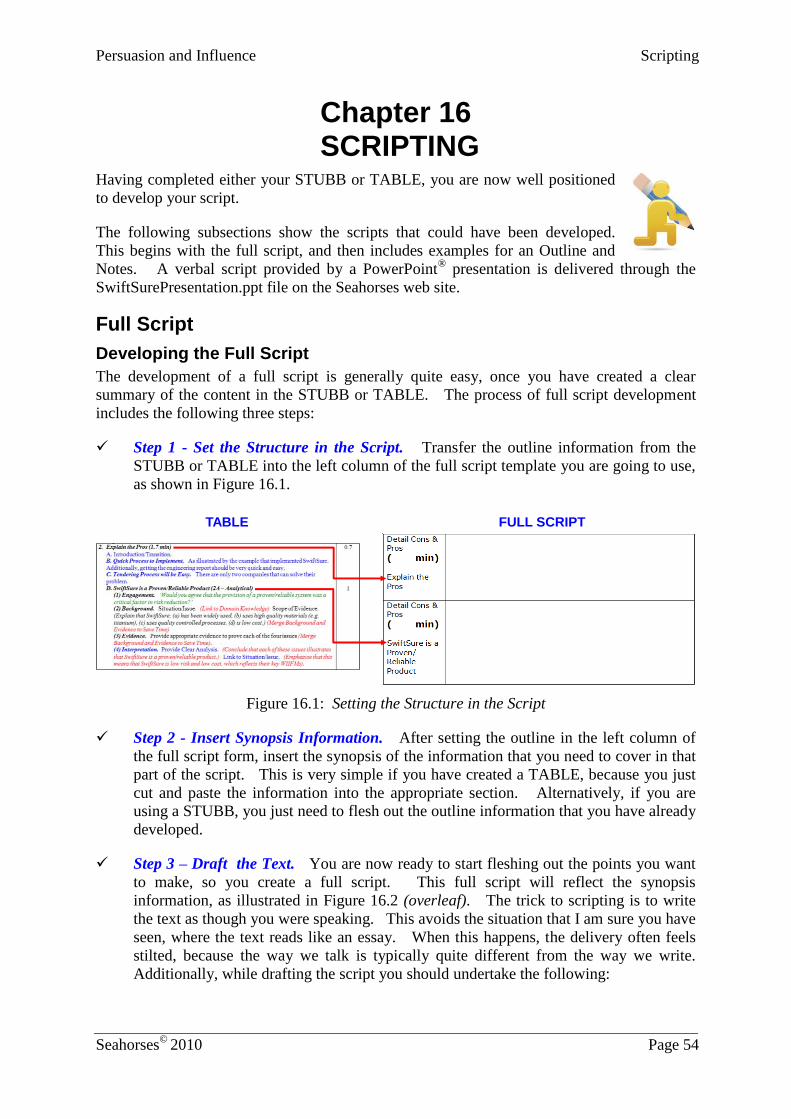
Persuasion and Influence Scripting
Seahorses©
2010 Page 54
Chapter 16 SCRIPTING
Having completed either your STUBB or TABLE, you are now well positioned
to develop your script.
The following subsections show the scripts that could have been developed.
This begins with the full script, and then includes examples for an Outline and
Notes. A verbal script provided by a PowerPoint® presentation is delivered through the
SwiftSurePresentation.ppt file on the Seahorses web site.
Full Script
Developing the Full Script
The development of a full script is generally quite easy, once you have created a clear
summary of the content in the STUBB or TABLE. The process of full script development
includes the following three steps:
Step 1 - Set the Structure in the Script. Transfer the outline information from the
STUBB or TABLE into the left column of the full script template you are going to use,
as shown in Figure 16.1.
TABLE FULL SCRIPT
Figure 16.1: Setting the Structure in the Script
Step 2 - Insert Synopsis Information. After setting the outline in the left column of
the full script form, insert the synopsis of the information that you need to cover in that
part of the script. This is very simple if you have created a TABLE, because you just
cut and paste the information into the appropriate section. Alternatively, if you are
using a STUBB, you just need to flesh out the outline information that you have already
developed.
Step 3 – Draft the Text. You are now ready to start fleshing out the points you want
to make, so you create a full script. This full script will reflect the synopsis
information, as illustrated in Figure 16.2 (overleaf). The trick to scripting is to write
the text as though you were speaking. This avoids the situation that I am sure you have
seen, where the text reads like an essay. When this happens, the delivery often feels
stilted, because the way we talk is typically quite different from the way we write.
Additionally, while drafting the script you should undertake the following:
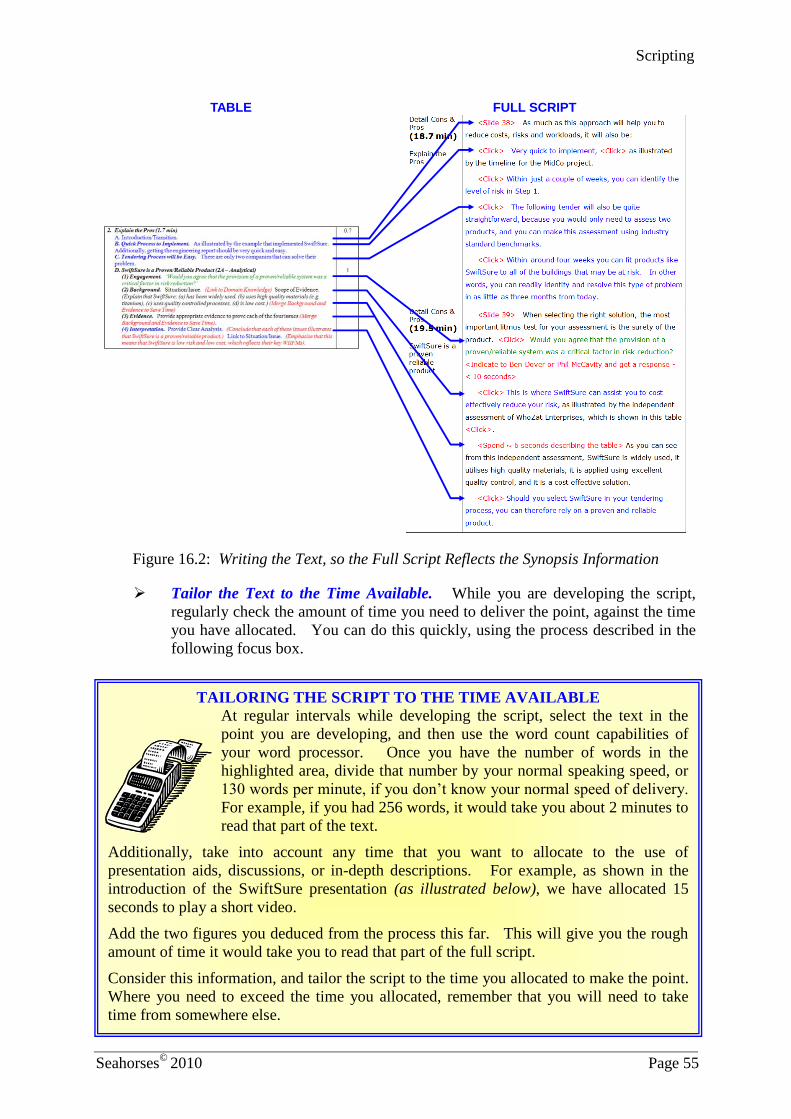
Scripting
Seahorses©
2010 Page 55
TABLE FULL SCRIPT
Figure 16.2: Writing the Text, so the Full Script Reflects the Synopsis Information
Tailor the Text to the Time Available. While you are developing the script,
regularly check the amount of time you need to deliver the point, against the time
you have allocated. You can do this quickly, using the process described in the
following focus box.
TAILORING THE SCRIPT TO THE TIME AVAILABLE At regular intervals while developing the script, select the text in the
point you are developing, and then use the word count capabilities of
your word processor. Once you have the number of words in the
highlighted area, divide that number by your normal speaking speed, or
130 words per minute, if you don’t know your normal speed of delivery.
For example, if you had 256 words, it would take you about 2 minutes to
read that part of the text.
Additionally, take into account any time that you want to allocate to the use of
presentation aids, discussions, or in-depth descriptions. For example, as shown in the
introduction of the SwiftSure presentation (as illustrated below), we have allocated 15
seconds to play a short video.
Add the two figures you deduced from the process this far. This will give you the rough
amount of time it would take you to read that part of the full script.
Consider this information, and tailor the script to the time you allocated to make the point.
Where you need to exceed the time you allocated, remember that you will need to take
time from somewhere else.
Persuasion and Influence
Seahorses©
2010 Page 56
Insert Cues and Comments. Insert cues and comments as necessary. In
particular, make sure that you integrate your use of aids into the presentation
using appropriate notes.
Account for the Styles. As you write the text, make sure that you take the styles
you assigned into account, and highlight the text using the appropriate
convention.
As you can see, this is a very straightforward procedure and it generally takes much less time
than starting script development from scratch. Additionally, by using this procedure you can
ensure that the script is highly focussed and persuasive. Most importantly, by adopting this
approach you avoid spending time developing script elements that cannot be delivered in the
time available.
The SwiftSure Full Script
So let’s now look at what the full script for our SwiftSure presentation would look like. The
accompanying PowerPoint presentation is provided in the SwiftSurePresentation.ppt file on
the Seahorses web site.
As you can see, this maps closely to the STUBB and TABLE that we created, so you can see
how the resulting script is simply the next logical step from the work carried out to this point.
A NOTE ABOUT THE SWIFTSURE SCENARIO
Before you begin reading this script, I just want to point out that the engineering behind this
scenario is purely fictional. Additionally, for those engineers who may be reading this
scenario, I have taken some liberties in relation to the science here, because I have little or no
knowledge in relation to this subject.
This example is simply designed to show how you can build a very potent message very
quickly even if you know very little about the topic.
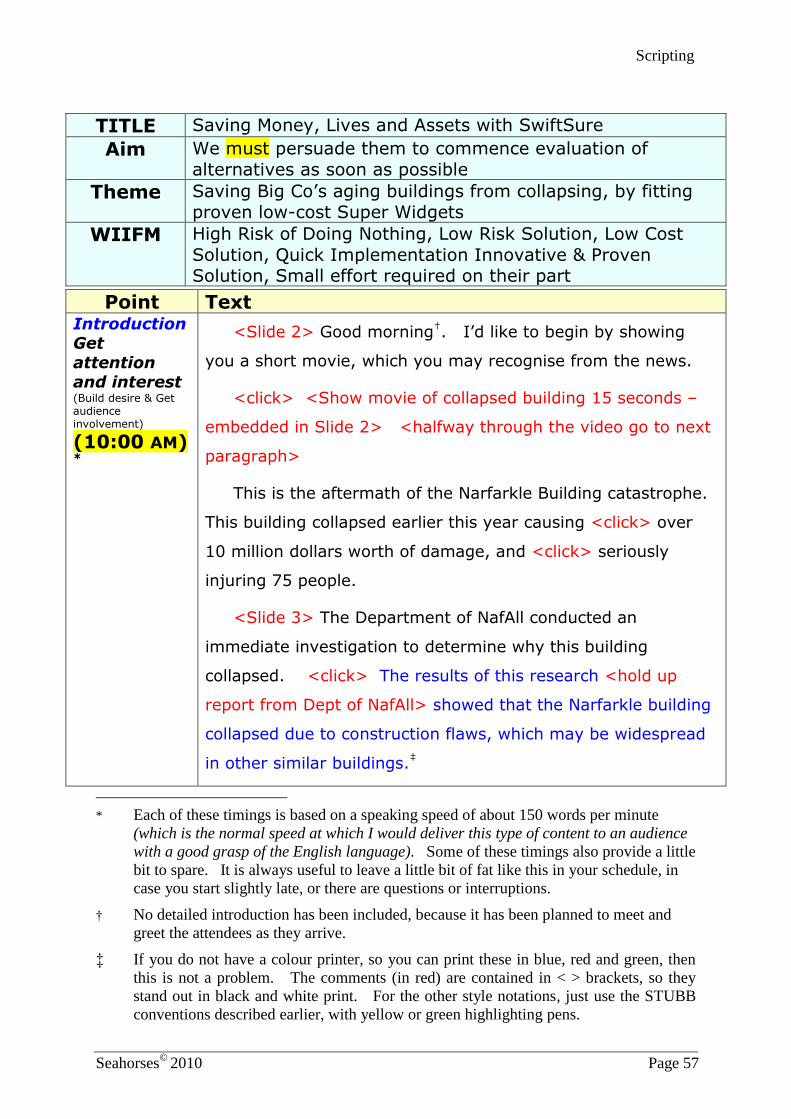
Scripting
Seahorses©
2010 Page 57
TITLE Saving Money, Lives and Assets with SwiftSure
Aim We must persuade them to commence evaluation of
alternatives as soon as possible
Theme Saving Big Co’s aging buildings from collapsing, by fitting proven low-cost Super Widgets
WIIFM High Risk of Doing Nothing, Low Risk Solution, Low Cost
Solution, Quick Implementation Innovative & Proven Solution, Small effort required on their part
Point Text
Introduction Get
attention and interest (Build desire & Get audience involvement)
(10:00 AM)
*
<Slide 2> Good morning†. I’d like to begin by showing
you a short movie, which you may recognise from the news.
<click> <Show movie of collapsed building 15 seconds –
embedded in Slide 2> <halfway through the video go to next
paragraph>
This is the aftermath of the Narfarkle Building catastrophe.
This building collapsed earlier this year causing <click> over
10 million dollars worth of damage, and <click> seriously
injuring 75 people.
<Slide 3> The Department of NafAll conducted an
immediate investigation to determine why this building
collapsed. <click> The results of this research <hold up
report from Dept of NafAll> showed that the Narfarkle building
collapsed due to construction flaws, which may be widespread
in other similar buildings.‡
* Each of these timings is based on a speaking speed of about 150 words per minute
(which is the normal speed at which I would deliver this type of content to an audience
with a good grasp of the English language). Some of these timings also provide a little
bit to spare. It is always useful to leave a little bit of fat like this in your schedule, in
case you start slightly late, or there are questions or interruptions.
† No detailed introduction has been included, because it has been planned to meet and
greet the attendees as they arrive.
‡ If you do not have a colour printer, so you can print these in blue, red and green, then
this is not a problem. The comments (in red) are contained in < > brackets, so they
stand out in black and white print. For the other style notations, just use the STUBB
conventions described earlier, with yellow or green highlighting pens.
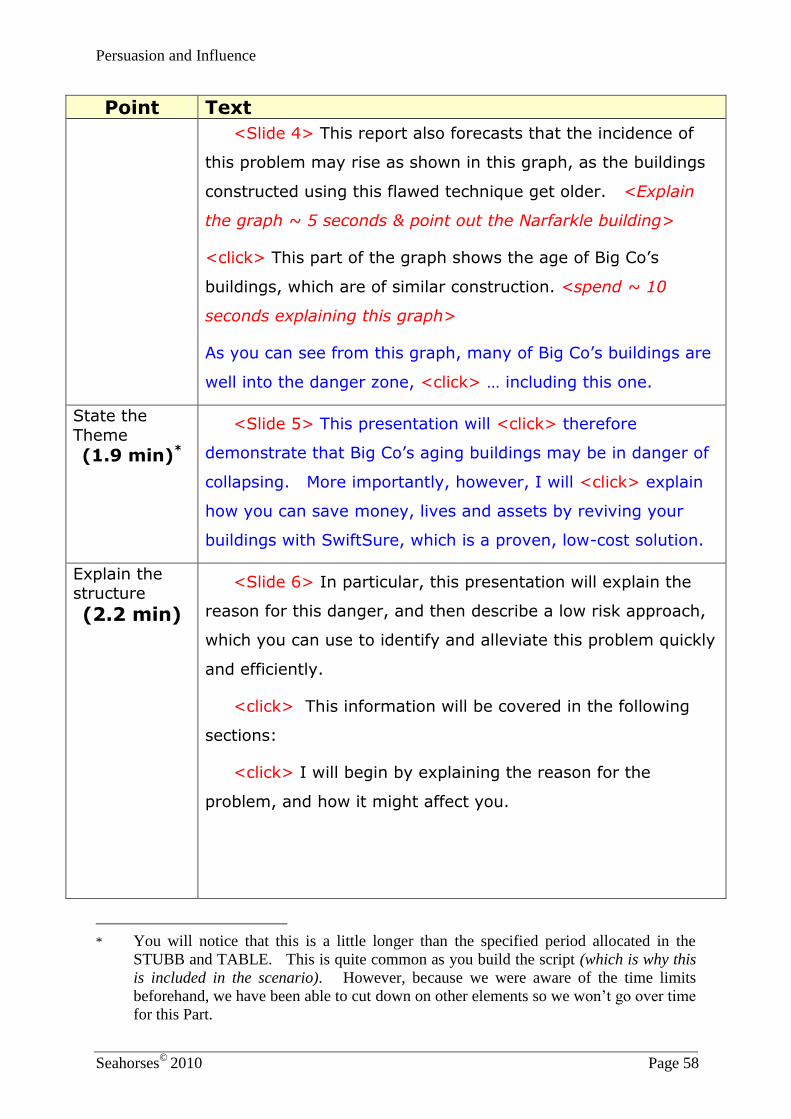
Persuasion and Influence
Seahorses©
2010 Page 58
Point Text
<Slide 4> This report also forecasts that the incidence of
this problem may rise as shown in this graph, as the buildings
constructed using this flawed technique get older. <Explain
the graph ~ 5 seconds & point out the Narfarkle building>
<click> This part of the graph shows the age of Big Co’s
buildings, which are of similar construction. <spend ~ 10
seconds explaining this graph>
As you can see from this graph, many of Big Co’s buildings are
well into the danger zone, <click> … including this one.
State the
Theme
(1.9 min)*
<Slide 5> This presentation will <click> therefore
demonstrate that Big Co’s aging buildings may be in danger of
collapsing. More importantly, however, I will <click> explain
how you can save money, lives and assets by reviving your
buildings with SwiftSure, which is a proven, low-cost solution.
Explain the structure
(2.2 min)
<Slide 6> In particular, this presentation will explain the
reason for this danger, and then describe a low risk approach,
which you can use to identify and alleviate this problem quickly
and efficiently.
<click> This information will be covered in the following
sections:
<click> I will begin by explaining the reason for the
problem, and how it might affect you.
* You will notice that this is a little longer than the specified period allocated in the
STUBB and TABLE. This is quite common as you build the script (which is why this
is included in the scenario). However, because we were aware of the time limits
beforehand, we have been able to cut down on other elements so we won’t go over time
for this Part.
Scripting
Seahorses©
2010 Page 59
Point Text
<click> To overcome this problem, I would then like to
recommend a straightforward approach, which you can
implement quickly to control your risk.
<click> This will be followed by an open discussion, in
which I will be happy to cover any of these issues in more
detail.
Lay down
ground rules
(2.9 min)
<click> I understand that many of you have other
appointments, so I will be very careful not to exceed the time
available for the presentation. To help me do this, could you
please hold all of your queries until the allocated question time,
unless you have a really pressing query. I appreciate your
assistance.
Body Part 1
State Problem /Ramifications
(10:03 AM)
Background
<Slide 7> <Slide Separator for Background>
<Slide 8> Let’s begin by showing what the Department of
NafAll identified as the reason for this problem.
<click> It stems from the construction methods used
during the 1970s to the 90s when many of your buildings were
first erected. As you would be aware, back in this period, the
‘slump’ requirements for reinforced concrete required lower
specifications than those imposed nowadays. In practice, this
meant that the concrete used back then was easier to work,
but it was not as strong.
<click> According to the research conducted by the
Department of NafAll; in some cases, the concrete has become
more porous over time, and this has led to the build up of
moisture, and the corrosion of the stirrups and rebar applied
within the foundations and floors of many buildings.
Persuasion and Influence
Seahorses©
2010 Page 60
Point Text
<Slide 9> So how does this happen? Let’s look at the
construction method that was applied to the concrete in your
buildings. <Spend ~5 seconds pointing to and explaining the
stirrup and rebar configuration>.
<click> Over time, the moisture can build up in the
porous heart of the concrete.
<click> this corrodes the rebar and stirrups, which
<click> can lead directly to structural failure.
Evidence
(4.7 min)
<Slide 10> The Department of NafAll reached this
conclusion after studying the internal structures within the
Narfarkle building after it collapsed, and then testing a wide
range of other office blocks to validate their findings. <click>
As discussed shortly, they found that this problem may be
widespread.
<click> For example, this picture shows just one of the
joists that failed within the Narfarkle building.
<click> As you can see the joist literally shattered due to
the severe internal wastage. Quite literally, it was only a
matter of time until this tragedy took place.
What’s perhaps more worrying, is the sheer lack of external
signs that this problem was growing inside the structure.
<click> For example, this magnified photograph was
taken of the beam on the left, just three months before it
collapsed. As you can see, there is virtually no external
indicators that the problem is this severe, apart from the light
marking and some minor cracking on the surfaces.
Scripting
Seahorses©
2010 Page 61
Point Text
<Slide 11> As discussed earlier, the Department of NafAll
identified three key reasons for these failures, which were all
linked to the type of concrete used, and the standard
construction methods that were applied. Of particular note,
many of your buildings use this construction standard, and
may therefore be suffering from the same problems.
<click> Let’s look at the reasons for this problem in more
detail.
Evidence
Reason 1
(6.2 min)
<Slide 12> The first of these relates to the porous nature
of the aging concrete. For example, the picture to the right
shows the porous nature of the cement in the Narfarkle
building. This reduction in density is also demonstrated in this
<click> graph, which is drawn directly from Page 7 of the
NafAll report. As you can see, this graph shows that the
density of the concrete becomes progressively lower over time.
<click> To put the level of risk into perspective, the graph on
the right shows that about 27 percent of the buildings
constructed around this period are considered to be at high or
elevated risk of the concrete becoming more porous, and just
over 31 percent are shown to be at moderate risk.
<click> In other words, you have more than a 50/50
chance that the concrete used in many of your buildings may
become porous, which means that …
Evidence Reason 2
(7.2 min)
<Slide 13> The level of moisture in the concrete can rise
quite rapidly. <click> As shown in this graph, the
Department of NafAll modelling showed that moisture at the
core of the concrete was able to build up at around 6.5% per
annum.
Persuasion and Influence
Seahorses©
2010 Page 62
Point Text
<click> This means that after 30 years, the concrete can
hold nearly seven times as much moisture as it should have.
Evidence
Reason 3
(7.6 min)
<Slide 14> Because of the build up of this moisture, the
reinforcing bars and stirrups are more likely to corrode.
According to the model shown on Page 18 of the NafAll report,
<click> which is shown in this graph, the level of corrosion for
key structural elements may take a few years to start.
However, there is a continual wasting of the steel
reinforcement during the ensuing years, because the extra
moisture held in the core of the concrete has caused them to
corrode.
In fact, the mass of the reinforcement in the concrete of the
Narfarkle building <click> had fallen to less than 60% of its
original dimensions, by the time the structure failed, and the
building collapsed. It is noteworthy that some of your
buildings may be even more at risk. <click> For example,
this could be the level of reinforcement corrosion in this
building.
Interpretation
(8.5 min)
<Slide 15> The buildings owned by many organisations…
including many of Big Co’s buildings, may therefore be
suffering from an insidious cancer. This corrosion may literally
be eating away the reinforcement as we speak. <click> In
real terms, this means that the risk of these buildings
collapsing may be rising, because:
<click> a previously unknown problem with early
standards for concrete, means that they may become more
porous;
Scripting
Seahorses©
2010 Page 63
Point Text
<click> which means that the core of the concrete may be
holding too much moisture; and
<click> this moisture is corroding the rebar and stirrups,
so the buildings are becoming weaker, and more likely to
collapse.
<click> Noting that many of your office blocks fit into the
same profile as the Narfarkle building, there is a very real risk
that this office, and many others used by Big Co, may be on
the verge of failure, and nobody knows.
Body Part 2
Describe Proposal
(10:09 AM) Overview &
Intro to Detailed
Description
<Slide 16> <Slide Separator for Solution>
I think you would agree that this is a worrying situation.
<Slide 17> However, there is a simple solution that you
can apply quickly, to identify the level of risk, and then take
action to resolve this problem.
Clear Path/
Process
(9.9 min)
Outline
Sequence
<click> In fact, you could initiate the resolution activities
almost immediately, and implement a proven solution within
about three months.
<click> This is achievable through three straightforward
steps.
<click> The first step entails carrying out an engineering
survey, and report on your buildings. This can be achieved
using independent organisations, or BUF has the proven skills
to do this work for you.
<click> Should the engineering report indicate that any of
your buildings are at risk, then you can rapidly go to tender to
find the best solution to fix this type of problem.

Persuasion and Influence
Seahorses©
2010 Page 64
Point Text
<click> Once you’ve completed the tender process, the
solution can be implemented within a very short timeframe.
As we’ll discuss shortly, we can typically fit products like
SwiftSure in around four weeks.
<click> You can therefore rapidly reduce your risks, so you
can save money lives and assets.
Clear Path/
Process
(10.8 min)
Detailed Description
Phase 1
<Slide 18> <Slide Separator for Step 1 – Engineering
Survey & Report> So let’s look at each of these three steps in
more detail, beginning with the Engineering Survey and
Report.
<Slide 19> This first step allows you to readily scope your
risks by getting a detailed engineering report. <click> There
are three phases in this process.
<click> Firstly, the organisation developing this report
should utilise the latest structural hydrometers to check for the
level of moisture within the load bearing structures in your
buildings.
<click> Where the level of moisture is high, your
engineering contractor should then use the latest generation of
structural scanning, to assess the amount of corrosion.
<click> In our experience, this typically takes about half a
day per floor within the average office structure, and it can
normally be done without unduly disrupting your staff. For
example, this work can be done at night time.
<Slide 20> A detailed report can then be created and
delivered within a few days.
<click> Getting this report can therefore be very quick.
Scripting
Seahorses©
2010 Page 65
Point Text
<click> By taking this action, you can rapidly assess the
extent of your risk, before you commit to any additional
expense. Most importantly, this approach has been used by
many other customers around the world, so you can be sure
that it works.
Clear Path/ Process
(12.2 min)
Detailed
Description Phase 2
<Slide 21> <Slide Separator for Step 2 – Go to Tender>
<Slide 22> Where the engineering report identifies that a
building is at risk, then you can go out to tender, so you can
engage an appropriate organisation to fix the problem.
<click> Your streamlined tendering processes should be
able to cope with this fairly quickly because:
<click> There are only two companies in the world that
make products that can rectify this type of problem. <click>
The first is BUF, which makes the SwiftSure product. <click>
The second option is provided by FlakeCo, which makes the
‘Crappolo’ widgets.
<Slide 23> We can also assist your team to fast track their
analysis, by providing information on the two available industry
benchmarks that are applicable to your assessment.
<click> Unfortunately, we don’t have the time to go into
the products and benchmarks during this presentation, but I
will be happy to cover them in more detail afterwards.
Clear Path/
Process
(13.2 min)
Detailed
Description
Phase 3
<Slide 24> <Slide Separator for Step 3 – Implement
Solution> The tendering process will allow you to quickly
determine the most appropriate and cost effective product to
meet your needs.
Persuasion and Influence
Seahorses©
2010 Page 66
Point Text
<Slide 25> You can then initiate quick rectification for any
buildings that are at risk. <Click> To explain the approach
that could be applied, I will use the timeline that was
successfully implemented for MidCo, just a couple of months
ago.
<Click> In this case, 8 of MidCo’s buildings were suffering
from advanced structural decay, and a further 20 were at risk.
<Click> We were selected through a tender process, and
then rapidly fitted SwiftSure to stabilise and strengthen their
buildings.
<Slide 26> The process we used to do this quickly,
entailed:
<Click> prioritising the work, so we could focus on the
office blocks that were most at risk;
<Click> fitting SwiftSure using the process that I will
describe in a moment, which is based on the application of
proven high quality systems, products and processes; and
<Click> because of the low cost of fitment, we were also
asked by MidCo to fit this system to buildings that were
currently not at risk, so they could achieve a longer life for
these buildings as well.
<Slide 27> <Slide Separator for SwiftSure Fitment
Process> So how does the SwiftSure system get fitted?
<Slide 28> There are five fitment stages. The first
involves <Click> drilling the holes into the right locations.
This is achieved through advanced, robotic, computer
controlled, precision drilling techniques, using the equipment
shown in the picture to the right.
Scripting
Seahorses©
2010 Page 67
Point Text
<Slide 29> Fitting the SwiftSure Super Widgets into the
holes, and testing them;
<Slide 30> then backfilling the holes with a special resin,
which strengthens the structure, and allows the moisture
collected by the SwiftSure Super Widget to be channelled away
from the cement structure. <Click> We then fit the cap
shown in the picture to the right over the end of the Super
Widget,
<Slide 31> and power up the SwiftSure elements. This
draws the moisture from the concrete, so this can then be
removed, and
<Slide 32> leaches a new form of polymer into the porous
structures within the concrete to: <Click> <Wait for
animations to finish>
<Click> make the concrete more impervious to future
moisture build up;
<Click> bond with the reinforcement and stirrups to
improve their strength; and
<Slide 33> increase the load bearing strength
substantially, by improving the strength of the concrete and
reinforcement, <Click> as shown in this graph. <explain the
graph in time with the animations ~ 5 Seconds>
<Click> The SwiftSure process therefore makes the
building stronger than the original specifications, even when
the corrosion is severe. These results were identified by
WhoZat Enterprises, which is an independent engineering
organisation.
Clear Path/
Process <Slide 34> We can therefore readily implement a solution
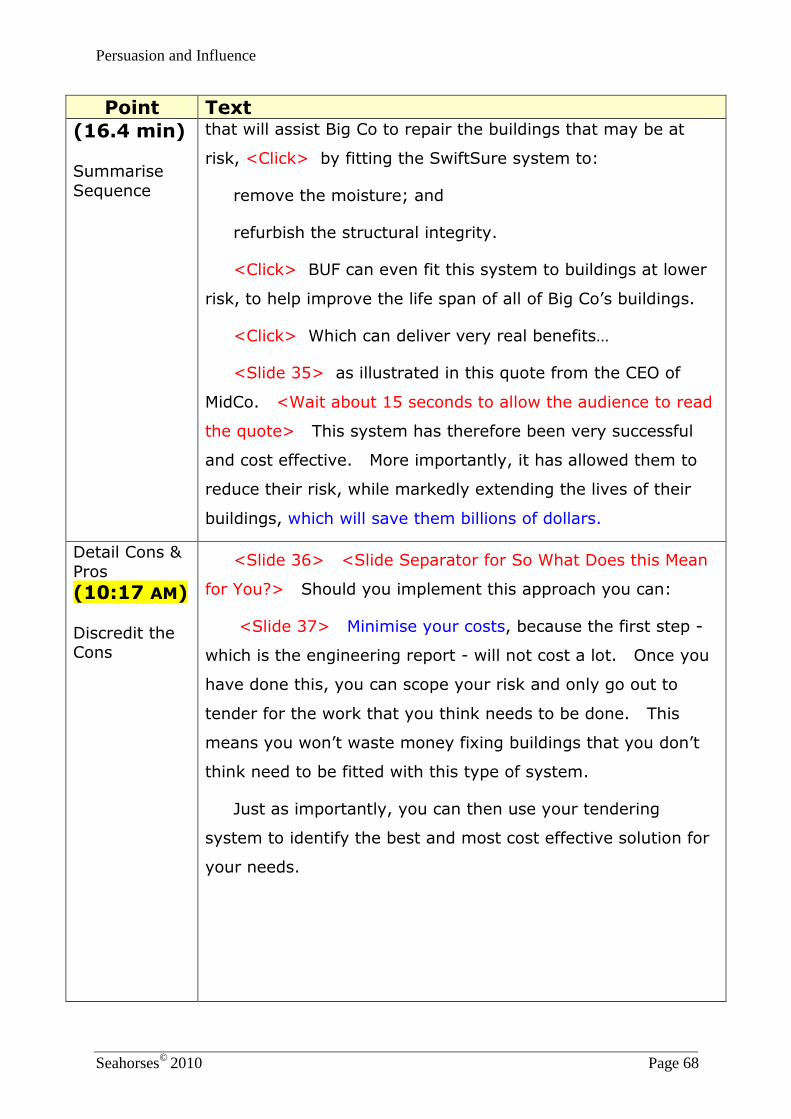
Persuasion and Influence
Seahorses©
2010 Page 68
Point Text
(16.4 min)
Summarise
Sequence
that will assist Big Co to repair the buildings that may be at
risk, <Click> by fitting the SwiftSure system to:
remove the moisture; and
refurbish the structural integrity.
<Click> BUF can even fit this system to buildings at lower
risk, to help improve the life span of all of Big Co’s buildings.
<Click> Which can deliver very real benefits…
<Slide 35> as illustrated in this quote from the CEO of
MidCo. <Wait about 15 seconds to allow the audience to read
the quote> This system has therefore been very successful
and cost effective. More importantly, it has allowed them to
reduce their risk, while markedly extending the lives of their
buildings, which will save them billions of dollars.
Detail Cons &
Pros
(10:17 AM)
Discredit the Cons
<Slide 36> <Slide Separator for So What Does this Mean
for You?> Should you implement this approach you can:
<Slide 37> Minimise your costs, because the first step -
which is the engineering report - will not cost a lot. Once you
have done this, you can scope your risk and only go out to
tender for the work that you think needs to be done. This
means you won’t waste money fixing buildings that you don’t
think need to be fitted with this type of system.
Just as importantly, you can then use your tendering
system to identify the best and most cost effective solution for
your needs.
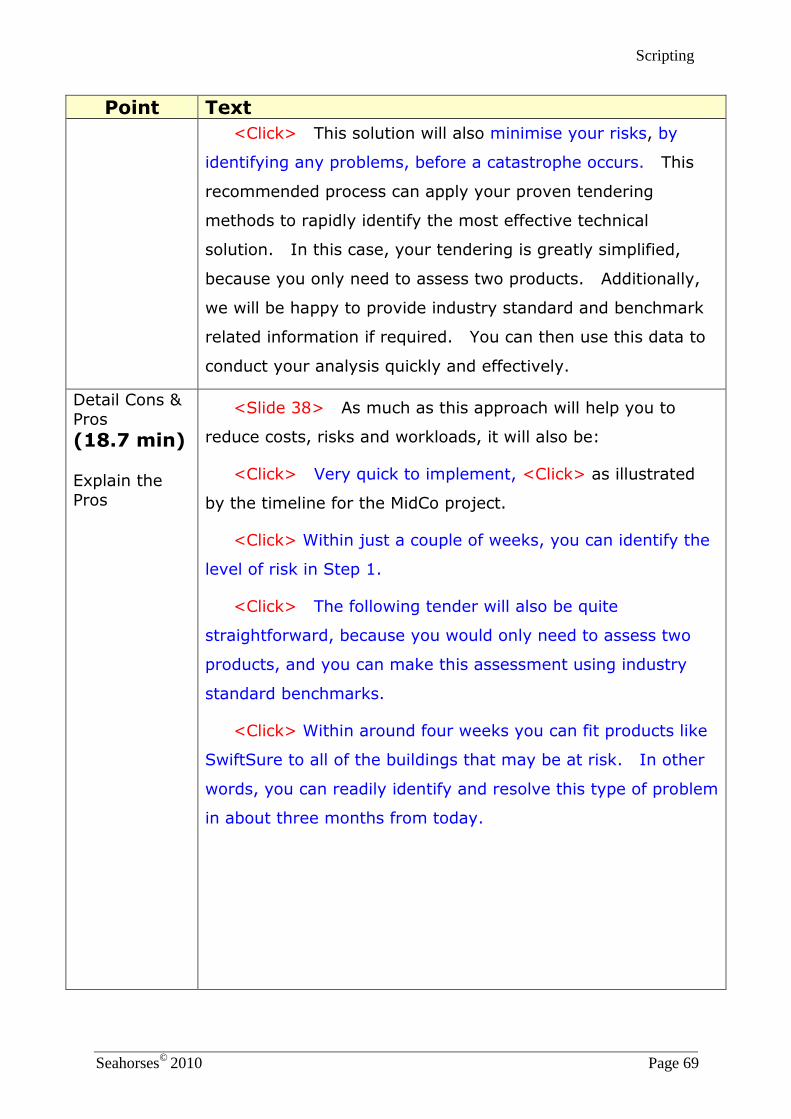
Scripting
Seahorses©
2010 Page 69
Point Text
<Click> This solution will also minimise your risks, by
identifying any problems, before a catastrophe occurs. This
recommended process can apply your proven tendering
methods to rapidly identify the most effective technical
solution. In this case, your tendering is greatly simplified,
because you only need to assess two products. Additionally,
we will be happy to provide industry standard and benchmark
related information if required. You can then use this data to
conduct your analysis quickly and effectively.
Detail Cons &
Pros
(18.7 min)
Explain the
Pros
<Slide 38> As much as this approach will help you to
reduce costs, risks and workloads, it will also be:
<Click> Very quick to implement, <Click> as illustrated
by the timeline for the MidCo project.
<Click> Within just a couple of weeks, you can identify the
level of risk in Step 1.
<Click> The following tender will also be quite
straightforward, because you would only need to assess two
products, and you can make this assessment using industry
standard benchmarks.
<Click> Within around four weeks you can fit products like
SwiftSure to all of the buildings that may be at risk. In other
words, you can readily identify and resolve this type of problem
in about three months from today.

Persuasion and Influence
Seahorses©
2010 Page 70
Point Text
Detail Cons &
Pros
(19.5 min)
SwiftSure is a proven
reliable product
<Slide 39> When selecting the right solution, the most
important litmus test for your assessment is the surety of the
product. <Click> Would you agree that the provision of a
proven/reliable system was a critical factor in risk reduction?*
<Indicate to Ben Dover or Phil McCavity and get a response -
10 seconds>
<Click> This is where SwiftSure can assist you to cost
effectively reduce your risk, as illustrated by the independent
assessment of WhoZat Enterprises, which is shown in this table
<Click>.
<Spend ~ 6 seconds describing the table> As you can see
from this independent assessment, SwiftSure is widely used, it
utilises high quality materials, it is applied using excellent
quality control, and it is a cost effective solution.
<Click> Should you select SwiftSure in your tendering
process, you can therefore rely on a proven and reliable
product.
Conclusion
Reinforce Theme &
Title
(10:20 AM)
<Slide 40> <Slide Separator for Conclusion>
<Slide 41> As the facts in this presentation have shown,
there is a very real danger that Big Co’s buildings may
collapse.
Summarise the Content
(20.6 min)
<click> For example, the Department of NafAll
investigation has shown that buildings of similar age and
construction to many of your office blocks may be at risk of
collapsing.
* In practice, I probably would not bother with this type of Dorothy Dix question during
this type of presentation. It has been included here, to demonstrate the application of
the Supportive technique within the Script.

Scripting
Seahorses©
2010 Page 71
Point Text
<click> Fortunately, you can rapidly reduce your risks by:
<click> engaging an appropriate organisation to conduct
an assessment of your buildings, and provide an engineering
report, so you can identify your level of risk rapidly. This
should typically take about two weeks, if you engage a suitable
organisation to carry out this task.
<click> You can then go out to tender, should you find
that any of your buildings are at risk of failure. Because there
are only two products to assess, and the benchmarks for
analysis are quite straightforward, it should be relatively quick
and easy to conduct this tendering process.
<click> Finally, you can implement your selected solution
quite quickly, using advanced technologies.
<Slide 42> Should you select the SwiftSure system for
Step 3 <click> this solution can be fitted in most buildings in
as little as four weeks. <click> This will actually make your
office blocks stronger than they were originally, even if their
structural degradation is quite severe.
<click> Additionally, SwiftSure, is a low cost and low risk
solution.
<click> Just as importantly, once you engage BUF, there
will be little work required from your team, and you can just
leave it up to us to fix your problems for you.
Reinforce
Desire
(22.2 min)
<Slide 43> By implementing this solution quickly, you can
save money, lives and your key assets, such as your buildings
and their contents.
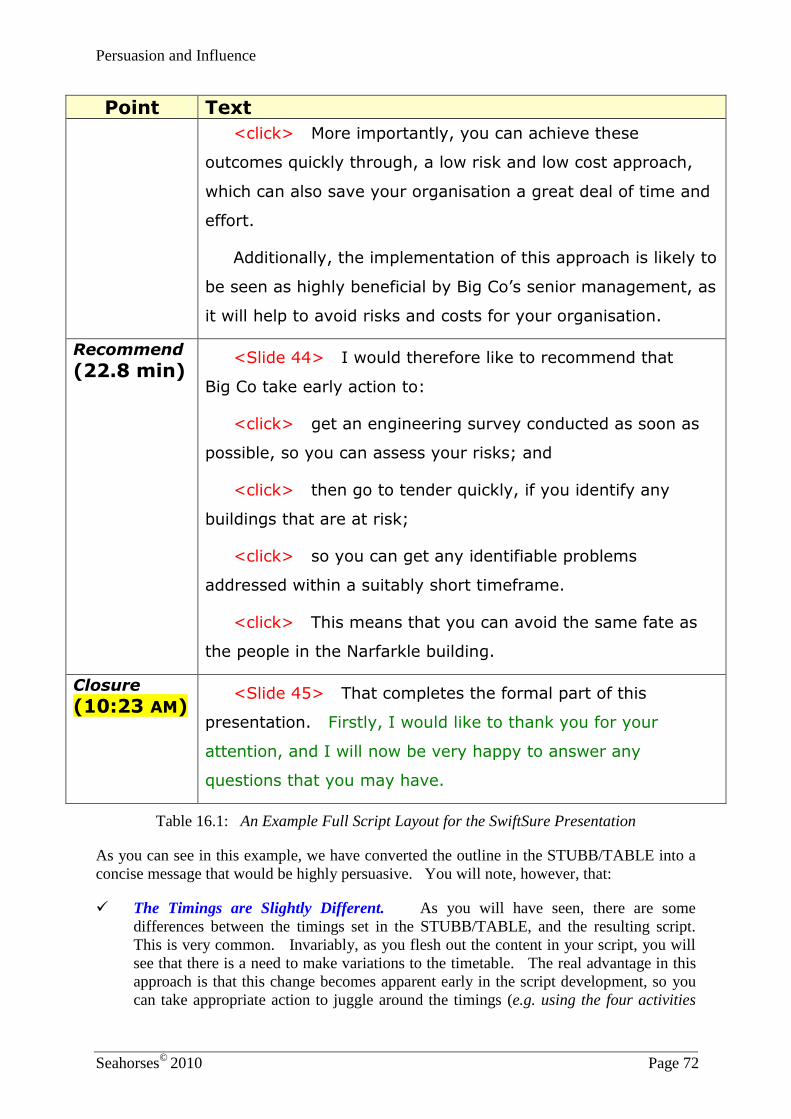
Persuasion and Influence
Seahorses©
2010 Page 72
Point Text
<click> More importantly, you can achieve these
outcomes quickly through, a low risk and low cost approach,
which can also save your organisation a great deal of time and
effort.
Additionally, the implementation of this approach is likely to
be seen as highly beneficial by Big Co’s senior management, as
it will help to avoid risks and costs for your organisation.
Recommend
(22.8 min) <Slide 44> I would therefore like to recommend that
Big Co take early action to:
<click> get an engineering survey conducted as soon as
possible, so you can assess your risks; and
<click> then go to tender quickly, if you identify any
buildings that are at risk;
<click> so you can get any identifiable problems
addressed within a suitably short timeframe.
<click> This means that you can avoid the same fate as
the people in the Narfarkle building.
Closure
(10:23 AM) <Slide 45> That completes the formal part of this
presentation. Firstly, I would like to thank you for your
attention, and I will now be very happy to answer any
questions that you may have.
Table 16.1: An Example Full Script Layout for the SwiftSure Presentation
As you can see in this example, we have converted the outline in the STUBB/TABLE into a
concise message that would be highly persuasive. You will note, however, that:
The Timings are Slightly Different. As you will have seen, there are some
differences between the timings set in the STUBB/TABLE, and the resulting script.
This is very common. Invariably, as you flesh out the content in your script, you will
see that there is a need to make variations to the timetable. The real advantage in this
approach is that this change becomes apparent early in the script development, so you
can take appropriate action to juggle around the timings (e.g. using the four activities
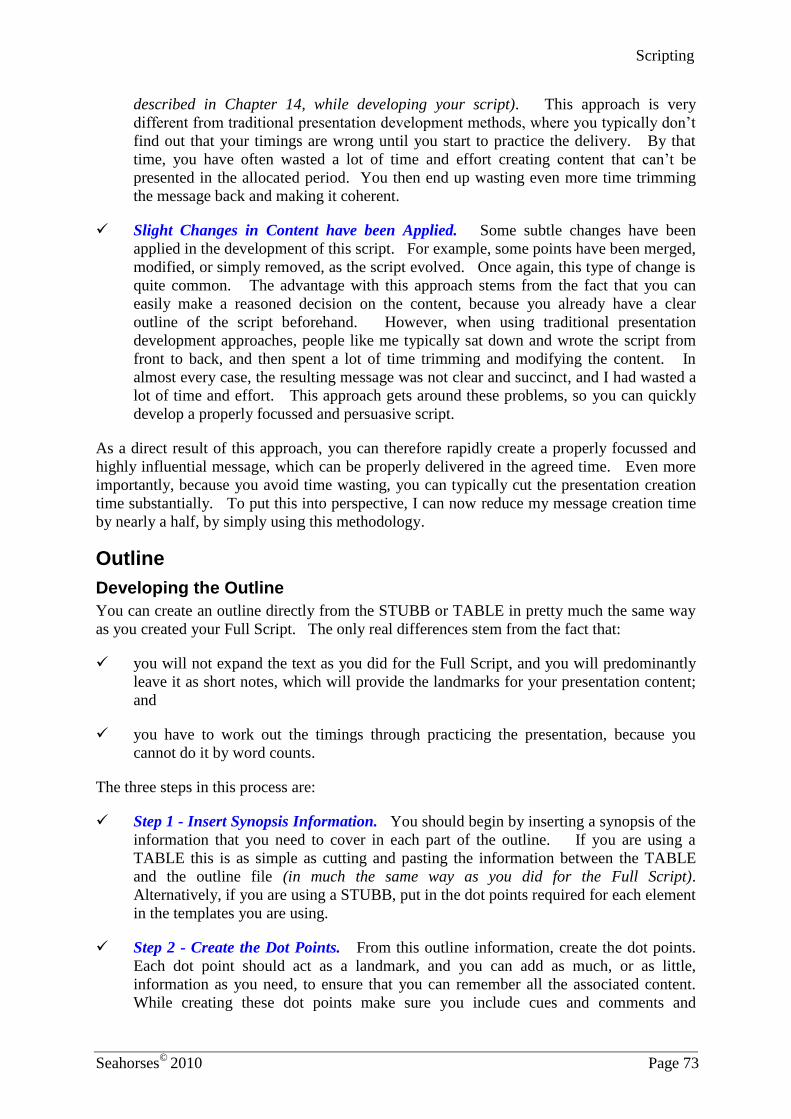
Scripting
Seahorses©
2010 Page 73
described in Chapter 14, while developing your script). This approach is very
different from traditional presentation development methods, where you typically don’t
find out that your timings are wrong until you start to practice the delivery. By that
time, you have often wasted a lot of time and effort creating content that can’t be
presented in the allocated period. You then end up wasting even more time trimming
the message back and making it coherent.
Slight Changes in Content have been Applied. Some subtle changes have been
applied in the development of this script. For example, some points have been merged,
modified, or simply removed, as the script evolved. Once again, this type of change is
quite common. The advantage with this approach stems from the fact that you can
easily make a reasoned decision on the content, because you already have a clear
outline of the script beforehand. However, when using traditional presentation
development approaches, people like me typically sat down and wrote the script from
front to back, and then spent a lot of time trimming and modifying the content. In
almost every case, the resulting message was not clear and succinct, and I had wasted a
lot of time and effort. This approach gets around these problems, so you can quickly
develop a properly focussed and persuasive script.
As a direct result of this approach, you can therefore rapidly create a properly focussed and
highly influential message, which can be properly delivered in the agreed time. Even more
importantly, because you avoid time wasting, you can typically cut the presentation creation
time substantially. To put this into perspective, I can now reduce my message creation time
by nearly a half, by simply using this methodology.
Outline
Developing the Outline
You can create an outline directly from the STUBB or TABLE in pretty much the same way
as you created your Full Script. The only real differences stem from the fact that:
you will not expand the text as you did for the Full Script, and you will predominantly
leave it as short notes, which will provide the landmarks for your presentation content;
and
you have to work out the timings through practicing the presentation, because you
cannot do it by word counts.
The three steps in this process are:
Step 1 - Insert Synopsis Information. You should begin by inserting a synopsis of the
information that you need to cover in each part of the outline. If you are using a
TABLE this is as simple as cutting and pasting the information between the TABLE
and the outline file (in much the same way as you did for the Full Script).
Alternatively, if you are using a STUBB, put in the dot points required for each element
in the templates you are using.
Step 2 - Create the Dot Points. From this outline information, create the dot points.
Each dot point should act as a landmark, and you can add as much, or as little,
information as you need, to ensure that you can remember all the associated content.
While creating these dot points make sure you include cues and comments and
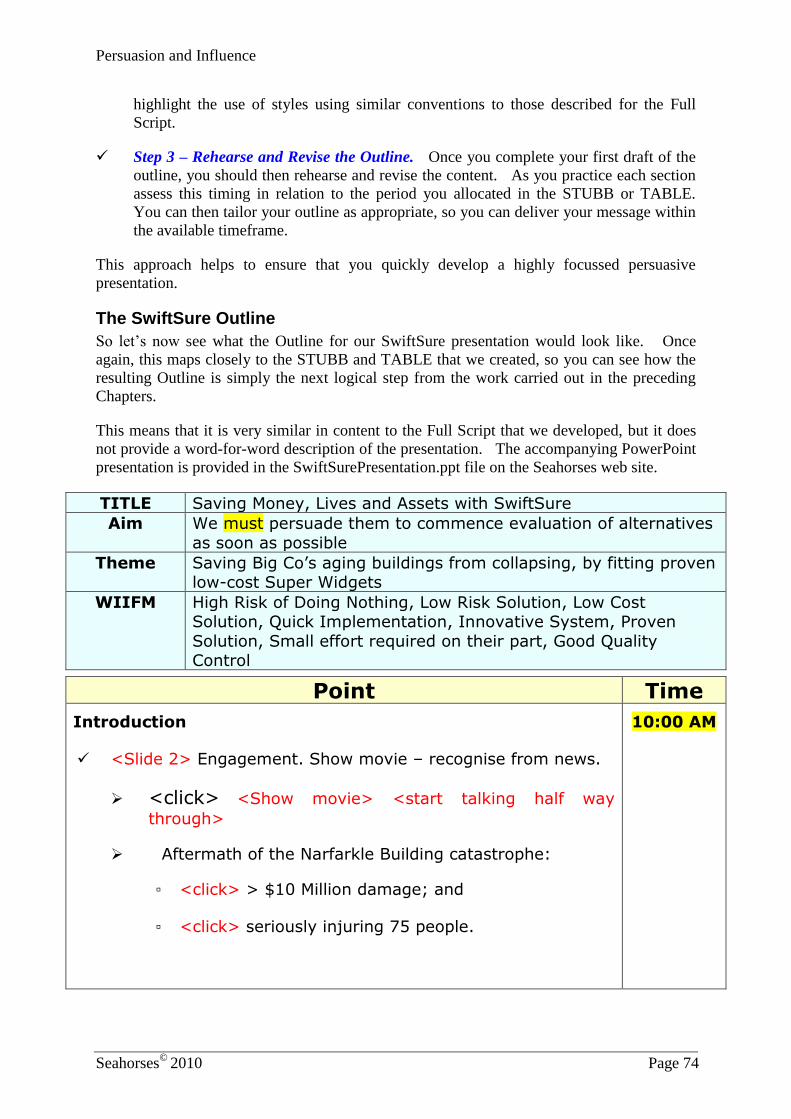
Persuasion and Influence
Seahorses©
2010 Page 74
highlight the use of styles using similar conventions to those described for the Full
Script.
Step 3 – Rehearse and Revise the Outline. Once you complete your first draft of the
outline, you should then rehearse and revise the content. As you practice each section
assess this timing in relation to the period you allocated in the STUBB or TABLE.
You can then tailor your outline as appropriate, so you can deliver your message within
the available timeframe.
This approach helps to ensure that you quickly develop a highly focussed persuasive
presentation.
The SwiftSure Outline
So let’s now see what the Outline for our SwiftSure presentation would look like. Once
again, this maps closely to the STUBB and TABLE that we created, so you can see how the
resulting Outline is simply the next logical step from the work carried out in the preceding
Chapters.
This means that it is very similar in content to the Full Script that we developed, but it does
not provide a word-for-word description of the presentation. The accompanying PowerPoint
presentation is provided in the SwiftSurePresentation.ppt file on the Seahorses web site.
TITLE Saving Money, Lives and Assets with SwiftSure
Aim We must persuade them to commence evaluation of alternatives
as soon as possible
Theme Saving Big Co’s aging buildings from collapsing, by fitting proven low-cost Super Widgets
WIIFM High Risk of Doing Nothing, Low Risk Solution, Low Cost Solution, Quick Implementation, Innovative System, Proven
Solution, Small effort required on their part, Good Quality Control
Point Time
Introduction
<Slide 2> Engagement. Show movie – recognise from news.
<click> <Show movie> <start talking half way
through>
Aftermath of the Narfarkle Building catastrophe:
▫ <click> > $10 Million damage; and
▫ <click> seriously injuring 75 people.
10:00 AM
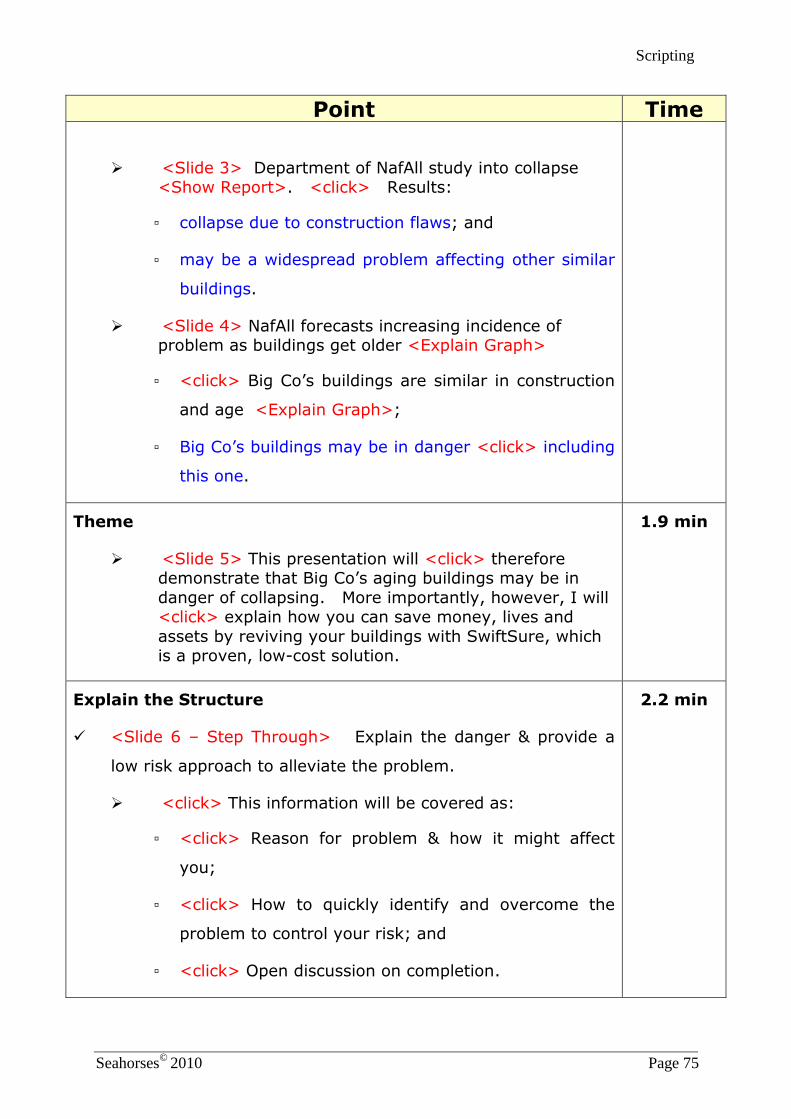
Scripting
Seahorses©
2010 Page 75
Point Time
<Slide 3> Department of NafAll study into collapse <Show Report>. <click> Results:
▫ collapse due to construction flaws; and
▫ may be a widespread problem affecting other similar
buildings.
<Slide 4> NafAll forecasts increasing incidence of problem as buildings get older <Explain Graph>
▫ <click> Big Co’s buildings are similar in construction
and age <Explain Graph>;
▫ Big Co’s buildings may be in danger <click> including
this one.
Theme
<Slide 5> This presentation will <click> therefore demonstrate that Big Co’s aging buildings may be in
danger of collapsing. More importantly, however, I will <click> explain how you can save money, lives and
assets by reviving your buildings with SwiftSure, which is a proven, low-cost solution.
1.9 min
Explain the Structure
<Slide 6 – Step Through> Explain the danger & provide a
low risk approach to alleviate the problem.
<click> This information will be covered as:
▫ <click> Reason for problem & how it might affect
you;
▫ <click> How to quickly identify and overcome the
problem to control your risk; and
▫ <click> Open discussion on completion.
2.2 min
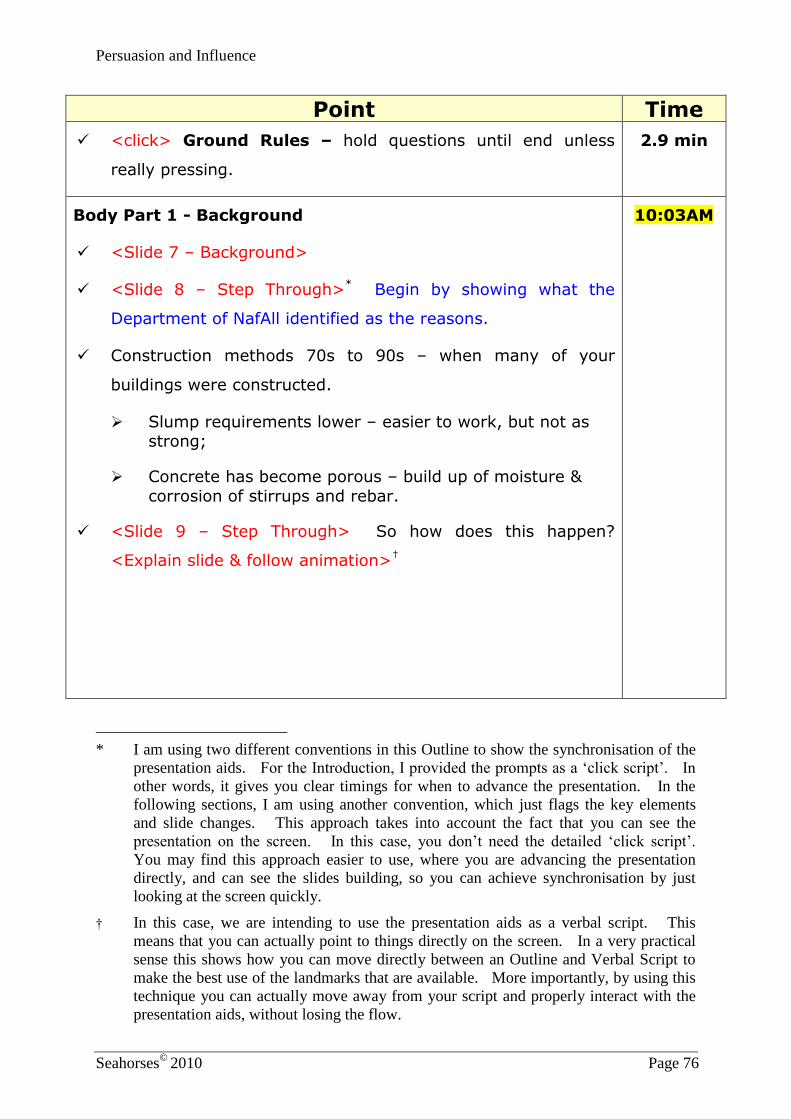
Persuasion and Influence
Seahorses©
2010 Page 76
Point Time
<click> Ground Rules – hold questions until end unless
really pressing.
2.9 min
Body Part 1 - Background
<Slide 7 – Background>
<Slide 8 – Step Through>* Begin by showing what the
Department of NafAll identified as the reasons.
Construction methods 70s to 90s – when many of your
buildings were constructed.
Slump requirements lower – easier to work, but not as strong;
Concrete has become porous – build up of moisture &
corrosion of stirrups and rebar.
<Slide 9 – Step Through> So how does this happen?
<Explain slide & follow animation>†
10:03AM
* I am using two different conventions in this Outline to show the synchronisation of the
presentation aids. For the Introduction, I provided the prompts as a ‘click script’. In
other words, it gives you clear timings for when to advance the presentation. In the
following sections, I am using another convention, which just flags the key elements
and slide changes. This approach takes into account the fact that you can see the
presentation on the screen. In this case, you don’t need the detailed ‘click script’.
You may find this approach easier to use, where you are advancing the presentation
directly, and can see the slides building, so you can achieve synchronisation by just
looking at the screen quickly.
† In this case, we are intending to use the presentation aids as a verbal script. This
means that you can actually point to things directly on the screen. In a very practical
sense this shows how you can move directly between an Outline and Verbal Script to
make the best use of the landmarks that are available. More importantly, by using this
technique you can actually move away from your script and properly interact with the
presentation aids, without losing the flow.
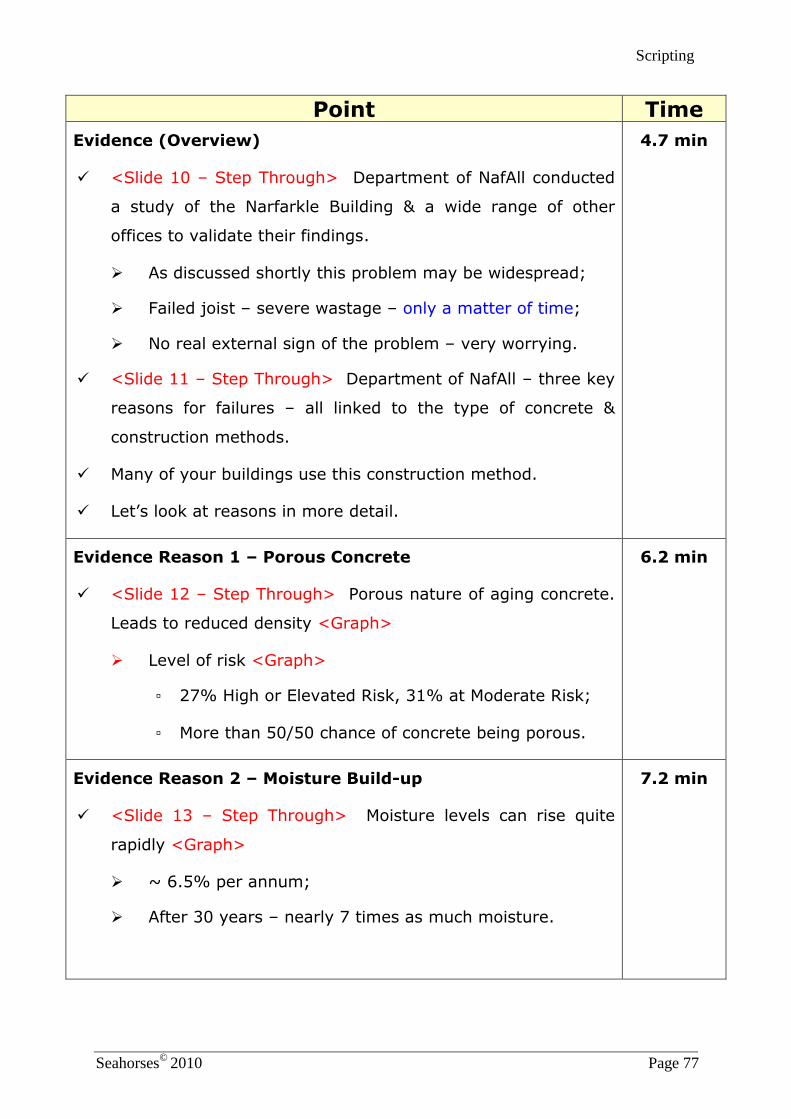
Scripting
Seahorses©
2010 Page 77
Point Time
Evidence (Overview)
<Slide 10 – Step Through> Department of NafAll conducted
a study of the Narfarkle Building & a wide range of other
offices to validate their findings.
As discussed shortly this problem may be widespread;
Failed joist – severe wastage – only a matter of time;
No real external sign of the problem – very worrying.
<Slide 11 – Step Through> Department of NafAll – three key
reasons for failures – all linked to the type of concrete &
construction methods.
Many of your buildings use this construction method.
Let’s look at reasons in more detail.
4.7 min
Evidence Reason 1 – Porous Concrete
<Slide 12 – Step Through> Porous nature of aging concrete.
Leads to reduced density <Graph>
Level of risk <Graph>
▫ 27% High or Elevated Risk, 31% at Moderate Risk;
▫ More than 50/50 chance of concrete being porous.
6.2 min
Evidence Reason 2 – Moisture Build-up
<Slide 13 – Step Through> Moisture levels can rise quite
rapidly <Graph>
~ 6.5% per annum;
After 30 years – nearly 7 times as much moisture.
7.2 min

Persuasion and Influence
Seahorses©
2010 Page 78
Point Time
Evidence Reason 3 – Corrosion of Structural Elements
<Slide 14 – Step Through> Because of moisture – rebar &
stirrups more likely to corrode <Graph>
Continual wasting of reinforcement over the years;
Narfarkle building <60% of original dimensions; and
Some of your buildings may be at even more risk
(including this one).
7.6 min
Interpretation
<Slide 15 – Step Through> Many buildings at risk (insidious
cancer) – including many of Big Co’s.
Risk is rising.
Previously unknown problem caused by early standards
of concrete;
Core of concrete may be holding too much moisture;
Moisture is corroding rebar & stirrups – buildings weaker;
Many of your offices have the same profile as the
Narfarkle building – some of your buildings may therefore be on the verge of failure & nobody knows.
8.5 min
Body Part 2 – Describe Proposal
<Slide 16 – Slide Separator - Solution> I think you would
agree this is a worrying situation.
<Slide 17 – Step Through> There is a simple solution that
you can apply quickly to resolve this problem.
10:09 AM
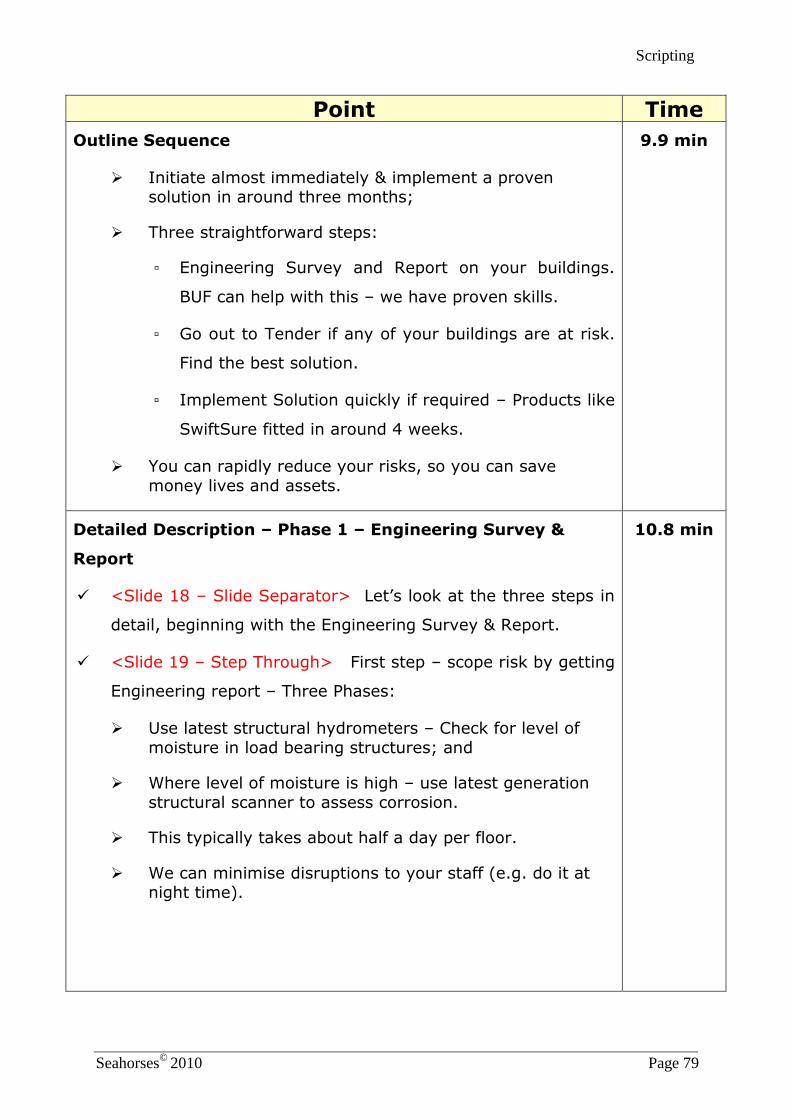
Scripting
Seahorses©
2010 Page 79
Point Time
Outline Sequence
Initiate almost immediately & implement a proven solution in around three months;
Three straightforward steps:
▫ Engineering Survey and Report on your buildings.
BUF can help with this – we have proven skills.
▫ Go out to Tender if any of your buildings are at risk.
Find the best solution.
▫ Implement Solution quickly if required – Products like
SwiftSure fitted in around 4 weeks.
You can rapidly reduce your risks, so you can save
money lives and assets.
9.9 min
Detailed Description – Phase 1 – Engineering Survey &
Report
<Slide 18 – Slide Separator> Let’s look at the three steps in
detail, beginning with the Engineering Survey & Report.
<Slide 19 – Step Through> First step – scope risk by getting
Engineering report – Three Phases:
Use latest structural hydrometers – Check for level of
moisture in load bearing structures; and
Where level of moisture is high – use latest generation
structural scanner to assess corrosion.
This typically takes about half a day per floor.
We can minimise disruptions to your staff (e.g. do it at night time).
10.8 min
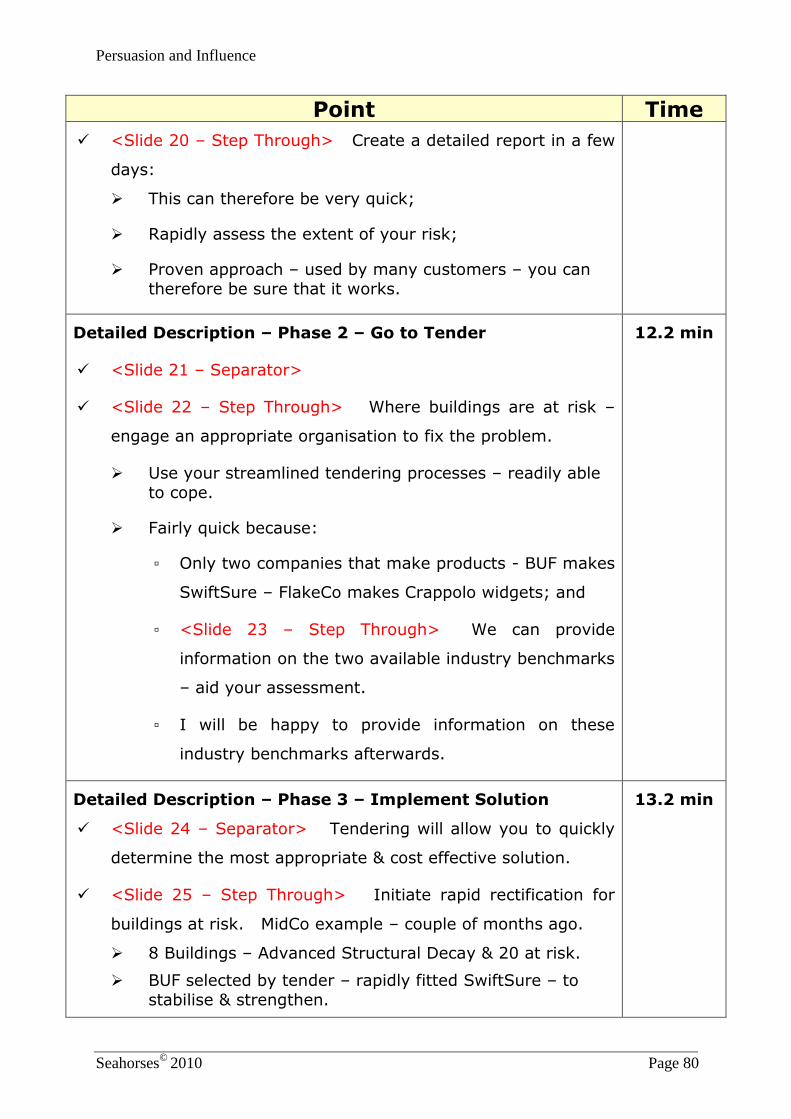
Persuasion and Influence
Seahorses©
2010 Page 80
Point Time
<Slide 20 – Step Through> Create a detailed report in a few
days:
This can therefore be very quick;
Rapidly assess the extent of your risk;
Proven approach – used by many customers – you can
therefore be sure that it works.
Detailed Description – Phase 2 – Go to Tender
<Slide 21 – Separator>
<Slide 22 – Step Through> Where buildings are at risk –
engage an appropriate organisation to fix the problem.
Use your streamlined tendering processes – readily able
to cope.
Fairly quick because:
▫ Only two companies that make products - BUF makes
SwiftSure – FlakeCo makes Crappolo widgets; and
▫ <Slide 23 – Step Through> We can provide
information on the two available industry benchmarks
– aid your assessment.
▫ I will be happy to provide information on these
industry benchmarks afterwards.
12.2 min
Detailed Description – Phase 3 – Implement Solution
<Slide 24 – Separator> Tendering will allow you to quickly
determine the most appropriate & cost effective solution.
<Slide 25 – Step Through> Initiate rapid rectification for
buildings at risk. MidCo example – couple of months ago.
8 Buildings – Advanced Structural Decay & 20 at risk.
BUF selected by tender – rapidly fitted SwiftSure – to
stabilise & strengthen.
13.2 min
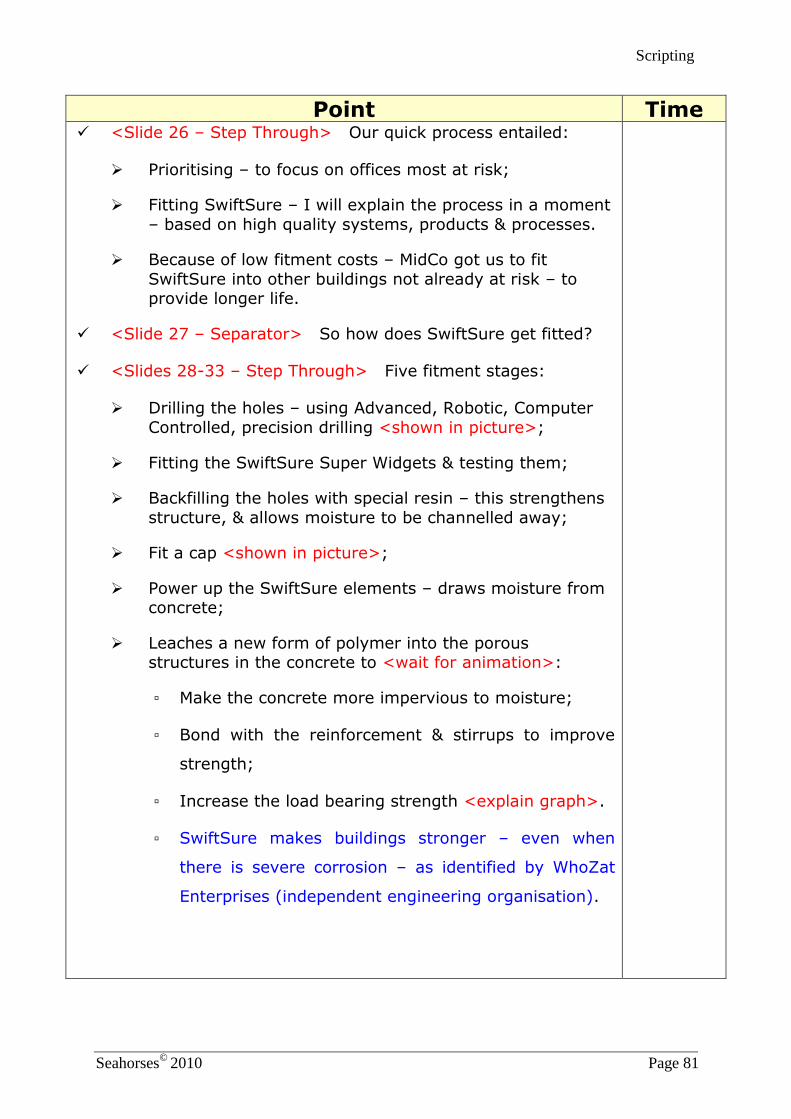
Scripting
Seahorses©
2010 Page 81
Point Time <Slide 26 – Step Through> Our quick process entailed:
Prioritising – to focus on offices most at risk;
Fitting SwiftSure – I will explain the process in a moment
– based on high quality systems, products & processes.
Because of low fitment costs – MidCo got us to fit
SwiftSure into other buildings not already at risk – to provide longer life.
<Slide 27 – Separator> So how does SwiftSure get fitted?
<Slides 28-33 – Step Through> Five fitment stages:
Drilling the holes – using Advanced, Robotic, Computer
Controlled, precision drilling <shown in picture>;
Fitting the SwiftSure Super Widgets & testing them;
Backfilling the holes with special resin – this strengthens
structure, & allows moisture to be channelled away;
Fit a cap <shown in picture>;
Power up the SwiftSure elements – draws moisture from concrete;
Leaches a new form of polymer into the porous structures in the concrete to <wait for animation>:
▫ Make the concrete more impervious to moisture;
▫ Bond with the reinforcement & stirrups to improve
strength;
▫ Increase the load bearing strength <explain graph>.
▫ SwiftSure makes buildings stronger – even when
there is severe corrosion – as identified by WhoZat
Enterprises (independent engineering organisation).
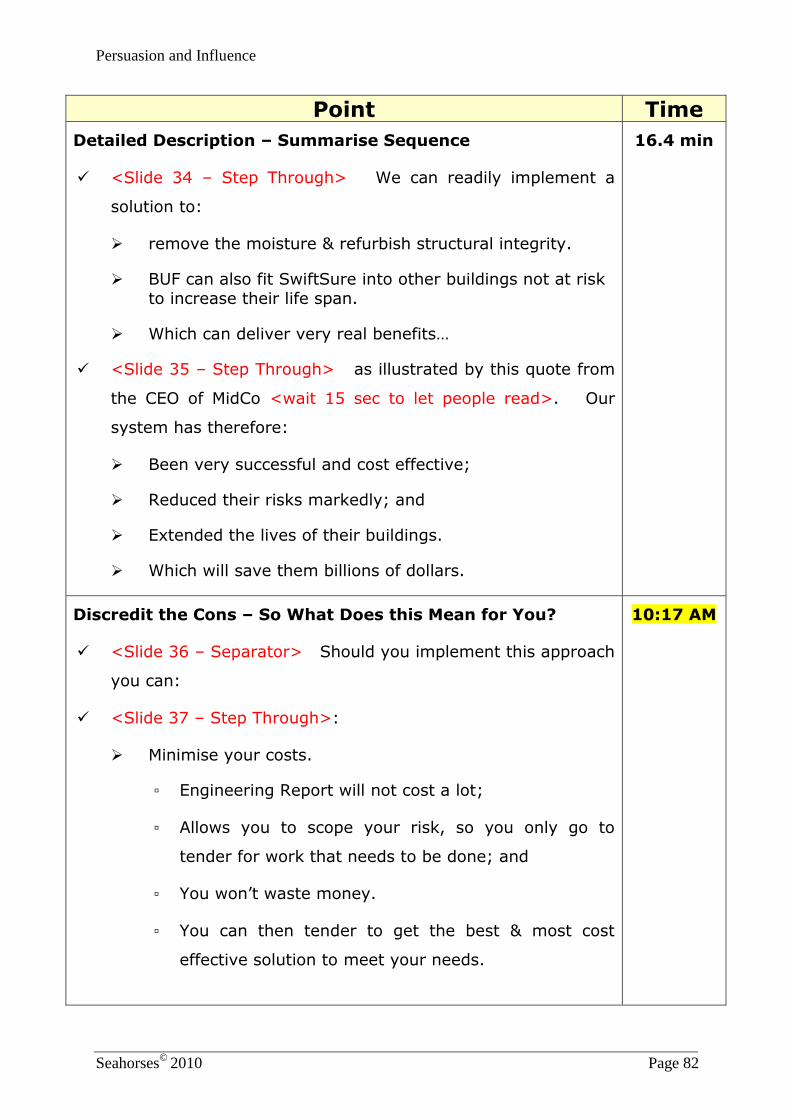
Persuasion and Influence
Seahorses©
2010 Page 82
Point Time
Detailed Description – Summarise Sequence
<Slide 34 – Step Through> We can readily implement a
solution to:
remove the moisture & refurbish structural integrity.
BUF can also fit SwiftSure into other buildings not at risk to increase their life span.
Which can deliver very real benefits…
<Slide 35 – Step Through> as illustrated by this quote from
the CEO of MidCo <wait 15 sec to let people read>. Our
system has therefore:
Been very successful and cost effective;
Reduced their risks markedly; and
Extended the lives of their buildings.
Which will save them billions of dollars.
16.4 min
Discredit the Cons – So What Does this Mean for You?
<Slide 36 – Separator> Should you implement this approach
you can:
<Slide 37 – Step Through>:
Minimise your costs.
▫ Engineering Report will not cost a lot;
▫ Allows you to scope your risk, so you only go to
tender for work that needs to be done; and
▫ You won’t waste money.
▫ You can then tender to get the best & most cost
effective solution to meet your needs.
10:17 AM
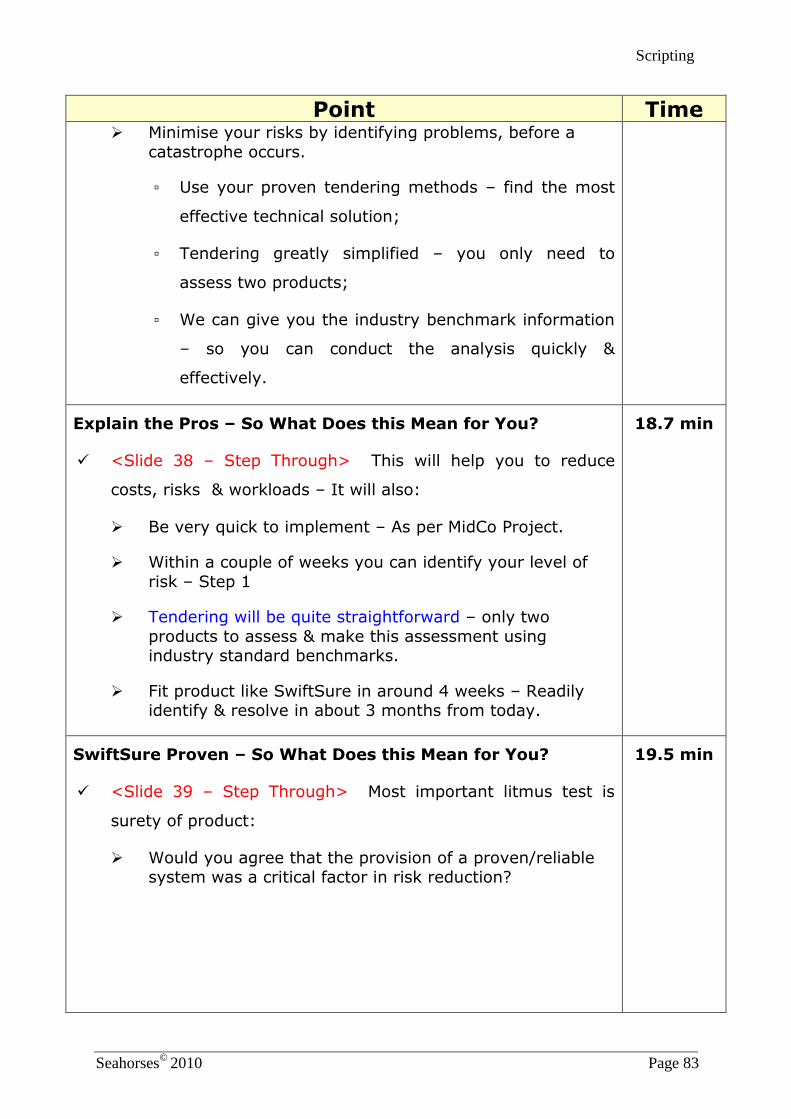
Scripting
Seahorses©
2010 Page 83
Point Time Minimise your risks by identifying problems, before a
catastrophe occurs.
▫ Use your proven tendering methods – find the most
effective technical solution;
▫ Tendering greatly simplified – you only need to
assess two products;
▫ We can give you the industry benchmark information
– so you can conduct the analysis quickly &
effectively.
Explain the Pros – So What Does this Mean for You?
<Slide 38 – Step Through> This will help you to reduce
costs, risks & workloads – It will also:
Be very quick to implement – As per MidCo Project.
Within a couple of weeks you can identify your level of
risk – Step 1
Tendering will be quite straightforward – only two
products to assess & make this assessment using industry standard benchmarks.
Fit product like SwiftSure in around 4 weeks – Readily identify & resolve in about 3 months from today.
18.7 min
SwiftSure Proven – So What Does this Mean for You?
<Slide 39 – Step Through> Most important litmus test is
surety of product:
Would you agree that the provision of a proven/reliable system was a critical factor in risk reduction?
19.5 min
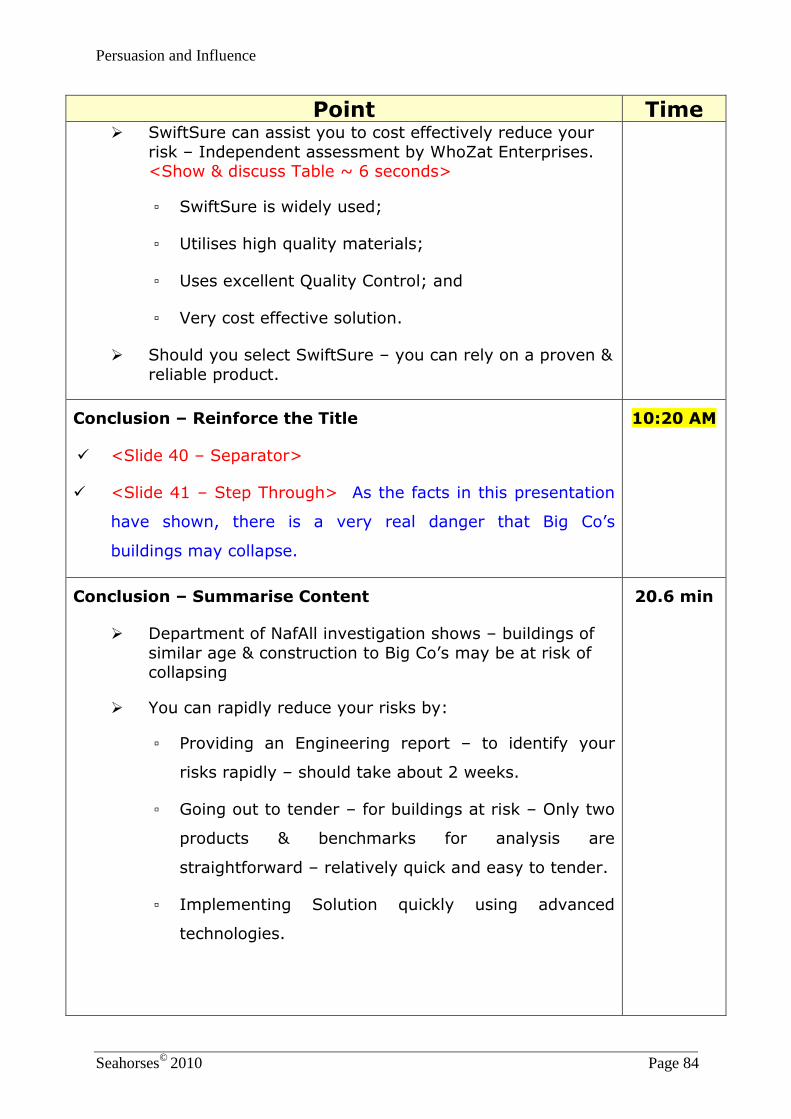
Persuasion and Influence
Seahorses©
2010 Page 84
Point Time SwiftSure can assist you to cost effectively reduce your
risk – Independent assessment by WhoZat Enterprises. <Show & discuss Table ~ 6 seconds>
▫ SwiftSure is widely used;
▫ Utilises high quality materials;
▫ Uses excellent Quality Control; and
▫ Very cost effective solution.
Should you select SwiftSure – you can rely on a proven &
reliable product.
Conclusion – Reinforce the Title
<Slide 40 – Separator>
<Slide 41 – Step Through> As the facts in this presentation
have shown, there is a very real danger that Big Co’s
buildings may collapse.
10:20 AM
Conclusion – Summarise Content
Department of NafAll investigation shows – buildings of
similar age & construction to Big Co’s may be at risk of collapsing
You can rapidly reduce your risks by:
▫ Providing an Engineering report – to identify your
risks rapidly – should take about 2 weeks.
▫ Going out to tender – for buildings at risk – Only two
products & benchmarks for analysis are
straightforward – relatively quick and easy to tender.
▫ Implementing Solution quickly using advanced
technologies.
20.6 min
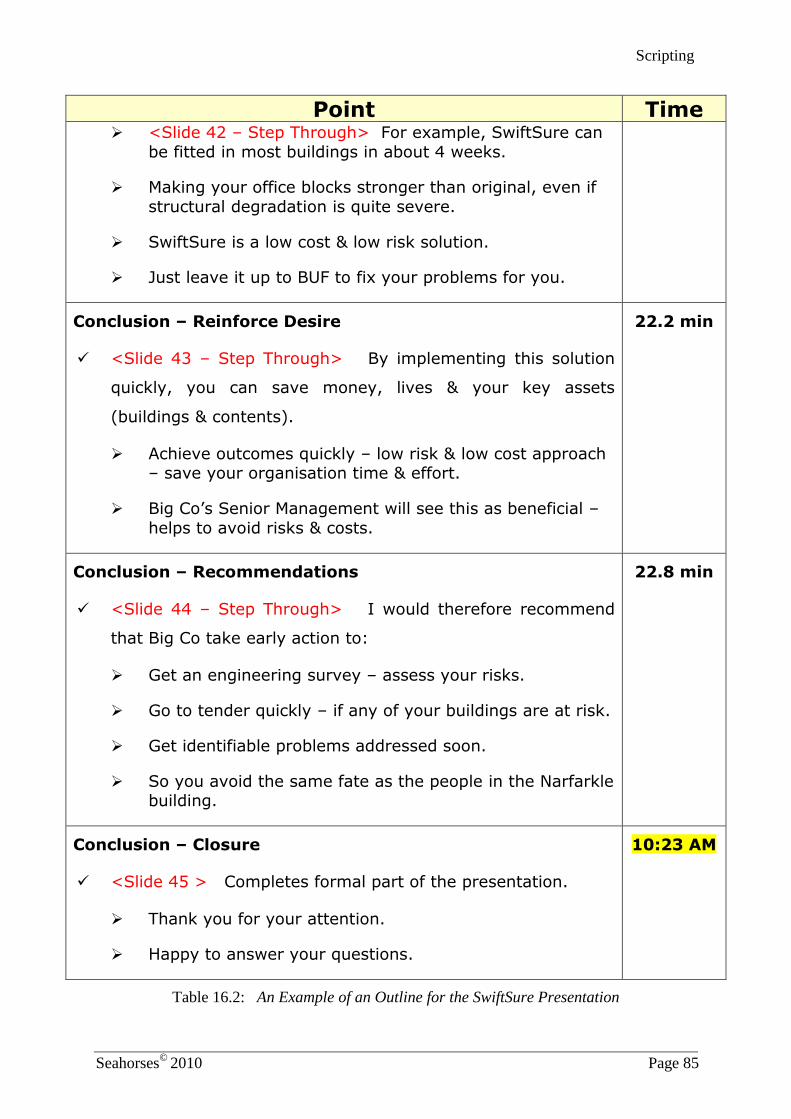
Scripting
Seahorses©
2010 Page 85
Point Time <Slide 42 – Step Through> For example, SwiftSure can
be fitted in most buildings in about 4 weeks.
Making your office blocks stronger than original, even if
structural degradation is quite severe.
SwiftSure is a low cost & low risk solution.
Just leave it up to BUF to fix your problems for you.
Conclusion – Reinforce Desire
<Slide 43 – Step Through> By implementing this solution
quickly, you can save money, lives & your key assets
(buildings & contents).
Achieve outcomes quickly – low risk & low cost approach – save your organisation time & effort.
Big Co’s Senior Management will see this as beneficial –
helps to avoid risks & costs.
22.2 min
Conclusion – Recommendations
<Slide 44 – Step Through> I would therefore recommend
that Big Co take early action to:
Get an engineering survey – assess your risks.
Go to tender quickly – if any of your buildings are at risk.
Get identifiable problems addressed soon.
So you avoid the same fate as the people in the Narfarkle building.
22.8 min
Conclusion – Closure
<Slide 45 > Completes formal part of the presentation.
Thank you for your attention.
Happy to answer your questions.
10:23 AM
Table 16.2: An Example of an Outline for the SwiftSure Presentation
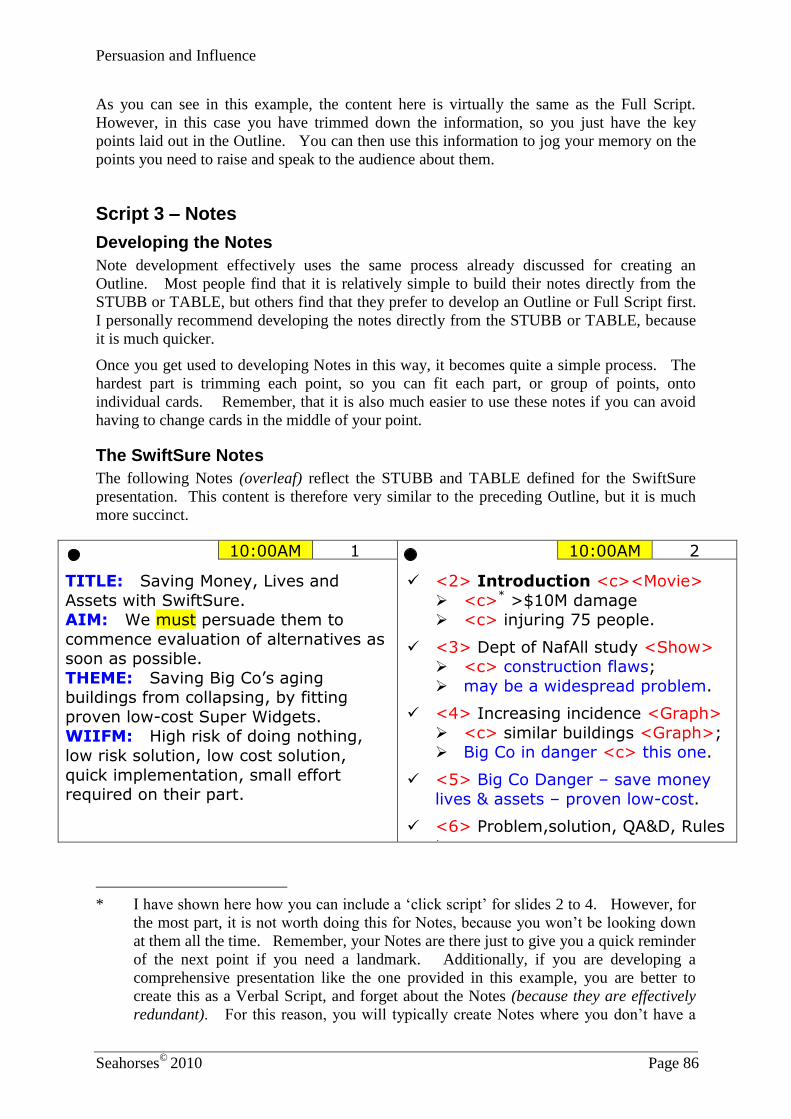
Persuasion and Influence
Seahorses©
2010 Page 86
As you can see in this example, the content here is virtually the same as the Full Script.
However, in this case you have trimmed down the information, so you just have the key
points laid out in the Outline. You can then use this information to jog your memory on the
points you need to raise and speak to the audience about them.
Script 3 – Notes
Developing the Notes
Note development effectively uses the same process already discussed for creating an
Outline. Most people find that it is relatively simple to build their notes directly from the
STUBB or TABLE, but others find that they prefer to develop an Outline or Full Script first.
I personally recommend developing the notes directly from the STUBB or TABLE, because
it is much quicker.
Once you get used to developing Notes in this way, it becomes quite a simple process. The
hardest part is trimming each point, so you can fit each part, or group of points, onto
individual cards. Remember, that it is also much easier to use these notes if you can avoid
having to change cards in the middle of your point.
The SwiftSure Notes
The following Notes (overleaf) reflect the STUBB and TABLE defined for the SwiftSure
presentation. This content is therefore very similar to the preceding Outline, but it is much
more succinct.
10:00AM 1 10:00AM 2
TITLE: Saving Money, Lives and
Assets with SwiftSure. AIM: We must persuade them to
commence evaluation of alternatives as soon as possible.
THEME: Saving Big Co’s aging buildings from collapsing, by fitting
proven low-cost Super Widgets. WIIFM: High risk of doing nothing,
low risk solution, low cost solution,
quick implementation, small effort required on their part.
<2> Introduction <c><Movie>
<c>* >$10M damage <c> injuring 75 people.
<3> Dept of NafAll study <Show> <c> construction flaws;
may be a widespread problem.
<4> Increasing incidence <Graph>
<c> similar buildings <Graph>; Big Co in danger <c> this one.
<5> Big Co Danger – save money
lives & assets – proven low-cost.
<6> Problem,solution, QA&D, Rules
* I have shown here how you can include a ‘click script’ for slides 2 to 4. However, for
the most part, it is not worth doing this for Notes, because you won’t be looking down
at them all the time. Remember, your Notes are there just to give you a quick reminder
of the next point if you need a landmark. Additionally, if you are developing a
comprehensive presentation like the one provided in this example, you are better to
create this as a Verbal Script, and forget about the Notes (because they are effectively
redundant). For this reason, you will typically create Notes where you don’t have a
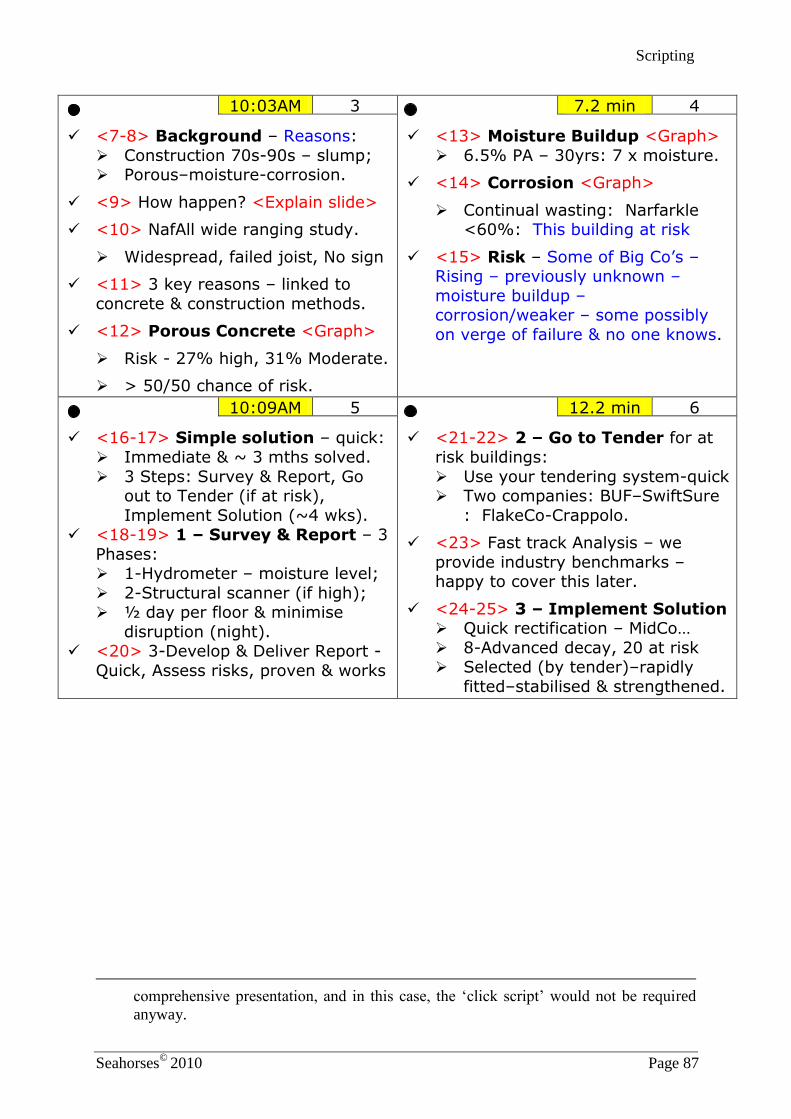
Scripting
Seahorses©
2010 Page 87
10:03AM 3 7.2 min 4
<7-8> Background – Reasons:
Construction 70s-90s – slump; Porous–moisture-corrosion.
<9> How happen? <Explain slide>
<10> NafAll wide ranging study.
Widespread, failed joist, No sign
<11> 3 key reasons – linked to
concrete & construction methods.
<12> Porous Concrete <Graph>
Risk - 27% high, 31% Moderate.
> 50/50 chance of risk.
<13> Moisture Buildup <Graph>
6.5% PA – 30yrs: 7 x moisture.
<14> Corrosion <Graph>
Continual wasting: Narfarkle <60%: This building at risk
<15> Risk – Some of Big Co’s – Rising – previously unknown –
moisture buildup – corrosion/weaker – some possibly
on verge of failure & no one knows.
10:09AM 5 12.2 min 6
<16-17> Simple solution – quick:
Immediate & ~ 3 mths solved.
3 Steps: Survey & Report, Go out to Tender (if at risk),
Implement Solution (~4 wks). <18-19> 1 – Survey & Report – 3
Phases: 1-Hydrometer – moisture level;
2-Structural scanner (if high); ½ day per floor & minimise
disruption (night). <20> 3-Develop & Deliver Report -
Quick, Assess risks, proven & works
<21-22> 2 – Go to Tender for at
risk buildings:
Use your tendering system-quick Two companies: BUF–SwiftSure
: FlakeCo-Crappolo.
<23> Fast track Analysis – we
provide industry benchmarks – happy to cover this later.
<24-25> 3 – Implement Solution Quick rectification – MidCo…
8-Advanced decay, 20 at risk Selected (by tender)–rapidly
fitted–stabilised & strengthened.
comprehensive presentation, and in this case, the ‘click script’ would not be required
anyway.
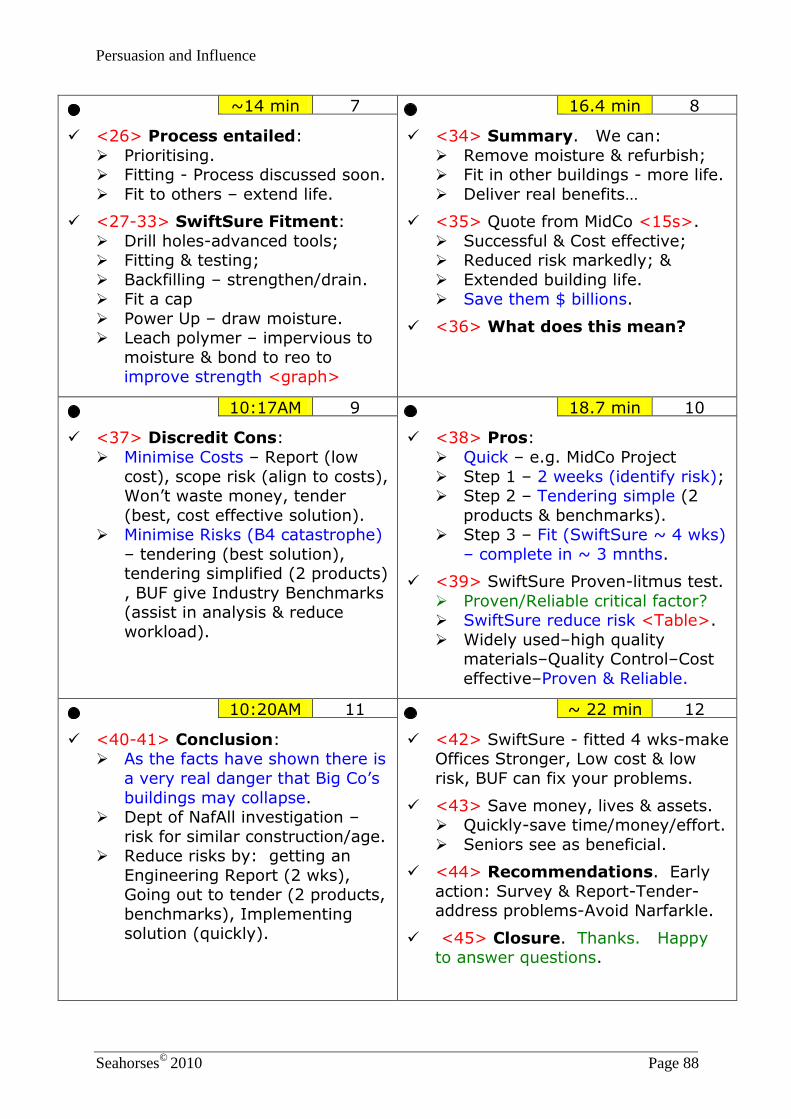
Persuasion and Influence
Seahorses©
2010 Page 88
~14 min 7 16.4 min 8
<26> Process entailed:
Prioritising. Fitting - Process discussed soon.
Fit to others – extend life.
<27-33> SwiftSure Fitment:
Drill holes-advanced tools; Fitting & testing;
Backfilling – strengthen/drain. Fit a cap
Power Up – draw moisture. Leach polymer – impervious to
moisture & bond to reo to improve strength <graph>
<34> Summary. We can:
Remove moisture & refurbish; Fit in other buildings - more life.
Deliver real benefits…
<35> Quote from MidCo <15s>.
Successful & Cost effective; Reduced risk markedly; &
Extended building life. Save them $ billions.
<36> What does this mean?
10:17AM 9 18.7 min 10
<37> Discredit Cons:
Minimise Costs – Report (low
cost), scope risk (align to costs), Won’t waste money, tender
(best, cost effective solution). Minimise Risks (B4 catastrophe)
– tendering (best solution), tendering simplified (2 products)
, BUF give Industry Benchmarks (assist in analysis & reduce
workload).
<38> Pros:
Quick – e.g. MidCo Project
Step 1 – 2 weeks (identify risk); Step 2 – Tendering simple (2
products & benchmarks). Step 3 – Fit (SwiftSure ~ 4 wks)
– complete in ~ 3 mnths.
<39> SwiftSure Proven-litmus test.
Proven/Reliable critical factor? SwiftSure reduce risk <Table>.
Widely used–high quality materials–Quality Control–Cost
effective–Proven & Reliable.
10:20AM 11 ~ 22 min 12
<40-41> Conclusion: As the facts have shown there is
a very real danger that Big Co’s
buildings may collapse. Dept of NafAll investigation –
risk for similar construction/age. Reduce risks by: getting an
Engineering Report (2 wks), Going out to tender (2 products,
benchmarks), Implementing solution (quickly).
<42> SwiftSure - fitted 4 wks-make Offices Stronger, Low cost & low
risk, BUF can fix your problems.
<43> Save money, lives & assets. Quickly-save time/money/effort.
Seniors see as beneficial.
<44> Recommendations. Early
action: Survey & Report-Tender- address problems-Avoid Narfarkle.
<45> Closure. Thanks. Happy to answer questions.
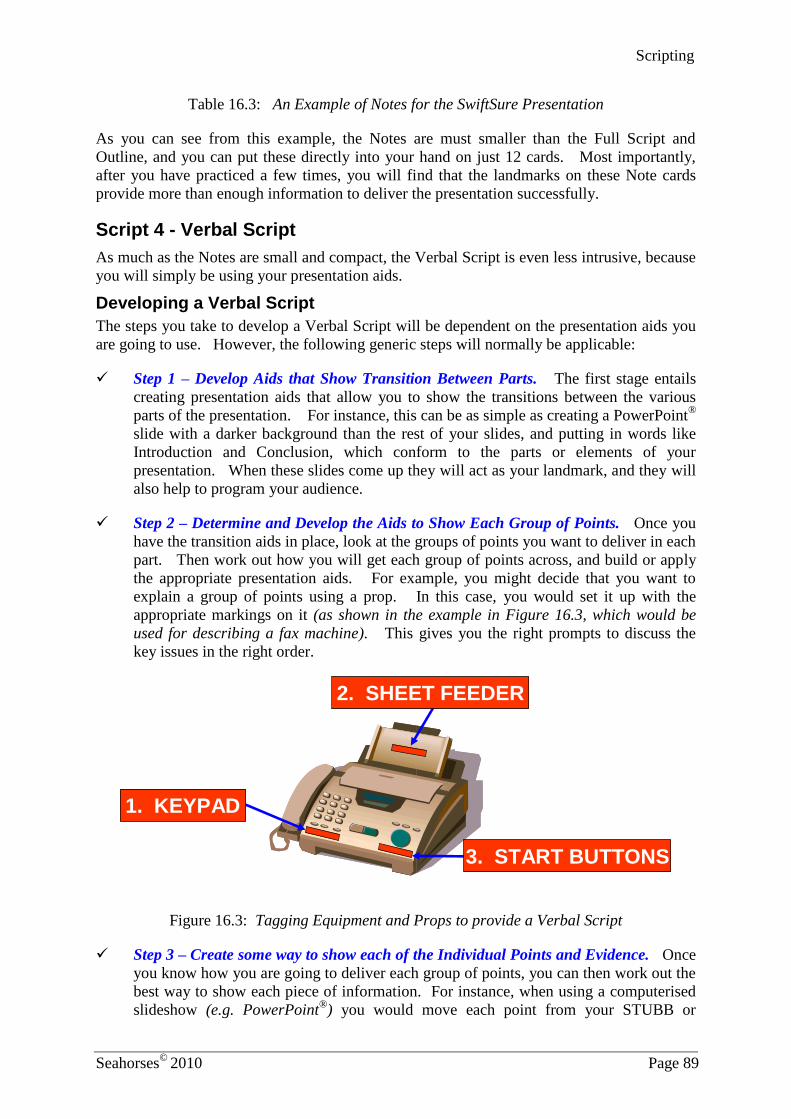
Scripting
Seahorses©
2010 Page 89
Table 16.3: An Example of Notes for the SwiftSure Presentation
As you can see from this example, the Notes are must smaller than the Full Script and
Outline, and you can put these directly into your hand on just 12 cards. Most importantly,
after you have practiced a few times, you will find that the landmarks on these Note cards
provide more than enough information to deliver the presentation successfully.
Script 4 - Verbal Script
As much as the Notes are small and compact, the Verbal Script is even less intrusive, because
you will simply be using your presentation aids.
Developing a Verbal Script
The steps you take to develop a Verbal Script will be dependent on the presentation aids you
are going to use. However, the following generic steps will normally be applicable:
Step 1 – Develop Aids that Show Transition Between Parts. The first stage entails
creating presentation aids that allow you to show the transitions between the various
parts of the presentation. For instance, this can be as simple as creating a PowerPoint®
slide with a darker background than the rest of your slides, and putting in words like
Introduction and Conclusion, which conform to the parts or elements of your
presentation. When these slides come up they will act as your landmark, and they will
also help to program your audience.
Step 2 – Determine and Develop the Aids to Show Each Group of Points. Once you
have the transition aids in place, look at the groups of points you want to deliver in each
part. Then work out how you will get each group of points across, and build or apply
the appropriate presentation aids. For example, you might decide that you want to
explain a group of points using a prop. In this case, you would set it up with the
appropriate markings on it (as shown in the example in Figure 16.3, which would be
used for describing a fax machine). This gives you the right prompts to discuss the
key issues in the right order.
1. KEYPAD
2. SHEET FEEDER
3. START BUTTONS
Figure 16.3: Tagging Equipment and Props to provide a Verbal Script
Step 3 – Create some way to show each of the Individual Points and Evidence. Once
you know how you are going to deliver each group of points, you can then work out the
best way to show each piece of information. For instance, when using a computerised
slideshow (e.g. PowerPoint®
) you would move each point from your STUBB or
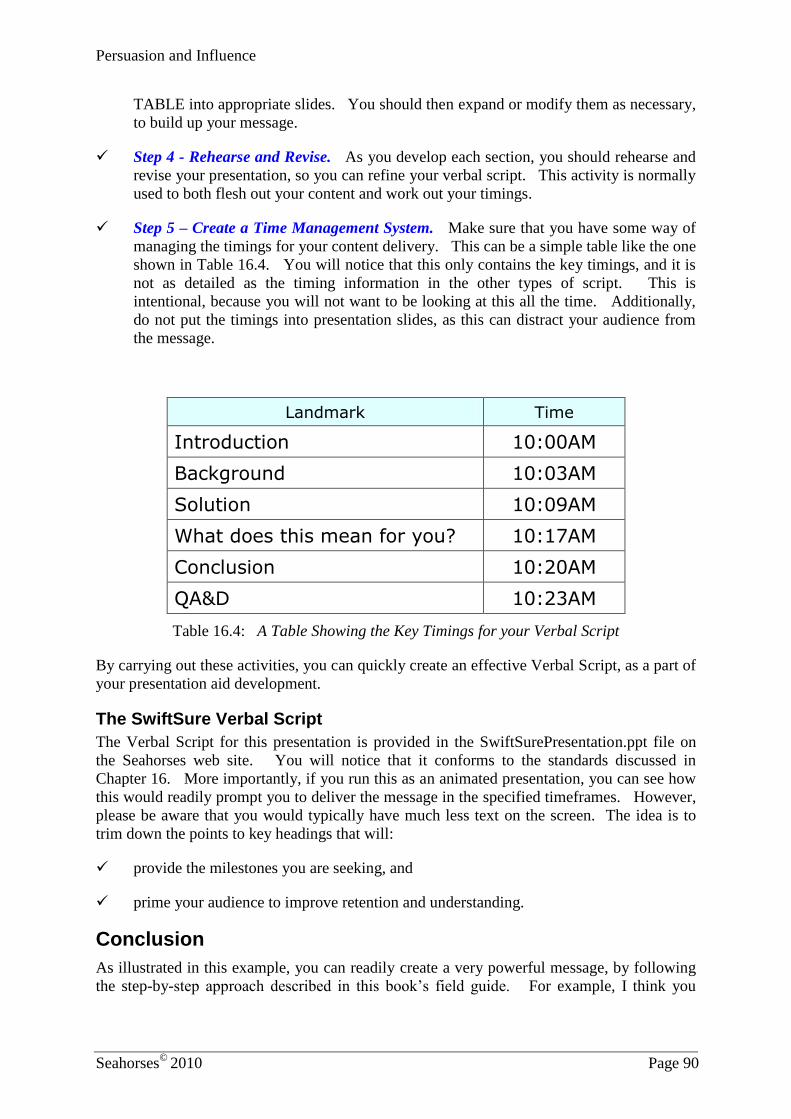
Persuasion and Influence
Seahorses©
2010 Page 90
TABLE into appropriate slides. You should then expand or modify them as necessary,
to build up your message.
Step 4 - Rehearse and Revise. As you develop each section, you should rehearse and
revise your presentation, so you can refine your verbal script. This activity is normally
used to both flesh out your content and work out your timings.
Step 5 – Create a Time Management System. Make sure that you have some way of
managing the timings for your content delivery. This can be a simple table like the one
shown in Table 16.4. You will notice that this only contains the key timings, and it is
not as detailed as the timing information in the other types of script. This is
intentional, because you will not want to be looking at this all the time. Additionally,
do not put the timings into presentation slides, as this can distract your audience from
the message.
Landmark Time
Introduction 10:00AM
Background 10:03AM
Solution 10:09AM
What does this mean for you? 10:17AM
Conclusion 10:20AM
QA&D 10:23AM
Table 16.4: A Table Showing the Key Timings for your Verbal Script
By carrying out these activities, you can quickly create an effective Verbal Script, as a part of
your presentation aid development.
The SwiftSure Verbal Script
The Verbal Script for this presentation is provided in the SwiftSurePresentation.ppt file on
the Seahorses web site. You will notice that it conforms to the standards discussed in
Chapter 16. More importantly, if you run this as an animated presentation, you can see how
this would readily prompt you to deliver the message in the specified timeframes. However,
please be aware that you would typically have much less text on the screen. The idea is to
trim down the points to key headings that will:
provide the milestones you are seeking, and
prime your audience to improve retention and understanding.
Conclusion
As illustrated in this example, you can readily create a very powerful message, by following
the step-by-step approach described in this book’s field guide. For example, I think you
Scripting
Seahorses©
2010 Page 91
would agree that Big Co is very likely to be persuaded by this presentation. Just as
importantly, by using this approach, you can:
develop the message much more quickly, because this methodology takes away the
guesswork; and
avoid wasting time developing content that cannot be delivered in the available
timeframe.
Finally, remember that the techniques covered in this document are more verbose than
you would typically need to implement to develop your message. I have provided the
extra detail to flesh out the thought processes, so you will be able to apply this technique
more effectively.
END NOTE
1. These figures have been developed from observations taken over many years. They
give a reasonable guide and you should take them into account if you are planning to
use Supportive techniques.