Embed Size (px)
Citation preview

at SciVerse ScienceDirect
Journal of Environmental Management 95 (2012) 114e123
Contents lists available
Journal of Environmental Management
journal homepage: www.elsevier .com/locate/ jenvman
Permeability measurement and scan imaging to assess clogging of perviousconcrete pavements in parking lots
Masoud Kayhanian a,*, Dane Anderson a,1, John T. Harvey b,2, David Jones b,3, Balasingam Muhunthan c,4
aDepartment of Civil and Environmental Engineering, University of California, Davis, CA 95616, USAbUniversity of California Pavement Research Center, Department of Civil and Environmental Engineering, University of California, Davis, CA 95616, USAcDepartment of Civil and Environmental Engineering, Washington State University, Pullman, WA 99164-2910, USA
a r t i c l e i n f o
Article history:Received 5 January 2011Received in revised form18 July 2011Accepted 29 September 2011Available online 13 November 2011
Keywords:Pervious concreteParking lotsPermeabilityCloggingPerformanceFine particlesCT scan
* Corresponding author. Tel.: þ1 (530) 752 8957; fE-mail addresses: [email protected] (M
gmail.com (D. Anderson), [email protected] (J.T. H(D. Jones), [email protected] (B. Muhunthan).
1 Tel.: þ1 (832) 402 0253.2 Tel.: þ1 (530) 754 6409.3 Tel.: þ1 (530) 754 4421.4 Tel.: þ1 (509) 335 3921.
0301-4797/$ e see front matter � 2011 Elsevier Ltd.doi:10.1016/j.jenvman.2011.09.021
a b s t r a c t
This paper describes a study that used permeability measurement along with physical and hydrologicalcharacteristics of 20 pervious concrete pavements in parking lots throughout California. The permeabilitywas measured at five locations: the main entrance, an area with no traffic, and three separatemeasurements within a parking space at each parking lot. Hydrological and physical site characteristicssuch as traffic flow, erosion, vegetation cover, sediments accumulation, maintenance practice, presenceof cracking, rainfall, and temperature data were also collected for each parking lot. These data were usedto perform detailed statistical analysis to determine factors influencing changes in permeability andhence assessing possible cause of clogging. In addition, seven representative core samples were obtainedfrom four different parking lots with permeability ranging from very low to very high. Porosity profilesproduced from CT scanning were used to assess the possible nature and extent of clogging.
Results showed that there is a large variation in permeability within each parking lot and betweendifferent parking lots. In general, the age of the parking lot is the predominant factor influencing thepermeability. Statistical analysis revealed that fine sediment (particles less than 38 mm) mass is also animportant influencing factor. Other influencing factors with lower significance included number of dayswith a temperature greater than 30 �C and the amount of vegetation next to the parking lot. Thecombined scanned image analysis and porosity profile of the cores showed that most clogging occursnear the surface of the pavement. While lower porosity generally appeared to be limited to the upper25 mm, in some core samples evidence of lower porosity was found up to 100 mm below the surface.
� 2011 Elsevier Ltd. All rights reserved.
1. Introduction
An alternative to managing stormwater runoff from roadways islow impact development (LID). Among hydromodificationmethods, the use of fully permeable pavements inwhich all surfacewater passes through the pavement surface and is kept in thepavement until it infiltrates the subgrade, evaporates or flows outthrough a pipe, is gaining popularity as an approach to reduce thestormwater flow volume and pollutant discharge loading (USEPA,
ax: þ1 (530) 752 7872.. Kayhanian), danederson@arvey), [email protected]
All rights reserved.
1999; Dierkes et al., 2002; Ferguson, 2005). Both porous asphaltand pervious concrete pavements (the names generally preferredby the asphalt and concrete pavement trade organizations,respectively) have been constructed in the past ten years. Most ofthese pavements were constructed in parking lots and their use forroads under heavy load and heavy traffic has been limited.
Runoff containing a large amount of suspended particles maycause clogging of pore space during their life time (Nielsen, 2007;Siriwardene et al., 2007; Yong et al., 2008). Clogging may alsooccur due to the inorganic and organic particles from traffic activ-ities and localized vegetation or dust that are often blown onto, orforced into the roadway (Siriwardene et al., 2007). These particlesand solid materials are pushed into the pores of the permeablepavement by the weight of the passing vehicles which may alsocrush them producing a finer size distribution; sometimes thedebris is brought into the pores by flowing water from a stormevent. It is possible that the vehicle weight may pushmaterials intothe pavement at the leading edge of the tire, and the back side of
M. Kayhanian et al. / Journal of Environmental Management 95 (2012) 114e123 115
the tire may create a suction to remove some of the solids. Undercertain conditions and depending on the type and size of solids,once in the pores, the debris may become embedded and begin toaccumulate, clogging the pores. When a significant percentage ofthe pores in the permeable pavement are clogged, the permeabilityof the pavement is reduced and water begins to pool on thepavement surface. This defeats the purpose of permeable pave-ments and the clogging materials must be removed to restore thepermeability (Cooley, 1999).
Most previous studies of porous pavement clogging were per-formed under laboratory condition or the field investigation waslimited to few parking lots. At present, the combined use of fieldpermeability, statistical evaluation and CT scanning image analysisfor the investigation of clogging is not widely encountered in theliterature. This study was undertaken with the following specificobjectives:
(i) Measure the permeability of pavement surfaces at fivedifferent locations within each parking lot for 20 perviousconcrete parking lots throughout California,
(ii) Collect data on hydrologic and physical site characteristics.(iii) Perform statistical analysis of measured permeability and site
characteristics data to determine the primary factors influ-encing permeability, and
(iv) Utilize porosity profiles developed from computed tomog-raphy (CT) scanning images to assess pavement clogging.
2. Methods
2.1. Parking lots site selection
A list of over 100 pervious concrete parking lots throughout theCalifornia was obtained. Several criteria including age, climateregion, and parking lot size were used to create a final list of 20pervious concrete parking lots for this study (Table 1). Californiahas wide variety of climate regions for pavement design, includingthree coastal regions, two mountain regions, Inland Valley, HighDesert and Desert. After grouping the parking lots, it was apparentthat more parking lots were constructed in the Inland Valleyclimate region, making it impossible to achieve uniform age range
Table 1Selected permeable concrete parking lots by their location, climate region, age, andsize.
Site ID Location Climate region Dateconstructed
Age (yr)a Size (m2)
PL1 Auburn Inland valley Jul-08 0.67 418PL2 Red Bluff Inland valley Mar-08 1.0 279PL3 Fresno Inland valley Apr-06 3.0 557PL4 Manteca Inland valley Oct-05 3.0 4645PL5 Davis Inland valley Sep-04 4.0 4088PL6 Vacaville Inland valley Sep-04 4.0 2787PL7 Morgan Hill Inland valley Jun-04 4.5 557PL8 Elk Grove Inland valley Dec-06 2.0 1858PL9 Elk Grove Inland valley Aug-06 2.5 372PL10 Fair Oaks Inland valley Aug-02 6.5 2323PL11 Fair Oaks Inland valley Jul-02 6.5 2323PL12 Fair Oaks Inland valley Jan-01 8.0 1524PL13 Fort Bragg North coast Apr-08 0.92 492PL14 Eureka North coast Sep-07 1.5 186PL15 Palo Alto Central coast Jan-09 0.17 465PL16 Santa Cruz Central coast Aug-07 1.58 465PL17 Menlo Park Central coast Nov-05 3.0 279PL18 Oxnard South coast Jan-06 3.0 4645PL19 Petaluma Low mountain May-05 3.5 743PL20 San Bernardino South mountain May-05 3.5 111
a Age of pervious concrete parking lot when permeability was measured.
within other climate regions such as the mountains. In addition,as expected, the use of pervious parking lots in the low rainfalldesert climate regions was entirely absent. To ensure adequatecoverage of the different geographic and climatic regions of thestate, 37 parking lots were initially selected. The final list wasprepared by balancing size, rainfall and temperature characteristicsbetween them.
2.2. Field permeability measurement
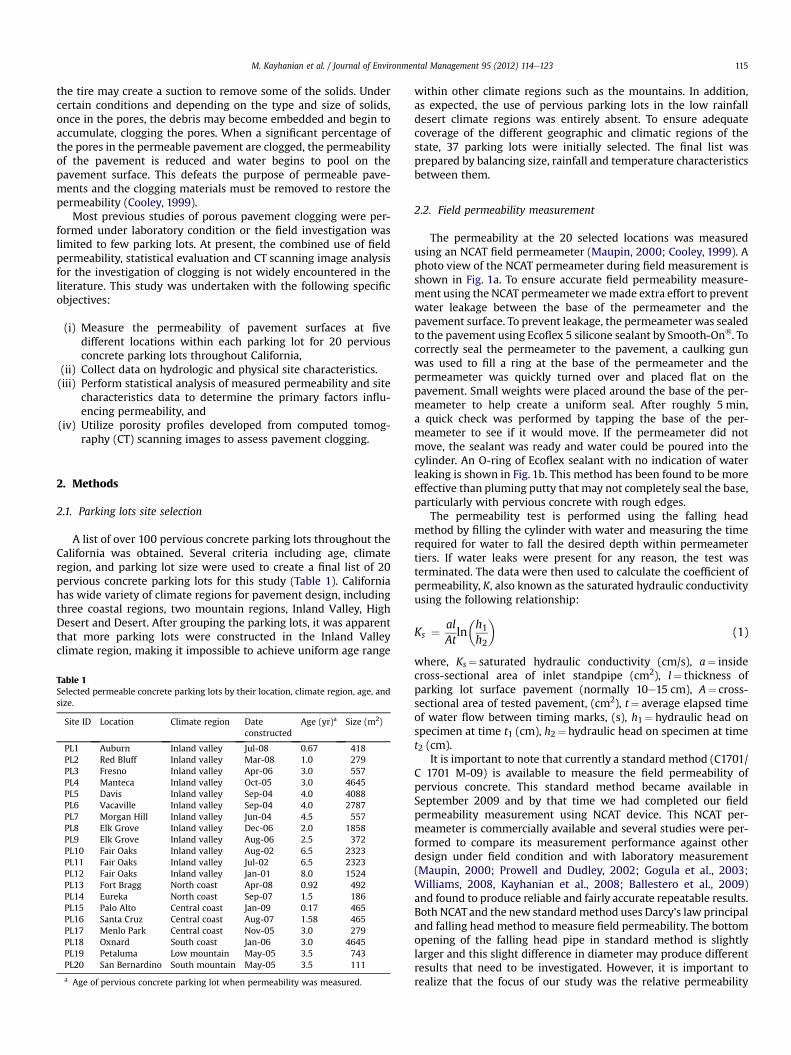
The permeability at the 20 selected locations was measuredusing an NCAT field permeameter (Maupin, 2000; Cooley, 1999). Aphoto view of the NCAT permeameter during field measurement isshown in Fig. 1a. To ensure accurate field permeability measure-ment using the NCAT permeameter wemade extra effort to preventwater leakage between the base of the permeameter and thepavement surface. To prevent leakage, the permeameter was sealedto the pavement using Ecoflex 5 silicone sealant by Smooth-On�. Tocorrectly seal the permeameter to the pavement, a caulking gunwas used to fill a ring at the base of the permeameter and thepermeameter was quickly turned over and placed flat on thepavement. Small weights were placed around the base of the per-meameter to help create a uniform seal. After roughly 5 min,a quick check was performed by tapping the base of the per-meameter to see if it would move. If the permeameter did notmove, the sealant was ready and water could be poured into thecylinder. An O-ring of Ecoflex sealant with no indication of waterleaking is shown in Fig. 1b. This method has been found to be moreeffective than pluming putty that may not completely seal the base,particularly with pervious concrete with rough edges.
The permeability test is performed using the falling headmethod by filling the cylinder with water and measuring the timerequired for water to fall the desired depth within permeametertiers. If water leaks were present for any reason, the test wasterminated. The data were then used to calculate the coefficient ofpermeability, K, also known as the saturated hydraulic conductivityusing the following relationship:
Ks ¼ alAtln�h1h2
�(1)
where, Ks¼ saturated hydraulic conductivity (cm/s), a¼ insidecross-sectional area of inlet standpipe (cm2), l¼ thickness ofparking lot surface pavement (normally 10e15 cm), A¼ cross-sectional area of tested pavement, (cm2), t¼ average elapsed timeof water flow between timing marks, (s), h1¼ hydraulic head onspecimen at time t1 (cm), h2¼ hydraulic head on specimen at timet2 (cm).
It is important to note that currently a standard method (C1701/C 1701 M-09) is available to measure the field permeability ofpervious concrete. This standard method became available inSeptember 2009 and by that time we had completed our fieldpermeability measurement using NCAT device. This NCAT per-meameter is commercially available and several studies were per-formed to compare its measurement performance against otherdesign under field condition and with laboratory measurement(Maupin, 2000; Prowell and Dudley, 2002; Gogula et al., 2003;Williams, 2008, Kayhanian et al., 2008; Ballestero et al., 2009)and found to produce reliable and fairly accurate repeatable results.Both NCATand the new standardmethod uses Darcy’s law principaland falling head method to measure field permeability. The bottomopening of the falling head pipe in standard method is slightlylarger and this slight difference in diameter may produce differentresults that need to be investigated. However, it is important torealize that the focus of our study was the relative permeability
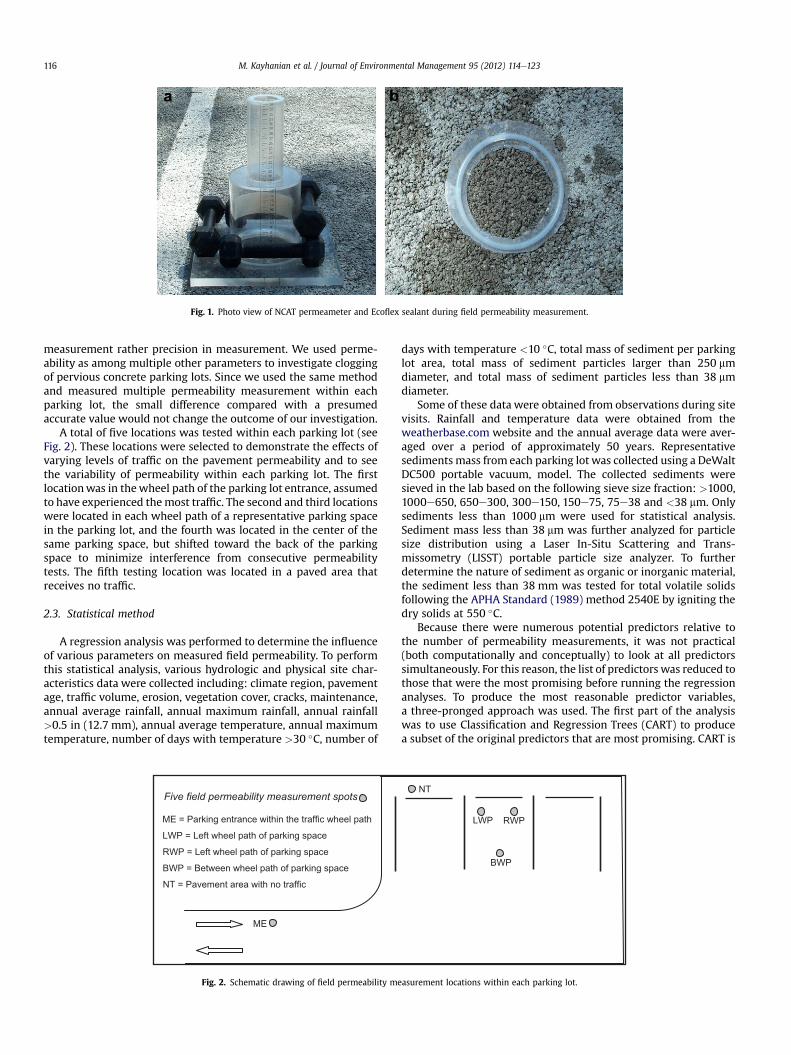
Fig. 1. Photo view of NCAT permeameter and Ecoflex sealant during field permeability measurement.
M. Kayhanian et al. / Journal of Environmental Management 95 (2012) 114e123116
measurement rather precision in measurement. We used perme-ability as among multiple other parameters to investigate cloggingof pervious concrete parking lots. Since we used the same methodand measured multiple permeability measurement within eachparking lot, the small difference compared with a presumedaccurate value would not change the outcome of our investigation.
A total of five locations was tested within each parking lot (seeFig. 2). These locations were selected to demonstrate the effects ofvarying levels of traffic on the pavement permeability and to seethe variability of permeability within each parking lot. The firstlocationwas in thewheel path of the parking lot entrance, assumedto have experienced themost traffic. The second and third locationswere located in each wheel path of a representative parking spacein the parking lot, and the fourth was located in the center of thesame parking space, but shifted toward the back of the parkingspace to minimize interference from consecutive permeabilitytests. The fifth testing location was located in a paved area thatreceives no traffic.
2.3. Statistical method
A regression analysis was performed to determine the influenceof various parameters on measured field permeability. To performthis statistical analysis, various hydrologic and physical site char-acteristics data were collected including: climate region, pavementage, traffic volume, erosion, vegetation cover, cracks, maintenance,annual average rainfall, annual maximum rainfall, annual rainfall>0.5 in (12.7 mm), annual average temperature, annual maximumtemperature, number of days with temperature >30 �C, number of
Five field permeability measurement spots
ME = Parking entrance within the traffic wheel path
LWP = Left wheel path of parking space
RWP = Left wheel path of parking space
BWP = Between wheel path of parking space
NT = Pavement area with no traffic
ME
Fig. 2. Schematic drawing of field permeability me
days with temperature <10 �C, total mass of sediment per parkinglot area, total mass of sediment particles larger than 250 mmdiameter, and total mass of sediment particles less than 38 mmdiameter.
Some of these data were obtained from observations during sitevisits. Rainfall and temperature data were obtained from theweatherbase.com website and the annual average data were aver-aged over a period of approximately 50 years. Representativesediments mass from each parking lot was collected using a DeWaltDC500 portable vacuum, model. The collected sediments weresieved in the lab based on the following sieve size fraction: >1000,1000e650, 650e300, 300e150, 150e75, 75e38 and <38 mm. Onlysediments less than 1000 mm were used for statistical analysis.Sediment mass less than 38 mm was further analyzed for particlesize distribution using a Laser In-Situ Scattering and Trans-missometry (LISST) portable particle size analyzer. To furtherdetermine the nature of sediment as organic or inorganic material,the sediment less than 38 mm was tested for total volatile solidsfollowing the APHA Standard (1989) method 2540E by igniting thedry solids at 550 �C.
Because there were numerous potential predictors relative tothe number of permeability measurements, it was not practical(both computationally and conceptually) to look at all predictorssimultaneously. For this reason, the list of predictors was reduced tothose that were the most promising before running the regressionanalyses. To produce the most reasonable predictor variables,a three-pronged approach was used. The first part of the analysiswas to use Classification and Regression Trees (CART) to producea subset of the original predictors that are most promising. CART is
NT
BWP
LWP RWP
asurement locations within each parking lot.

M. Kayhanian et al. / Journal of Environmental Management 95 (2012) 114e123 117
a model-building method that searches recursively for predictorsand threshold values that separate responses in different ranges.For example, at the first step of a regression tree, the algorithmlooks for a single predictor and cutoff value that best separatesbetween the largest and the smallest responses.
With CART, the selected variables are considered potentiallyimportant and promising for use in the regression analysis. Thesecond part of the analysis consisted of performing a standard(stepwise) regression analysis to identify a second subset ofpredictors from the ones obtained from CART that are promising aslinear predictors of the response. An important part of this analysiswas to check the residual errors to validate the model assumptions,that the errors are normally distributed with a constant residualvariance. If not, then the dependent variable was transformed, and/or outliers were dealt with, by Winsorizing the data (a techniquefor handling or adjusting those extreme observations withoutdeleting them). The third part of the analysis included checking theassumption that the outcome measurements are linear in thepredictors by running a generalized additive model (GAM). This isa method that (typically) uses spline methods having a relationshipbetween a predictor and the outcome, using a model of the form:
Y ¼ f1ðX1Þ þ f2ðX2Þ þ // þ ε (2)
If the fitted spline functions f1 are essentially linear, then thestepwise linear model is one that can be defended as a good choice.If not, the models will need to incorporate the nonlinearity of theresponse into the predictors. CART models were calculated usingthe statistical package R. All other analyses were done using SASsoftware version 9.2 (Schlotzhauer and Littell, 1997).
2.4. Pavement coring procedure
The purpose of pavement coring was to obtain field samples forfull depth CT scanning. Core samples were made using a portableair-cooled coring machine with a 102 mm (4 inch) inner-diameterdrill bit. Air-cooled coring was used to eliminate the possibleclogging of the cores with water/sediment slurry associated withwater cooled coring. To further reduce the possibility of cooling airblowing drill bit and coring residue through the voids in thesample, a non permeable paper patch was glued to the pavementsurface over the cored area so that the cooling air could not passthrough the cored sample. For coring, four pervious concreteparking lots were selected based on their age and the averagepermeability ranging from low, medium, high, and very high.Generally, two representative core samples (except PL4) were ob-tained from four parking lots. The core samples were collected fromthe same areas where permeability was measured. A summarydescription of the seven core samples and related information suchas permeability, age, and sediment mass is summarized in Table 2.
Table 2Description of seven core samples and pertinent parking lot characteristics.
Core sample IDa Description of core sample Pert
K cm
PL2-1 First core sample from parking lot 2 0PL2-2 Duplicate core sample from parking lot 2 0PL4-1 Single core sample from parking Lot 4 0PL6-2 First core sample from parking lot 6 0.0PL6-3 Duplicate core sample from parking lot 6 0.0PL12-1 First core sample from parking lot 12 0.00PL12-3 Duplicate core sample from parking lot 12 0.00
a For parking lot geographic location refer to Table 1.
2.5. CT Scanning image analysis
Each core sample was scanned to produce a porosity profileincluding the entire core depth. The overall processes involvedwithX-ray CT scanning are shown in Fig. 3. The X-ray CT scan setupinvolves two X-ray sources that are capable of generating a 420 keVand 225 keV voltages respectively. The 420 keV source is used forrelatively bigger samples and the 225 keV is used to attainenhanced resolution and is best suited for smaller samples. TheseX-ray sources are networked to a central work station, a processingplatform that consists of four parallel computing processors andsoftware that control and execute the scanning process.
CT scanning of core samples was performed at the WashingtonState University High-Resolution X-Ray Computed Tomography(WAX-CT) Laboratory. Samples were initiatedwith the FlashCT DAQprogram which outputs raw data, as header files. The header filesare processed with a program called FlashCT DPS which givesa reconstructed image of the scanned slices. The reconstructedimages of the slices are converted into a 3-Dimensional image witha third software called FlashCT VIZ. Finally, the processed image isanalyzed with MFC software to get the XY, XZ and YZ-sliced imageformats through image processing software such as Mat LAB andImage Pro Plus.
3. Results and discussion
3.1. Field permeability results
The results of field permeability measurements for five locationswithin each parking lot for 20 pervious concrete parking lots aresummarized in Table 3. As shown, the field permeability withina single parking lot varied widely with testing location and withineach site. For example, in parking lot PL7 there is a difference ofthree orders of magnitude between the no-traffic and the mainentryway field permeability. This shows a large permeability rangewithin a single parking lot, which can be explained by the differ-ence in traffic volume experienced at the two different locations.However, site PL7 is an extreme case. Many of the other sites hadcomparable results for the no-traffic and main entryway locations.This is may be due to the fact that the only available no-trafficlocations were often located next to the edge of the parking lot andmost often exposed to erosion of soils from surrounding land-scaped areas.
The range of permeability at different locations within a singlesite is comparable to the range of permeability at different sitesthroughout the state. For example, site PL11 yielded consistentlylow permeability values, on the order of 10�3 cm/s, while site PL17yielded consistently high permeability values, on the order of100 cm/s. The difference between the permeability of these sites isthree orders of magnitude. Field permeability testing of these
inent parking lot characteristics
/s (in/h) Age (yr) Totalsediment (g)
Fine sediment(<38 mm)fraction (%)
.82 (1162) 1 6.15 2.01
.82 (1162) 1 6.15 2.01
.02 (28) 3 51.25 8.1402 (2.8) 4 68.16 2.9202 (2.8) 4 68.16 2.9207 (z1) 8 16.99 4.1907 (z1) 8 16.99 4.19
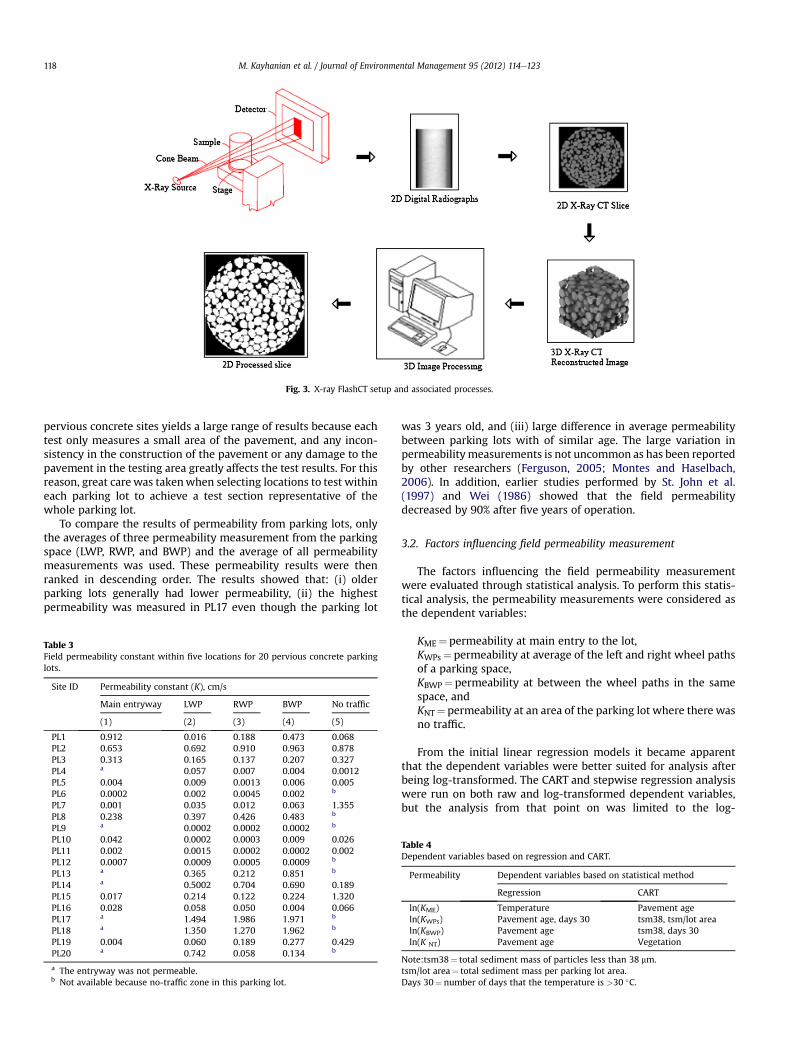
Fig. 3. X-ray FlashCT setup and associated processes.
M. Kayhanian et al. / Journal of Environmental Management 95 (2012) 114e123118
pervious concrete sites yields a large range of results because eachtest only measures a small area of the pavement, and any incon-sistency in the construction of the pavement or any damage to thepavement in the testing area greatly affects the test results. For thisreason, great care was takenwhen selecting locations to test withineach parking lot to achieve a test section representative of thewhole parking lot.
To compare the results of permeability from parking lots, onlythe averages of three permeability measurement from the parkingspace (LWP, RWP, and BWP) and the average of all permeabilitymeasurements was used. These permeability results were thenranked in descending order. The results showed that: (i) olderparking lots generally had lower permeability, (ii) the highestpermeability was measured in PL17 even though the parking lot
Table 3Field permeability constant within five locations for 20 pervious concrete parkinglots.
Site ID Permeability constant (K), cm/s
Main entryway LWP RWP BWP No traffic
(1) (2) (3) (4) (5)
PL1 0.912 0.016 0.188 0.473 0.068PL2 0.653 0.692 0.910 0.963 0.878PL3 0.313 0.165 0.137 0.207 0.327PL4 a 0.057 0.007 0.004 0.0012PL5 0.004 0.009 0.0013 0.006 0.005PL6 0.0002 0.002 0.0045 0.002 b
PL7 0.001 0.035 0.012 0.063 1.355PL8 0.238 0.397 0.426 0.483 b
PL9 a 0.0002 0.0002 0.0002 b
PL10 0.042 0.0002 0.0003 0.009 0.026PL11 0.002 0.0015 0.0002 0.0002 0.002PL12 0.0007 0.0009 0.0005 0.0009 b
PL13 a 0.365 0.212 0.851 b
PL14 a 0.5002 0.704 0.690 0.189PL15 0.017 0.214 0.122 0.224 1.320PL16 0.028 0.058 0.050 0.004 0.066PL17 a 1.494 1.986 1.971 b
PL18 a 1.350 1.270 1.962 b
PL19 0.004 0.060 0.189 0.277 0.429PL20 a 0.742 0.058 0.134 b
a The entryway was not permeable.b Not available because no-traffic zone in this parking lot.
was 3 years old, and (iii) large difference in average permeabilitybetween parking lots with of similar age. The large variation inpermeabilitymeasurements is not uncommon as has been reportedby other researchers (Ferguson, 2005; Montes and Haselbach,2006). In addition, earlier studies performed by St. John et al.(1997) and Wei (1986) showed that the field permeabilitydecreased by 90% after five years of operation.
3.2. Factors influencing field permeability measurement
The factors influencing the field permeability measurementwere evaluated through statistical analysis. To perform this statis-tical analysis, the permeability measurements were considered asthe dependent variables:
KME¼ permeability at main entry to the lot,KWPs¼ permeability at average of the left and right wheel pathsof a parking space,KBWP¼ permeability at between the wheel paths in the samespace, andKNT¼ permeability at an area of the parking lot where there wasno traffic.
From the initial linear regression models it became apparentthat the dependent variables were better suited for analysis afterbeing log-transformed. The CART and stepwise regression analysiswere run on both raw and log-transformed dependent variables,but the analysis from that point on was limited to the log-
Table 4Dependent variables based on regression and CART.
Permeability Dependent variables based on statistical method
Regression CART
ln(KME) Temperature Pavement ageln(KWPs) Pavement age, days 30 tsm38, tsm/lot arealn(KBWP) Pavement age tsm38, days 30ln(K NT) Pavement age Vegetation
Note:tsm38¼ total sediment mass of particles less than 38 mm.tsm/lot area¼ total sediment mass per parking lot area.Days 30¼ number of days that the temperature is >30 �C.
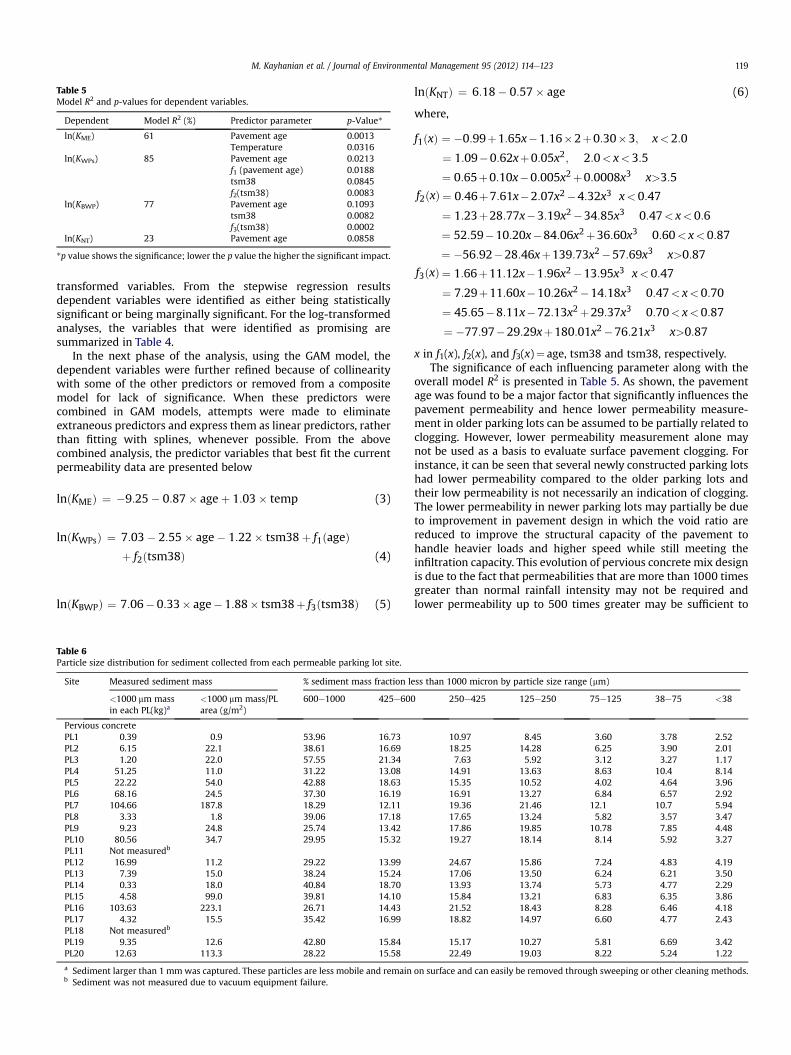
Table 5Model R2 and p-values for dependent variables.
Dependent Model R2 (%) Predictor parameter p-Value*
ln(KME) 61 Pavement age 0.0013Temperature 0.0316
ln(KWPs) 85 Pavement age 0.0213f1 (pavement age) 0.0188tsm38 0.0845f2(tsm38) 0.0083
ln(KBWP) 77 Pavement age 0.1093tsm38 0.0082f3(tsm38) 0.0002
ln(KNT) 23 Pavement age 0.0858
*p value shows the significance; lower the p value the higher the significant impact.
M. Kayhanian et al. / Journal of Environmental Management 95 (2012) 114e123 119
transformed variables. From the stepwise regression resultsdependent variables were identified as either being statisticallysignificant or being marginally significant. For the log-transformedanalyses, the variables that were identified as promising aresummarized in Table 4.
In the next phase of the analysis, using the GAM model, thedependent variables were further refined because of collinearitywith some of the other predictors or removed from a compositemodel for lack of significance. When these predictors werecombined in GAM models, attempts were made to eliminateextraneous predictors and express them as linear predictors, ratherthan fitting with splines, whenever possible. From the abovecombined analysis, the predictor variables that best fit the currentpermeability data are presented below
lnðKMEÞ ¼ �9:25� 0:87� ageþ 1:03� temp (3)
lnðKWPsÞ ¼ 7:03� 2:55� age� 1:22� tsm38þ f1ðageÞþ f2ðtsm38Þ (4)
lnðKBWPÞ ¼ 7:06� 0:33� age� 1:88� tsm38þ f3ðtsm38Þ (5)
Table 6Particle size distribution for sediment collected from each permeable parking lot site.
Site Measured sediment mass % sediment mass fraction le
<1000 mm massin each PL(kg)a
<1000 mm mass/PLarea (g/m2)
600e1000 425e600
Pervious concretePL1 0.39 0.9 53.96 16.73PL2 6.15 22.1 38.61 16.69PL3 1.20 22.0 57.55 21.34PL4 51.25 11.0 31.22 13.08PL5 22.22 54.0 42.88 18.63PL6 68.16 24.5 37.30 16.19PL7 104.66 187.8 18.29 12.11PL8 3.33 1.8 39.06 17.18PL9 9.23 24.8 25.74 13.42PL10 80.56 34.7 29.95 15.32PL11 Not measuredb
PL12 16.99 11.2 29.22 13.99PL13 7.39 15.0 38.24 15.24PL14 0.33 18.0 40.84 18.70PL15 4.58 99.0 39.81 14.10PL16 103.63 223.1 26.71 14.43PL17 4.32 15.5 35.42 16.99PL18 Not measuredb
PL19 9.35 12.6 42.80 15.84PL20 12.63 113.3 28.22 15.58
a Sediment larger than 1 mmwas captured. These particles are less mobile and remainb Sediment was not measured due to vacuum equipment failure.
lnðKNTÞ ¼ 6:18� 0:57� age (6)
where,
f1ðxÞ ¼ �0:99þ1:65x�1:16�2þ0:30�3; x<2:0
¼ 1:09�0:62xþ0:05x2; 2:0< x<3:5
¼ 0:65þ0:10x�0:005x2þ0:0008x3 x>3:5
f2ðxÞ ¼ 0:46þ7:61x�2:07x2�4:32x3 x<0:47
¼ 1:23þ28:77x�3:19x2�34:85x3 0:47< x<0:6
¼ 52:59�10:20x�84:06x2þ36:60x3 0:60< x<0:87
¼ �56:92�28:46xþ139:73x2�57:69x3 x>0:87
f3ðxÞ ¼ 1:66þ11:12x�1:96x2�13:95x3 x<0:47
¼ 7:29þ11:60x�10:26x2�14:18x3 0:47< x<0:70
¼ 45:65�8:11x�72:13x2þ29:37x3 0:70< x<0:87
¼ �77:97�29:29xþ180:01x2�76:21x3 x>0:87
x in f1(x), f2(x), and f3(x)¼ age, tsm38 and tsm38, respectively.The significance of each influencing parameter along with the
overall model R2 is presented in Table 5. As shown, the pavementage was found to be a major factor that significantly influences thepavement permeability and hence lower permeability measure-ment in older parking lots can be assumed to be partially related toclogging. However, lower permeability measurement alone maynot be used as a basis to evaluate surface pavement clogging. Forinstance, it can be seen that several newly constructed parking lotshad lower permeability compared to the older parking lots andtheir low permeability is not necessarily an indication of clogging.The lower permeability in newer parking lots may partially be dueto improvement in pavement design in which the void ratio arereduced to improve the structural capacity of the pavement tohandle heavier loads and higher speed while still meeting theinfiltration capacity. This evolution of pervious concrete mix designis due to the fact that permeabilities that are more than 1000 timesgreater than normal rainfall intensity may not be required andlower permeability up to 500 times greater may be sufficient to
ss than 1000 micron by particle size range (mm)
250e425 125e250 75e125 38e75 <38
10.97 8.45 3.60 3.78 2.5218.25 14.28 6.25 3.90 2.017.63 5.92 3.12 3.27 1.17
14.91 13.63 8.63 10.4 8.1415.35 10.52 4.02 4.64 3.9616.91 13.27 6.84 6.57 2.9219.36 21.46 12.1 10.7 5.9417.65 13.24 5.82 3.57 3.4717.86 19.85 10.78 7.85 4.4819.27 18.14 8.14 5.92 3.27
24.67 15.86 7.24 4.83 4.1917.06 13.50 6.24 6.21 3.5013.93 13.74 5.73 4.77 2.2915.84 13.21 6.83 6.35 3.8621.52 18.43 8.28 6.46 4.1818.82 14.97 6.60 4.77 2.43
15.17 10.27 5.81 6.69 3.4222.49 19.03 8.22 5.24 1.22
on surface and can easily be removed through sweeping or other cleaning methods.
0
10
20
30
40
50
60
70
1.44
1.97
2.72
3.76
5.21
7.24
10.1 14 19
.527
.137
.652
.472
.8 101
141
196
Particle Size (microns)
uL
/L
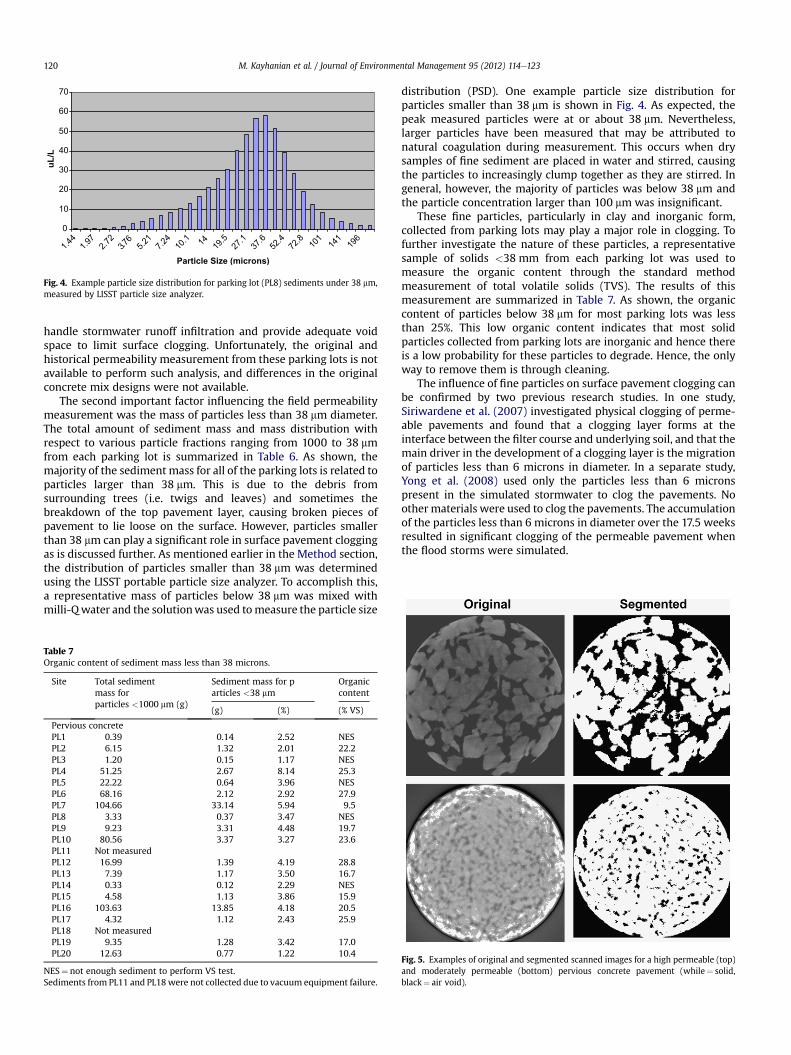
Fig. 4. Example particle size distribution for parking lot (PL8) sediments under 38 mm,measured by LISST particle size analyzer.
M. Kayhanian et al. / Journal of Environmental Management 95 (2012) 114e123120
handle stormwater runoff infiltration and provide adequate voidspace to limit surface clogging. Unfortunately, the original andhistorical permeability measurement from these parking lots is notavailable to perform such analysis, and differences in the originalconcrete mix designs were not available.
The second important factor influencing the field permeabilitymeasurement was the mass of particles less than 38 mm diameter.The total amount of sediment mass and mass distribution withrespect to various particle fractions ranging from 1000 to 38 mmfrom each parking lot is summarized in Table 6. As shown, themajority of the sediment mass for all of the parking lots is related toparticles larger than 38 mm. This is due to the debris fromsurrounding trees (i.e. twigs and leaves) and sometimes thebreakdown of the top pavement layer, causing broken pieces ofpavement to lie loose on the surface. However, particles smallerthan 38 mm can play a significant role in surface pavement cloggingas is discussed further. As mentioned earlier in the Method section,the distribution of particles smaller than 38 mm was determinedusing the LISST portable particle size analyzer. To accomplish this,a representative mass of particles below 38 mm was mixed withmilli-Qwater and the solutionwas used tomeasure the particle size
Table 7Organic content of sediment mass less than 38 microns.
Site Total sedimentmass forparticles <1000 mm (g)
Sediment mass for particles <38 mm
Organiccontent
(g) (%) (% VS)
Pervious concretePL1 0.39 0.14 2.52 NESPL2 6.15 1.32 2.01 22.2PL3 1.20 0.15 1.17 NESPL4 51.25 2.67 8.14 25.3PL5 22.22 0.64 3.96 NESPL6 68.16 2.12 2.92 27.9PL7 104.66 33.14 5.94 9.5PL8 3.33 0.37 3.47 NESPL9 9.23 3.31 4.48 19.7PL10 80.56 3.37 3.27 23.6PL11 Not measuredPL12 16.99 1.39 4.19 28.8PL13 7.39 1.17 3.50 16.7PL14 0.33 0.12 2.29 NESPL15 4.58 1.13 3.86 15.9PL16 103.63 13.85 4.18 20.5PL17 4.32 1.12 2.43 25.9PL18 Not measuredPL19 9.35 1.28 3.42 17.0PL20 12.63 0.77 1.22 10.4
NES¼ not enough sediment to perform VS test.Sediments from PL11 and PL18were not collected due to vacuum equipment failure.
distribution (PSD). One example particle size distribution forparticles smaller than 38 mm is shown in Fig. 4. As expected, thepeak measured particles were at or about 38 mm. Nevertheless,larger particles have been measured that may be attributed tonatural coagulation during measurement. This occurs when drysamples of fine sediment are placed in water and stirred, causingthe particles to increasingly clump together as they are stirred. Ingeneral, however, the majority of particles was below 38 mm andthe particle concentration larger than 100 mm was insignificant.
These fine particles, particularly in clay and inorganic form,collected from parking lots may play a major role in clogging. Tofurther investigate the nature of these particles, a representativesample of solids <38 mm from each parking lot was used tomeasure the organic content through the standard methodmeasurement of total volatile solids (TVS). The results of thismeasurement are summarized in Table 7. As shown, the organiccontent of particles below 38 mm for most parking lots was lessthan 25%. This low organic content indicates that most solidparticles collected from parking lots are inorganic and hence thereis a low probability for these particles to degrade. Hence, the onlyway to remove them is through cleaning.
The influence of fine particles on surface pavement clogging canbe confirmed by two previous research studies. In one study,Siriwardene et al. (2007) investigated physical clogging of perme-able pavements and found that a clogging layer forms at theinterface between the filter course and underlying soil, and that themain driver in the development of a clogging layer is the migrationof particles less than 6 microns in diameter. In a separate study,Yong et al. (2008) used only the particles less than 6 micronspresent in the simulated stormwater to clog the pavements. Noother materials were used to clog the pavements. The accumulationof the particles less than 6 microns in diameter over the 17.5 weeksresulted in significant clogging of the permeable pavement whenthe flood storms were simulated.
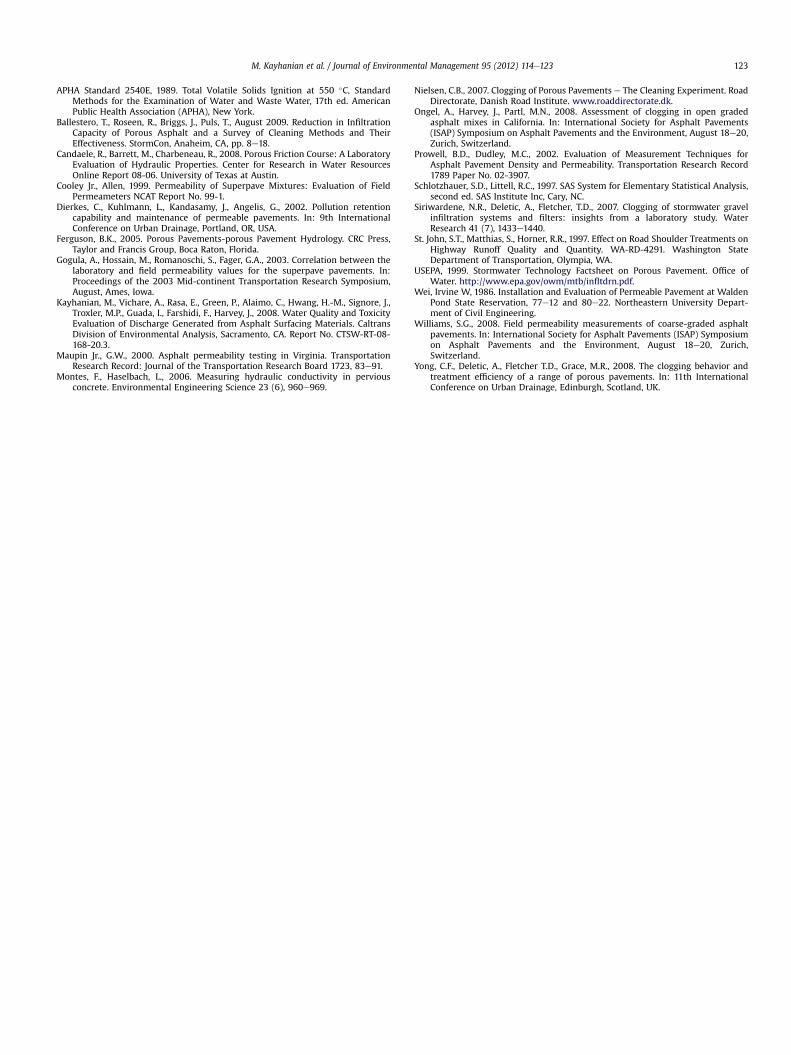
Fig. 5. Examples of original and segmented scanned images for a high permeable (top)and moderately permeable (bottom) pervious concrete pavement (while¼ solid,black¼ air void).

M. Kayhanian et al. / Journal of Environmental Management 95 (2012) 114e123 121
3.3. Evidence of clogging using CT scanning image evaluation
To assess the evidence of clogging, CT scan image of seven coresamples obtained from four different parking lots were evaluated.Numerous slice images produced during CT scanning were pro-cessed and underwent segmentation in which the void space andsolid fraction of each slice was determined. Fig. 5 shows an exampleof an original and segmented image for two core samples withrelative permeability of high (top) and low (bottom). In thesegmented image the white color represents solids and the blackcolor represents the air voids.
Fig. 6(i) show the porosity profiles with depth of four coresamples from different parking lots. To aid visual inspection, typicalhorizontal (inset images) and vertical (presented as (ii)) slices arepresented along with the porosity profiles. The average porosity isalso shown on each profile. It can be seen that the porosities forparking lots PL6 and PL12 are lower compared to porosities ofsamples from parking lots PL2 and PL4. Visual evidence of these isfound on the inset slice images shown. These results can beconfirmed with permeability results shown in Tables 2 and 3. Fromthese results it can be concluded that core samples with higher
Fig. 6. CT scanning porosity profiles of core s
average porosity also had a higher permeability. The high correla-tion between these two parameters was confirmed by measuringtotal air voids (porosity) and permeability of different open gradedconcrete pavement specimens in the lab. The relationship devel-oped is shown in Fig. 7. The only difference is that the permeabilitymeasurement can not distinguish the difference in porosity atdifferent depths of the pavement. For instance the average porosityfor the following samples may result the same permeabilitymeasurement:
A. Low porosity at the top 5 cm layer and much higher porosity inthe rest of the core,
B. Low porosity inmid depth and higher porosity in the rest of thecore,
C. Low porosity in bottom section of the core and higher porosityin the rest of the core,
Scanning, on the other hand, provides an opportunity toinvestigate the porosity profile throughout the core depth and thatpossibly be used as a tool to investigate clogging. Preliminary CTscanning images evaluated in this study generally showed a lower
amples from four different parking lots.

1.0
2.0
3.0
4.0
5.0
6.0
7.0
8.0
20 22 24 26 28 30 32
y = 1.4x10⁻⁶
* x^(4.5) R2
= 0.91
Pe
rm
ea
bility (cm
/se
c)
Air voids (%)
Pavement type = PCC-O
Fig. 7. Relationship between permeability and air voids (porosity) of concretespecimens.
M. Kayhanian et al. / Journal of Environmental Management 95 (2012) 114e123122
porosity on the upper surface for most core samples. However,a decrease in porosity in the mid-section for few of the coresamples (not shown here) was also noticed and could not beconfirmed for clogging. Nevertheless, it is important to note thatthe decrease in porosity did not significantly change the perme-ability to create surface ponding or surface overflow. To posea serious reduction in stormwater infiltration, nearly 90% of thevoid ratio must be plugged (Al-Omari and Masad, 2004).
In a separate study, Ongel et al. (2008) used both field perme-ability and scanning methods to evaluate the clogging of opengraded asphalt porous friction course (PFC) pavements. Resultsrevealed that the top of the cored samples typically had a lower airvoid content than the bottom of the cored samples. From thispreliminary finding, they concluded that generally clogging takesplace at the top zone of the surface of open gradedmixes, especiallysurface layer mixes with thickness of about 25 mm. The top surfaceclogging noticed in the investigation presented in this paper andother previous studies can be viewed as good news for two reasons:(1) there is a possibility of self cleaning by tire pressure during rainevent, and (2) it is easier to remove these particles by vacuum orother cleaning mechanisms.
The average porosity computed by scanning was verified bymeasuring the overall porosity of the samples in the laboratoryusing a gravimetric method (Candaele et al., 2008). The resultsobtained from both methods were compared as shown in Table 8,
Table 8Average porosity of core samples based on scanning and gravimetric methods.
Sample Average porosity (%)
Scanning method Gravimetric method
PL2-1 34.51 26.54PL2-2 17.39 19.68PL4-1 25.87 14.87PL6-2 9.60 14.36PL6-3 8.26 9.19PL12-1 14.1 23.55PL12-3 22.03 22.27
and generally found to be similar. Gravimetric measurements wereperformed with specimens vacuum sealed in plastic bags using theCoreLok� device. In a number of samples, the porosity obtained bythe gravimetric method is greater than the average value computedover the depth from CT scanning. This may be attributed to differ-ences in the boundary definitions at the specimen surfaces for thetwo methods and the inability of the CT method to measure poresthat are smaller than the resolution of the scanning equipment. Thegravimetric method is useful for ensuring the CT scanning valuesare reasonable. However, the CT scanning results are accurateenough to detect the clogs and their location, which makes ita superior method for the purposes of this investigation.
4. Conclusions
The conclusions drawn from this study are summarized below:
� The permeability results indicate that there is very large vari-ability in permeability within each parking lot and whencompared with other parking lots. The variability in K valuebetween no-traffic and traffic areas can range up to a factor of1000. In general, the permeability of older parking lots waslower than newer parking lots; indicating that age is a factoraffecting permeability.
� The statistical analysis revealed that the age of pavement is themain factor that explains variations in measured permeability.Another important factor affecting pavement permeability isthe mass of fine particles less than 38 mm. Other factors thatexplain the observed variations include number of days withtemperature greater than 30 �C, thought to influence tirerubber deposition, and the amount of vegetation surroundingthe parking lots.
� The combined image analysis and porosity profile showed thatthe porosity of the top layer surface (25 mm) of core sampleswas generally lower and theremay be an indication of clogging.In some core samples the evidence of lower porosity has alsobeen noticed in the mid layer and the clogging effect could notbe confirmed. Nevertheless, if the lower porosity in the midlayer is due to the penetration of fine particles from surface ofthe pavement then a regular cleaning maintenance programwill improve the average porosity profile.
Acknowledgments
This research study was funded by the California Department ofTransportation, Division of Environmental Analysis throughAgreement 43A0247. The content of this paper reflect the views ofthe authors and do not necessarily reflect the official views orpolicies of the state of California or the Regents of the University ofCalifornia. The authors are thankful: to the staff of the University ofCalifornia Pavement Research Center for their assistance on samplecoring and to Mr. Neil Willits from UC Davis Statistical Laboratoryfor his advice on statistical analysis. We appreciate the assistance ofresearch staff especially Kalehiwot Nega from theWashington StateUniversityWAX-CT Laboratory who performed the CT scanning andimage analysis. We are especially thankful to the ACPA forproviding the list of pervious concrete parking lots in California andthe related pavement information that was used for our test siteselection for clogging investigation.
References
Al-Omari, A., Masad, E., 2004. Three dimensional simulation of fluid flow in X-rayCT images of porous media. International Journal for Numerical and AnalyticalMethods in Geomechanics 28 (13), 1327e1360.
M. Kayhanian et al. / Journal of Environmental Management 95 (2012) 114e123 123
APHA Standard 2540E, 1989. Total Volatile Solids Ignition at 550 �C, StandardMethods for the Examination of Water and Waste Water, 17th ed. AmericanPublic Health Association (APHA), New York.
Ballestero, T., Roseen, R., Briggs, J., Puls, T., August 2009. Reduction in InfiltrationCapacity of Porous Asphalt and a Survey of Cleaning Methods and TheirEffectiveness. StormCon, Anaheim, CA, pp. 8e18.
Candaele, R., Barrett, M., Charbeneau, R., 2008. Porous Friction Course: A LaboratoryEvaluation of Hydraulic Properties. Center for Research in Water ResourcesOnline Report 08-06. University of Texas at Austin.
Cooley Jr., Allen, 1999. Permeability of Superpave Mixtures: Evaluation of FieldPermeameters NCAT Report No. 99-1.
Dierkes, C., Kuhlmann, L., Kandasamy, J., Angelis, G., 2002. Pollution retentioncapability and maintenance of permeable pavements. In: 9th InternationalConference on Urban Drainage, Portland, OR, USA.
Ferguson, B.K., 2005. Porous Pavements-porous Pavement Hydrology. CRC Press,Taylor and Francis Group, Boca Raton, Florida.
Gogula, A., Hossain, M., Romanoschi, S., Fager, G.A., 2003. Correlation between thelaboratory and field permeability values for the superpave pavements. In:Proceedings of the 2003 Mid-continent Transportation Research Symposium,August, Ames, Iowa.
Kayhanian, M., Vichare, A., Rasa, E., Green, P., Alaimo, C., Hwang, H.-M., Signore, J.,Troxler, M.P., Guada, I., Farshidi, F., Harvey, J., 2008. Water Quality and ToxicityEvaluation of Discharge Generated from Asphalt Surfacing Materials. CaltransDivision of Environmental Analysis, Sacramento, CA. Report No. CTSW-RT-08-168-20.3.
Maupin Jr., G.W., 2000. Asphalt permeability testing in Virginia. TransportationResearch Record: Journal of the Transportation Research Board 1723, 83e91.
Montes, F., Haselbach, L., 2006. Measuring hydraulic conductivity in perviousconcrete. Environmental Engineering Science 23 (6), 960e969.
Nielsen, C.B., 2007. Clogging of Porous Pavements e The Cleaning Experiment. RoadDirectorate, Danish Road Institute. www.roaddirectorate.dk.
Ongel, A., Harvey, J., Partl, M.N., 2008. Assessment of clogging in open gradedasphalt mixes in California. In: International Society for Asphalt Pavements(ISAP) Symposium on Asphalt Pavements and the Environment, August 18e20,Zurich, Switzerland.
Prowell, B.D., Dudley, M.C., 2002. Evaluation of Measurement Techniques forAsphalt Pavement Density and Permeability. Transportation Research Record1789 Paper No. 02-3907.
Schlotzhauer, S.D., Littell, R.C., 1997. SAS System for Elementary Statistical Analysis,second ed. SAS Institute Inc, Cary, NC.
Siriwardene, N.R., Deletic, A., Fletcher, T.D., 2007. Clogging of stormwater gravelinfiltration systems and filters: insights from a laboratory study. WaterResearch 41 (7), 1433e1440.
St. John, S.T., Matthias, S., Horner, R.R., 1997. Effect on Road Shoulder Treatments onHighway Runoff Quality and Quantity. WA-RD-4291. Washington StateDepartment of Transportation, Olympia, WA.
USEPA, 1999. Stormwater Technology Factsheet on Porous Pavement. Office ofWater. http://www.epa.gov/owm/mtb/infltdrn.pdf.
Wei, Irvine W, 1986. Installation and Evaluation of Permeable Pavement at WaldenPond State Reservation, 77e12 and 80e22. Northeastern University Depart-ment of Civil Engineering.
Williams, S.G., 2008. Field permeability measurements of coarse-graded asphaltpavements. In: International Society for Asphalt Pavements (ISAP) Symposiumon Asphalt Pavements and the Environment, August 18e20, Zurich,Switzerland.
Yong, C.F., Deletic, A., Fletcher T.D., Grace, M.R., 2008. The clogging behavior andtreatment efficiency of a range of porous pavements. In: 11th InternationalConference on Urban Drainage, Edinburgh, Scotland, UK.