Embed Size (px)
Citation preview

WHITE PAPER PERFORMANCE REPORT PCIE-SSDS
© Fujitsu Technology Solutions 2011-2013 Page 1 (20)
WHITE PAPER FUJITSU PRIMERGY SERVER PERFORMANCE REPORT PCIE-SSDS
This document looks closely at the PCIe-SSDs that are available for some PRIMERGY servers with regard to the disk I/O performance that can be achieved.
In addition to the measurement results, the measurement method and the environment, in which the measurements were carried out, are also briefly explained.
Version
1.0a
2013-07-04
Content
Document history ................................................... 2
Introduction and technical data.............................. 3
Measurement method ............................................ 5
Measurement results ............................................. 6
A single PCIe-SSD ............................................. 6
PCIe-SSDs in the RAID array and individually 10
Influence of nominal capacity ........................... 13
Comparison with other storage media ............. 18
Measurement environment .................................. 19
Literature .............................................................. 20
Contact ................................................................ 20

WHITE PAPER PERFORMANCE REPORT PCIE-SSDS VERSION: 1.0A 2013-07-04
Page 2 (20) © Fujitsu Technology Solutions 2011-2013
Document history
Version 1.0
First report version
Version 1.0a
Minor corrections
WHITE PAPER PERFORMANCE REPORT PCIE-SSDS VERSION: 1.0A 2013-07-04
© Fujitsu Technology Solutions 2011-2013 Page 3 (20)
Introduction and technical data
The PCIe-SSD is an innovative, nonvolatile storage medium for PRIMERGY servers, which in certain cases can be used as a logical hard disk drive instead of "Hard Disk Drives" (HDDs) or "Solid State Drives" (SSDs) that have a SAS or SATA interface. The fact that the PCIe-SSD storage medium is directly coupled with the PCIe bus means that very high transaction rates and low latencies are possible. Such a storage medium is interesting for access acceleration to data that is stored on a nonvolatile basis, in cases such as:
Databases Web2.0 Servers Page files (especially in virtual environments, because these files are an essential part of the
memory management concepts there)
Technical data
The PCIe-SSDs on offer are flash memories that are based on a multi-level cell (MLC) NAND type of memory. There are currently two PCIe-SSD types, one model with a nominal capacity of 320 GB and one with 640 GB.
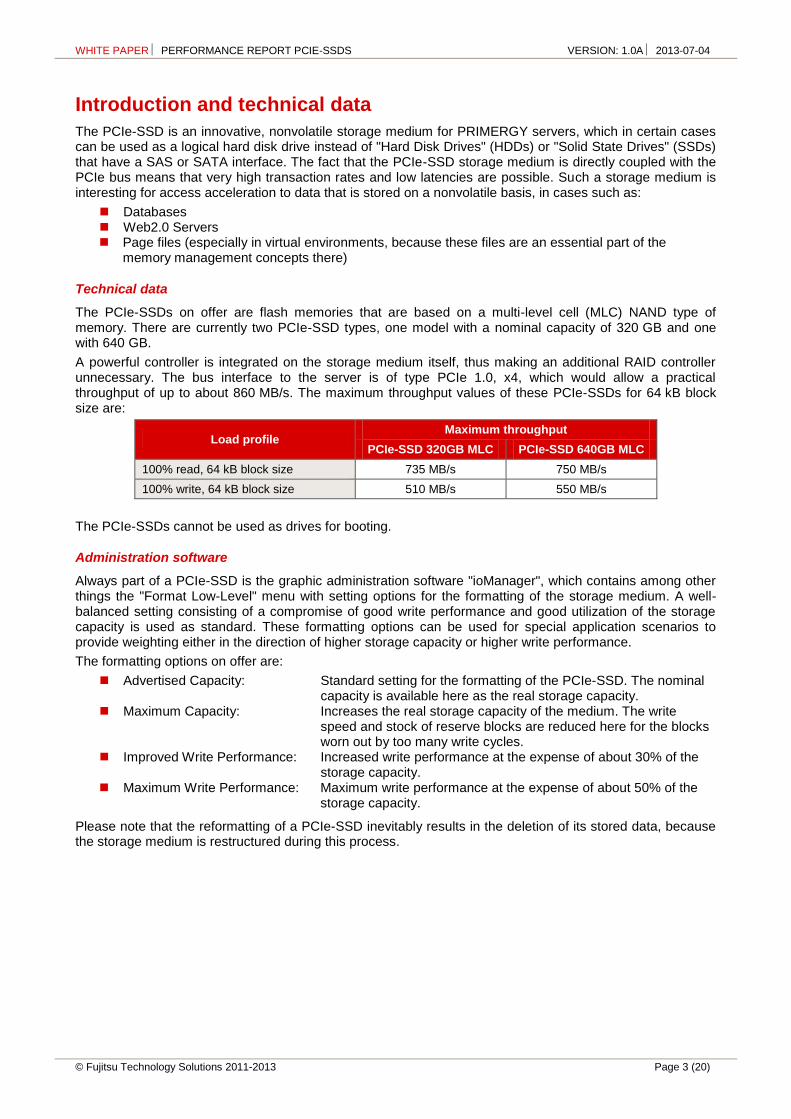
A powerful controller is integrated on the storage medium itself, thus making an additional RAID controller unnecessary. The bus interface to the server is of type PCIe 1.0, x4, which would allow a practical throughput of up to about 860 MB/s. The maximum throughput values of these PCIe-SSDs for 64 kB block size are:
Load profile Maximum throughput
PCIe-SSD 320GB MLC PCIe-SSD 640GB MLC
100% read, 64 kB block size 735 MB/s 750 MB/s
100% write, 64 kB block size 510 MB/s 550 MB/s
The PCIe-SSDs cannot be used as drives for booting.
Administration software
Always part of a PCIe-SSD is the graphic administration software "ioManager", which contains among other things the "Format Low-Level" menu with setting options for the formatting of the storage medium. A well-balanced setting consisting of a compromise of good write performance and good utilization of the storage capacity is used as standard. These formatting options can be used for special application scenarios to provide weighting either in the direction of higher storage capacity or higher write performance.
The formatting options on offer are:
Advertised Capacity: Standard setting for the formatting of the PCIe-SSD. The nominal capacity is available here as the real storage capacity.
Maximum Capacity: Increases the real storage capacity of the medium. The write speed and stock of reserve blocks are reduced here for the blocks worn out by too many write cycles.
Improved Write Performance: Increased write performance at the expense of about 30% of the storage capacity.
Maximum Write Performance: Maximum write performance at the expense of about 50% of the storage capacity.
Please note that the reformatting of a PCIe-SSD inevitably results in the deletion of its stored data, because the storage medium is restructured during this process.
WHITE PAPER PERFORMANCE REPORT PCIE-SSDS VERSION: 1.0A 2013-07-04
Page 4 (20) © Fujitsu Technology Solutions 2011-2013
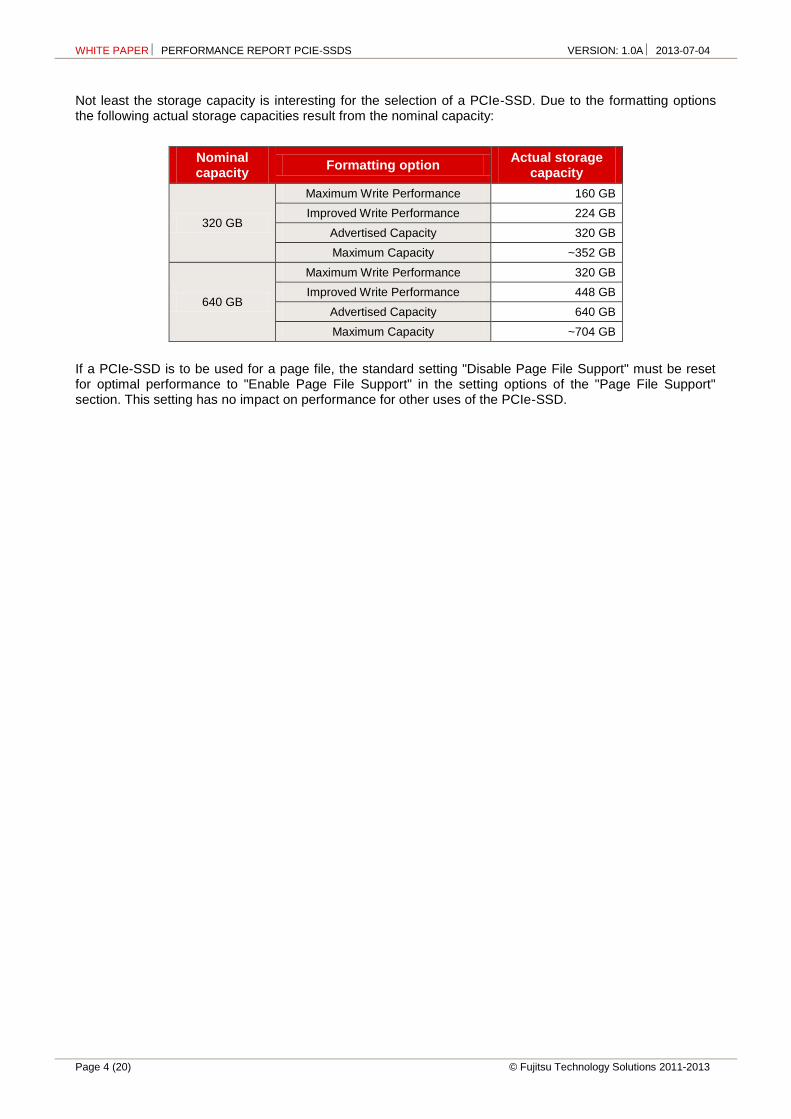
Not least the storage capacity is interesting for the selection of a PCIe-SSD. Due to the formatting options the following actual storage capacities result from the nominal capacity:
Nominal capacity
Formatting option Actual storage
capacity
320 GB
Maximum Write Performance 160 GB
Improved Write Performance 224 GB
Advertised Capacity 320 GB
Maximum Capacity ~352 GB
640 GB
Maximum Write Performance 320 GB
Improved Write Performance 448 GB
Advertised Capacity 640 GB
Maximum Capacity ~704 GB
If a PCIe-SSD is to be used for a page file, the standard setting "Disable Page File Support" must be reset for optimal performance to "Enable Page File Support" in the setting options of the "Page File Support" section. This setting has no impact on performance for other uses of the PCIe-SSD.

WHITE PAPER PERFORMANCE REPORT PCIE-SSDS VERSION: 1.0A 2013-07-04
© Fujitsu Technology Solutions 2011-2013 Page 5 (20)
Measurement method
All the details of the measurement method and the basics of disk I/O performance are described in the white paper "Basics of Disk I/O Performance".
As standard, performance measurements of disk subsystems in PRIMERGY servers are carried out with a defined measurement method, which models the hard disk accesses of real application scenarios on the basis of specifications.
The essential specifications are:
Share of random accesses / sequential accesses Share of read / write access types Block size (kB) Number of parallel accesses (# of outstanding I/Os)
A given value combination of these specifications is known as "load profile". The following five standard load profiles can be allocated to typical application scenarios:
In order to model applications that access in parallel with a different load intensity, the "# of Outstanding I/Os" is increased, starting with 1, 3, 8 and going up to 512 (from 8 onwards in increments to the power of two).
The measurements of this document are based on these standard load profiles.
The main results of a measurement are:
Throughput [MB/s] Throughput in megabytes per second Transactions [IO/s] Transaction rate in I/O operations per second Latency [ms] Average response time in ms
The throughput rate has established itself as the normal measurement variable for sequential load profiles, whereas the measurement variable "transaction rate" is mostly used for random load profiles with their small block sizes. Data throughput and transaction rate are directly proportional to each other and can be transferred to each other according to the formula
Data throughput [MB/s] = Transaction rate [IO/s] × Block size [MB]
Transaction rate [IO/s] = Data throughput [MB/s] / Block size [MB]
Standard load profile
Access Type of access Block size [kB]
Application
read write
File copy random 50% 50% 64 Copying of files
File server random 67% 33% 64 File server
Database random 67% 33% 8 Database (data transfer) Mail server
Streaming sequential 100% 0% 64 Database (log file), Data backup; Video streaming (partial)
Restore sequential 0% 100% 64 Restoring of files
WHITE PAPER PERFORMANCE REPORT PCIE-SSDS VERSION: 1.0A 2013-07-04
Page 6 (20) © Fujitsu Technology Solutions 2011-2013
Measurement results
Here we use the five standard load profiles "Database", "File server", "File copy", "Streaming" and "Restore", which were described in the section "Measurement method", to examine the performance of the PCIe-SSDs. If various load intensities are considered in the diagrams for accesses to the storage medium, they are specified, as is usual for Fujitsu Technology Solutions, in "# of outstanding IOs". The applications with low load intensity are represented by 1 outstanding IO and the applications with a very high load intensity by 512 outstanding IOs.
A single PCIe-SSD
The fundamental considerations should first be made on the basis of a single PCIe-SSD with a nominal capacity of 320 GB. The load profiles with random access are dealt with first of all, and secondly the load profiles with sequential access.
Random accesses
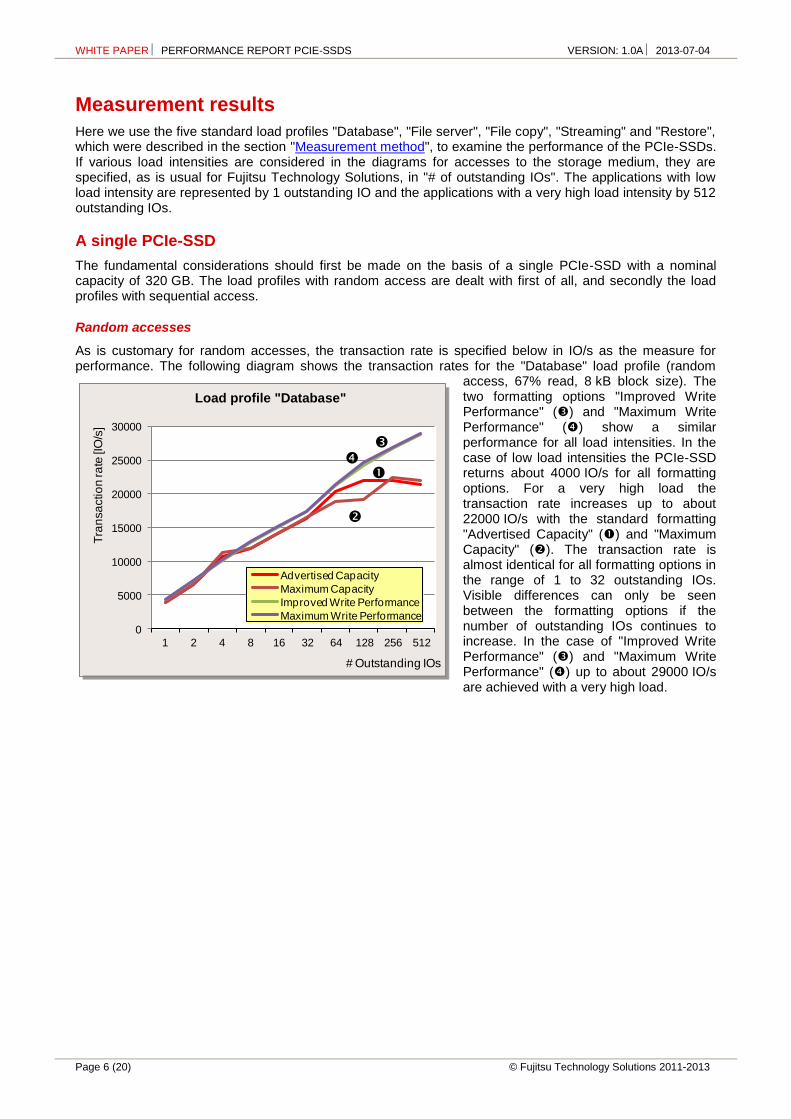
As is customary for random accesses, the transaction rate is specified below in IO/s as the measure for performance. The following diagram shows the transaction rates for the "Database" load profile (random
access, 67% read, 8 kB block size). The two formatting options "Improved Write Performance" () and "Maximum Write Performance" () show a similar performance for all load intensities. In the case of low load intensities the PCIe-SSD returns about 4000 IO/s for all formatting options. For a very high load the transaction rate increases up to about 22000 IO/s with the standard formatting "Advertised Capacity" () and "Maximum Capacity" (). The transaction rate is almost identical for all formatting options in the range of 1 to 32 outstanding IOs. Visible differences can only be seen between the formatting options if the number of outstanding IOs continues to increase. In the case of "Improved Write Performance" () and "Maximum Write Performance" () up to about 29000 IO/s are achieved with a very high load.
0
5000
10000
15000
20000
25000
30000
1 2 4 8 16 32 64 128 256 512
Tra
nsa
ctio
n ra
te [I
O/s
]
# Outstanding IOs
Advertised Capacity
Maximum Capacity
Improved Write Performance
Maximum Write Performance
Load profile "Database"
WHITE PAPER PERFORMANCE REPORT PCIE-SSDS VERSION: 1.0A 2013-07-04
© Fujitsu Technology Solutions 2011-2013 Page 7 (20)
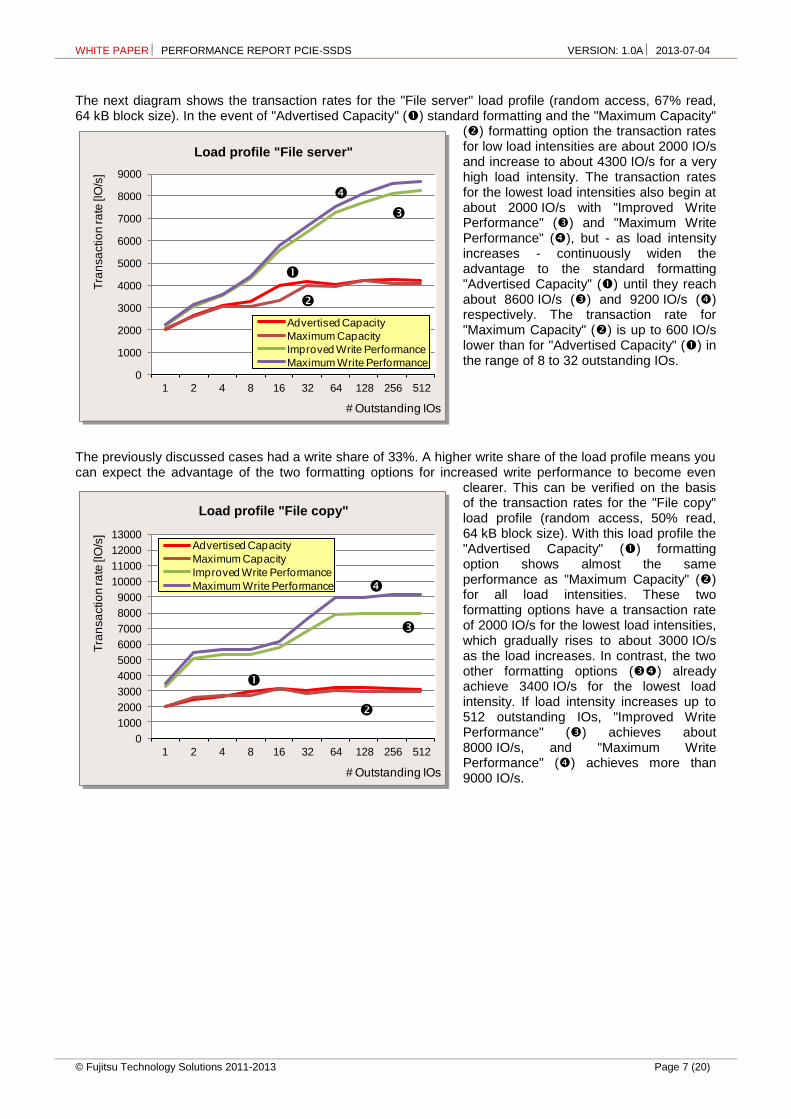
The next diagram shows the transaction rates for the "File server" load profile (random access, 67% read, 64 kB block size). In the event of "Advertised Capacity" () standard formatting and the "Maximum Capacity"
() formatting option the transaction rates for low load intensities are about 2000 IO/s and increase to about 4300 IO/s for a very high load intensity. The transaction rates for the lowest load intensities also begin at about 2000 IO/s with "Improved Write Performance" () and "Maximum Write Performance" (), but - as load intensity increases - continuously widen the advantage to the standard formatting "Advertised Capacity" () until they reach about 8600 IO/s () and 9200 IO/s () respectively. The transaction rate for "Maximum Capacity" () is up to 600 IO/s lower than for "Advertised Capacity" () in the range of 8 to 32 outstanding IOs.
The previously discussed cases had a write share of 33%. A higher write share of the load profile means you can expect the advantage of the two formatting options for increased write performance to become even
clearer. This can be verified on the basis of the transaction rates for the "File copy" load profile (random access, 50% read, 64 kB block size). With this load profile the "Advertised Capacity" () formatting option shows almost the same performance as "Maximum Capacity" () for all load intensities. These two formatting options have a transaction rate of 2000 IO/s for the lowest load intensities, which gradually rises to about 3000 IO/s as the load increases. In contrast, the two other formatting options () already achieve 3400 IO/s for the lowest load intensity. If load intensity increases up to 512 outstanding IOs, "Improved Write Performance" () achieves about 8000 IO/s, and "Maximum Write Performance" () achieves more than 9000 IO/s.
0
1000
2000
3000
4000
5000
6000
7000
8000
9000
1 2 4 8 16 32 64 128 256 512
Tra
nsa
ctio
n ra
te [I
O/s
]
# Outstanding IOs
Advertised Capacity
Maximum Capacity
Improved Write Performance
Maximum Write Performance
Load profile "File server"
0
1000
2000
3000
4000
5000
6000
7000
8000
9000
10000
11000
12000
13000
1 2 4 8 16 32 64 128 256 512
Tra
nsa
ctio
n ra
te [I
O/s
]
# Outstanding IOs
Advertised Capacity
Maximum Capacity
Improved Write Performance
Maximum Write Performance
Load profile "File copy"
WHITE PAPER PERFORMANCE REPORT PCIE-SSDS VERSION: 1.0A 2013-07-04
Page 8 (20) © Fujitsu Technology Solutions 2011-2013
Sequential accesses
PCIe-SSDs are scarcely used for sequential accesses in productive applications, because conventional hard disks already achieve good performance values for this purpose. Nevertheless, such load profiles are for the sake of completeness also to be discussed here. As is customary for sequential accesses, the transaction rate is no longer specified below as the measure for performance, but throughput in MB/s. To understand the throughput values that can be achieved it is essential to know the maximum values of the storage medium. As already mentioned and according to the manual the maximum values for a 64 kB block size are:
Load profile Maximum throughput
PCIe-SSD 320GB MLC PCIe-SSD 640GB MLC
100% read, 64 kB block size 735 MB/s 750 MB/s
100% write, 64 kB block size 510 MB/s 550 MB/s
These values are used as a frame of reference for the following analyses.
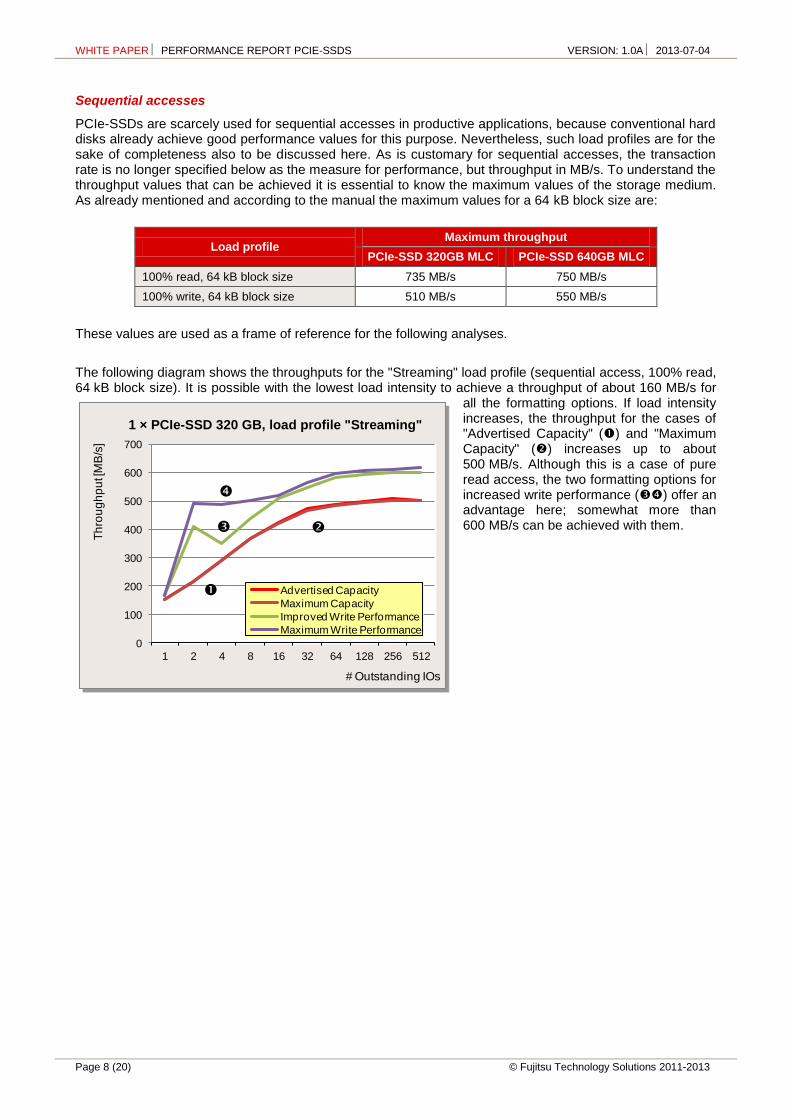
The following diagram shows the throughputs for the "Streaming" load profile (sequential access, 100% read, 64 kB block size). It is possible with the lowest load intensity to achieve a throughput of about 160 MB/s for
all the formatting options. If load intensity increases, the throughput for the cases of "Advertised Capacity" () and "Maximum Capacity" () increases up to about 500 MB/s. Although this is a case of pure read access, the two formatting options for increased write performance () offer an advantage here; somewhat more than 600 MB/s can be achieved with them.
0
100
200
300
400
500
600
700
1 2 4 8 16 32 64 128 256 512
Th
rou
gh
pu
t [M
B/s
]
# Outstanding IOs
Advertised Capacity
Maximum Capacity
Improved Write Performance
Maximum Write Performance
1 × PCIe-SSD 320 GB, load profile "Streaming"
WHITE PAPER PERFORMANCE REPORT PCIE-SSDS VERSION: 1.0A 2013-07-04
© Fujitsu Technology Solutions 2011-2013 Page 9 (20)
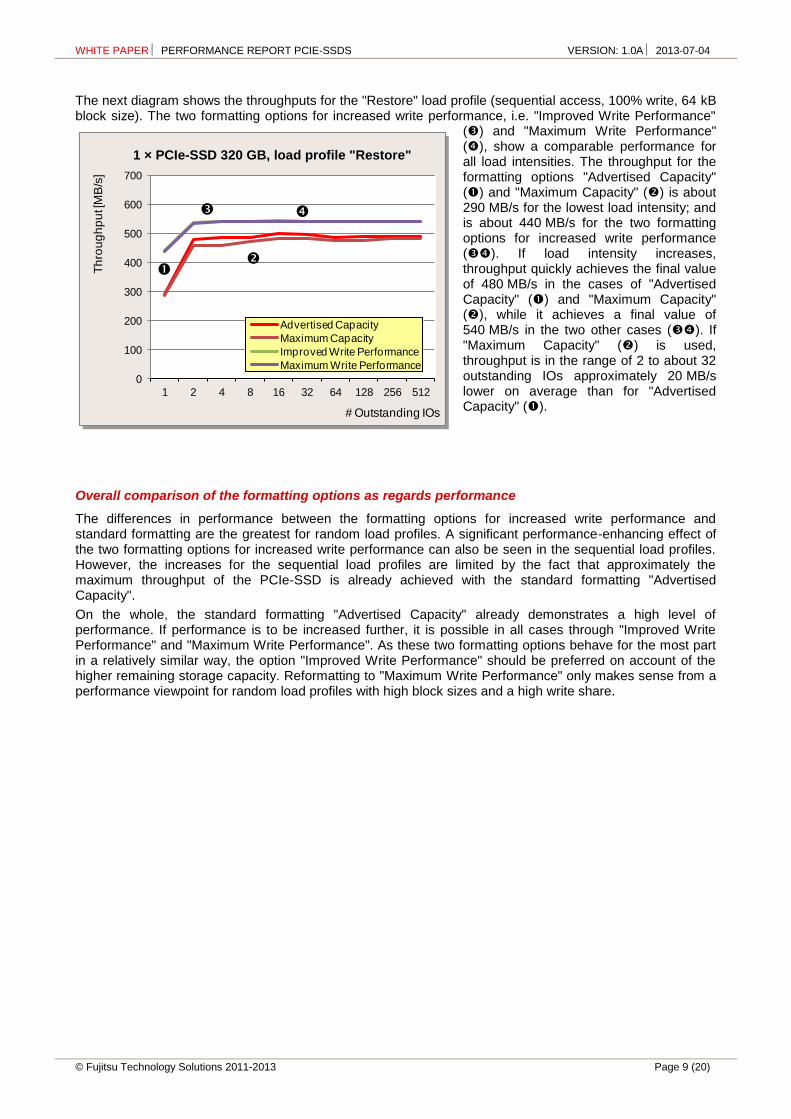
The next diagram shows the throughputs for the "Restore" load profile (sequential access, 100% write, 64 kB block size). The two formatting options for increased write performance, i.e. "Improved Write Performance"
() and "Maximum Write Performance" (), show a comparable performance for all load intensities. The throughput for the formatting options "Advertised Capacity" () and "Maximum Capacity" () is about 290 MB/s for the lowest load intensity; and is about 440 MB/s for the two formatting options for increased write performance (). If load intensity increases, throughput quickly achieves the final value of 480 MB/s in the cases of "Advertised Capacity" () and "Maximum Capacity" (), while it achieves a final value of 540 MB/s in the two other cases (). If "Maximum Capacity" () is used, throughput is in the range of 2 to about 32 outstanding IOs approximately 20 MB/s lower on average than for "Advertised Capacity" ().
Overall comparison of the formatting options as regards performance
The differences in performance between the formatting options for increased write performance and standard formatting are the greatest for random load profiles. A significant performance-enhancing effect of the two formatting options for increased write performance can also be seen in the sequential load profiles. However, the increases for the sequential load profiles are limited by the fact that approximately the maximum throughput of the PCIe-SSD is already achieved with the standard formatting "Advertised Capacity".
On the whole, the standard formatting "Advertised Capacity" already demonstrates a high level of performance. If performance is to be increased further, it is possible in all cases through "Improved Write Performance" and "Maximum Write Performance". As these two formatting options behave for the most part in a relatively similar way, the option "Improved Write Performance" should be preferred on account of the higher remaining storage capacity. Reformatting to "Maximum Write Performance" only makes sense from a performance viewpoint for random load profiles with high block sizes and a high write share.
0
100
200
300
400
500
600
700
1 2 4 8 16 32 64 128 256 512
Th
rou
gh
pu
t [M
B/s
]
# Outstanding IOs
Advertised Capacity
Maximum Capacity
Improved Write Performance
Maximum Write Performance
1 × PCIe-SSD 320 GB, load profile "Restore"

WHITE PAPER PERFORMANCE REPORT PCIE-SSDS VERSION: 1.0A 2013-07-04
Page 10 (20) © Fujitsu Technology Solutions 2011-2013
PCIe-SSDs in the RAID array and individually
As with other logical drives, RAID arrays can also be formed from PCIe-SSDs at operating system level. To increase fail-safety you can use RAID 1. In the case of load profiles that are not exclusively write profiles this RAID level usually also results in an increase in performance for the read share of the accesses. In case of an application in which higher performance is more important than fail-safety, a RAID 0 array can also be formed from two PCIe-SSDs. The possible RAID configurations for various load intensities with a single PCIe-SSD (using the example of the 320 GB version) are to be compared below for each of the five standard load profiles – starting with the standard formatting "Advertised Capacity".
In the case of the "Database" load profile (random access, 67% read, 8 kB block size) the RAID 1 array () and the RAID 0 array () have the same transaction rate as a single PCIe-SSD () for the lowest load intensity. If load intensity increases up to 512 outstanding IOs, the transaction rates increasingly grow further apart: The single PCIe-SSD () has up to approximately 21000 IO/s, the RAID 1 array () achieves up to approximately 28000 IO/s, and the RAID 0 array () has up to approximately 49000 IO/s.
In the case of the "File server" load profile (random access, 67% read, 64 kB block size) the RAID 1 array () has on the whole a similar performance level to that of the single PCIe-SSD (). If load intensity is low, the performance of the RAID 1 () is up to 20% less. If load intensity is higher, the performance of the RAID 1 () is up to 10% more. The RAID 0 array () has the highest performance. In comparison with the single PCIe-SSD () it achieves approximately 2800 IO/s compared with approximately 2000 IO/s for the lowest load intensities; and the RAID 0 array () achieves more than approximately 12000 IO/s compared with approximately 4200 IO/s for the highest load intensities.
0
5000
10000
15000
20000
25000
30000
35000
40000
45000
50000
1 2 4 8 16 32 64 128 256 512
Tra
nsa
ctio
n ra
te [I
O/s
]
# Outstanding IOs
1 PCIe-SSD
RAID 1
RAID 0 - 2
0
1000
2000
3000
4000
5000
6000
7000
8000
9000
10000
11000
12000
13000
1 2 4 8 16 32 64 128 256 512
Tra
nsa
ctio
n ra
te [I
O/s
]
# Outstanding IOs
1 PCIe-SSD
RAID 1
RAID 0 - 2
Load profile "File server" Formatting "Advertised Capacity"
Load profile "Database" Formatting "Advertised Capacity"
WHITE PAPER PERFORMANCE REPORT PCIE-SSDS VERSION: 1.0A 2013-07-04
© Fujitsu Technology Solutions 2011-2013 Page 11 (20)
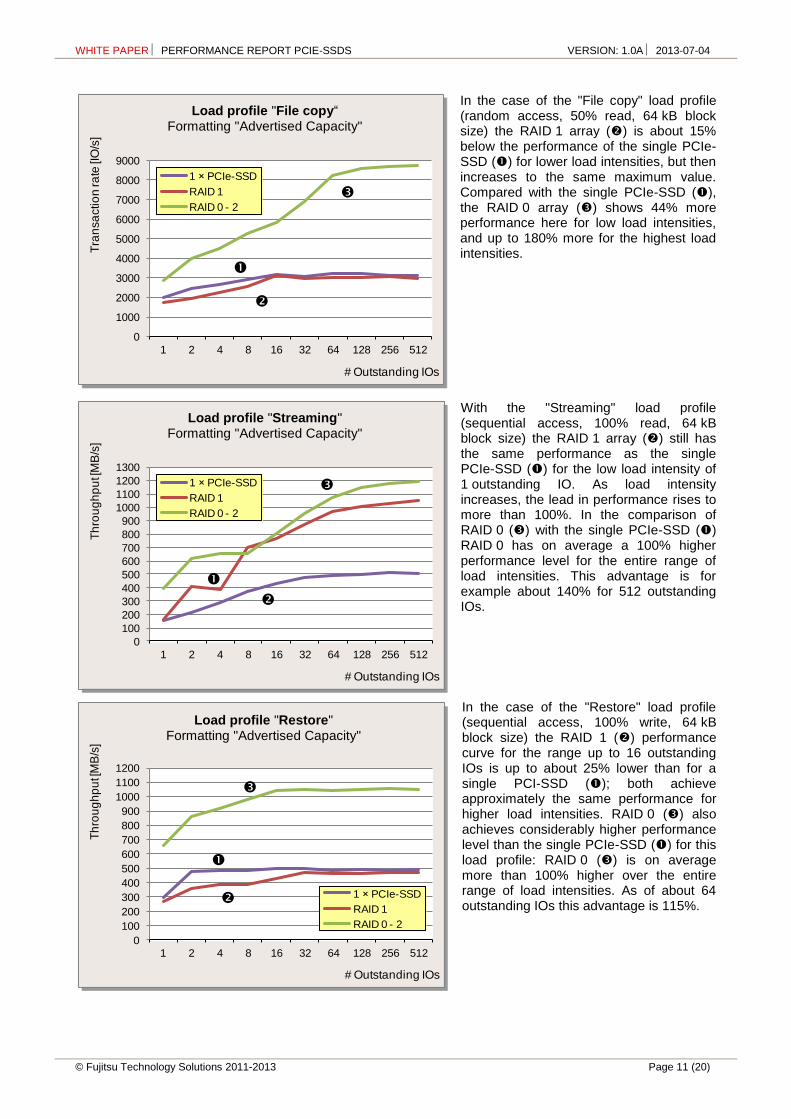
In the case of the "File copy" load profile (random access, 50% read, 64 kB block size) the RAID 1 array () is about 15% below the performance of the single PCIe-SSD () for lower load intensities, but then increases to the same maximum value. Compared with the single PCIe-SSD (), the RAID 0 array () shows 44% more performance here for low load intensities, and up to 180% more for the highest load intensities.
With the "Streaming" load profile (sequential access, 100% read, 64 kB block size) the RAID 1 array () still has the same performance as the single PCIe-SSD () for the low load intensity of 1 outstanding IO. As load intensity increases, the lead in performance rises to more than 100%. In the comparison of RAID 0 () with the single PCIe-SSD () RAID 0 has on average a 100% higher performance level for the entire range of load intensities. This advantage is for example about 140% for 512 outstanding IOs.
In the case of the "Restore" load profile (sequential access, 100% write, 64 kB block size) the RAID 1 () performance curve for the range up to 16 outstanding IOs is up to about 25% lower than for a single PCI-SSD (); both achieve approximately the same performance for higher load intensities. RAID 0 () also achieves considerably higher performance level than the single PCIe-SSD () for this load profile: RAID 0 () is on average more than 100% higher over the entire range of load intensities. As of about 64 outstanding IOs this advantage is 115%.
0
1000
2000
3000
4000
5000
6000
7000
8000
9000
1 2 4 8 16 32 64 128 256 512
Tra
nsa
ctio
n ra
te [I
O/s
]
# Outstanding IOs
1 PCIe-SSD
RAID 1
RAID 0 - 2
Load profile "File copy“ Formatting "Advertised Capacity"
0
100
200
300
400
500
600
700
800
900
1000
1100
1200
1300
1 2 4 8 16 32 64 128 256 512
Th
rou
gh
pu
t [M
B/s
]
# Outstanding IOs
1 PCIe-SSD
RAID 1
RAID 0 - 2
Load profile "Streaming" Formatting "Advertised Capacity"
0
100
200
300
400
500
600
700
800
900
1000
1100
1200
1 2 4 8 16 32 64 128 256 512
Th
rou
gh
pu
t [M
B/s
]
# Outstanding IOs
1 PCIe-SSD
RAID 1
RAID 0 - 2
Load profile "Restore" Formatting "Advertised Capacity"
WHITE PAPER PERFORMANCE REPORT PCIE-SSDS VERSION: 1.0A 2013-07-04
Page 12 (20) © Fujitsu Technology Solutions 2011-2013
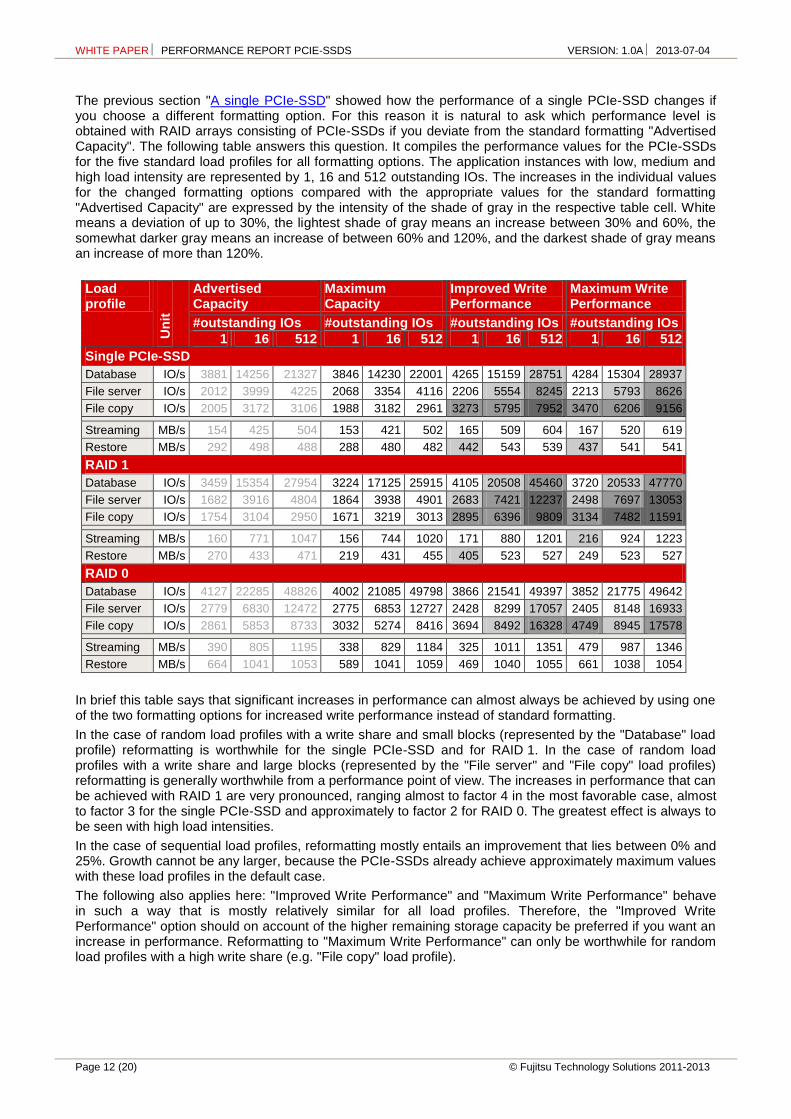
The previous section "A single PCIe-SSD" showed how the performance of a single PCIe-SSD changes if you choose a different formatting option. For this reason it is natural to ask which performance level is obtained with RAID arrays consisting of PCIe-SSDs if you deviate from the standard formatting "Advertised Capacity". The following table answers this question. It compiles the performance values for the PCIe-SSDs for the five standard load profiles for all formatting options. The application instances with low, medium and high load intensity are represented by 1, 16 and 512 outstanding IOs. The increases in the individual values for the changed formatting options compared with the appropriate values for the standard formatting "Advertised Capacity" are expressed by the intensity of the shade of gray in the respective table cell. White means a deviation of up to 30%, the lightest shade of gray means an increase between 30% and 60%, the somewhat darker gray means an increase of between 60% and 120%, and the darkest shade of gray means an increase of more than 120%.
Load profile
Un
it
Advertised Capacity
Maximum Capacity
Improved Write Performance
Maximum Write Performance
#outstanding IOs #outstanding IOs #outstanding IOs #outstanding IOs
1 16 512 1 16 512 1 16 512 1 16 512 Single PCIe-SSD
Database IO/s 3881 14256 21327 3846 14230 22001 4265 15159 28751 4284 15304 28937
File server IO/s 2012 3999 4225 2068 3354 4116 2206 5554 8245 2213 5793 8626
File copy IO/s 2005 3172 3106 1988 3182 2961 3273 5795 7952 3470 6206 9156
Streaming MB/s 154 425 504 153 421 502 165 509 604 167 520 619
Restore MB/s 292 498 488 288 480 482 442 543 539 437 541 541
RAID 1
Database IO/s 3459 15354 27954 3224 17125 25915 4105 20508 45460 3720 20533 47770
File server IO/s 1682 3916 4804 1864 3938 4901 2683 7421 12237 2498 7697 13053
File copy IO/s 1754 3104 2950 1671 3219 3013 2895 6396 9809 3134 7482 11591
Streaming MB/s 160 771 1047 156 744 1020 171 880 1201 216 924 1223
Restore MB/s 270 433 471 219 431 455 405 523 527 249 523 527
RAID 0 Database IO/s 4127 22285 48826 4002 21085 49798 3866 21541 49397 3852 21775 49642
File server IO/s 2779 6830 12472 2775 6853 12727 2428 8299 17057 2405 8148 16933
File copy IO/s 2861 5853 8733 3032 5274 8416 3694 8492 16328 4749 8945 17578
Streaming MB/s 390 805 1195 338 829 1184 325 1011 1351 479 987 1346
Restore MB/s 664 1041 1053 589 1041 1059 469 1040 1055 661 1038 1054
In brief this table says that significant increases in performance can almost always be achieved by using one of the two formatting options for increased write performance instead of standard formatting.
In the case of random load profiles with a write share and small blocks (represented by the "Database" load profile) reformatting is worthwhile for the single PCIe-SSD and for RAID 1. In the case of random load profiles with a write share and large blocks (represented by the "File server" and "File copy" load profiles) reformatting is generally worthwhile from a performance point of view. The increases in performance that can be achieved with RAID 1 are very pronounced, ranging almost to factor 4 in the most favorable case, almost to factor 3 for the single PCIe-SSD and approximately to factor 2 for RAID 0. The greatest effect is always to be seen with high load intensities.
In the case of sequential load profiles, reformatting mostly entails an improvement that lies between 0% and 25%. Growth cannot be any larger, because the PCIe-SSDs already achieve approximately maximum values with these load profiles in the default case.
The following also applies here: "Improved Write Performance" and "Maximum Write Performance" behave in such a way that is mostly relatively similar for all load profiles. Therefore, the "Improved Write Performance" option should on account of the higher remaining storage capacity be preferred if you want an increase in performance. Reformatting to "Maximum Write Performance" can only be worthwhile for random load profiles with a high write share (e.g. "File copy" load profile).
WHITE PAPER PERFORMANCE REPORT PCIE-SSDS VERSION: 1.0A 2013-07-04
© Fujitsu Technology Solutions 2011-2013 Page 13 (20)
Influence of nominal capacity
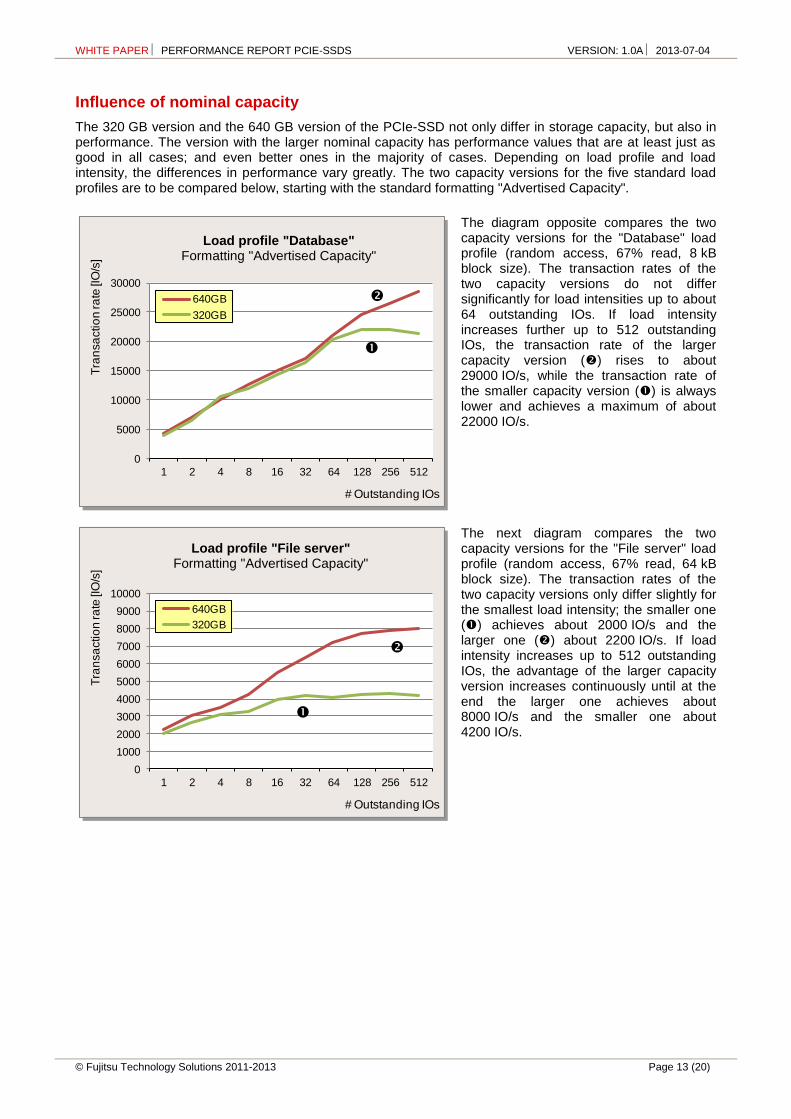
The 320 GB version and the 640 GB version of the PCIe-SSD not only differ in storage capacity, but also in performance. The version with the larger nominal capacity has performance values that are at least just as good in all cases; and even better ones in the majority of cases. Depending on load profile and load intensity, the differences in performance vary greatly. The two capacity versions for the five standard load profiles are to be compared below, starting with the standard formatting "Advertised Capacity".
The diagram opposite compares the two capacity versions for the "Database" load profile (random access, 67% read, 8 kB block size). The transaction rates of the two capacity versions do not differ significantly for load intensities up to about 64 outstanding IOs. If load intensity increases further up to 512 outstanding IOs, the transaction rate of the larger capacity version () rises to about 29000 IO/s, while the transaction rate of the smaller capacity version () is always lower and achieves a maximum of about 22000 IO/s.
The next diagram compares the two capacity versions for the "File server" load profile (random access, 67% read, 64 kB block size). The transaction rates of the two capacity versions only differ slightly for the smallest load intensity; the smaller one () achieves about 2000 IO/s and the larger one () about 2200 IO/s. If load intensity increases up to 512 outstanding IOs, the advantage of the larger capacity version increases continuously until at the end the larger one achieves about 8000 IO/s and the smaller one about 4200 IO/s.
0
5000
10000
15000
20000
25000
30000
1 2 4 8 16 32 64 128 256 512
Tra
nsa
ctio
n ra
te [I
O/s
]
# Outstanding IOs
640GB
320GB
0
1000
2000
3000
4000
5000
6000
7000
8000
9000
10000
1 2 4 8 16 32 64 128 256 512
Tra
nsa
ctio
n ra
te [I
O/s
]
# Outstanding IOs
640GB
320GB
Load profile "Database" Formatting "Advertised Capacity"
Load profile "File server" Formatting "Advertised Capacity"

WHITE PAPER PERFORMANCE REPORT PCIE-SSDS VERSION: 1.0A 2013-07-04
Page 14 (20) © Fujitsu Technology Solutions 2011-2013
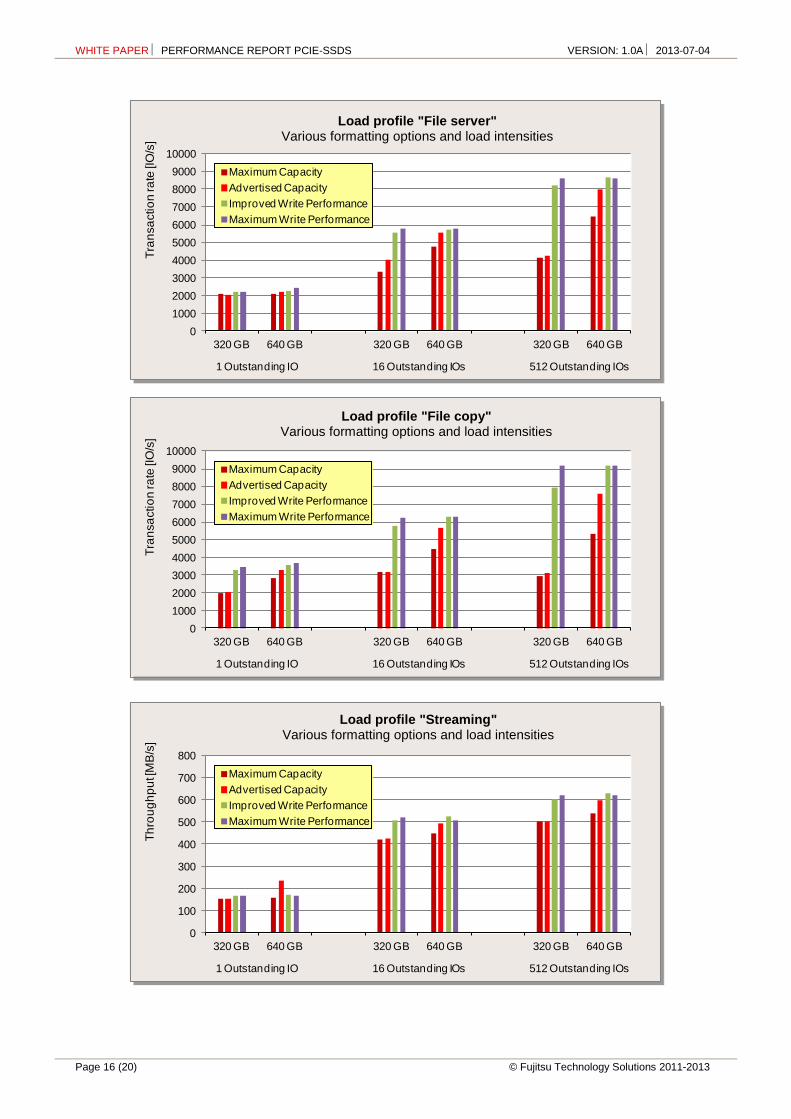
The diagram opposite compares the two capacity versions for the "File copy" load profile (random access, 50% read, 64 kB block size). The smaller capacity version () achieves with 1 outstanding IO a transaction rate of about 2000 IO/s and can increase this value to about 3100 IO/s if load intensity increases up to 512 outstanding IOs. The larger capacity version () already returns a transaction rate of more than 3200 IO/s for the smallest load intensity. If load intensity rises to 512, the transaction rate increases markedly until it ultimately reaches about 7600 IO/s.
The next diagram compares the throughputs of the two capacity versions for the "Streaming" load profile (sequential access, 100% read, 64 kB block size). If you go through the load intensities from 1 to 512 outstanding IOs, the smaller capacity version () begins with a throughput of about 150 MB/s, which gradually rises and levels out at about 510 MB/s. The throughput of the larger capacity version () is initially approximately 230 MB/s and gradually increases to approximately 600 MB/s. Here it is generally at least 60 MB/s higher than with the smaller capacity version.
In the "Restore" load profile (sequential access, 100% write, 64 kB block size) the smaller capacity version () for 1 outstanding IO has a throughput of about 290 MB/s, and the larger one () has a throughput of about 475 MB/s. Both capacity versions then each have an almost constant throughput for all higher load intensities. This throughput is approximately 490 MB/s for the smaller capacity version () and approximately 540 MB/s for the larger capacity version (). You can also see the advantage of about 60 MB/s again here.
0
1000
2000
3000
4000
5000
6000
7000
8000
9000
1 2 4 8 16 32 64 128 256 512
Tra
nsa
ctio
n ra
te [I
O/s
]
# Outstanding IOs
640GB
320GB
0
100
200
300
400
500
600
700
800
1 2 4 8 16 32 64 128 256 512
Th
rou
gh
pu
t [M
B/s
]
# Outstanding IOs
640GB
320GB
0
100
200
300
400
500
600
700
800
1 2 4 8 16 32 64 128 256 512
Th
rou
gh
pu
t [M
B/s
]
# Outstanding IOs
640GB
320GB
Load profile "File copy" Formatting "Advertised Capacity"
Load profile "Streaming" Formatting "Advertised Capacity"
Load profile "Restore" Formatting "Advertised Capacity"
WHITE PAPER PERFORMANCE REPORT PCIE-SSDS VERSION: 1.0A 2013-07-04
© Fujitsu Technology Solutions 2011-2013 Page 15 (20)
If you extend the performance comparison of the capacity versions to cover all four formatting options, the previously made performance statements are shown in a new light.
The two core statements of the extended comparison are:
If you use the performance-optimal formatting "Maximum Write Performance", the larger capacity version has almost the same performance as the small capacity version for all load profiles and load intensities.
The performance values for all formatting options are much closer to the respective values for "Maximum Write Performance" with the larger capacity version than with the smaller capacity version. In other words, the absolute performance differences between the formatting options are considerably lower for the version with 640 GB than for the version with 320 GB.
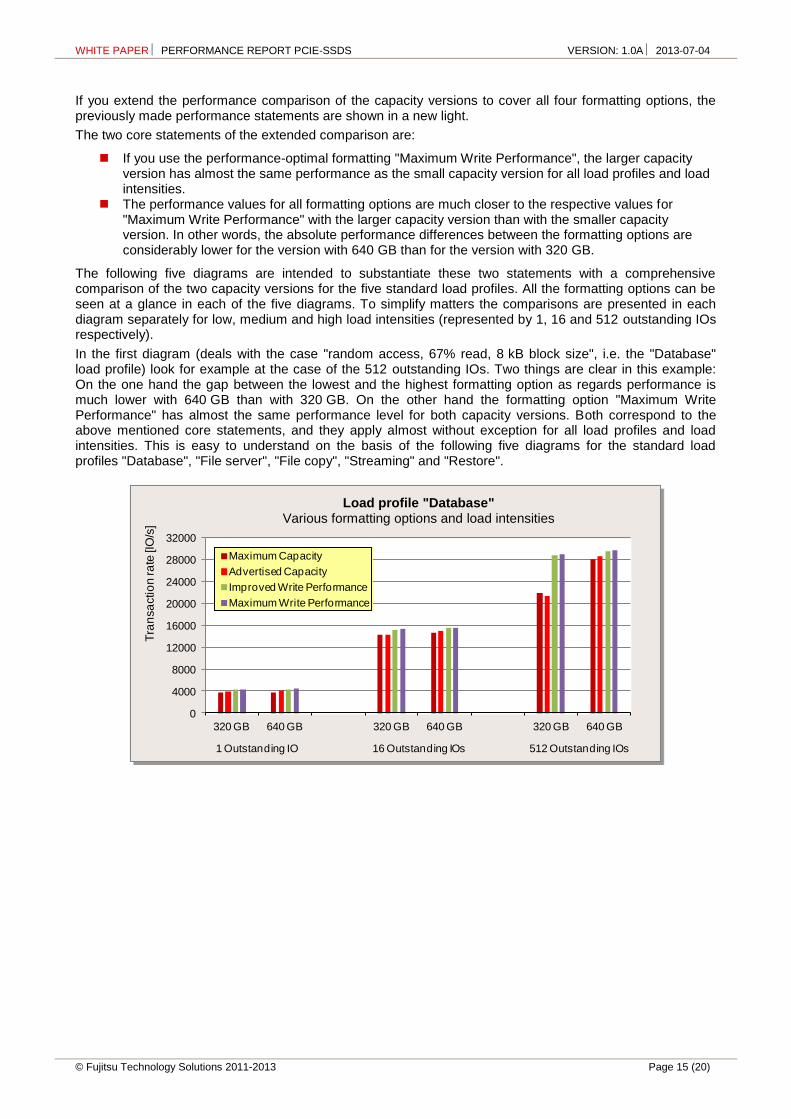
The following five diagrams are intended to substantiate these two statements with a comprehensive comparison of the two capacity versions for the five standard load profiles. All the formatting options can be seen at a glance in each of the five diagrams. To simplify matters the comparisons are presented in each diagram separately for low, medium and high load intensities (represented by 1, 16 and 512 outstanding IOs respectively).
In the first diagram (deals with the case "random access, 67% read, 8 kB block size", i.e. the "Database" load profile) look for example at the case of the 512 outstanding IOs. Two things are clear in this example: On the one hand the gap between the lowest and the highest formatting option as regards performance is much lower with 640 GB than with 320 GB. On the other hand the formatting option "Maximum Write Performance" has almost the same performance level for both capacity versions. Both correspond to the above mentioned core statements, and they apply almost without exception for all load profiles and load intensities. This is easy to understand on the basis of the following five diagrams for the standard load profiles "Database", "File server", "File copy", "Streaming" and "Restore".
0
4000
8000
12000
16000
20000
24000
28000
32000
320 GB 640 GB 320 GB 640 GB 320 GB 640 GB
Tra
nsa
ctio
n ra
te [I
O/s
]
Maximum Capacity
Advertised Capacity
Improved Write Performance
Maximum Write Performance
16 Outstanding IOs 512 Outstanding IOs1 Outstanding IO
Load profile "Database" Various formatting options and load intensities
WHITE PAPER PERFORMANCE REPORT PCIE-SSDS VERSION: 1.0A 2013-07-04
Page 16 (20) © Fujitsu Technology Solutions 2011-2013
0
1000
2000
3000
4000
5000
6000
7000
8000
9000
10000
320 GB 640 GB 320 GB 640 GB 320 GB 640 GB
Tra
nsa
ctio
n ra
te [I
O/s
]
Maximum Capacity
Advertised Capacity
Improved Write Performance
Maximum Write Performance
16 Outstanding IOs 512 Outstanding IOs1 Outstanding IO
0
1000
2000
3000
4000
5000
6000
7000
8000
9000
10000
320 GB 640 GB 320 GB 640 GB 320 GB 640 GB
Tra
nsa
ctio
n ra
te [I
O/s
]
Maximum Capacity
Advertised Capacity
Improved Write Performance
Maximum Write Performance
16 Outstanding IOs 512 Outstanding IOs1 Outstanding IO
Load profile "File server" Various formatting options and load intensities
Load profile "File copy" Various formatting options and load intensities
0
100
200
300
400
500
600
700
800
320 GB 640 GB 320 GB 640 GB 320 GB 640 GB
Th
rou
gh
pu
t [M
B/s
]
Maximum Capacity
Advertised Capacity
Improved Write Performance
Maximum Write Performance
16 Outstanding IOs 512 Outstanding IOs1 Outstanding IO
Load profile "Streaming" Various formatting options and load intensities
WHITE PAPER PERFORMANCE REPORT PCIE-SSDS VERSION: 1.0A 2013-07-04
© Fujitsu Technology Solutions 2011-2013 Page 17 (20)
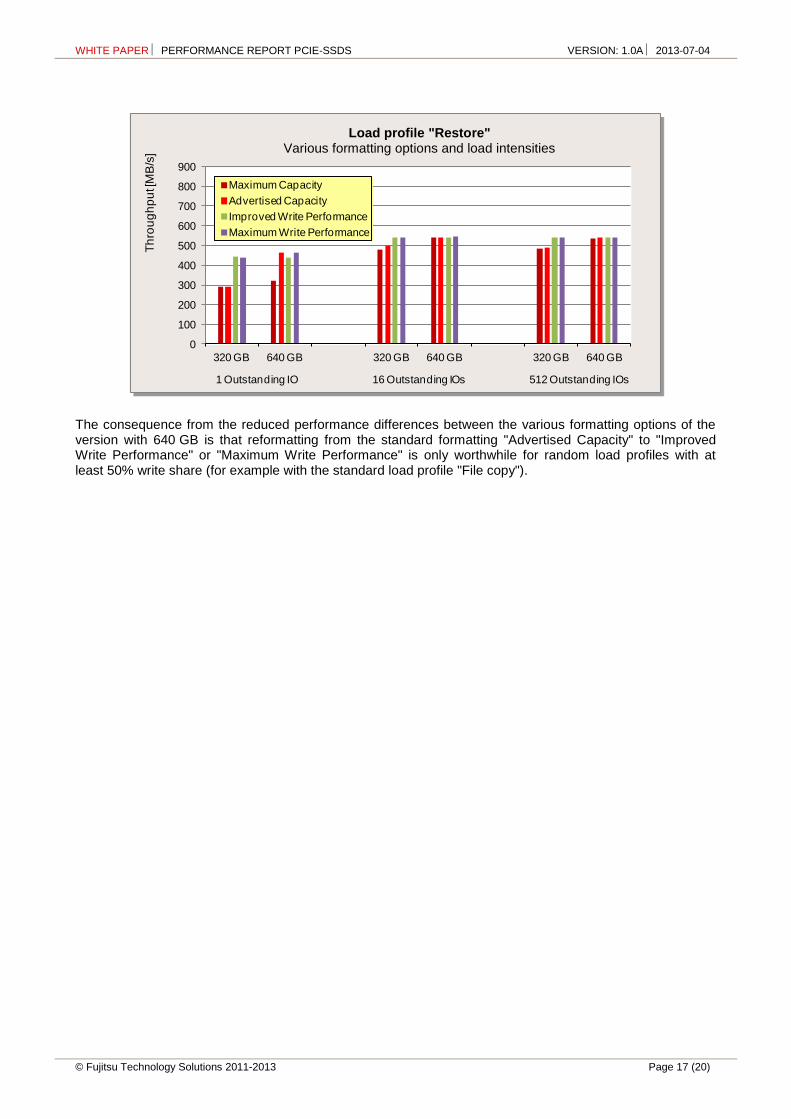
The consequence from the reduced performance differences between the various formatting options of the version with 640 GB is that reformatting from the standard formatting "Advertised Capacity" to "Improved Write Performance" or "Maximum Write Performance" is only worthwhile for random load profiles with at least 50% write share (for example with the standard load profile "File copy").
0
100
200
300
400
500
600
700
800
900
320 GB 640 GB 320 GB 640 GB 320 GB 640 GB
Th
rou
gh
pu
t [M
B/s
]
Maximum Capacity
Advertised Capacity
Improved Write Performance
Maximum Write Performance
16 Outstanding IOs 512 Outstanding IOs1 Outstanding IO
Load profile "Restore" Various formatting options and load intensities
WHITE PAPER PERFORMANCE REPORT PCIE-SSDS VERSION: 1.0A 2013-07-04
Page 18 (20) © Fujitsu Technology Solutions 2011-2013
Comparison with other storage media
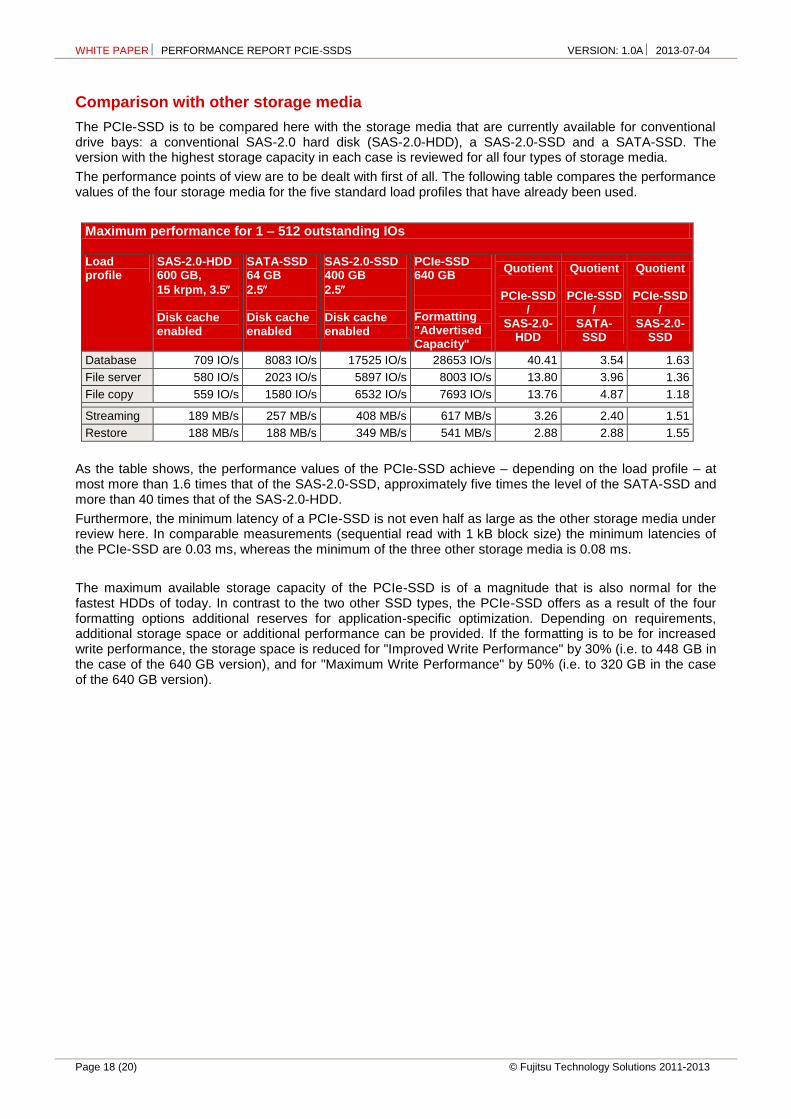
The PCIe-SSD is to be compared here with the storage media that are currently available for conventional drive bays: a conventional SAS-2.0 hard disk (SAS-2.0-HDD), a SAS-2.0-SSD and a SATA-SSD. The version with the highest storage capacity in each case is reviewed for all four types of storage media.
The performance points of view are to be dealt with first of all. The following table compares the performance values of the four storage media for the five standard load profiles that have already been used.
Maximum performance for 1 – 512 outstanding IOs
Load profile
SAS-2.0-HDD 600 GB,
15 krpm, 3.5 Disk cache enabled
SATA-SSD 64 GB
2.5 Disk cache enabled
SAS-2.0-SSD 400 GB
2.5 Disk cache enabled
PCIe-SSD 640 GB Formatting "Advertised Capacity"
Quotient
PCIe-SSD /
SAS-2.0-HDD
Quotient
PCIe-SSD /
SATA-SSD
Quotient
PCIe-SSD /
SAS-2.0-SSD
Database 709 IO/s 8083 IO/s 17525 IO/s 28653 IO/s 40.41 3.54 1.63
File server 580 IO/s 2023 IO/s 5897 IO/s 8003 IO/s 13.80 3.96 1.36
File copy 559 IO/s 1580 IO/s 6532 IO/s 7693 IO/s 13.76 4.87 1.18
Streaming 189 MB/s 257 MB/s 408 MB/s 617 MB/s 3.26 2.40 1.51
Restore 188 MB/s 188 MB/s 349 MB/s 541 MB/s 2.88 2.88 1.55
As the table shows, the performance values of the PCIe-SSD achieve – depending on the load profile – at most more than 1.6 times that of the SAS-2.0-SSD, approximately five times the level of the SATA-SSD and more than 40 times that of the SAS-2.0-HDD.
Furthermore, the minimum latency of a PCIe-SSD is not even half as large as the other storage media under review here. In comparable measurements (sequential read with 1 kB block size) the minimum latencies of the PCIe-SSD are 0.03 ms, whereas the minimum of the three other storage media is 0.08 ms.
The maximum available storage capacity of the PCIe-SSD is of a magnitude that is also normal for the fastest HDDs of today. In contrast to the two other SSD types, the PCIe-SSD offers as a result of the four formatting options additional reserves for application-specific optimization. Depending on requirements, additional storage space or additional performance can be provided. If the formatting is to be for increased write performance, the storage space is reduced for "Improved Write Performance" by 30% (i.e. to 448 GB in the case of the 640 GB version), and for "Maximum Write Performance" by 50% (i.e. to 320 GB in the case of the 640 GB version).
SPECcpu2006: integer performance PRIMERGY RX900 S2 vs. predecessor

WHITE PAPER PERFORMANCE REPORT PCIE-SSDS VERSION: 1.0A 2013-07-04
© Fujitsu Technology Solutions 2011-2013 Page 19 (20)
Measurement environment
All the PCIe-SSD measurement results discussed in this document apply for the following system configurations:
System under Test (SUT)
Models PRIMERGY RX600 S5
PRIMERGY RX600 S6
PRIMERGY RX900 S1
PRIMERGY RX900 S2
Operating system Microsoft Windows Server 2008 R2 Enterprise
Initialization of RAID arrays RAID arrays are initialized before the measurement with an elementary block size of 64 kB ("stripe size")
File system NTFS
Measuring tool Iometer 2006.07.27
Measurement data Measurement file of 32 GB
Data medium PCIe-SSD 320GB MLC (ioDrive® 320 GB)
PCIe-SSD 640GB MLC (ioDrive® 640 GB)
Administration software ioManager 2.2.3
Some components may not be available in all countries or sales regions.
WHITE PAPER PERFORMANCE REPORT PCIE-SSDS VERSION: 1.0A 2013-07-04
Page 20 (20) © Fujitsu Technology Solutions 2011-2013
Literature
PRIMERGY Systems
http://primergy.com/
PRIMERGY Performance
http://www.fujitsu.com/fts/products/computing/servers/primergy/benchmarks/
Basics of Disk I/O Performance
http://docs.ts.fujitsu.com/dl.aspx?id=65781a00-556f-4a98-90a7-7022feacc602
Fusion-io® ioDrive
® Solid-State Storage devices
Data sheet http://docs.ts.fujitsu.com/dl.aspx?id=fbbf6a0c-1210-4c23-8df7-081401e9444d
Information about Iometer
http://www.iometer.org/
Contact
FUJITSU
Website: http://www.fujitsu.com/
PRIMERGY Product Marketing
mailto:[email protected]
PRIMERGY Performance and Benchmarks
mailto:[email protected]
ioDrive is a registered trademark of Fusion-io.
All rights reserved, including industrial property rights. Delivery subject to availability; right of technical modifications reserved. No liability or warranty assumed for completeness, validity and accuracy of the specified data and illustrations. Designations may be trademarks and/or copyrights of the respective manufacturer, the use of which by third parties for their own purposes may infringe the rights of such owners. Further details are available under http://www.fujitsu.com/fts/resources/navigation/terms-of-use.html
2013-07-04 WW EN Copyright © Fujitsu Technology Solutions GmbH 2011-2013