Embed Size (px)
Citation preview
Performance Enhancement of Primary Health Care
in Andhra Pradesh:
Findings from the Pilot
Dr. Nirmala Murthy, FRHS
Dr. Paul Campbell, HSPH
Research Team: Dr. Akhila Vasan, Ms. S. Hema Latha, FRHS
Dr. Anna Prasanna, District Leprosy officer, Warangal
Foundation for Research in Health Systems
2010
Table of Contents
INTRODUCTION............................................................................................................. 3
LITERATURE REVIEW ................................................................................................ 3
OBJECTIVES ................................................................................................................... 5
METHODOLOGY ........................................................................................................... 5
PERFORMANCE REPORT CARD ............................................................................... 6
SELECTING PERFORMANCE INDICATORS ..................................................................................................... 6 PHC FUNCTIONALITY DOMAINS ................................................................................................................. 7
PEER CONSULTATION MEETINGS .......................................................................... 8
THE FIRST MEETING.................................................................................................................................... 9 Issues Identified in the First Meeting ..................................................................................................... 9 Outcome of the first meeting ..................................................................................................................10
THE SECOND MEETING ..............................................................................................................................11 Issues Identified in the Second Meeting .................................................................................................11 Outcomes of the Second meeting: ..........................................................................................................11
THE THIRD MEETING .................................................................................................................................12 Issues Identified in the Third Meeting ...................................................................................................14 Outcomes of the Third Meeting .............................................................................................................15
THE FOURTH MEETING ..............................................................................................................................15
COMMUNITY FEEDBACK ......................................................................................... 15
INVOLVING COMMUNITY LEVEL STRUCTURES ............................................................................................15
PERFORMANCE ENHANCEMENT GROUP AT PHC........................................... 18
DISCUSSIONS AT PE GROUP MEETING ........................................................................................................18
OUTCOME OF THE PILOT ........................................................................................ 20
SUMMARY AND DISCUSSION .................................................................................. 22
APPENDIX 1 ................................................................................................................... 27
Introduction
Performance enhancement techniques have been widely implemented in various sectors
and industries to improve service delivery and process performance. Yet, there has been
scarce application of these methods to public health settings, especially in a resource-
constrained setting like India. This could be due to lack of a set of evidence-based
methods or scalable interventions for quality and performance enhancement. This report
discusses a pilot intervention for performance enhancement in public health and describes
a continuum of quality improvement methods for primary health centers in Andhra
Pradesh, India. Highlighted in the report are a set of tools and techniques that have been
developed from the field to ensure that the primary health centers consistently meet the
health needs of the communities.
The government of Andhra Pradesh (A.P.) is committed to achieving a number of health
targets by the year 2012, including reducing the current infant mortality rate, maternal
mortality rate, and increasing the percentage of institutional deliveries, among others.
Achieving these targets the A.P. government has embarked upon a reform programme
called the Andhra Pradesh Health Sector Reform programme (APHSRP) that aims at
improving access to quality health services especially to the poor and the underserved
population. As part of the process, the government has realized that one of its challenges
is to improve performance of the public health system, `especially at the primary care
level.
Performance enhancement requires that strategies and actions at the most basic level of
any organization are in synch with the goals of the organization. It requires that the front
line staff is provided with feedback on their performance, including comparison of their
performance with the benchmarks based on the management information system and
make them responsible for change. It also requires a framework for team-based,
customer-focused, problem-solving that is closest to where care is provided. This
approach has been proven to facilitate gains in output and ultimately health outcome
(Fung, 2008). The government of Andhra Pradesh implemented a pilot project on
performance enhancement in primary care in Warangal District during 2009. The
organizers of this project are Family Health International, the Harvard School of Public
Health and the Foundation for Research in Health Systems.
Literature Review
Performance enhancement is commonly attempted with management information
systems designed to provide feedback to individuals responsible for program
performance as well as to their supervisors.
Report card as a tool for performance enhancement has been used in government health
systems of both industrialized and developing countries. Research has documented that
public reporting of performance facilitates increase in transparency, ultimately leading to
improved performance. Putting evidence on health services performance in the public
domain has the potential to change the provider-patient dialogue, making it difficult for
service provider to ignore problems. Performance rating also triggers quality
improvement because providers usually want to be viewed favorably by their peers
(McNamara 2006).
Wennberg (1977) documented that doctors, when shown that their practice deviated from
that of their peers, change their decision-making to conform to the practice norm. A
1989 study in New York State reported wide variations in mortality rates from cardiac
surgery from institution to institution. Following the publication of this report lower-rated
hospitals responded by improving their cardiac surgery programs, leading to a substantial
statewide reduction in mortality. Another study reported that quality improvement
activities were least frequent in hospitals that did not report performance and most
frequent among hospitals whose performance was publicly reported (McNamara 2006).
Publicizing performance reports have acted as a guide to help patients select providers
and to stimulated quality improvement among providers.
Report cards and the publication of results have also yielded positive results when used in
resource-constrained environments (www.ihi.org). In Uganda, the “Yellow Star
Program” measured performance against 35 indicators covering technical and
interpersonal factors, infrastructure, management systems, infection prevention, health
education, clinical skills and client services. Ratings were made available to the
community; facilities receiving a 100% score for two consecutive quarters were awarded
a yellow star, which was then posted prominently on the outside of each recognized
facility. The evaluation of the program showed that the average scores increased from
47% for the first quarter to 65% for the second quarter (McNamara 2006).
A tool called the “Balanced Score Card” (BSC) has been used over recent years with
positive results in war-torn Afghanistan, a difficult testing ground for any community-
based initiative. In the past ten years, numerous health service organizations have used
the BSC in much the same manner to improve their performance. In Andhra Pradesh also
a pilot study was conducted in Visakhapatnam District to study the impact of social
accountability on health system performance in which Community Scorecards (CSC)
were used to assess the performance of two PHCs by linking service providers to
community-based self-help groups to provide immediate feedback to service providers
(Misra 2007).
Objectives
To design and pilot test Performance Enhancement (PE) Program for primary health care,
using Peer Learning methods and Quality Management concepts. This program will
empower front line service providers to take corrective actions; will improve PHC-
medical officers’ management capacity and will encourage clients/community to provide
feedback and demand quality services.
Methodology
Government primary health care services are structured based on population norms. The
lowest level health facility where doctors are posted is the Primary Health Center (PHC)
for 30,000 population, with two medical officers, and a staff of male and female health
workers, health educators, laboratory technicians and peons. PHC medical officers
combine clinical duties with administrative responsibilities but have few financial
powers. District Medical and Health Officer ’s (DM&HO) office exercises control over
PHC through information based on reported data, monthly staff meetings and field visits.
The pilot was implemented in ten PHC in Warangal district of Andhra Pradesh. The
focus of this intervention was on primary health care and not on the hospital-based
curative services. The goal was to strengthen monitoring, supervision, community
participation for performance enhancement of PHC, using assessment tools like report
cards and stakeholder assessments and community feedback to the providers.
PHC for the pilot were selected in consultation with the District Medical and Health
Officer (DM&HO). Since Warangal has five sub divisions, two PHCs were selected from
each subdivision; five of them were of 24X7 type (PHC with more staff, 30 beds and
providing 24X7 service), and the other five were Day-PHC (PHC having one-two
medical officers, providing services from 9 am to 5 pm and 4 beds for observation
purpose but no in-patient service). The selected PHC are listed below.
Ten PHC selected for the Pilot
Subdivision PHC Name/Type Est. Population
Narasempeth Duggondi (24X7) 31381
Keshavapur (Day) 18833
Warangal Stn. Ghanpur (24X7) 45471
Damera (Day) 28925
Mulugu Shyampet (24X7) 47940
Raiparthy(P) (Day) 63810
Mahaboobabad Thorrur (24X7) 75482
Nekkonda (Day) 34968
Jangaon Palakurthy (24X7) 62329
Komalla (Day) 48957
In the ten PHCs we tested effectiveness of four tools in terms of their impact on
improving PHC performance. These tools were:
1. Performance Report Card
2. Peer Consultation meetings
3. Clients/community feedback on PHC performance
4. Performance Enhancement Group at PHC
This report describes these tools, their implementation in 10 pilot PHCs in Warangal
districts of Andhra Pradesh and the impact on PHC performance.
Performance Report Card
Performance Report Card presented PHCs’ quarterly performance on selected indicators
and PHCs’ functionality assessment carried out by PHC staff (medical officers, health
workers and administrative staff) on selected dimensions, using a structured tool.
Selecting Performance Indicators
While selecting indicators for the Report Card, two principles were kept in mind namely,
(i) the report should be concise and not go beyond one page and (ii) the required data are
already being collected. The two obvious sources of such indicators were the National
Rural Health Mission (NRHM) report being sent to Government of India every month,
and the State’s Form-B, which had many common data elements as the NRHM report but
also others like the numbers of outpatient, inpatient and patient seen at 104 mobile units,
which were not in the NRHM report.
We started the selection process with about 25 possible indicators to cover various public
health programs. From the initial list, a few were dropped because data for them was not
available with the health departments (i.e. number of children weighed, children
malnourished, water samples tested, school children examined). Child nutrition data was
with the Integrated Child Development Scheme (ICDS) program implemented by the
Women& Child Welfare Department; water & sanitation data was with the Rural
Development department and the DM&HO was not confident of getting them from these
sister departments, notwithstanding of their health implications. Some other indicators
were updated once in five years (i.e. contraceptive prevalence rate, households with
sanitation and safe drinking water), hence could not be reviewed quarterly. After
removing these indicators, we finalized the initial list of 15 indicators in consultation with
district health officers (table 1). The list could be modified over time as deemed
necessary.
Table 1 Performance Indicators
Patient Care
1 Number of outpatients/per day/medical officer
2 Number of outpatients seen at 104 /day
3 Number of inpatients per month/ per bed
4 Number of blood slides examined for malaria/ 100 outpatients
5 Number of pathology tests done/100 outpatients
Mother Care
6 Number of pregnancies registered / 1000 population
7 Number of ANC provided 3 ANC visits and 100 IFA tablets
8 Percent institutional deliveries in the area
9 Number of deliveries at PHC building/month
10 Percent delivered women provided 2 postpartum visits by health worker
Child Care
11 Number of children fully immunized / expected number children
Family Planning and Reproductive Health
12 Number of sterilizations conducted / sterilization target
13 Number of spacing method acceptors/spacing method target
15 Number RTI/STI cases treated /per 100 women of reproductive ages
ANC= Antenatal Cases ; Fully Immunized – received BCG, 3 doses of DPT, 3 doses of
Polio vaccine and Measles vaccine.
The Report Card showed comparison between PHC’s performance and the “best”
performance in the district and between actual and the expected performance, on each
indicator. For example, if a PHC was expected to serve about 50 outpatients per day per
doctor as a norm and the best observed performance of a PHC was 150 patients per day
then PHC Report Card would show its own performance vis-à-vis the norm and vis-à-vis
the best performer. The idea behind this comparison was to show to the PHC doctors the
gap between his/her performance and the norm; and encourage him/her to aim for the
“best performance”.
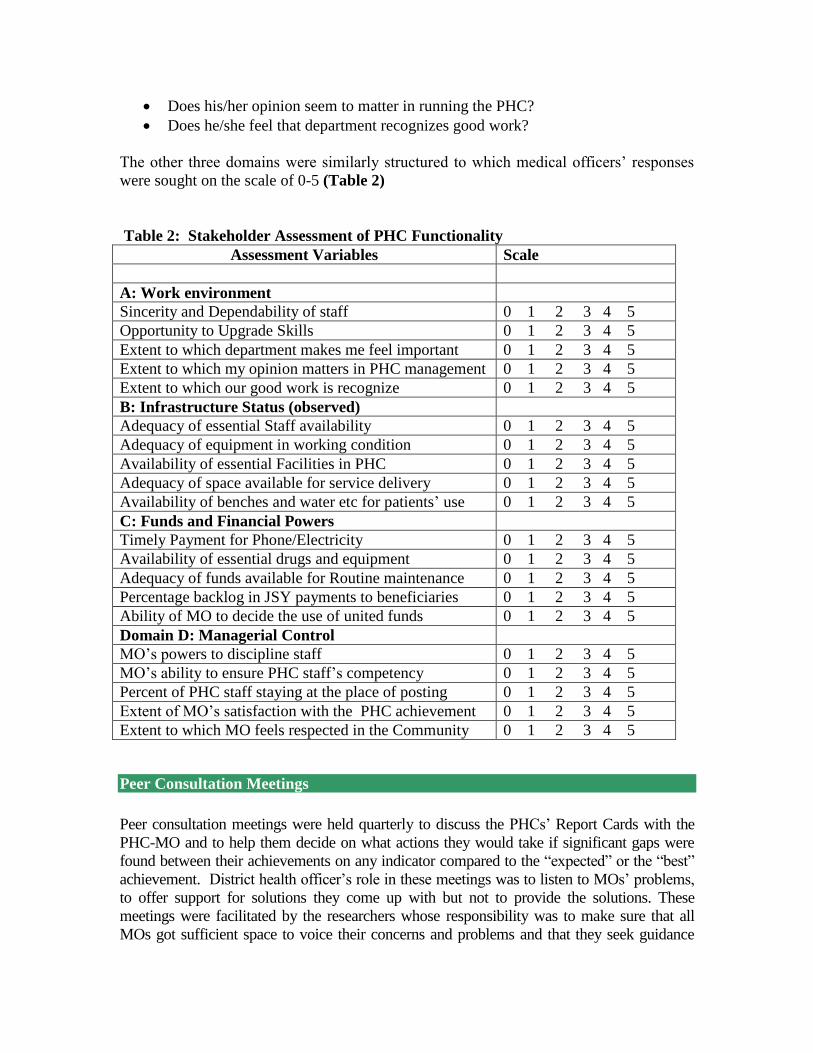
PHC Functionality Domains
The second part of the report card contained PHC staff’s assessment of PHC
functionality. The functionality assessment tool contained four domains: (1) work
environment, (2) infrastructure adequacy, (3) fund availability and (4) managerial control
of medical officer. In each domain, five questions were listed to assess that domain. For
example, under the work environment domain, questions listed were:
Does the MO find his/her staff sincere and dependable?
Does the department provide opportunities for skill development?
Does the health department make him/her feel important?
Does his/her opinion seem to matter in running the PHC?
Does he/she feel that department recognizes good work?
The other three domains were similarly structured to which medical officers’ responses
were sought on the scale of 0-5 (Table 2)
Table 2: Stakeholder Assessment of PHC Functionality
Peer Consultation Meetings
Peer consultation meetings were held quarterly to discuss the PHCs’ Report Cards with the
PHC-MO and to help them decide on what actions they would take if significant gaps were
found between their achievements on any indicator compared to the “expected” or the “best”
achievement. District health officer’s role in these meetings was to listen to MOs’ problems,
to offer support for solutions they come up with but not to provide the solutions. These
meetings were facilitated by the researchers whose responsibility was to make sure that all
MOs got sufficient space to voice their concerns and problems and that they seek guidance
Assessment Variables Scale
A: Work environment
Sincerity and Dependability of staff 0 1 2 3 4 5
Opportunity to Upgrade Skills 0 1 2 3 4 5
Extent to which department makes me feel important 0 1 2 3 4 5
Extent to which my opinion matters in PHC management 0 1 2 3 4 5
Extent to which our good work is recognize 0 1 2 3 4 5
B: Infrastructure Status (observed)
Adequacy of essential Staff availability 0 1 2 3 4 5
Adequacy of equipment in working condition 0 1 2 3 4 5
Availability of essential Facilities in PHC 0 1 2 3 4 5
Adequacy of space available for service delivery 0 1 2 3 4 5
Availability of benches and water etc for patients’ use 0 1 2 3 4 5
C: Funds and Financial Powers
Timely Payment for Phone/Electricity 0 1 2 3 4 5
Availability of essential drugs and equipment 0 1 2 3 4 5
Adequacy of funds available for Routine maintenance 0 1 2 3 4 5
Percentage backlog in JSY payments to beneficiaries 0 1 2 3 4 5
Ability of MO to decide the use of united funds 0 1 2 3 4 5
Domain D: Managerial Control
MO’s powers to discipline staff 0 1 2 3 4 5
MO’s ability to ensure PHC staff’s competency 0 1 2 3 4 5
Percent of PHC staff staying at the place of posting 0 1 2 3 4 5
Extent of MO’s satisfaction with the PHC achievement 0 1 2 3 4 5
Extent to which MO feels respected in the Community 0 1 2 3 4 5
from each other, especially from the “high performers”.
Prior to the meeting each MO received his/her report card to:
Examine if the data presented in the Card was correct
Identify indicators on which his/her PHC fell too short of the expected level
Examine how well his/her PHC performed vis-à-vis the “Best” and why
What actions he/she would need to take to enhance PHC’s performance
The First Meeting
The first meeting of the 10 pilot PHC MOs was organized in July 2009. At this meeting,
the researchers explained to MO the project design and its objectives and presented to
them the baseline Report Card, based on the 2008-09 data and findings from PHC
Functionality assessment that the researchers had carried out before initiating the project.
Examining their own report cards, medical officers first discussed the appropriateness of
the indicators, correctness of the reported data, and the rational for the expected levels of
performance against which their performance was being evaluated.
Issues Identified in the First Meeting
Incongruous Data: In case of two PHCs, the inpatient-outpatient data obtained from the
DM&HO office did not match with what MOs had reported. One MO insisted that she
was treating 60-70 outpatients per day but her Report Card showed “0” outpatients. How
was that possible? Improving accuracy of data reporting became a priority problem at
least for 2 PHCs.
Inappropriate Evaluation criteria: Other contentious issues were “bed utilization” and
“number of deliveries conducted” at Day-PHCs. MOs from 5 Day-PHCs that worked
from 9 am to 5 pm argued that they should not be evaluated on bed utilization since they
were not expected to admit inpatients. Four beds provided in those PHC were for patient
observation and not for inpatient care, including deliveries. After much discussion among
themselves and with the DMHO about the government’s policy of providing delivery
services at each PHC, they agreed to accept a norm of 5 deliveries per month for 8-hour
PHC and 25 deliveries per month for 24X7 PHC.
Inadequate Staff: One MO observed that my lab performance was low because there is
no laboratory technician (LT) in the PHC; that indicator should be used only in PHCs that
have LT is posted. This discussion helped the researchers to explain to MOs that the
purpose of the Report Card was not to evaluate PHC but to identify areas where PHC
functioning needed improvement and plan actions accordingly. If a PHC for example, is
not able to undertake laboratory tests because LT is not in position, then expected actions
is to appoint a LT on contract or train a health worker to undertake basic pathology tests.
Outcome of the first meeting
After such discussions, MOs selected the following actions for implementation in their
respective PHCs:
Increase the number of lab tests in the PHC, particularly number of malaria tests
Improve communication with patients and spend more time interacting with them
Regularly visit sub-centers to improve immunization and ANC registration rates
Conduct at least 5 deliveries per month in the PHC
Improve data recording at the DM&HO office
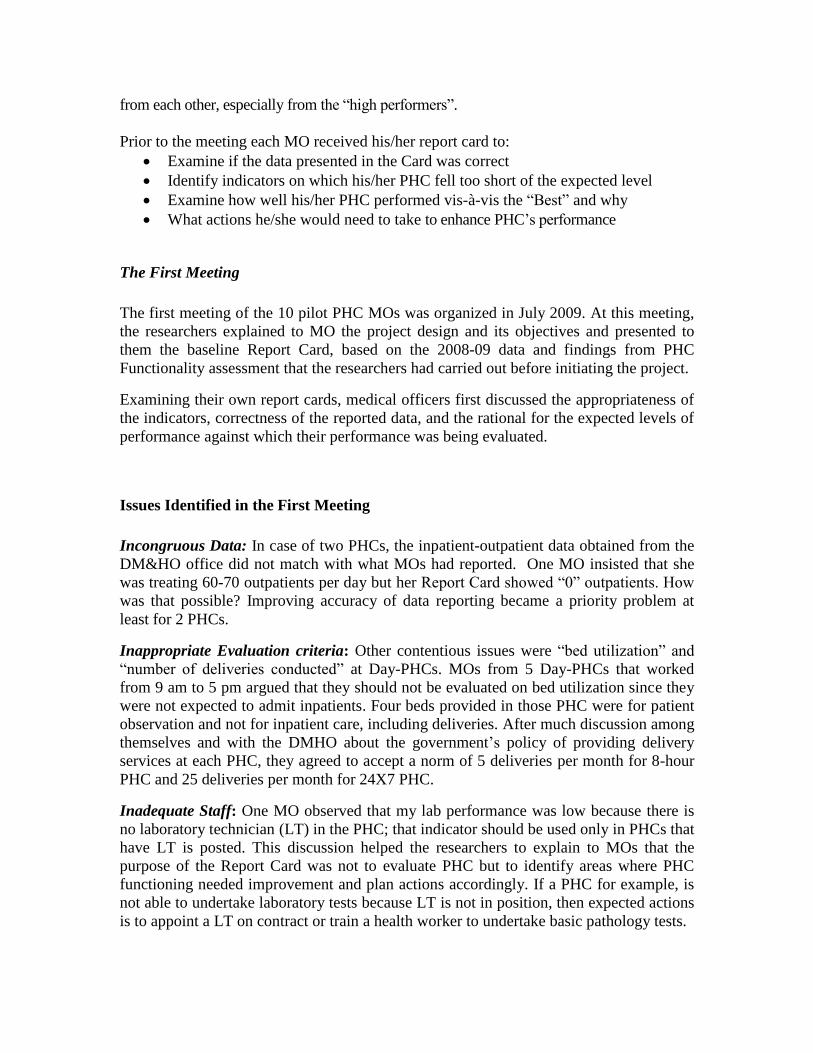
To assess the extent of mismatch between the data reported by PHC and recorded at the
district level, researcher collected data on 15 performance indicators from the pilot PHCs
and compared them with the data provided by the DMHO office. It showed only 43
percent match; 10 percent match on the clinical care data and 90 percent on MCH data
(Table 3). This finding was presented in the second Peer-consultation meeting.
Table 3: Number of times PHC data matched with data from DMHO office (N=10)
Indicator No. of PHC where reported data matched
with District records
1. OPD Attendance 1 / 10
2. IP admissions 1/10
3. Malaria slides tested 6/10
4. Lab tests conducted 1/10
5. ANC registration 7/10
6. Early ANC Registration 6 /10
7. Total deliveries in PHC area 9/10
8. Institutional deliveries 8/10
9. Deliveries in Govt. institutions 8/10
10. Deliveries in the PHC 8/10
11. Conducted 2 PP visits 0/10
12. Full immunization (12- 23 months) 9/10
13. Sterilization acceptors 0/10
14. Spacing method acceptors 0/10
15. Treatment for RTI 4/10
Total matches (Max 150) 68/150
% Matches 43%
The Second Meeting
In the second peer consulting meeting, eight out of ten district health program officers
remained present compared to only two in the first meeting. Their presence helped the
participants identify problems common to all PHCs.
Issues Identified in the Second Meeting
Exaggeration in Reported Performance: One of the issues the district level program
officers brought up for discussion was that health workers often exaggerated the work
done and MOs allowed them to do so. For example, while health workers reported 100
percent children fully immunized and 100 percent delivered women were visited during
the post partum period, independent survey (DLHS-3) had shown only 43 percent
children fully immunized and 68 percent delivered women had received post partum
visit. Health workers rarely reported infant or maternal deaths and practically never
reported epidemics outbreak. Those events were first reported in newspapers and by local
leaders.
Lack of Community Involvement: District program officers brought up the problem of
lack of community involvement in PHC functioning, as was envisaged under the NRHM.
At the mention of community involvement there was a palpable hesitation among MO.
They were reluctant to get involved with local leaders and their political agenda but were
open to the idea of involving self help group leaders.
Non-functional Labs: Two doctors sought district program officer’s guidance on how to
make their laboratories functional. Though 7 out of 10 PHC had lab technicians their
productivity was low because doctors were not holding them accountable, one of the
district officers said. MOs were not using lab tests and when needed were referring
patients to private laboratories.
Outcomes of the Second meeting:
Medical officers present at the meeting agreed on certain steps needed to improve quality
of data:
Health workers should get training in data recording and reporting
Health workers’ reports to be scrutinized
supervisors should undertake concurrent evaluation to curb workers tendency to
report exaggerated data
Introduce a monthly report for laboratory technicians to increase their
accountability
The Third Meeting
The third meeting was held in December 2009. Nine out of ten medical officers and eight
district program officers were present at this meeting. Also the principal health secretary
attended this meeting since he wanted to learn about the pilot - its usefulness and
scalability. Focus of this meeting therefore was on informing the principal health
secretary about actions taken and initial results obtained under the Pilot.
Action 1: Steps taken to improve quality of reported data and initial results
A two-member researcher team had visited all 10 pilot PHCs and met with functionaries who
filled the Form- B and NRHM forms and to explain to them how important really this job was.
At each place, the MO told them that the data they entered represented their PHC; any mistake
they made reflected badly on their medical officer in front of district and state level officers.
Therefore they must do this work carefully. Then the research team found out how well the
functionaries understood the indicators and how well they maintained the required data. To
help them understand the data flow, the research team created a chart showing definition
of each indicator, who maintains the required data, where it is maintained and in what
form. This tool proved valuable to identify specific gaps in data maintenance and
reporting.
During this exercise the researchers found multitude of definitions of different indicators.
They came across five definitions of “eligible couples sterilized’ and found incorrect
definitions being prevalent about ‘outpatients’, ‘full ANC’ and ‘PP visits’. For example,
when asked, what is meant by “conducted 2 PP visits” one supervisor replied “the mother who
visits the PHC after her second child”. No one knew the correct definition namely “mothers
to whom worker had visited two times within 10 days of their delivery”.
When the worker who was filling the report did not know what data to fill, he left them blank
hoping that the supervisors to make the corrections. Health Supervisors were also not much
better in their understanding so they passed on that responsibility to the medical officer. Most
MO said they just signed the reports that their supervisors forwarded without checking
anything. The research spent some time in creating:
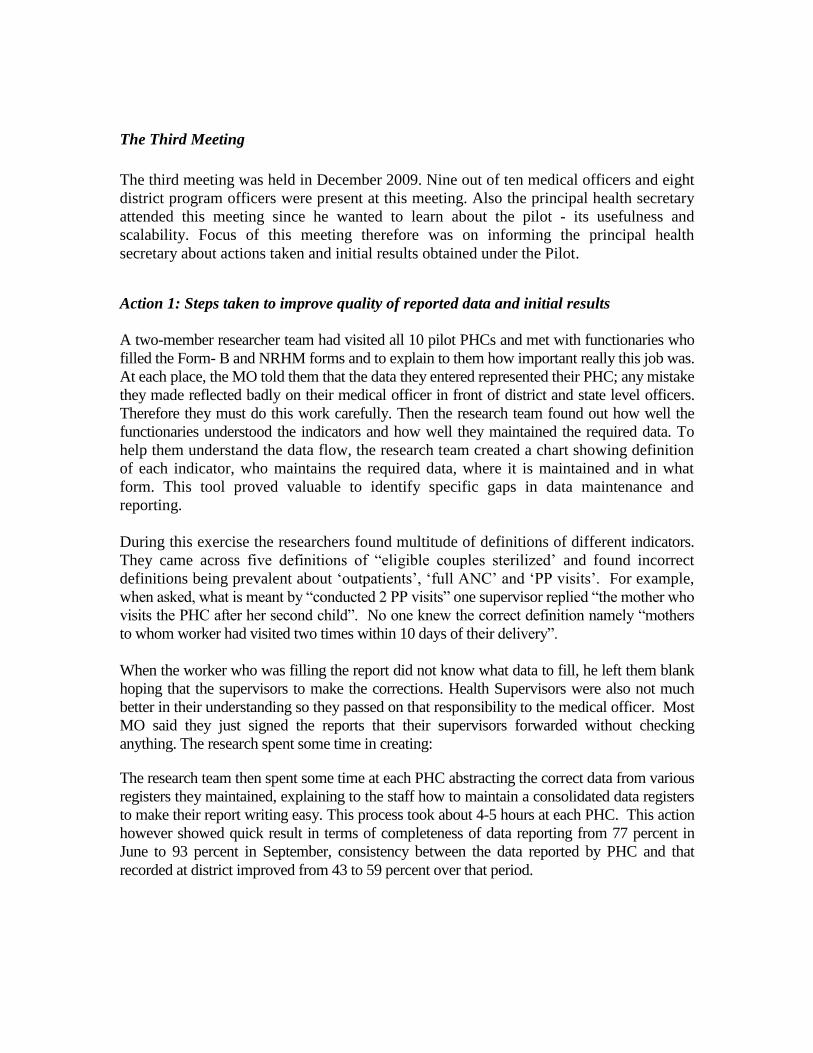
The research team then spent some time at each PHC abstracting the correct data from various
registers they maintained, explaining to the staff how to maintain a consolidated data registers
to make their report writing easy. This process took about 4-5 hours at each PHC. This action
however showed quick result in terms of completeness of data reporting from 77 percent in
June to 93 percent in September, consistency between the data reported by PHC and that
recorded at district improved from 43 to 59 percent over that period.
0
10
20
30
40
50
60
70
80
90
100
Completeness of reporting
data
Data matching with PHC and
district office
June
September
Another dimension of quality is authenticity of data. Since performance improvement can
be expected only if the reported data was also authentic, the DMHO had asked the
researchers to develop some tools to assess the authenticity of the reported data. The
research team developed a beneficiary tracking system (BTS) by using concepts of Lot
Quality Assessment (LQA). In LQA, service data is gathered independently from a small
sample of beneficiaries and cross checked against the records maintained by health
worker. Researchers interviewed Self-Help Group members who had delivered a baby in
previous 3 months and traced their records in the workers’ registers to compare mothers’
responses with the recorded data for 6 services.
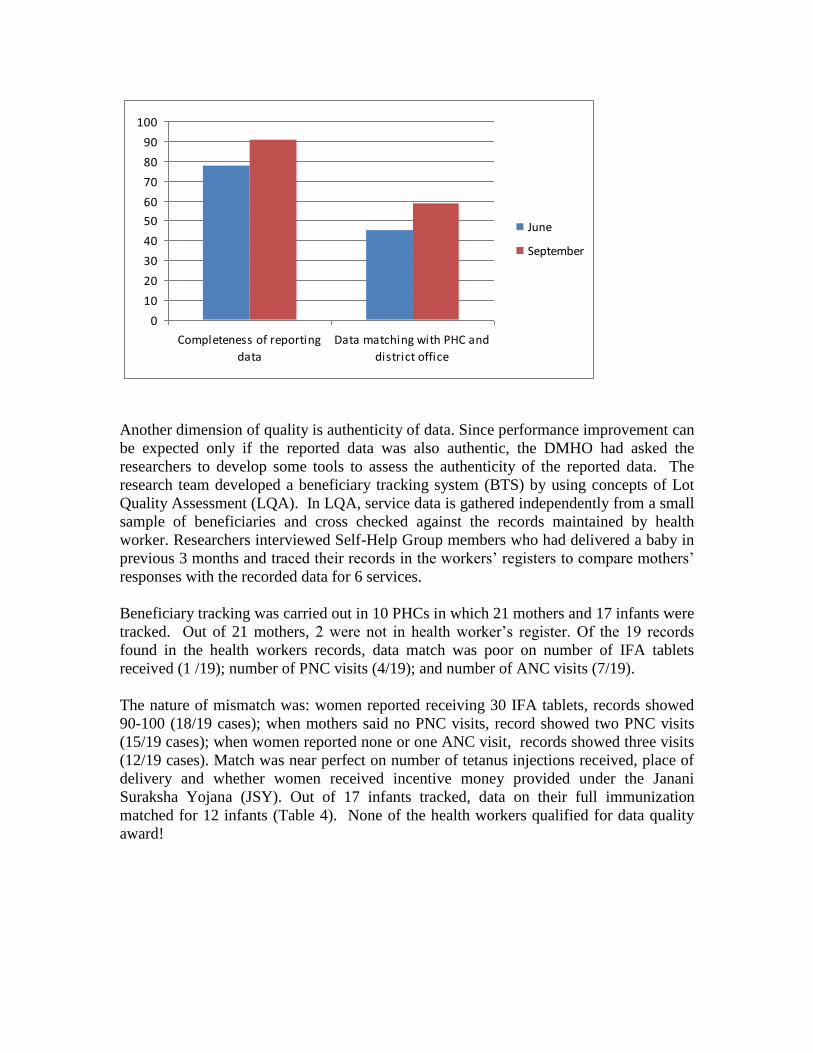
Beneficiary tracking was carried out in 10 PHCs in which 21 mothers and 17 infants were
tracked. Out of 21 mothers, 2 were not in health worker’s register. Of the 19 records
found in the health workers records, data match was poor on number of IFA tablets
received (1 /19); number of PNC visits (4/19); and number of ANC visits (7/19).
The nature of mismatch was: women reported receiving 30 IFA tablets, records showed
90-100 (18/19 cases); when mothers said no PNC visits, record showed two PNC visits
(15/19 cases); when women reported none or one ANC visit, records showed three visits
(12/19 cases). Match was near perfect on number of tetanus injections received, place of
delivery and whether women received incentive money provided under the Janani
Suraksha Yojana (JSY). Out of 17 infants tracked, data on their full immunization
matched for 12 infants (Table 4). None of the health workers qualified for data quality
award!
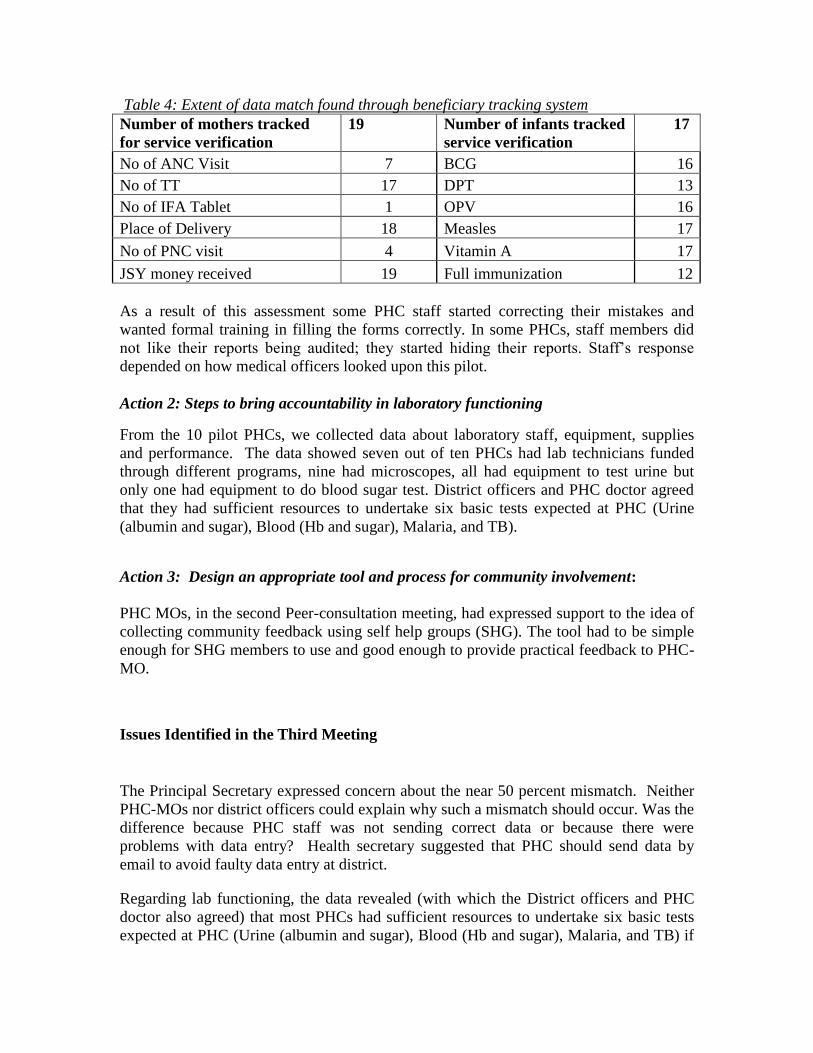
Table 4: Extent of data match found through beneficiary tracking system
Number of mothers tracked
for service verification
19 Number of infants tracked
service verification
17
No of ANC Visit 7 BCG 16
No of TT 17 DPT 13
No of IFA Tablet 1 OPV 16
Place of Delivery 18 Measles 17
No of PNC visit 4 Vitamin A 17
JSY money received 19 Full immunization 12
As a result of this assessment some PHC staff started correcting their mistakes and
wanted formal training in filling the forms correctly. In some PHCs, staff members did
not like their reports being audited; they started hiding their reports. Staff’s response
depended on how medical officers looked upon this pilot.
Action 2: Steps to bring accountability in laboratory functioning
From the 10 pilot PHCs, we collected data about laboratory staff, equipment, supplies
and performance. The data showed seven out of ten PHCs had lab technicians funded
through different programs, nine had microscopes, all had equipment to test urine but
only one had equipment to do blood sugar test. District officers and PHC doctor agreed
that they had sufficient resources to undertake six basic tests expected at PHC (Urine
(albumin and sugar), Blood (Hb and sugar), Malaria, and TB).
Action 3: Design an appropriate tool and process for community involvement:
PHC MOs, in the second Peer-consultation meeting, had expressed support to the idea of
collecting community feedback using self help groups (SHG). The tool had to be simple
enough for SHG members to use and good enough to provide practical feedback to PHC-
MO.
Issues Identified in the Third Meeting
The Principal Secretary expressed concern about the near 50 percent mismatch. Neither
PHC-MOs nor district officers could explain why such a mismatch should occur. Was the
difference because PHC staff was not sending correct data or because there were
problems with data entry? Health secretary suggested that PHC should send data by
email to avoid faulty data entry at district.
Regarding lab functioning, the data revealed (with which the District officers and PHC
doctor also agreed) that most PHCs had sufficient resources to undertake six basic tests
expected at PHC (Urine (albumin and sugar), Blood (Hb and sugar), Malaria, and TB) if
they insisted on improving this service because in addition to lab technicians even female
health workers or their supervisors could carry out basic laboratory tests. The issue was
lack of monitoring of lab technicians; they were not required to report their performance
as other PHC functionaries were.
Community feedback tool (described later in the paper) had been developed and pilot
tested in one PHC. Medical officers had found the results useful.
Outcomes of the Third Meeting
Initiate a laboratory performance report to be sent by lab technician from each
PHC
District Malaria officer was designated as officer in-charge for reporting and
improving of lab functioning
Set-up quality enhancement group at PHC involving health staff and community
members to take act on the community feedback.
The Fourth Meeting
The fourth meeting was held in June, 2010. Only six medical officers and eight district
level program officers attended the meeting. The meeting was to discuss their experience
with the pilot, the actions they took as a result, and changes in their performance that
could directly or indirectly attributable to the pilot. They said that selecting a few key
performance indicators and training PHC personnel had improved regularity and
completeness of reporting. They found community feedback helped them to focus on
some important actions like ensuring that women received JSY benefits on time.
Community Feedback
Involving community level structures
In the second peer-consultation meeting PHC-MO had agreed to pilot test community
feedback and to involve community members in PHC activities. District administrators were
interested in implementing social audit in the health department because it was working well
for the National Rural Employment Guarantee (NREG) Scheme. The health department was
not in favor of social audit for many good reasons.
The concept of getting client/community feedback was acceptable to health officers because it
was incorporated in the NRHM but AP had not implemented it. Since MO were comfortable
about working with women’s SHG groups we decided to involve Self Help Groups,
known as Indira Kranti Patham (IKP) groups in Andhra Pradesh, in providing community
feedback.
IKP is federated structure of self help groups. In each village there are about 10-20 self
help groups (SHG) under one samaikya, depending on the size of the village. Each group
has 15-20 members. At least one woman from each household is a member of SHG.
Special attention is paid in forming SHG of the poorest of the poor women, known as
Nirupeda Groups, to ensure that the poor are not left out. SHG are mainly focused on
savings and credit for improving income of their members. SHG maintain good relation
with PHCs, PHC doctors take SHG help to carry health messages to their members and to
organize village level health activities. However, SHG members have limited time to
devote to health related activities. They also have the reputation of being hard nosed
about financial matters and do not hesitate to dismiss members for non-payment or
delayed payments of dues.
The other village level structure we considered was Health and Sanitation Committee
(VHSC), promoted under NRHM. VHSCs have been formed in all gram panchayat
villages through a government order. Committees are headed by the Sarpanch, their
members include mothers’ groups, ANM and ASHA, and they receive grants of rupees
10,000/year from the government for undertaking community level health actions and
community monitoring. This analysis suggested that both, VHSC and IKP should be
involved in gathering and using community feedback. However, since the state
government had not yet activated the VHSC, we decided to work with the IKP structure
for community feedback until VHSC are functional.
Creating Community feedback tool
The role IKP was to: (i) Provide authentic Client Feedback on service quality; (ii) help
identify problems affecting health status of community and (iii) mobilize community
support to PHC in resolving those problems.
Researchers developed a simple tool to get SHG members feedback about quality and
utilization of PHC services (Table 5). The tool was tested in poor women’s SHG, called
Nirupeda groups. Questions were administered during their routine monthly meetings
held to update members’ financial transactions such as savings, loans and repayments.
Group leaders asked members to answer the following questions by raising hands.
Feedback on maternal and child care services was obtained from SHG members, who had
recently delivered a baby or had a one year old child. The tool was tried out in 12-15
Nirupeda (very Poor women’s) SHG under each PHC, from 1563 women members of
141 Nirupeda groups. Their feedback was presented earlier in the paper as Table 5. Book
keepers of the SHG were trained to collect the feedback, so they could repeat this
exercise every quarter, with different SHG and present those findings .
Initially, researchers had included two more questions in the tool, asking women if they
were aware of any maternal or infant death that had occurred in the village. To take care
of the same event being reported by many groups, women were asked to give more
details about those deaths. In 141 groups interviewed we obtained information on 2
maternal deaths and 5 likely infant deaths (one of those could have been a stillbirth),
which the health staff promptly dismissed as “not reliable information”. Hence those
questions were dropped from the final version of the tool.
Researchers developed a simple tool to get SHG members feedback about quality and
utilization of PHC services (Table 5). The tool was tested in poor women’s SHG.
Questions were administered during their routine monthly meetings. Group leaders asked
members to answer the following questions by raising hands. Initially, the researchers
had included two more questions in the tool asking if women were aware of any maternal
or infant death that had occurred in the village and obtain some details about those
deaths. In 141 group interviews we obtained information on 2 maternal deaths and
possibly 2 infant deaths, which the health staff promptly dismissed as “not reliable”.
Hence those questions were dropped from the final version of the tool.
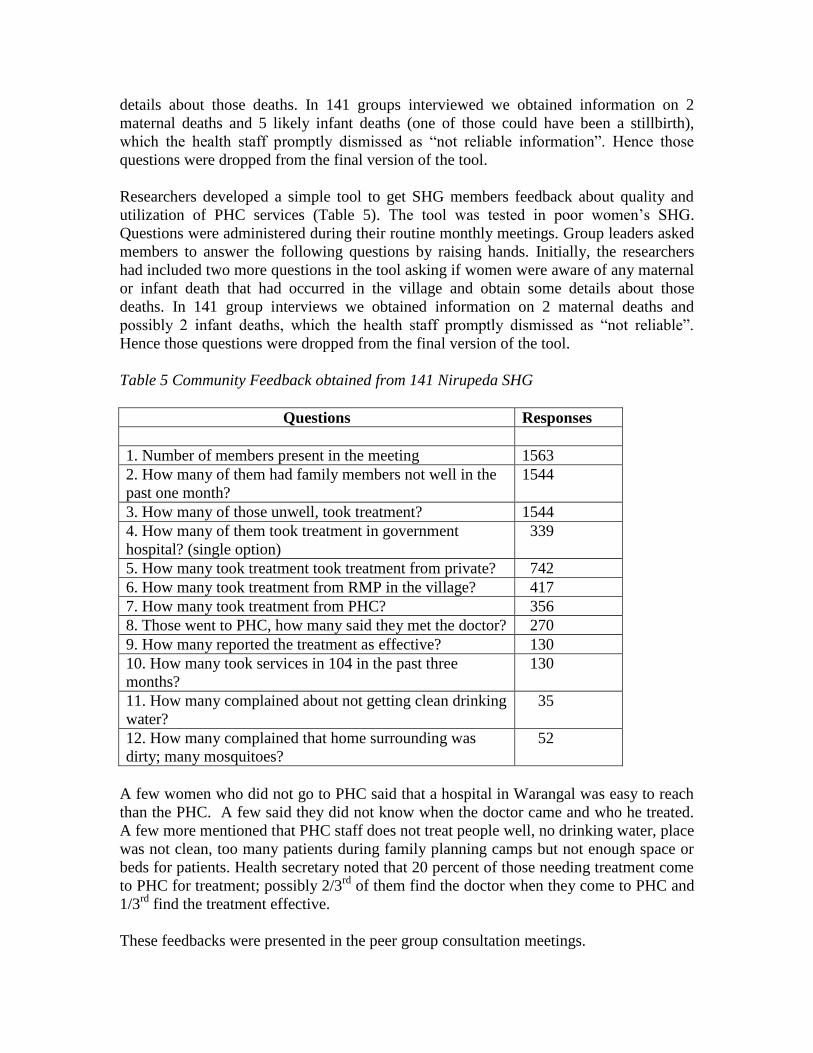
Table 5 Community Feedback obtained from 141 Nirupeda SHG
Questions Responses
1. Number of members present in the meeting 1563
2. How many of them had family members not well in the
past one month?
1544
3. How many of those unwell, took treatment? 1544
4. How many of them took treatment in government
hospital? (single option)
339
5. How many took treatment took treatment from private? 742
6. How many took treatment from RMP in the village? 417
7. How many took treatment from PHC? 356
8. Those went to PHC, how many said they met the doctor? 270
9. How many reported the treatment as effective? 130
10. How many took services in 104 in the past three
months?
130
11. How many complained about not getting clean drinking
water?
35
12. How many complained that home surrounding was
dirty; many mosquitoes?
52
A few women who did not go to PHC said that a hospital in Warangal was easy to reach
than the PHC. A few said they did not know when the doctor came and who he treated.
A few more mentioned that PHC staff does not treat people well, no drinking water, place
was not clean, too many patients during family planning camps but not enough space or
beds for patients. Health secretary noted that 20 percent of those needing treatment come
to PHC for treatment; possibly 2/3rd
of them find the doctor when they come to PHC and
1/3rd
find the treatment effective.
These feedbacks were presented in the peer group consultation meetings.
Performance Enhancement Group at PHC
At each PHC, PE group was formed to help PHC staff initiate “actions” identified based on
the Report Card and the Client Feedback. PE group is a platform for involving community
representatives in the PHC program, in a supportive and non-threatening role. PE Group
included PHC staff (medical officer, supervisors and workers) and community
representatives (members of IKP and VHSC, panchayat members, ANM, ASHA).
Community representatives were selected from the categories of Mandal Samakya Leader,
village Samakya Leader and VHSC women member.
MOs were initially reluctant to invite community members to PE meetings to be held at
PHC. Some district officer did not support the idea of creating a new meeting. They
suggested that instead of having PE meetings, PHC staff meeting should be held
regularly. In that meeting they could discuss community’s feedback and take actions.
The additional DMHO observed, “from the time ASHA meetings have started, PHC staff
meetings have almost disappeared; we attend ASHA meetings but ignore the PHC staff
meetings in which PHC performance, staff problems and health situation in the area can
be discussed at length and actions taken”. He requested the DMHO to revive the staff
meetings; community members could add little value to PHC Performance, he opined.
Fortunately, his was the minority view.
Most doctors felt good about receiving feedback and having women members in the PE
groups. They hoped that if SHG members were sensitized about health matters they will
put pressure on PHCs and gram panchayats to fulfill their respective responsibilities
To select community representatives to be invited to serve on the PE Committee, researchers
visited each village to identify Mandal Samakya Leader, village Samakya Leader and VHSC
women member and to tell them about their role in the PE committee if they were selected and
were agreeable to serve on the committee. If they agreed, their names were given to the
medical office to select from. The idea behind this exercise was to assure the PHC staff that
they could chose members who they knew to be responsive and respectful of them and could
keep out troublesome elements if they wished to.
Not all potential community representatives were interested in serving on this committee.
Some demanded money to be a member of this committee. We selected only those who
agreed to be in the committee even after knowing that it will be voluntary involvement to help
PHC improve services.
Discussions at PE Group meeting
PE group meetings took place in nine out of ten Pilot PHCs. In one PHC, PE group was not
formed because the medical officer was on un-official leave for a considerable amount of
time, protesting the interference by rival political groups in the PHC functioning. This PHC
was particularly at risk of political interference as it was a tribal PHC, nearly 50 kilometers
away from the district head quarter where state or district officers hardly ever visited and the
medical officer belonged to the local tribal, living and working in the PHC, who also had
political ambitions.
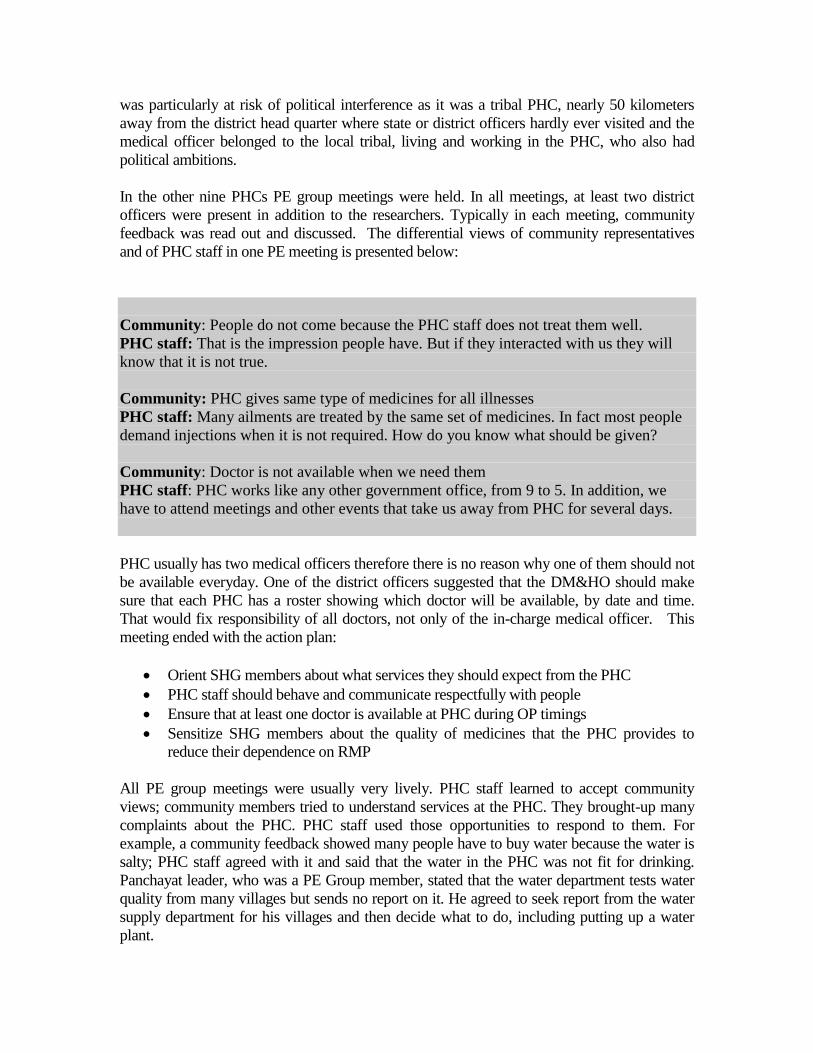
In the other nine PHCs PE group meetings were held. In all meetings, at least two district
officers were present in addition to the researchers. Typically in each meeting, community
feedback was read out and discussed. The differential views of community representatives
and of PHC staff in one PE meeting is presented below:
Community: People do not come because the PHC staff does not treat them well.
PHC staff: That is the impression people have. But if they interacted with us they will
know that it is not true.
Community: PHC gives same type of medicines for all illnesses
PHC staff: Many ailments are treated by the same set of medicines. In fact most people
demand injections when it is not required. How do you know what should be given?
Community: Doctor is not available when we need them
PHC staff: PHC works like any other government office, from 9 to 5. In addition, we
have to attend meetings and other events that take us away from PHC for several days.
PHC usually has two medical officers therefore there is no reason why one of them should not
be available everyday. One of the district officers suggested that the DM&HO should make
sure that each PHC has a roster showing which doctor will be available, by date and time.
That would fix responsibility of all doctors, not only of the in-charge medical officer. This
meeting ended with the action plan:
Orient SHG members about what services they should expect from the PHC
PHC staff should behave and communicate respectfully with people
Ensure that at least one doctor is available at PHC during OP timings
Sensitize SHG members about the quality of medicines that the PHC provides to
reduce their dependence on RMP
All PE group meetings were usually very lively. PHC staff learned to accept community
views; community members tried to understand services at the PHC. They brought-up many
complaints about the PHC. PHC staff used those opportunities to respond to them. For
example, a community feedback showed many people have to buy water because the water is
salty; PHC staff agreed with it and said that the water in the PHC was not fit for drinking.
Panchayat leader, who was a PE Group member, stated that the water department tests water
quality from many villages but sends no report on it. He agreed to seek report from the water
supply department for his villages and then decide what to do, including putting up a water
plant.
Community representative on their part appreciated doctors for the services they provided
and offered help to create positive image of PHC in their areas. District officers who
attended these meetings wanted PHC doctors to ensure that community representatives
attended PE group meetings in adequate numbers so that their voice does not get ignored.
Outcome of the Pilot
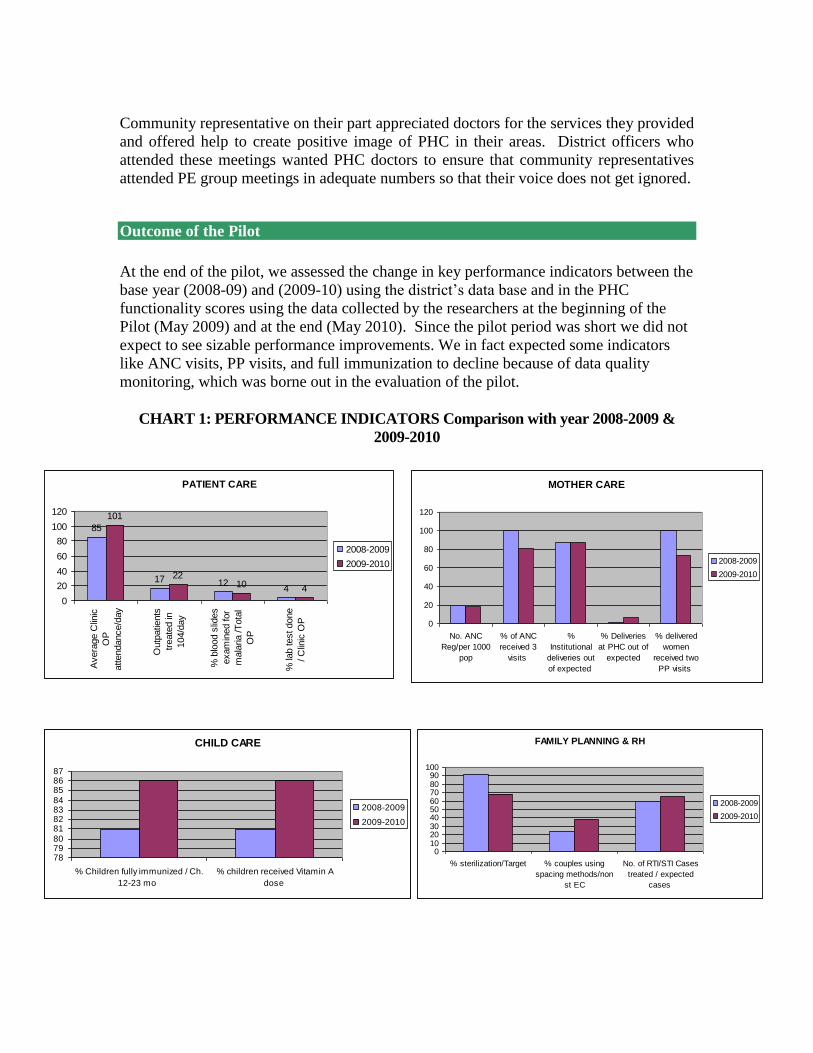
At the end of the pilot, we assessed the change in key performance indicators between the
base year (2008-09) and (2009-10) using the district’s data base and in the PHC
functionality scores using the data collected by the researchers at the beginning of the
Pilot (May 2009) and at the end (May 2010). Since the pilot period was short we did not
expect to see sizable performance improvements. We in fact expected some indicators
like ANC visits, PP visits, and full immunization to decline because of data quality
monitoring, which was borne out in the evaluation of the pilot.
CHART 1: PERFORMANCE INDICATORS Comparison with year 2008-2009 &
2009-2010
PATIENT CARE
85
17 124
101
2210 4
0
20
40
60
80
100
120
Avera
ge C
linic
OP
attendance/d
ay
Outp
atie
nts
treate
d in
104/d
ay
% b
lood s
lides
exam
ined for
mala
ria /T
ota
l
OP
% la
b test done
/ C
linic
OP
2008-2009
2009-2010
MOTHER CARE
0
20
40
60
80
100
120
No. ANC
Reg/per 1000
pop
% of ANC
received 3
visits
%
Institutional
deliveries out
of expected
% Deliveries
at PHC out of
expected
% delivered
women
received two
PP visits
2008-2009
2009-2010
FAMILY PLANNING & RH
0102030405060708090
100
% sterilization/Target % couples using
spacing methods/non
st EC
No. of RTI/STI Cases
treated / expected
cases
2008-2009
2009-2010
CHILD CARE
78798081828384858687
% Children fully immunized / Ch.
12-23 mo
% children received Vitamin A
dose
2008-2009
2009-2010
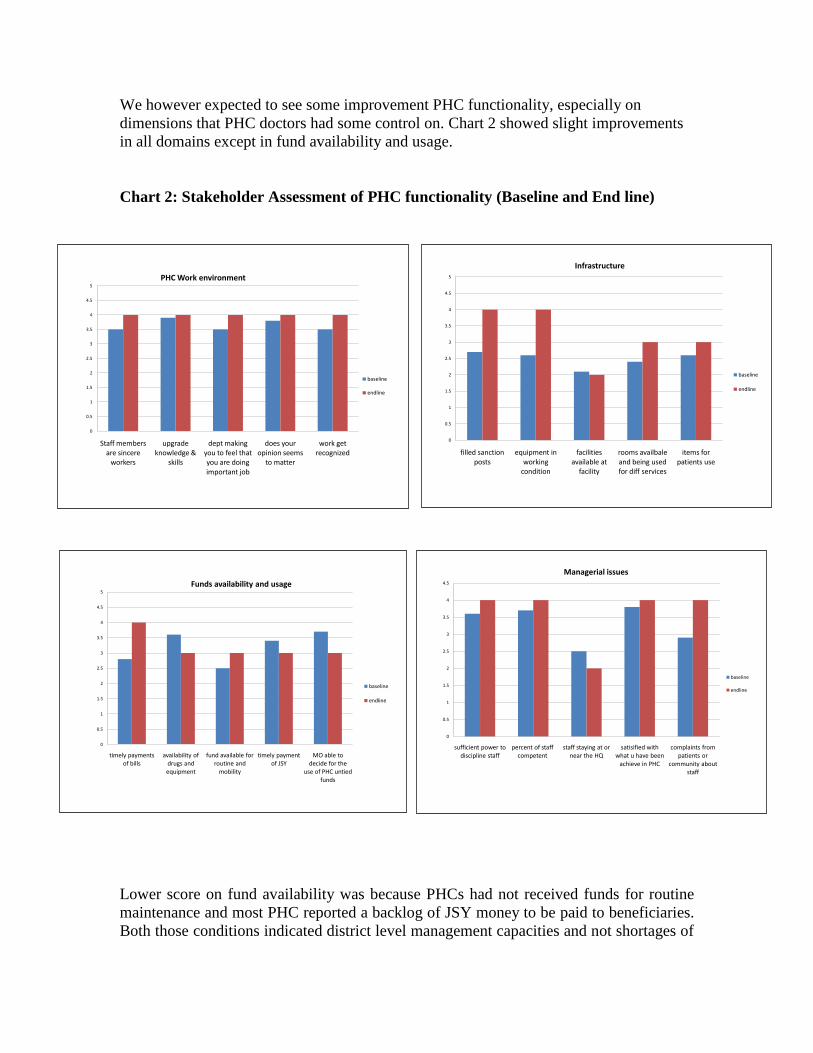
We however expected to see some improvement PHC functionality, especially on
dimensions that PHC doctors had some control on. Chart 2 showed slight improvements
in all domains except in fund availability and usage.
Chart 2: Stakeholder Assessment of PHC functionality (Baseline and End line)
Lower score on fund availability was because PHCs had not received funds for routine
maintenance and most PHC reported a backlog of JSY money to be paid to beneficiaries.
Both those conditions indicated district level management capacities and not shortages of
0
0.5
1
1.5
2
2.5
3
3.5
4
4.5
5
Staff members are sincere
workers
upgrade knowledge &
skills
dept making you to feel that you are doing important job
does your opinion seems
to matter
work get recognized
PHC Work environment
baseline
endline
0
0.5
1
1.5
2
2.5
3
3.5
4
4.5
5
filled sanction posts
equipment in working
condition
facilities available at
facility
rooms availbale and being used for diff services
items for patients use
Infrastructure
baseline
endline
0
0.5
1
1.5
2
2.5
3
3.5
4
4.5
5
timely payments of bills
availability of drugs and equipment
fund available for routine and
mobility
timely payment of JSY
MO able to decide for the
use of PHC untied funds
Funds availability and usage
baseline
endline
0
0.5
1
1.5
2
2.5
3
3.5
4
4.5
sufficient power to discipline staff
percent of staff competent
staff staying at or near the HQ
satisified with what u have been
achieve in PHC
complaints from patients or
community about staff
Managerial issues
baseline
endline
funds at the program level. Delays in sending fund utilization certificates to the state
usually resulted in delays in fund release from the state. PHC doctor had little control
over those actions. One of pilot doctor reported that though he submits utilization
certificates promptly, he does not get funds because of others who do not. District
officers should exercise more control over PHC doctors who do not comply. Items on
which PHC had some control, showed improvement in the end evaluation.
Summary and Discussion
The experience of the pilot was positive. The researchers had managed to develop simple
instruments, using the available data that captured the essence of PHC functioning. The
pilot succeeded in bringing together the main stakeholders of the Primary Health Care
namely, the administrators, the service providers and the clients/community on one
platform to discuss and resolve issues that affected PHC performance.
Many of the positive improvements showed between base year and the end, were due to
attention paid to reporting (Outpatient attendance, deliveries at PHC) and some were due
to actions taken by medical officers like visiting subcenters and improving supervision of
the field level activities (children fully immunized and simulteneously given vit A).
Medical officers self assessment showed improvement in repair of equipment and felt
that they received more respect from community as some of them were interacting more
with patients and community members.
The performance report showed no change in lab tests done as percentage of outpatients
but number of outpatients showed increase, hence the volume of work handled by labs
had improved in PHCs where doctors felt responsible for laboratory services.
The apparant negative ternds in malaria slides examined, in ANC 3 visits and in PP visits
seemed to be an indication of improved accuracy. In the base year, all PHCs had reported
unlikely performance of “100 percent” for ANC and Post partum visits. Realizing that
those were mistakes, some MO had warned the heath workers against false reporting
because they could be caught through the beneficiary tracking system.
The impact evaluation of this pilot using household survey in the experiemntal PHCs
from Warangal district and control PHCs from neighboring district of Nalagonda had
found that:
■ Provider perceptions of PHC performance in Warangal improved between
baseline and endline, particularly those related to quality of work environment
and infrastructures status.
■ Patient perceptions of effectiveness of treatment received at PHCs (both Warangal
and Naagonda) generally decreased between baseline and endline, which was
consistent with decline in availability of medicines and supplies, a higher
percentage of Warangal respondents indicated that the PHC was the first instance
of treatment when they or their family members became ill (Andrew Mitchell,
2010).
Report cards benefitted where PHC medical officers were inclined to take the Report
cards and community feedback seriously. In this pilot, 5 MO seemed self motivated to
use the feedback to make some improvements; 3 of them attributed their motivation enrol
for post graduate studies, where their performance might help. The other 2 attributed to
stimulation they derived from group discussion and interation with experts. The
remaining half did not seem motivated enough, perhaps because there was no pressure
from above for them to participate, but they extended courtsey and coooperation to the
research team.
This pilot used concepts from “performance management” and “quality improvement,
combined with community feedback that created environment for double-loop learning,
meaning when performance fell short of the expected, MOs were not admonished “for
not trying hard enough” (single loop learning). They were encouraged to seek soltions to
correct the situation by correcting norms, policies and procedures that seemed to affect
their performance (Argyris, 1978).
For example, when Day-PHC were shown as not meeting the norms for deliveries at
PHC, medical officers argued that the norm was incorrect. They should not be expected
to conduct deliveries at PHC which does not work 24X7. They were able to negotiate
those norms through discussion. When MO reported not having electricity for non-
payment of electricity bills on time, the responsibility for bill payment was shifted to the
district so that PHC did not have to suffer consequences of delayed payments. Similarly,
when many women reported that they had not received incentive payment (JSY), DMHO
came up with a solution of channeling the incentive funds though health centers and
hospitals and not through female health workers who do not have the capacity to submit
accounts timely.
Health secretary who attended the peer-consultation meeting, recognized the potential in
having a group of doctors available to explain “why” certain policies / procedures were
failing in the field, to help bring system-wide changes. He wanted the pilot doctors to tell
him where the government was failing them; were they wasting too much of their time in
meetings and administration; how well were the Hospital Development Committees
working and if any changes were needed in them. “I want their views supported by data
and evidence, not their opinions” was his message on the PE pilot.
A large amount of data is routinely collected in districts for monitoring. PHCs are
responsible for 21 reporting forms and are maintaining as many registers. Health worker
consolidate data into monthly reports and sent upwards to district and state levels as
aggregate numbers of antenatal visits made, tetanus toxoid injections given, iron folic
acid tablets given etc.
Monthly meetings of PHC doctors are held at the district level ostensibly to discuss
problems and provide guidance, but they end-up discussing submission of reports and
whether the targets were met or not. Nearly 10 days of staff time goes in to preparing
reports for these meetings. At the regular monthly meetings, medical officers rarely
reported their problems because they believed the district authorities were not interested
in hearing their problems. “Usually we get blamed for the problems they report” MO
often said.
In the PE consultations meetings problems were discussed, they got more attention and
some solution. This difference could be because of:
(i) the setting of the peer-consultation meetings, The setting of the peer-consultation
meeting was - a group 12-15 doctors, seating around a table along with district program
officers, discussing all aspects of their performance. The setting of a typical monthly
medical officers meetings was 60-70 doctors sitting in a large hall with poor acoustics;
district officers reading out performance reports and government letters from a dais,
giving little scope for discussion or questions.
(ii) the evidence being presented for problem identification The evidence presented in the
peer-consultation was performance reports, community feedback and functionality
assessment by PHC doctors which together could create an attention-grabbing “case”. For
example, when community members reported “doctors not available” in the PHC that had
five doctors posted, the issue got attention. Then came the analysis that there was no
fixed roaster for all doctors; there was no room for the doctor on night duty to stay; the
in-charge medical officers was expected to ensure round the clock posting of doctors but
had no power to make them comply with his order. After knowing those issues, the
DMHO acted. He created roasters for all medical officers, making each one of them
responsible.
(iii) presence of facilitators to ensure rational discussion between the medical officers and
district officers around the problem. Facilitation of proceedings was the most important
difference between the routine review meetings and the PE pilot. Researchers played the
facilitation role of seeing that medical officers and community presented their cases, that
no officer dominated the proceedings and that no issue was dismissed without proper
discussion or reaching some resolution. This was a very important role that only a
respected and competent outsider can play.
The Performance enhancement pilot project in Warangal combined concepts from
“performance management” and “quality improvement” initiatives implemented around
the world. Performance management is commonly implemented with management
information systems designed to provide feedback to individuals responsible for program
performance as well as their supervisors.
When doctors from Day-PHC for example, argued that they should not be asked to
conduct deliveries at PHC (at least not as many) as at the 24X7 PHCs, they could
negotiate those norms through discussion. When many medical officers reported not
being able to pay electricity bills on time, the responsibility for bill payment was shifted
to the district; PHC did not have to suffer consequences of delayed payments. Similarly,
when many women through community feedback inform that they had not received
incentive payment (JSY), DMHO inquired into the reasons and came up with a solution
that implied changing the prevailing fund flow arrangements. Health secretary who
attended the third peer-consultation meeting quickly recognized the potential in having a
group of doctors explain to the government “why” certain policies / procedures were
failing in the field, which would help him bring system-wide changes in the program. He
told the researchers, “I want this group of pilot doctors tell me where the government
failing them. Are we wasting too much of their time in meetings and administration?
How well is “104” service or Hospital Development Committees working? Is any change
needed in them? But we want those views supported by data and evidence, not as
opinions”.
A large amount of data is routinely collected for monitoring. PHCs are responsible for 21
reporting forms and maintaining as many registers. Health worker consolidate data into
monthly reports and sent upwards to district and state levels as aggregate numbers of
antenatal visits made, tetanus toxoid injections given, iron folic acid tablets given etc.
PHC doctors’ meetings are held each month at the district level ostensibly to discuss
problems and seek guidance, but they end up being about submission of reports and the
targets being met. Nearly 10 days of staff time goes in to preparing reports for these
meetings. The pilot demonstrated that these meetings could be used for coordinating
work, mutual learning and two-way communication. At the regular monthly meetings,
medical officers rarely reported their problems because they believed the district
authorities were not interested in hearing their problems or more likely to blame them for
the problems than help them.
However, problems discussed in peer consultation meetings got more attention and some
solution. This difference could be because of: (i) the meeting setting, (ii) evidence
presented and (iii) presence of facilitators to facilitate rational discussion around the
problem.
The setting of the peer-consultation meeting was - a group 12-15 doctors, seating around
a table along with district program officers, discussing all aspects of their performance.
The setting of a typical monthly medical officers meetings is 60-70 doctors sitting in a
large hall with poor acoustics; district officers reading out performance reports or
government circulars from a dais, giving little scope for discussion or questions.
The evidence, based on the Report Card and the community feedback together usually
created attention-grabbing “case”. For example, when community members reported that
“doctors are not available” in a PHC that had five doctors posted, the issue caught
attention of the DM&HO. The discussion brought out the real issues like there was no
fixed roaster for doctors; there was no room for doctors on night duty to stay; the in-
charge medical officers had no powers to order them to be present on duty. The solution
suggested was: DM&HO should create a duty roaster for all MO and hold each of them
responsible for the duty hours.
The Facilitation of peer consultation meetings was a very important difference between
the routine review meetings of MOs and the PE pilot. Researchers played the facilitation
role of seeing that medical officers and community members could present their views
without fear of being snubbed, that no officer dominated the proceedings and that no
issue was dismissed without proper discussion or reaching some resolution. This was a
very important role that only a competent “outsider” could play.
The state government is interested in up-scaling the pilot to the entire district and to the
state, if the up-scaling is satisfactory. The up-scale will answer the question: How well
can we replicate the three pre-requites mentioned above on a large scale? What
incentives might be needed to sustain MOs’ enthusiasm for performance enhancement?
Is the initiative sustainable in the government setting?
In summary, the experience of the pilot was positive. The researchers had managed to
develop simple instruments, using the available data that captured the essence of PHC
functioning. The pilot succeeded in bringing together the main stakeholders of the
Primary Health Care namely, the administrators, the service providers and the
clients/community on one platform to discuss and resolve issues that affected PHC
performance. The state government is interested in up-scaling the pilot to the entire
district and if feasible, to the state if the up-scaling can satisfactorily answer the
questions: can we replicate the three pre-requites of the peer-consultations on a large
scale? What incentives might be needed to sustain the performance enhancement
initiative in a government setting?
Appendix 1
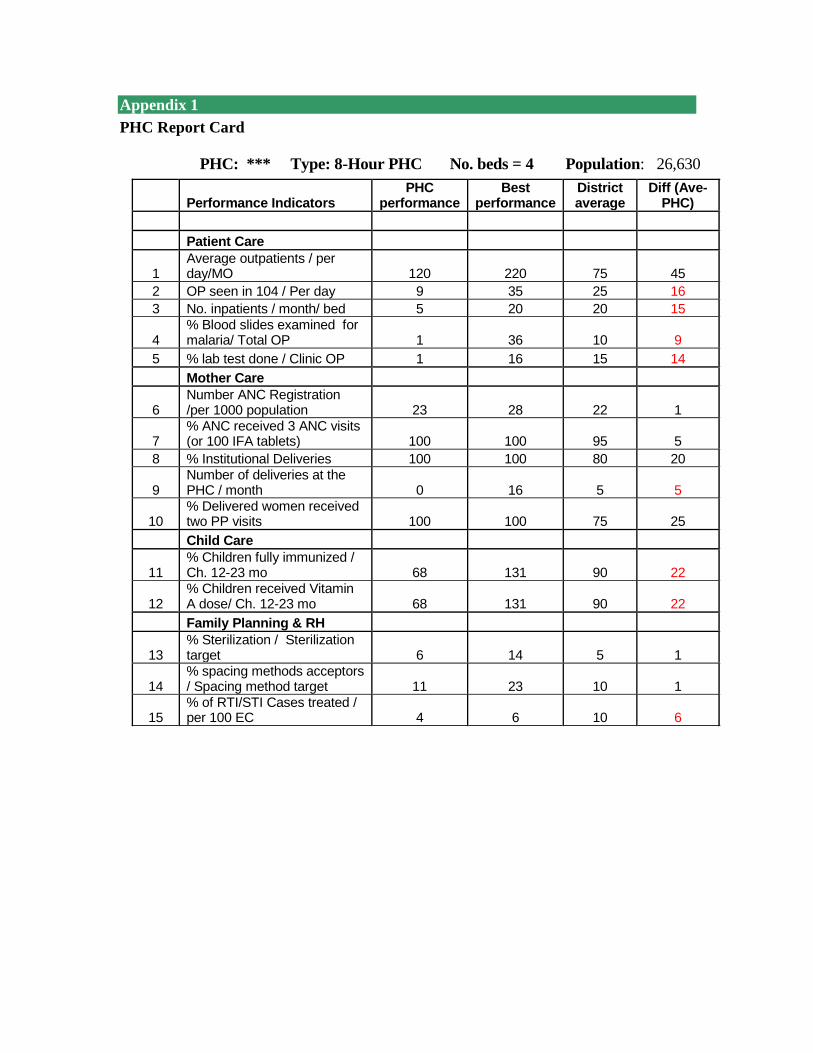
PHC Report Card
PHC: *** Type: 8-Hour PHC No. beds = 4 Population: 26,630
Performance Indicators
PHC performance
Best performance
District average
Diff (Ave-PHC)
Patient Care
1 Average outpatients / per day/MO 120 220 75 45
2 OP seen in 104 / Per day 9 35 25 16
3 No. inpatients / month/ bed 5 20 20 15
4 % Blood slides examined for malaria/ Total OP 1 36 10 9
5 % lab test done / Clinic OP 1 16 15 14
Mother Care
6 Number ANC Registration /per 1000 population 23 28 22 1
7 % ANC received 3 ANC visits (or 100 IFA tablets) 100 100 95 5
8 % Institutional Deliveries 100 100 80 20
9 Number of deliveries at the PHC / month 0 16 5 5
10 % Delivered women received two PP visits 100 100 75 25
Child Care
11 % Children fully immunized / Ch. 12-23 mo 68 131 90 22
12 % Children received Vitamin A dose/ Ch. 12-23 mo 68 131 90 22
Family Planning & RH
13 % Sterilization / Sterilization target 6 14 5 1
14 % spacing methods acceptors / Spacing method target 11 23 10 1
15 % of RTI/STI Cases treated / per 100 EC 4 6 10 6
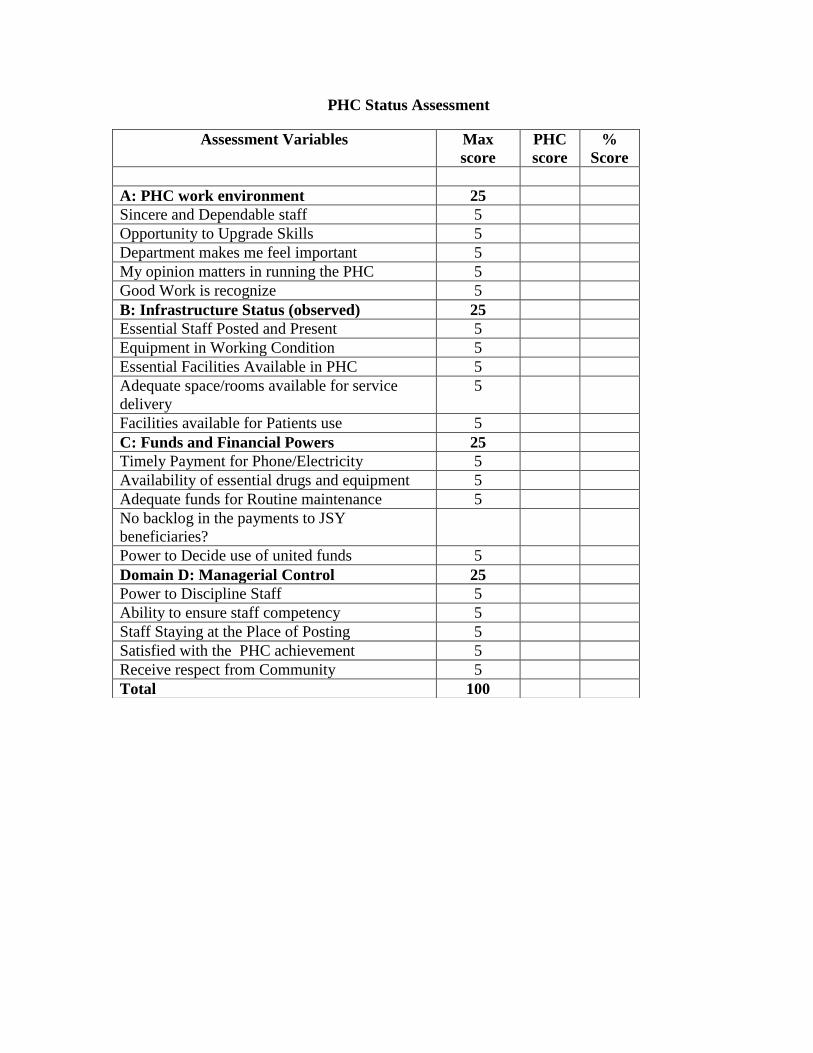
PHC Status Assessment
Assessment Variables Max
score
PHC
score
%
Score
A: PHC work environment 25
Sincere and Dependable staff 5
Opportunity to Upgrade Skills 5
Department makes me feel important 5
My opinion matters in running the PHC 5
Good Work is recognize 5
B: Infrastructure Status (observed) 25
Essential Staff Posted and Present 5
Equipment in Working Condition 5
Essential Facilities Available in PHC 5
Adequate space/rooms available for service
delivery
5
Facilities available for Patients use 5
C: Funds and Financial Powers 25
Timely Payment for Phone/Electricity 5
Availability of essential drugs and equipment 5
Adequate funds for Routine maintenance 5
No backlog in the payments to JSY
beneficiaries?
Power to Decide use of united funds 5
Domain D: Managerial Control 25
Power to Discipline Staff 5
Ability to ensure staff competency 5
Staff Staying at the Place of Posting 5
Satisfied with the PHC achievement 5
Receive respect from Community 5
Total 100
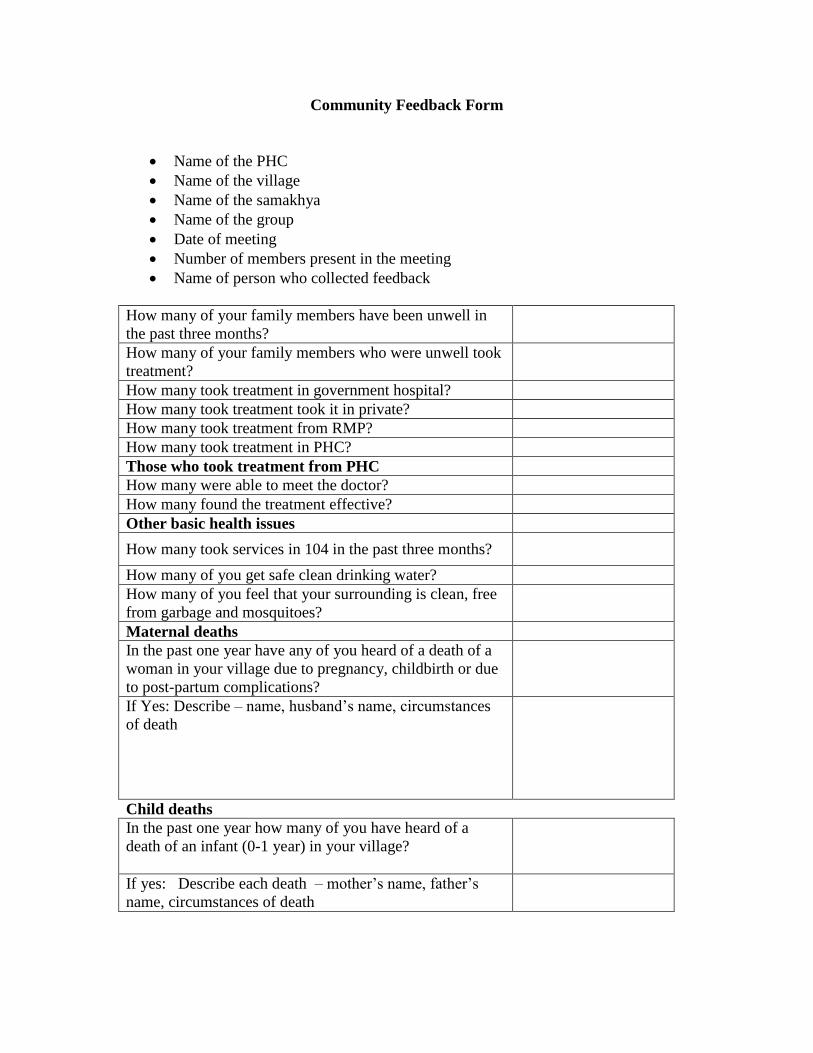
Community Feedback Form
Name of the PHC
Name of the village
Name of the samakhya
Name of the group
Date of meeting
Number of members present in the meeting
Name of person who collected feedback
How many of your family members have been unwell in
the past three months?
How many of your family members who were unwell took
treatment?
How many took treatment in government hospital?
How many took treatment took it in private?
How many took treatment from RMP?
How many took treatment in PHC?
Those who took treatment from PHC
How many were able to meet the doctor?
How many found the treatment effective?
Other basic health issues
How many took services in 104 in the past three months?
How many of you get safe clean drinking water?
How many of you feel that your surrounding is clean, free
from garbage and mosquitoes?
Maternal deaths
In the past one year have any of you heard of a death of a
woman in your village due to pregnancy, childbirth or due
to post-partum complications?
If Yes: Describe – name, husband’s name, circumstances
of death
Child deaths
In the past one year how many of you have heard of a
death of an infant (0-1 year) in your village?
If yes: Describe each death – mother’s name, father’s
name, circumstances of death
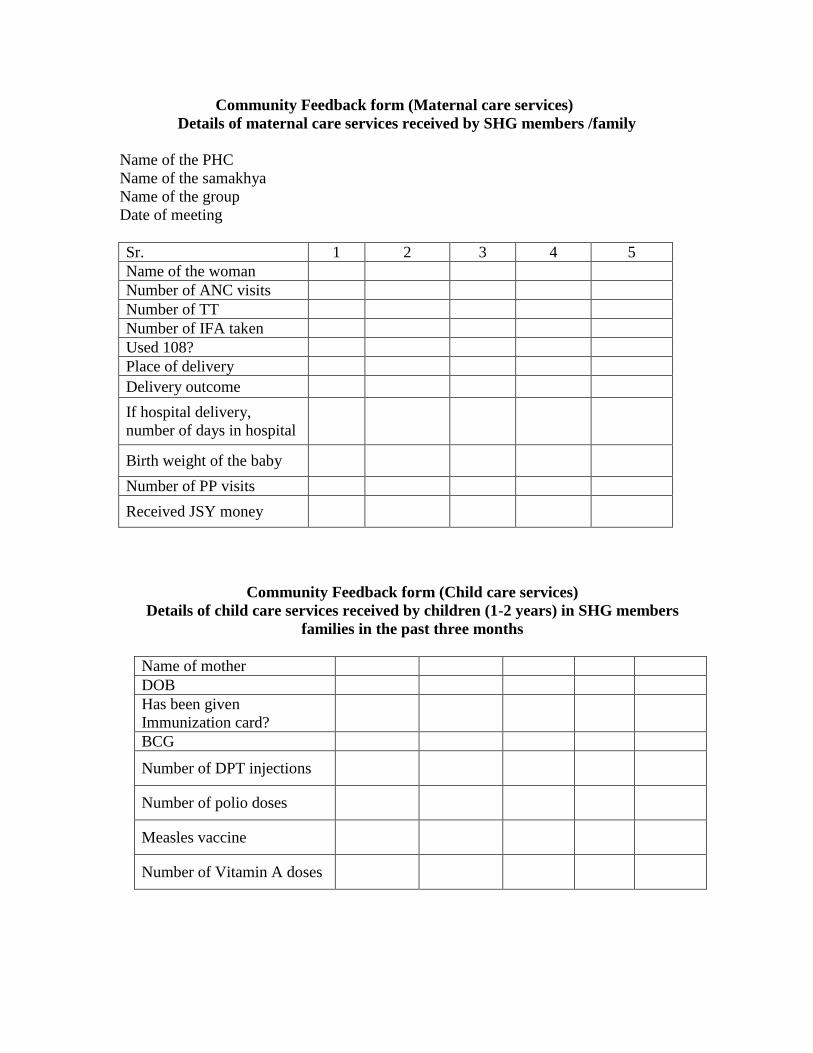
Community Feedback form (Maternal care services)
Details of maternal care services received by SHG members /family
Name of the PHC
Name of the samakhya
Name of the group
Date of meeting
Sr. 1 2 3 4 5
Name of the woman
Number of ANC visits
Number of TT
Number of IFA taken
Used 108?
Place of delivery
Delivery outcome
If hospital delivery,
number of days in hospital
Birth weight of the baby
Number of PP visits
Received JSY money
Community Feedback form (Child care services)
Details of child care services received by children (1-2 years) in SHG members
families in the past three months
Name of mother
DOB
Has been given
Immunization card?
BCG
Number of DPT injections
Number of polio doses
Measles vaccine
Number of Vitamin A doses
References
Afghanistan Ministry of Public Health, John Hopkins University & IIHMR, “Afghanistan
Health Sector Balanced Scorecard National and Provincial Results 2006”
<http://www.moph.gov.af/hmis-reports/BSC-reports/BSC-2006-report/ >
Andrew Mitchell, Thomas Bossert, Ajay Mahal, “ Warangal District Performance
Enhancement in Primary Health Care Project, Impact Evaluation Report, Harvard School
of Public Health, 2010
Argyris, Chris, Schom Donald, (1978) “ Organizational learning: a theory of action
perspective, chapter 1, pp 20, Addison-Wesley Publishing company.
Berwick, Donald M., “Lessons from Developing Nations on Improving Health Care,
British Medical Journal, May 8, 2004, pp. 1124 – 1129.
Franco, Marquez, Ethier, Balsara and Isenhower, “Results of Collaborative Improvement:
Effects on Health Outcomes and Compliance with Evidence-Based Standards in 27
Applications in 12 Countries”, A Report from The Health Care Improvement Project,
University Research Co, for the U.S. Agency for International Development, November,
2009.
Fung, Lim et al., “Systematic Review: The Evidence That Publishing Patient Care
Performance Data Improves Quality of Care”, Annals of Internal Medicine, Jan 15, 2008,
148 (2), pp. 111-123.
Government of Andhra Pradesh. “AP Human Development Report 2007.”
<http://www.aponline.gov.in/Apportal/HumanDevelopmentReport2007/APHDR_2007_
Chapter7.pdf>
McNamara, Peggy, “Provider-Specific Report Cards: A Tool for Health Sector
Accountability in Developing Countries”, Health Policy and Planning, 2006, 21(2),
pp.101-109.
Misra et al., “Case Study 1: Andhra Pradesh, India, Improving Health Services Through
Community Scorecards”, Social Accountability Series, The World Bank, August, 2007.
http://siteresources.worldbank.org/INTSOCACCDEMSIDEGOV/Resources/Case1Andhr
aPradeshSAcCSCealthAugust2007.pdf
Peters, David et al., “A Balanced Scorecard for Health Services in Afghanistan”, Bulletin
of the World Health Organization, February, 2007, 85(2), pp. 146-151.
Schneider et al., “Use of Public Performance Reports”, The Journal of the American
Medical Association, May, 27, 1998, 279 (20), pp.1638-1642
Wennberg, Blowers, Parker and Gittlesohn, “Changes in Tonsilectomy Rates Associated
with Feedback and Review, Pediatrics, June 1977, 59 (6), pp. 821 – 826.


![[XLS] and Others.xls · Web viewARI, R nagar Asst Comptroller, Warangal ADR, Warangal E. Raghu Sharma KVK, Malyal DAATTC, Warangal HRS, Malyal -H LRS, Mamunoor V KVK, Mamunoor V AHPT,](https://img.dokumen.tips/doc/110x75/5b0cb1f87f8b9a6a6b8cbf88/xls-and-othersxlsweb-viewari-r-nagar-asst-comptroller-warangal-adr-warangal.jpg)