Embed Size (px)
Citation preview
Performance Baseline of Oracle Exadata X2-2 HR HC Part II: Server Performance
Benchware Performance Suite Release 8.4 (Build 130630)
September 2013
copyright © 2013 by benchware.ch slide 2
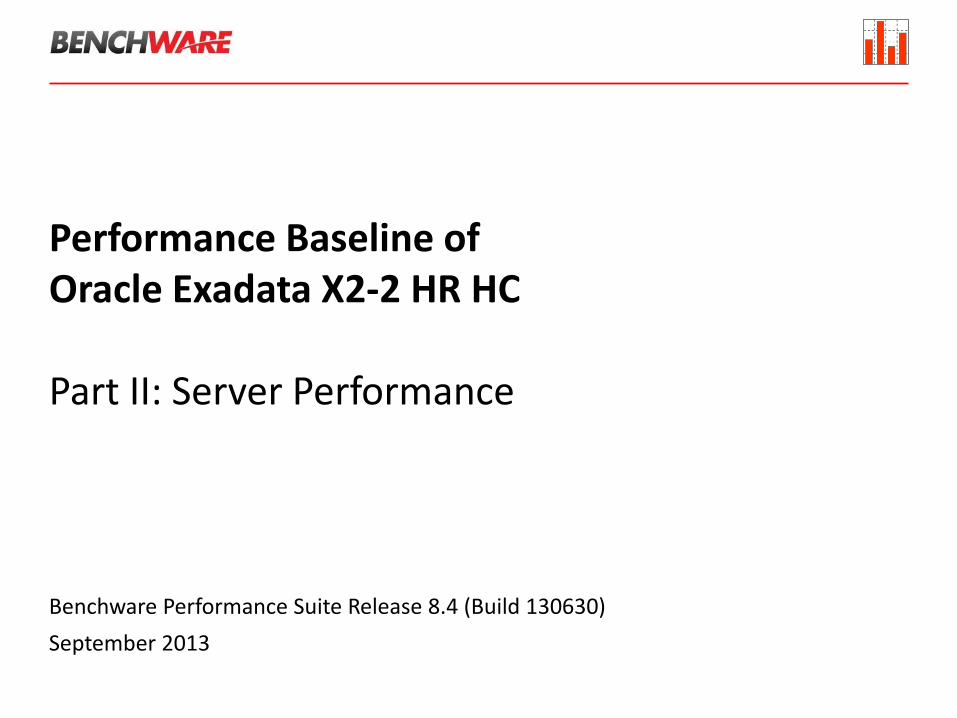
1 Introduction to Server Performance Tests
2 CPU and Server Configuration
3 Benchmark Results – In-Memory SQL Operations
4 Reviewing Server Benchmark Results
Contents
copyright © 2013 by benchware.ch slide 3
Server Performance
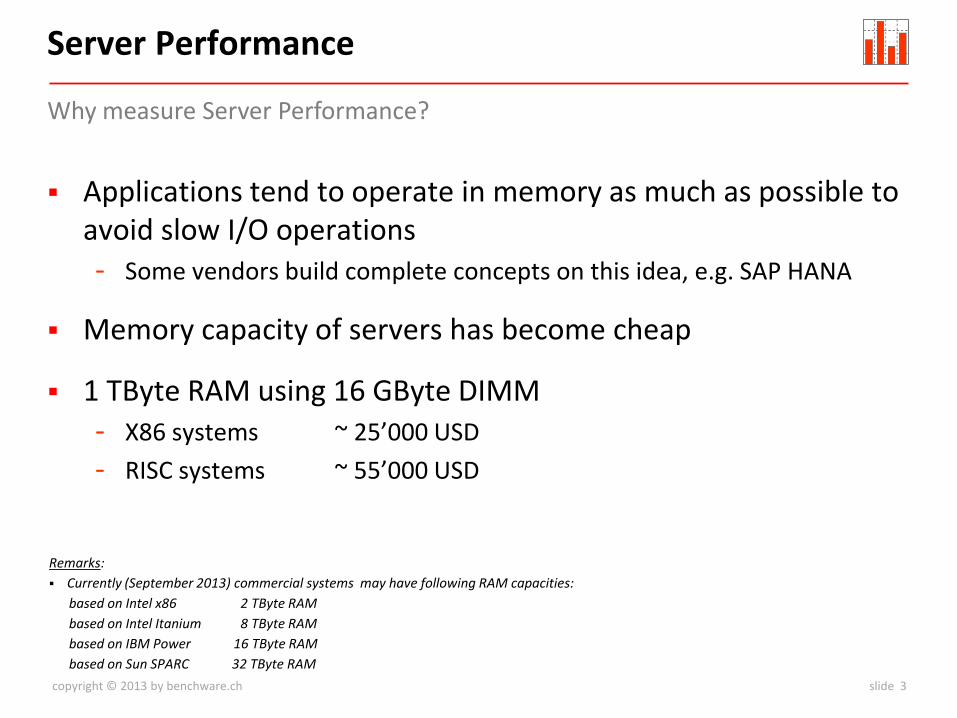
Applications tend to operate in memory as much as possible to avoid slow I/O operations - Some vendors build complete concepts on this idea, e.g. SAP HANA
Memory capacity of servers has become cheap
1 TByte RAM using 16 GByte DIMM - X86 systems ~ 25’000 USD
- RISC systems ~ 55’000 USD
Why measure Server Performance?
Remarks:
Currently (September 2013) commercial systems may have following RAM capacities:
based on Intel x86 2 TByte RAM
based on Intel Itanium 8 TByte RAM
based on IBM Power 16 TByte RAM
based on Sun SPARC 32 TByte RAM
copyright © 2013 by benchware.ch slide 4
Server Performance
Oracle recognized this trend and provides specific features for in-memory processing - Different Cache types for object pinning
- Parallel SQL even for large in-memory objects
- New In-Memory Option with Oracle 12c
These tests are useful to determine performance capabilities of 2 socket server (Oracle SE vs Oracle EE)
Why measure Server Performance?
copyright © 2013 by benchware.ch slide 5
Server Performance
Server performance from the Oracle point of view
- No I/O operations
Speed of single thread
- Rows per second [rps]
- Transactions per second [tps]
- Service time in [s]
Maximum throughput of system
- Rows per second [rps]
- Transactions per second [tps]
- Service time in [s]
- Number of Oracle buffer gets (logical I/O) in [bps]
Scalability
- Throughput per process for n = {1, 2, 4, 8, …, n}
Efficiency of
- Huge pages and NUMA architectures when using large RAM capacities
- Virtualization
What is measured?
copyright © 2013 by benchware.ch slide 6
Server Performance
Benchware Loader pins objects in Oracle SGA and performs different representative database operations on these objects - Selection of all rows via full table scan (all rows per SQL)
- Selection of one random row via primary key (1 row per SQL)
- Selection of many random rows via secondary key (25 rows per SQL)
How is Server Performance measured?
copyright © 2013 by benchware.ch slide 7
Server Performance
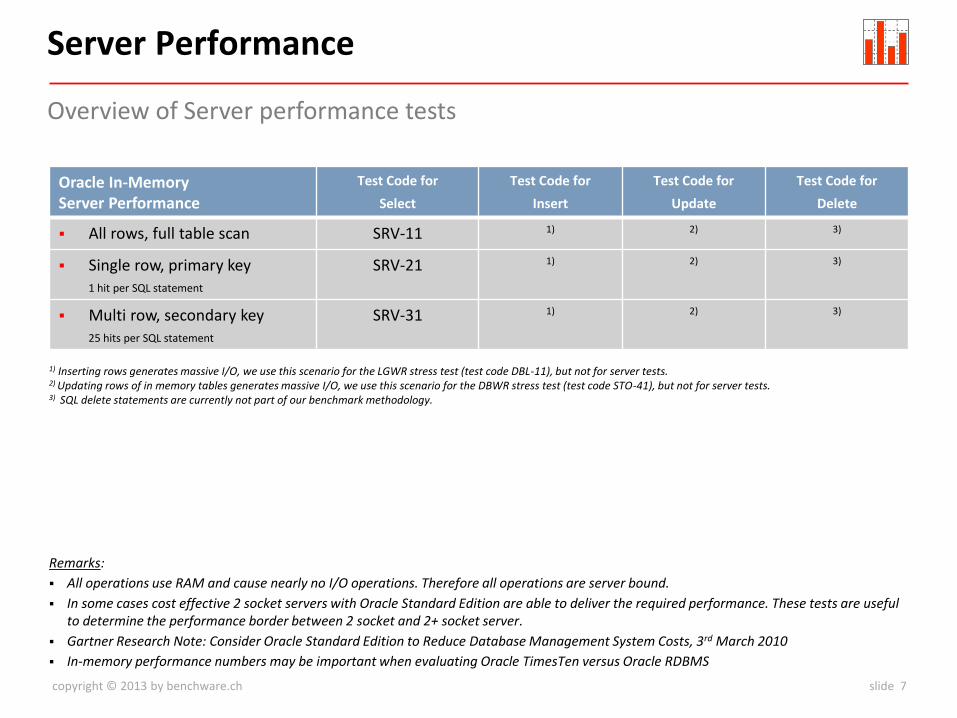
Oracle In-Memory Server Performance
Test Code for
Select
Test Code for
Insert
Test Code for
Update
Test Code for
Delete
All rows, full table scan SRV-11 1) 2) 3)
Single row, primary key 1 hit per SQL statement
SRV-21 1) 2) 3)
Multi row, secondary key 25 hits per SQL statement
SRV-31 1) 2) 3)
Overview of Server performance tests
1) Inserting rows generates massive I/O, we use this scenario for the LGWR stress test (test code DBL-11), but not for server tests. 2) Updating rows of in memory tables generates massive I/O, we use this scenario for the DBWR stress test (test code STO-41), but not for server tests. 3) SQL delete statements are currently not part of our benchmark methodology.
Remarks:
All operations use RAM and cause nearly no I/O operations. Therefore all operations are server bound.
In some cases cost effective 2 socket servers with Oracle Standard Edition are able to deliver the required performance. These tests are useful to determine the performance border between 2 socket and 2+ socket server.
Gartner Research Note: Consider Oracle Standard Edition to Reduce Database Management System Costs, 3rd March 2010
In-memory performance numbers may be important when evaluating Oracle TimesTen versus Oracle RDBMS
copyright © 2013 by benchware.ch slide 8
Server Performance
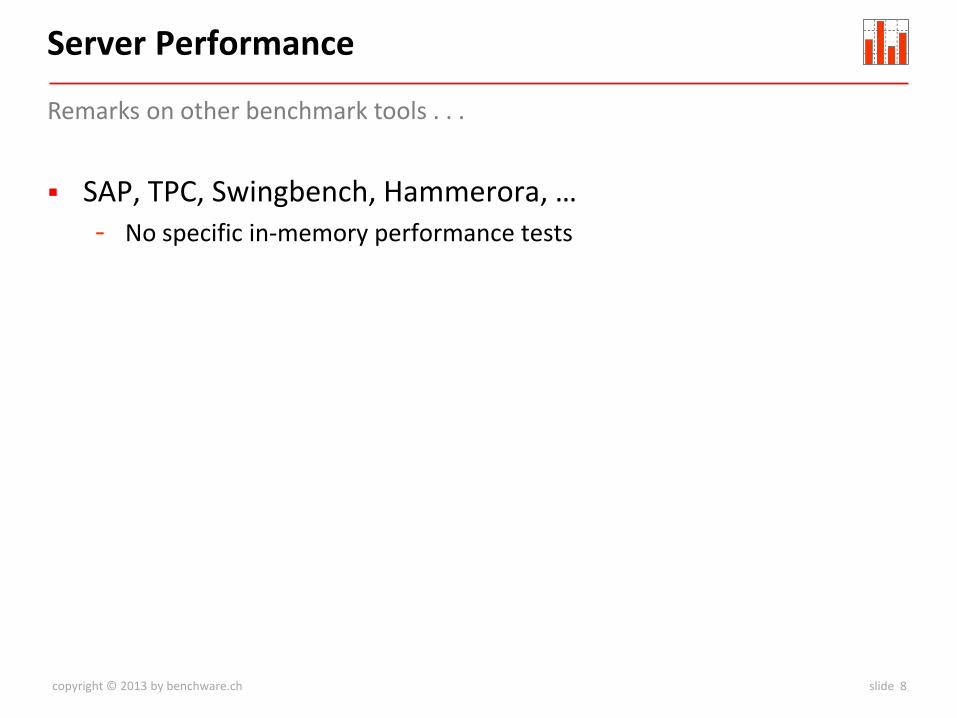
SAP, TPC, Swingbench, Hammerora, … - No specific in-memory performance tests
Remarks on other benchmark tools . . .
copyright © 2013 by benchware.ch slide 9
1 Introduction to Server Performance Tests
2 CPU and Server Configuration
3 Benchmark Results – In-Memory SQL Operations
4 Reviewing Server Benchmark Results
Contents
copyright © 2013 by benchware.ch slide 10
CPU and Server Configuration
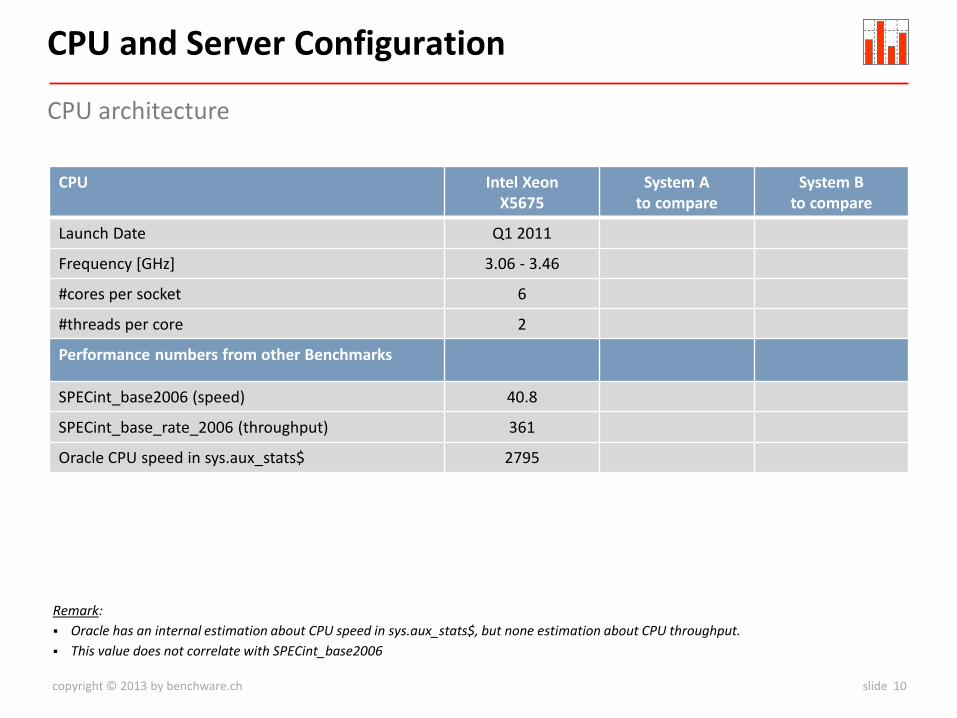
CPU Intel Xeon X5675
System A to compare
System B to compare
Launch Date Q1 2011
Frequency [GHz] 3.06 - 3.46
#cores per socket 6
#threads per core 2
Performance numbers from other Benchmarks
SPECint_base2006 (speed) 40.8
SPECint_base_rate_2006 (throughput) 361
Oracle CPU speed in sys.aux_stats$ 2795
CPU architecture
Remark:
Oracle has an internal estimation about CPU speed in sys.aux_stats$, but none estimation about CPU throughput.
This value does not correlate with SPECint_base2006
copyright © 2013 by benchware.ch slide 11
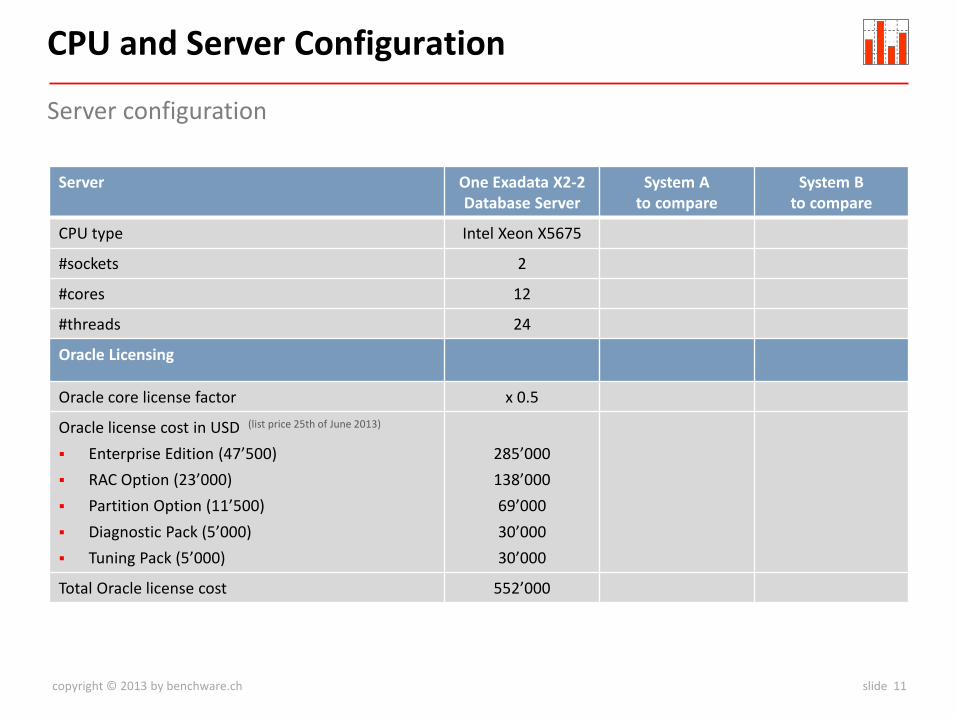
CPU and Server Configuration
Server One Exadata X2-2 Database Server
System A to compare
System B to compare
CPU type Intel Xeon X5675
#sockets 2
#cores 12
#threads 24
Oracle Licensing
Oracle core license factor x 0.5
Oracle license cost in USD (list price 25th of June 2013)
Enterprise Edition (47’500)
RAC Option (23’000)
Partition Option (11’500)
Diagnostic Pack (5’000)
Tuning Pack (5’000)
285’000
138’000
69’000
30’000
30’000
Total Oracle license cost 552’000
Server configuration
copyright © 2013 by benchware.ch slide 12
1 Introduction to Server Performance Tests
2 CPU and Server Configuration
3 Benchmark Results – In-Memory SQL Operations
4 Reviewing Server Benchmark Results
Contents
copyright © 2013 by benchware.ch slide 13
Server Performance
0
20
40
60
80
100
120
140
160
1 2 4 8 16 32 2 nodes 4 nodes
Exa X2-2
System A
System B
Number of processes / nodes
Thro
ugh
pu
t in
[M
rps]
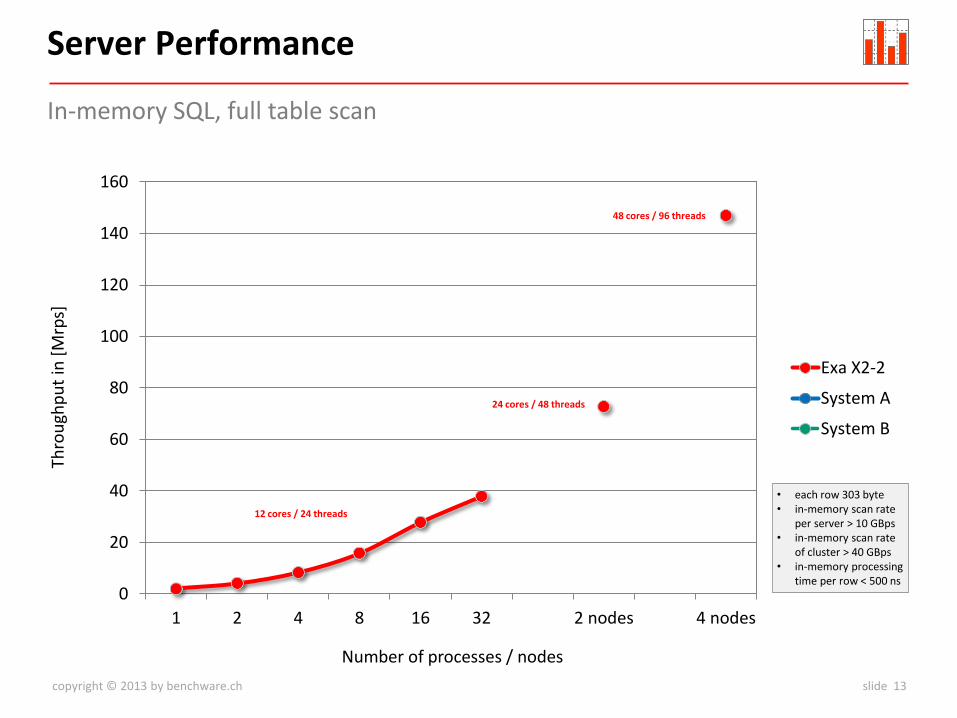
In-memory SQL, full table scan
12 cores / 24 threads
• each row 303 byte • in-memory scan rate
per server > 10 GBps • in-memory scan rate
of cluster > 40 GBps • in-memory processing
time per row < 500 ns
24 cores / 48 threads
48 cores / 96 threads
copyright © 2013 by benchware.ch slide 14
Server Performance
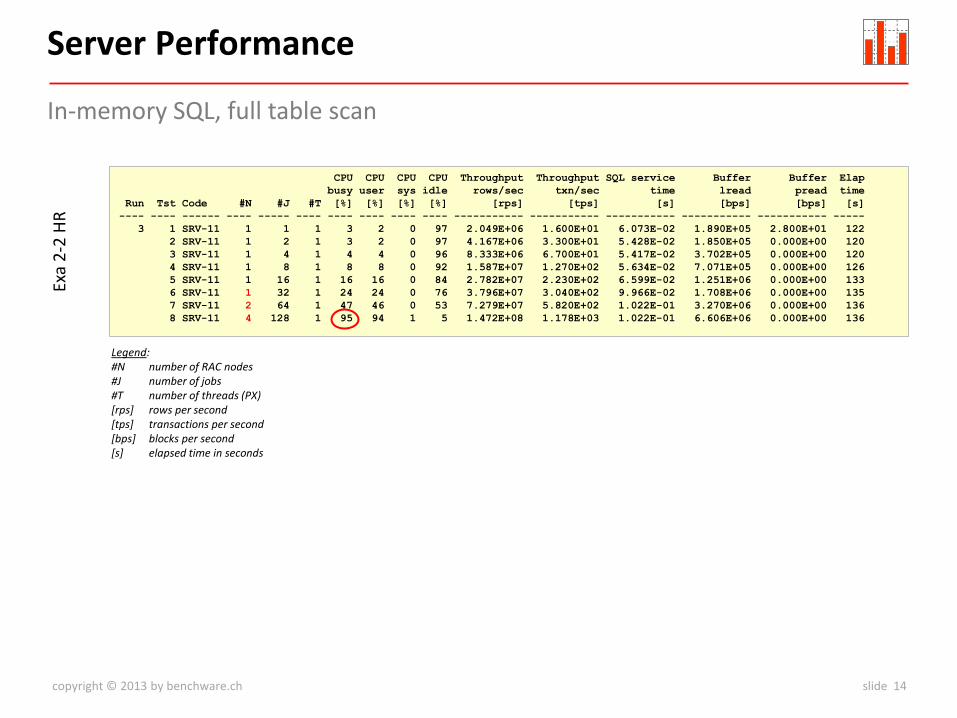
CPU CPU CPU CPU Throughput Throughput SQL service Buffer Buffer Elap
busy user sys idle rows/sec txn/sec time lread pread time
Run Tst Code #N #J #T [%] [%] [%] [%] [rps] [tps] [s] [bps] [bps] [s]
---- ---- ------ ---- ----- ---- ---- ---- ---- ---- ----------- ----------- ----------- ----------- ----------- -----
3 1 SRV-11 1 1 1 3 2 0 97 2.049E+06 1.600E+01 6.073E-02 1.890E+05 2.800E+01 122
2 SRV-11 1 2 1 3 2 0 97 4.167E+06 3.300E+01 5.428E-02 1.850E+05 0.000E+00 120
3 SRV-11 1 4 1 4 4 0 96 8.333E+06 6.700E+01 5.417E-02 3.702E+05 0.000E+00 120
4 SRV-11 1 8 1 8 8 0 92 1.587E+07 1.270E+02 5.634E-02 7.071E+05 0.000E+00 126
5 SRV-11 1 16 1 16 16 0 84 2.782E+07 2.230E+02 6.599E-02 1.251E+06 0.000E+00 133
6 SRV-11 1 32 1 24 24 0 76 3.796E+07 3.040E+02 9.966E-02 1.708E+06 0.000E+00 135
7 SRV-11 2 64 1 47 46 0 53 7.279E+07 5.820E+02 1.022E-01 3.270E+06 0.000E+00 136
8 SRV-11 4 128 1 95 94 1 5 1.472E+08 1.178E+03 1.022E-01 6.606E+06 0.000E+00 136
In-memory SQL, full table scan
Exa
2-2
HR
Legend: #N number of RAC nodes #J number of jobs #T number of threads (PX) [rps] rows per second [tps] transactions per second [bps] blocks per second [s] elapsed time in seconds
copyright © 2013 by benchware.ch slide 15
Server Performance
0
200
400
600
800
1'000
1'200
1 2 4 8 16 32 2 nodes 4 nodes
Exa X2-2
System A
System B
Number of processes / nodes
Thro
ugh
pu
t in
[kt
ps]
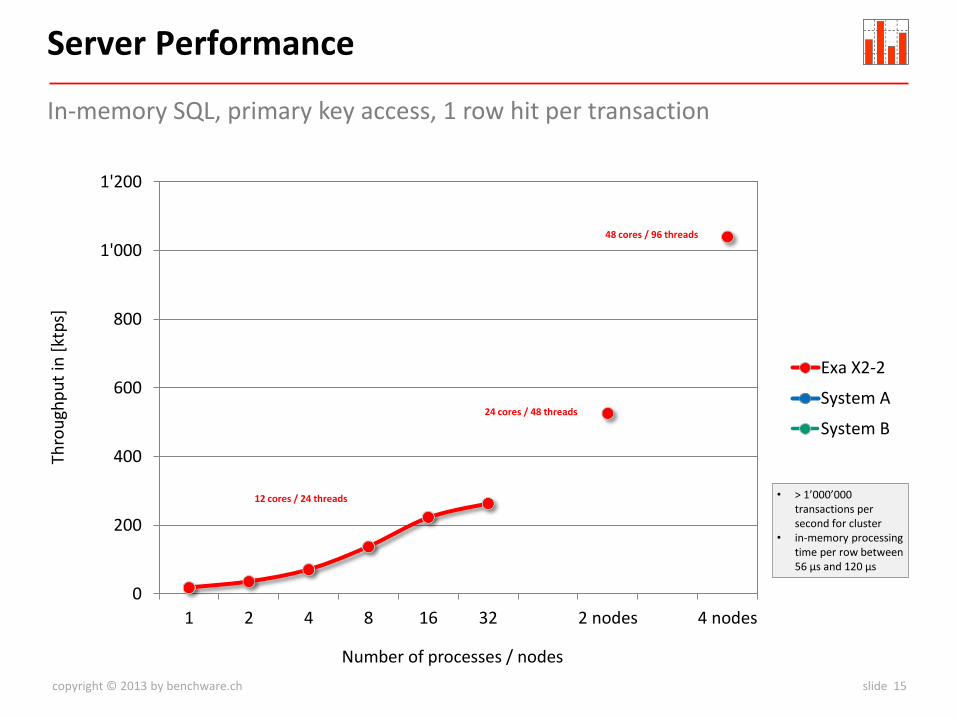
In-memory SQL, primary key access, 1 row hit per transaction
12 cores / 24 threads • > 1’000’000 transactions per second for cluster
• in-memory processing time per row between 56 μs and 120 μs
24 cores / 48 threads
48 cores / 96 threads

copyright © 2013 by benchware.ch slide 16
Server Performance
CPU CPU CPU CPU Throughput Throughput SQL service Buffer Buffer Elap
busy user sys idle rows/sec txn/sec time lread pread time
Run Tst Code #N #J #T [%] [%] [%] [%] [rps] [tps] [s] [bps] [bps] [s]
---- ---- ------ ---- ----- ---- ---- ---- ---- ---- ----------- ----------- ----------- ----------- ----------- -----
1 85 SRV-21 1 1 1 2 1 0 98 1.810E+04 1.810E+04 5.520E-05 5.436E+04 0.000E+00 116
86 SRV-21 1 2 1 3 2 1 97 3.590E+04 3.590E+04 5.531E-05 1.078E+05 0.000E+00 117
87 SRV-21 1 4 1 5 4 1 95 7.059E+04 7.059E+04 5.520E-05 2.119E+05 0.000E+00 119
88 SRV-21 1 8 1 9 7 1 91 1.377E+05 1.377E+05 5.533E-05 4.132E+05 0.000E+00 122
89 SRV-21 1 16 1 17 14 2 83 2.238E+05 2.238E+05 6.883E-05 6.712E+05 0.000E+00 126
90 SRV-21 1 32 1 25 21 3 75 2.630E+05 2.630E+05 1.184E-04 7.855E+05 0.000E+00 127
91 SRV-21 2 64 1 49 42 7 51 5.264E+05 5.264E+05 1.180E-04 1.570E+06 0.000E+00 129
92 SRV-21 4 128 1 97 85 13 3 1.040E+06 1.040E+06 1.185E-04 3.103E+06 0.000E+00 129
Exa
2-2
HR
In-memory SQL, primary key access, 1 row hit per transaction
Legend: #N number of RAC nodes #J number of jobs #T number of threads (PX) [rps] rows per second [tps] transactions per second [bps] blocks per second [s] elapsed time in seconds
copyright © 2013 by benchware.ch slide 17
Server Performance
0
2'000
4'000
6'000
8'000
10'000
12'000
1 2 4 8 16 32 2nodes
4nodes
Exa X2-2
System A
System B
Number of processes / nodes
Thro
ugh
pu
t in
[kt
ps]
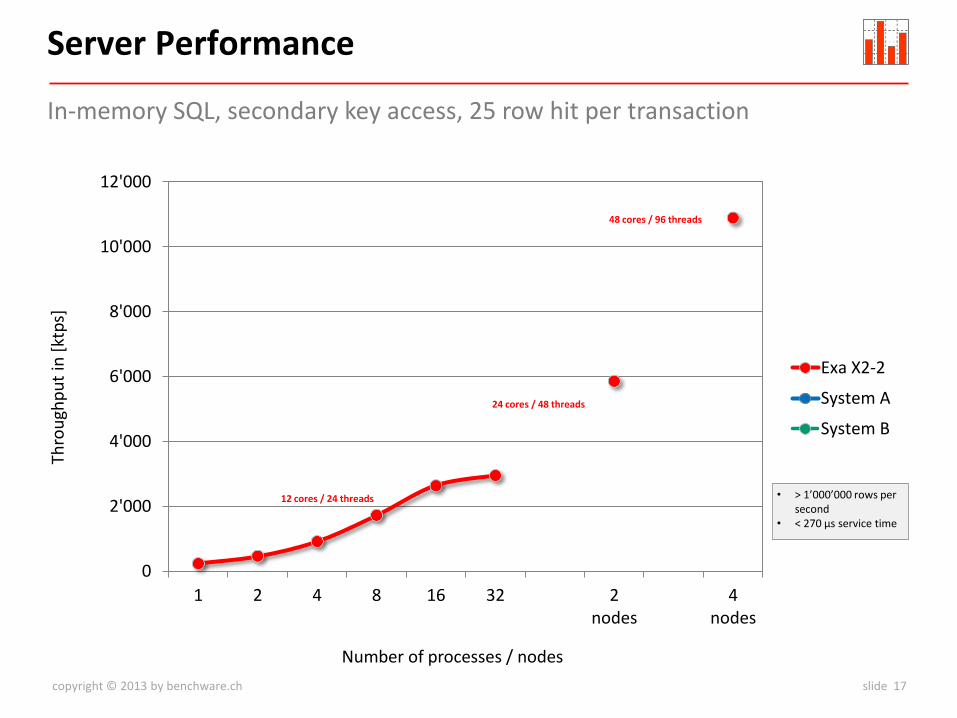
In-memory SQL, secondary key access, 25 row hit per transaction
12 cores / 24 threads • > 1’000’000 rows per second
• < 270 μs service time
24 cores / 48 threads
48 cores / 96 threads
copyright © 2013 by benchware.ch slide 18
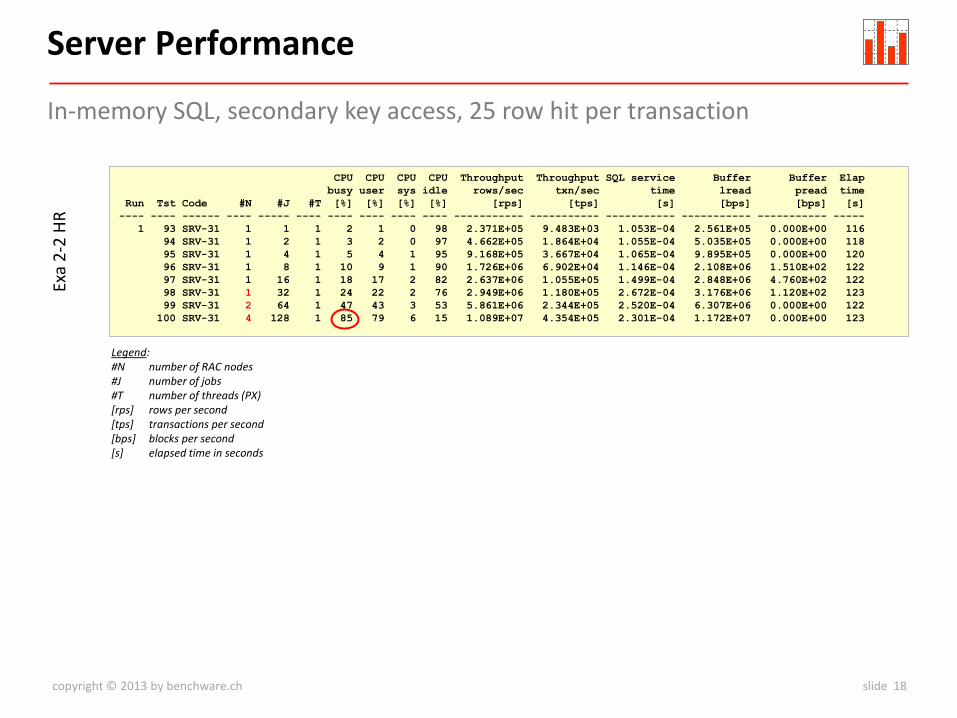
Server Performance
CPU CPU CPU CPU Throughput Throughput SQL service Buffer Buffer Elap
busy user sys idle rows/sec txn/sec time lread pread time
Run Tst Code #N #J #T [%] [%] [%] [%] [rps] [tps] [s] [bps] [bps] [s]
---- ---- ------ ---- ----- ---- ---- ---- ---- ---- ----------- ----------- ----------- ----------- ----------- -----
1 93 SRV-31 1 1 1 2 1 0 98 2.371E+05 9.483E+03 1.053E-04 2.561E+05 0.000E+00 116
94 SRV-31 1 2 1 3 2 0 97 4.662E+05 1.864E+04 1.055E-04 5.035E+05 0.000E+00 118
95 SRV-31 1 4 1 5 4 1 95 9.168E+05 3.667E+04 1.065E-04 9.895E+05 0.000E+00 120
96 SRV-31 1 8 1 10 9 1 90 1.726E+06 6.902E+04 1.146E-04 2.108E+06 1.510E+02 122
97 SRV-31 1 16 1 18 17 2 82 2.637E+06 1.055E+05 1.499E-04 2.848E+06 4.760E+02 122
98 SRV-31 1 32 1 24 22 2 76 2.949E+06 1.180E+05 2.672E-04 3.176E+06 1.120E+02 123
99 SRV-31 2 64 1 47 43 3 53 5.861E+06 2.344E+05 2.520E-04 6.307E+06 0.000E+00 122
100 SRV-31 4 128 1 85 79 6 15 1.089E+07 4.354E+05 2.301E-04 1.172E+07 0.000E+00 123
Exa
2-2
HR
In-memory SQL, secondary key access, 25 row hit per transaction
Legend: #N number of RAC nodes #J number of jobs #T number of threads (PX) [rps] rows per second [tps] transactions per second [bps] blocks per second [s] elapsed time in seconds
copyright © 2013 by benchware.ch slide 19
1 Introduction to Server Performance Tests
2 CPU and Server Configuration
3 Benchmark Results – In-Memory SQL Operations
4 Reviewing Server Benchmark Results
Contents

copyright © 2013 by benchware.ch slide 20
Performance Results
Metric One Exadata X2-2 Database Server
System A to compare
System B to compare
#cores 12
#threads 24
In-memory SQL operations Metric One Exadata X2-2 Database Server
System A to compare
System B to compare
Single thread speed
Full table scan
Primary key access
Secondary key access
[Mrps]
[tps]
[Mrps]
2.4
18’100@56μs
0.237
Throughput
Full table scan
Primary key access
Secondary key access
[Mrps]
[tps]
[Mrps]
37.9
263’000@120μs
2.949
Reviewing Server Performance
Legend: [Mrps] million rows per second [tps] transactions per second
copyright © 2013 by benchware.ch slide 21
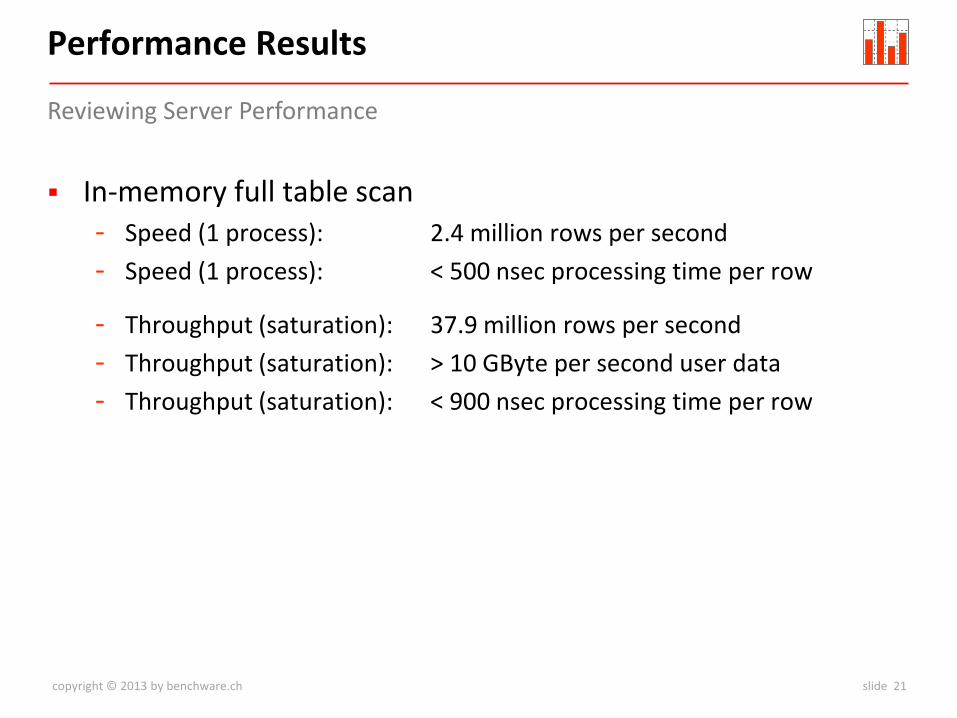
Performance Results
Reviewing Server Performance
In-memory full table scan - Speed (1 process): 2.4 million rows per second
- Speed (1 process): < 500 nsec processing time per row
- Throughput (saturation): 37.9 million rows per second
- Throughput (saturation): > 10 GByte per second user data
- Throughput (saturation): < 900 nsec processing time per row
copyright © 2013 by benchware.ch slide 22
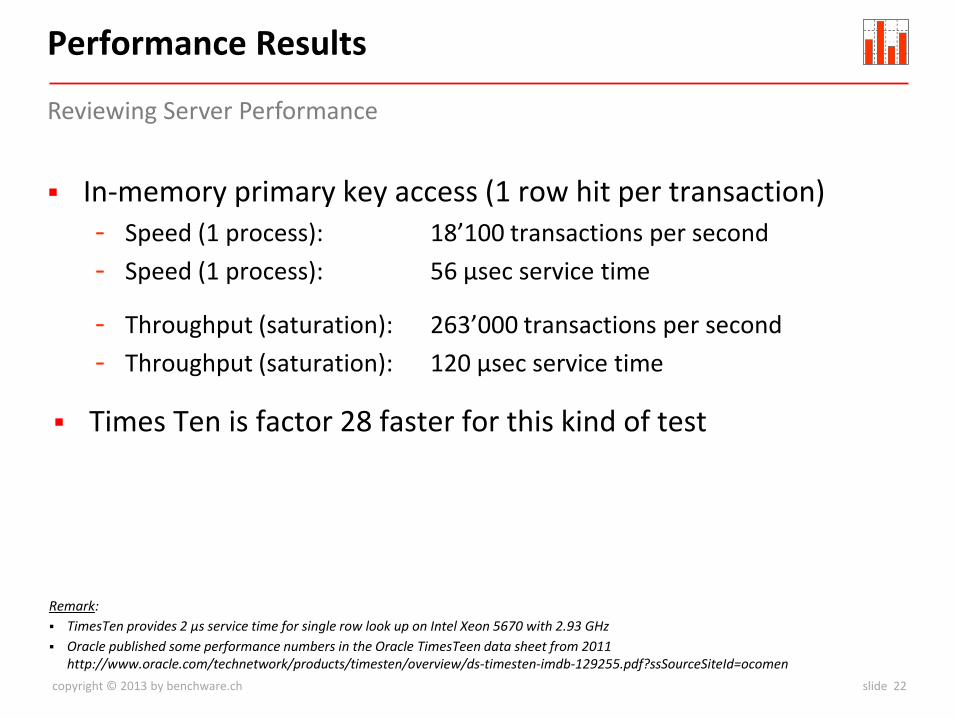
Performance Results
Reviewing Server Performance
In-memory primary key access (1 row hit per transaction) - Speed (1 process): 18’100 transactions per second
- Speed (1 process): 56 μsec service time
- Throughput (saturation): 263’000 transactions per second
- Throughput (saturation): 120 μsec service time
Times Ten is factor 28 faster for this kind of test
Remark:
TimesTen provides 2 μs service time for single row look up on Intel Xeon 5670 with 2.93 GHz
Oracle published some performance numbers in the Oracle TimesTeen data sheet from 2011 http://www.oracle.com/technetwork/products/timesten/overview/ds-timesten-imdb-129255.pdf?ssSourceSiteId=ocomen