Embed Size (px)
Citation preview
Atmospheric Environment 37 Supplement No. 2 (2003) S135–S147
Performance audits and laboratory comparisons forSCOS97-NARSTO measurements of speciated volatile
organic compounds
Eric M. Fujitaa,*, Gregory Harshfieldb, Laurence Sheetza
aDivision of Atmospheric Sciences, Desert Research Institute, 2215 Raggio Parkway Reno, NV 89512-1095, USAbColorado Department of Public Health and Environment, 4300 Cherry Creek Drive South, Denver, CO 80246-1530, USA
Received 8 January 2002; accepted 10 March 2003
Abstract
Performance audits and laboratory comparisons were conducted as part of the quality assurance program for the
1997 Southern California Ozone Study (SCOS97-NARSTO) to document potential measurement biases among
laboratories measuring speciated nonmethane hydrocarbons (NMHC), carbonyl compounds, halogenated compounds,
and biogenic hydrocarbons. The results show that measurements of volatile organic compounds (VOC) made during
SCOS97-NARSTO are generally consistent with specified data quality objectives. The hydrocarbon comparison
involved nine laboratories and consisted of two sets of collocated ambient samples. The coefficients of variation among
laboratories for the sum of the 55 PAM target compounds and total NMHC ranged from75 to 15 percent for ambient
samples from Los Angeles and Azusa. Abundant hydrocarbons are consistently identified by all laboratories, but
discrepancies occur for olefins greater than C4 and for hydrocarbons greater than C8. Laboratory comparisons for
halogenated compounds and biogenic hydrocarbons consisted of both concurrent ambient sampling by different
laboratories and round-robin analysis of ambient samples. The coefficients of variation among participating
laboratories were about 10–20 percent. Performance audits were conducted for measurement of carbonyl compounds
involving sampling from a standard mixture of carbonyl compounds. The values reported by most of the laboratories
were within 10–20 percent of those of the reference laboratory. Results of field measurement comparisons showed larger
variations among the laboratories ranging from 20 to 40 percent for C1–C3 carbonyl compounds. The greater variations
observed in the field measurement comparison may reflect potential sampling artifacts, which the performance audits
did not address.
r 2003 Elsevier Ltd. All rights reserved.
Keywords: Volatile organic compounds; VOC speciation; Quality assurance; Laboratory audits; Laboratory comparisons
1. Introduction
During the summer of 1997, a consortium of state,
local, and federal agencies sponsored the 1997 Southern
California Ozone Study (SCOS97-NARSTO). An im-
portant component of SCOS97-NARSTO was the
acquisition of speciated hydrocarbon and carbonyl
compound data, which were used to evaluate emission
inventory input data and photochemical model perfor-
mance, to specify photochemical model boundary and
initial conditions, and to attribute source contributions
through receptor modeling. As part of the SCOS97-
NARSTO quality assurance program, performance
audits and laboratory comparisons were conducted for
speciated hydrocarbons, carbonyl compounds, halogen-
ated compounds, and biogenic hydrocarbons. These
external quality assessments document potential mea-
surement biases among volatile organic compounds
ARTICLE IN PRESS
AE International – North America
*Corresponding author. Tel.: +1-775-674-7084; fax: +1-
775-674-7008.
E-mail address: [email protected] (E.M. Fujita).
1352-2310/03/$ - see front matter r 2003 Elsevier Ltd. All rights reserved.
doi:10.1016/S1352-2310(03)00386-8
(VOC) measurement methods and laboratories that may
affect the interpretation of subsequent modeling and
data analysis.
1.1. Summary of SCOS97-NARTO VOC measurements
Several organizations participated during SCOS97-
NARSTO in collecting data for a wide range of volatile
organic compounds using a variety of sample collection
and analysis methods. The Photochemical Assessment
Monitoring Stations (PAMS) in the study region
provided the foundation for the SCOS97-NARSTO
VOC measurements. PAMS ozone precursor monitor-
ing is conducted annually in California during the peak
ozone season (1 July–30 September). There were 13
PAMS sites in operation during SCOS97-NARSTO
(three in Ventura County, five in the South Coast Air
Basin (SoCAB), one in the Southeast Desert Air Basin,
and four in the San Diego Air Basin). EPA Compen-
dium Methods TO-14A (United States Environmental
Protection Agency USEPA, 1999a) and TO-11A (Uni-
ted States Environmental Protection Agency USEPA,
1999b) are used in the PAMS program for sampling and
analysis of speciated hydrocarbons and carbonyl com-
pounds, respectively. The database consists of 55
individual hydrocarbons, total nonmethane organic
compounds (NMOC), and three carbonyl compounds
(formaldehyde, acetaldehyde, and acetone).
The United States Environmental Protection Agency
(USEPA) rule requires eight 3-h hydrocarbon samples
(midnight–3 a.m., 3–6 a.m., 6–9 a.m., 9–noon, noon–
3 p.m., 3–6 p.m., 6–9 p.m., and 9–midnight PDT) every
day at Type 2 sites (central business district) and every
third day at all other PAMS sites. Sampling for carbonyl
compounds is required at Type 2 sites only. In addition,
one 24-h sample is required every 6th day year-round at
Type 2 sites and during the summer monitoring period
at all other sites. Under the California Alternative Plan,
four 3-h samples (3–6 a.m., 6–9 a.m., 1–4 p.m., and 5–
8 p.m., PDT) are collected every third day during the
monitoring period at all PAMS sites for speciated
hydrocarbons and at Type 2 sites only for carbonyl
compounds. In addition to the regularly scheduled
measurements, samples are collected on a forecast basis
during up to five high-ozone episodes of at least two
consecutive days. Episodic measurements consist of four
samples per day (6–9 a.m., 9–noon, 1–4 p.m., and 5–
8 p.m., PDT) for speciated hydrocarbons at all PAMS
sites and for carbonyl compounds at Type 2 sites. The
Ventura County Air Pollution Control District
(VCAPCD) and San Diego Air Pollution Control
District (SDAPCD) conducted their PAMS monitoring
according to the alternative plan, while South Coast Air
Quality Management District (SCAQMD) operated
theirs according to the EPA Rule.
VCAPCD and SDAPCD supplemented their existing
PAMS sampling schedule by including all SCOS97-
NARSTO intensive operation days (IOP) days. Field
operators from the University of California, Riverside
College of Engineering Center for Environmental
Research and Technology (CE-CERT) collected VOC
samples in the SoCAB during SCOS97-NARSTO IOPs
at Azusa, Anaheim, Burbank, Los Angeles—N. Main,
and Los Angeles—ARCO Plaza. Airborne VOC sam-
ples were also collected onboard the four aircraft that
were deployed during the study. Additional VOC
samples were collected at background locations at San
Nicolas Island, Catalina Island, Point Conception,
Rosarito Beach, and SE Mexicali. The VOC samples
that were collected specifically for IOPs were analyzed at
Desert Research Institute (DRI), Biospheric Research
Corporation (BRC), Atmospheric Assessment Associ-
ates, Inc. (AtmAA), and Atmospheric Analysis and
Consulting, Inc. (AAC).
The USEPA and their contractor ManTech Environ-
mental Technology, Inc. (ManTech) monitored hydro-
carbons at Azusa on a continuous (hourly) basis during
the month of September. The species measured also
included carbonyl compounds, biogenic hydrocarbons,
and chlorinated hydrocarbons. Daniel Grosjean and
Associates (DGA) and DRI measured the halogenated
hydrocarbons perchloroethylene and methyl chloro-
form. These compounds serve as ‘‘tracers of opportu-
nity’’ that can be used to tag emissions from the SOCAB
into the Mohave Desert. DRI measured several other
halogenated compounds.
During SCOS97-NARSTO, researchers from the
University of California, Riverside measured biogenic
hydrocarbon (BHC) in the SOCAB and the Ojai area.
Isoprene, monoterpenes, and methylvinylketone (MVK)
were measured during afternoon upslope flows at a high
elevation site in the San Gabriel Mountains. In addition,
UC Riverside measured methylnitronaphthalenes to
infer 12-h-average nitrate radical mixing ratios, the
dominant nighttime sink of BHC. Several other
laboratories made surface and aircraft measurements
of isoprene and monoterpene for later comparison with
UC Riverside.
2. Description of performance audits and laboratory
comparisons
Performance audits and laboratory comparisons were
coordinated and arranged for speciated hydrocarbons,
carbonyl compounds, biogenic compounds, and halo-
genated compounds. The SCOS97-NARSTO data
quality objectives for VOC measurements (Fujita et al.,
1997a) are 75%, 715%, and greater than 90% for
precision, accuracy and data completeness, respectively.
Target detection limits were 0.1, 1, and 0.01 ppbv for
ARTICLE IN PRESSE.M. Fujita et al. / Atmospheric Environment 37 Supplement No. 2 (2003) S135–S147S136
C2–C11 hydrocarbons, carbonyl compounds, and halo-
genated compounds, respectively. Protocols for the
performance audits and comparisons are summarized
here and documented in greater detail in Fujita et al.
(1999).
2.1. Speciated hydrocarbons
Hydrocarbon speciation measurements consisted of
canister sampling followed by gas chromatographic ana-
lysis with flame ionization detection (Method TO-14).
Laboratories employed commercial gas chromato-
graphic systems equipped with flame ionization detec-
tors (GC-FID), a cryogenic concentration step, and
computerized data acquisition systems. Procedures used
for instrument calibration varied among the labora-
tories. For calibration of the FID, propane is commonly
used for C2–C4 hydrocarbons and benzene or hexane is
used for greater than C4 hydrocarbons. The systematic
differences resulting from variations in FID response
among different calibration gases are typically less than
5 percent. With the exception of BRC, all laboratories
calibrated their chromatographs in volume concentra-
tion units (area response/ppbC). The calibration by
BRC is in terms of mass (area response/ng) of an
internal standard that is added to each sample. Besides
selection of the endpoint of the gas chromatographic
run, factors that can affect total measured mixing ratios
include selection of threshold levels for peak integration
and losses during cryogenic concentration and desorp-
tion and surface adsorption within the inlet system.
Automated, semi-continuous hydrocarbon speciation
was obtained by SCAQMD at the Pico Rivera PAMS
site using an Entech 2000 preconcentrator and HP5890
gas chromatograph. In this arrangement, the samples
are collected into an evacuated 6L summa canister over
a 170-min interval. Five minutes are required for sample
loading and 5min for heating and evacuating the
canister between samples. The Entech 2000 preconcen-
trator is a multibed sorbent trap containing Carbopack
B and Carbosieve S III. The sorbent trap is dry purged
with a 250 cm3 volume of He gas. The sample is
thermally desorbed and injected onto the chromato-
graphic column. Speciation is accomplished with a dual
column/FID method. Initially, the DB-1 capillary and
the Astec GasPro GSC PLOT columns are in series.
After the C2 through C4 hydrocarbons have eluted off
the DB-1 column and onto the PLOT column, a rotary
valve is activated to switch the columns in parallel.
Hence, the C2–C4 hydrocarbons are resolved on the
PLOT column and C5–C12 hydrocarbons are separated
on the DB-1 column. A standard containing all PAMS
targets and certified for propane and benzene and zero-
air blank are run daily. C2–C4 analytes are quantitated
using propane standard response and C5–C12 analytes
are quantitated using the standard benzene response.
The average detection limit for PAMS target is
0.2 ppbC.
Hourly volatile organic compound speciation was
obtained by ManTech at Azusa using a Xontech/Saturn
AutoGC ion trap mass spectrometer system. The VOCs
are desorbed from a Stirling cryotrap onto a DB-1
chromatographic column. Target compounds include
the PAMS list, selected terpenes, oxygenates (n-alde-
hydes, methyl tert-butyl ether (MTBE), methyl vinyl
ketone (MVK), and others, and TO-14 compounds.
Laboratory comparisons were conducted for labora-
tories that participated in SCOS97-NARSTO to deter-
mine consistency in reported mixing ratios for individual
species and total NMHC, species identification, and
fractions of identified NMHC. Three sets of collocated
ambient samples were used in the comparisons to
reproduce the range of VOC mixtures encountered
during SCOS97-NARSTO. One set was collected in
the morning in an area heavily influenced by mobile
source emissions (Los Angeles—N. Main). A second set
was collected in the afternoon in a downwind area with
high ozone levels (Azusa). Background samples were
also collected during the afternoon at Santa Monica
Beach. Participating laboratories included the California
Air Resources Board (ARB), US EPA, BRC, DRI,
SDAPCD, SCAQMD, VCAPCD, Bay Area Air Quality
Management District (BAAQMD), and ManTech. DRI
and Research Division of the ARB coordinated the
comparison with assistance from the Monitoring and
Laboratory Division of the ARB.
Each laboratory supplied two cleaned, evacuated 6-l
canisters. EPA, BRC, and DRI supplied additional
canisters for collection of duplicate and background
samples. ARB personnel from the Monitoring and
Laboratory Division filled the two sets of canisters to
20–25 psi with ambient air from the Los Angeles area
using a manifold sampling system supplied by DRI.
Duplicate samples were collected for EPA, ARB, and
DRI (total of 11 simultaneous canister samples at each
site). The laboratories were requested to analyze the
samples within five working days after receiving the
canisters.
2.2. Carbonyl compounds
Derivation of carbonyl compounds by 2,4-dinitrodi-
nitrophenylhydrazine (DNPH) followed by liquid chro-
matography and UV detection is a widely used method
for measuring ambient carbonyl compounds. Collection
of carbonyl compounds by this method is based on the
acid-catalyzed derivatization of carbonyls by nucleophi-
lic addition of the DNPH to a C=O bond, followed by
1,2-elimination of water to form 2,4-dinitrophenyl-
hydrazone. The DNPH-hydrazones, formed during
sampling, are nonvolatile and remain on the reagent-
impregnated cartridge. The yellow to deep-orange
ARTICLE IN PRESSE.M. Fujita et al. / Atmospheric Environment 37 Supplement No. 2 (2003) S135–S147 S137
colored DNPH-hydrazones have UV absorption max-
ima in the 360–375 nm range and are analyzed by a high
performance liquid chromatography (HPLC) method
coupled with UV detection. Although C1–C7 carbonyl
compounds are typically measured by this method, the
PAMS program requires state and local agencies to
report only formaldehyde, acetaldehyde, and acetone.
Despite the widespread use of the DNPH methods,
interferences and sampling artifacts have been asso-
ciated with the methods. The analytical method is well
established, and questions regarding the accuracy of the
DNPH method are mainly concerned with sampling.
The major concerns are: (1) incomplete collection of
carbonyls, (2) loss of carbonyl compounds by physical
processes such as adsorption or chemical reaction with
copollutants such as ozone, (3) generation of carbonyl
compounds as sampling artifacts (Apel et al., 1998), and
(4) variable blanks resulting from contamination of the
reagent and sampling equipment. The factors affecting
carbonyl measurements by the DNPH method were
reviewed by Fujita et al. (1997b) for the NARSTO-
Northeast 1995 Hydrocarbon and Carbonyl Measure-
ment Audits. Relevant parameters include the substrate
(type, DNPH loadings, blank levels, and variability),
sampling conditions (ambient ozone mixing ratios,
temperature, relative humidity, sample volume measure-
ments, breakthrough, type of sampling line, and ozone
scrubber), sample storage, and handling (exposure to
light and heat, type of storage and duration of storage),
sample preparation and analysis (extraction efficiency
and instrument calibration, peak resolution).
Two variations of this method were used during
SCOS97-NARSTO. AAC, AtmAA, DRI, SCAQMD,
and VCAPCD collected ambient carbonyl compounds
using C18 (octadecylsilane-bonded silica) Sep-Pak car-
tridges (Waters Associates, Milford, MA) impregnated
with acidified DNPH reagent, while SDAPCD used
similarly impregnated silica Sep-Pak cartridges recom-
mended by EPA Compendium Method TO-11A, which
is the standard method used nationally in PAMS.
Cartridge samples were taken using automated multi-
ple-channel sequential samplers with a typical sampling
flow rate of about 1.0 l/min. The PAMS variant of the
DNPH method includes an ozone scrubber upstream of
the impregnated cartridge since silica cartridges were
found to have negative ozone artifacts (Arnst and
Tejada, 1989). This artifact was not observed with C18
cartridges in comparison of the method with spectro-
scopic measurements of formaldehyde (Fung and
Wright, 1990; Lawson et al., 1990; Fung, 1993), and
ozone scrubbers were not used with C18 cartridges.
However, the guidance in EPA Compendium Method
TO-14A currently recommends the use of ozone
scrubbers for both C18 and silica gel cartridges because
positive ozone artifacts have been observed with C18
cartridges (Apel et al., 1998).
The laboratory performance audit for the measure-
ment of carbonyl compounds consisted of passing a
known volume of a standard mixture of carbonyls onto
a DNPH cartridge. The standard mixture was prepared
at DRI in a 33-l stainless-steel tank. Carbonyl com-
pounds were directly injected by microsyringe into a 1-l
glass bulb. The mixture in the glass bulb was transferred
into a 33-l stainless-steel canister by sweeping the
contents of the bulb into the canister with humidified
nitrogen gas to a pressure of 30 psi. Dry nitrogen gas
was then added to the canister to bring the total canister
pressure up to 80 psi. The mixture was prepared on 19
May 1997. The first sample from the standard mixture
was collected onto DNPH cartridges during the week of
15 June. Aliquots of the standard mixture were
transferred from the 33-l tank into 6-l transfer canisters
about 10 days before a transfer canister was sent to a
laboratory for an audit. After an equilibration period of
1 week, a sample was collected from the transfer canister
onto a DNPH C18 cartridges for HPLC analysis.
The SCAQMD, SDAPCD, VCAPCD, AtmAA, and
AAC participated in the audit. A dilution apparatus was
provide for the audit with the transfer canister contain-
ing the standard mixture of carbonyl compounds. The
gas dilution and delivery system was designed to allow
addition of the standard gas mixture at a constant flow
of up to 20 sccm (70�F and 29.92 in Hg). It consists of a
Sierra Instruments, Inc. Gas-Trak mass flow controller,
model number 810C-SQR-249 (Serial No. C1261), 6-l
stainless-steel canisters containing the gas transfer
standard, and a three-way valve and tee assembly. The
flow controller was preset to provide a flow of
5.0mlmin. Prior to shipment of the gas dilution and
delivery system, the fittings and stainless steel sampling
lines were cleaned with deionized water and baked at
170�C for 24 h.
Each laboratory collected two replicate samples from
the transfer canister. The audit protocol specified a 3-h
sampling period using two DNPH cartridges in series at
a nominal flow rate of 1 l of ambient air per minute. The
purpose of the first cartridge was to scrub the incoming
ambient air. The standard mixture was added between
the two cartridges through a sampling tee at a nominal
flow rate of 5ml/min. A third cartridge was placed
downstream of the sample cartridge to quantify any
breakthrough that might have occurred. However, this
step was omitted if it resulted in an excessive pressure
drop. Data were reported for the sample and front
scrubber cartridges.
At least two blanks were collected during the audit.
Cartridge end-caps for the blank cartridges were
removed and left off for the time required to place
new cartridges in the sampler (typically a few minutes).
After this brief exposure, the blank cartridges were
sealed again with the end-caps and placed inside the
sampler until the sample cartridges were removed from
ARTICLE IN PRESSE.M. Fujita et al. / Atmospheric Environment 37 Supplement No. 2 (2003) S135–S147S138
the sampler. Each laboratory collected two samples and
passed the standard mixture and gas dilution system on
to the next laboratory. The transfer canisters were
replaced as necessary. The contents of the transfer
canisters were analyzed at DRI by DNPH/HPLC prior
to shipment and upon its return. Each laboratory
performed two replicate measurements for each of the
two samples in order to determine analytical precision.
Data were reported to the ARB and were forwarded to
DRI for analysis once DRI’s data for the initial and final
standard mixing ratios were sent to the ARB.
The performance audits for the aircraft sampling of
carbonyl compounds were similar to surface-based
measurements. The main procedural difference is that
the Tedlar bags were filled with zero-air at the time of
the addition of the standard carbonyl mixture.
SDAPCD and AtmAA collected one sample from a
Tedlar bag by first filling the bag with the standard
mixture diluted with scrubbed ambient air or zero air
(also with inline scrubber). Samples were transferred
from the bag to the cartridge in accordance with the
procedures used during SCOS97-NARSTO.
2.3. Field comparison for measurement of carbonyl
compounds
A field measurement comparison involving collocated
carbonyl sampling was conducted on 23 and 24
September at Azusa. Participants included DRI, At-
mAA, AAC, SCAQMD, and VCAPCD. The collocated
ambient sampling was intended to examine variations
among measurement laboratories in reported values of
carbonyl compounds under field conditions when ozone
levels are comparable to those encountered during
SCOS97-NARSTO Intensive Operational Periods. One
of the objectives of the collocated sampling was to
compare values obtained for samples collected by
DNPH-impregnated silica gel cartridges with KI denu-
der versus DNPH-impregnated C18 cartridges without
an ozone scrubber. However, this objective was not
achieved because all laboratories used C18 cartridges.
The comparison also examined amounts of break-
through by collecting duplicate cartridges in series, and
levels and variability of field blanks.
The comparisons consisted of collocated samplings at
the Azusa monitoring station through a common
sampling manifold that was provided at the site.
Collocated sampling was conducted on two consecutive
non-IOPs days. A total of four 3-h samples were
collected according to the following schedule: first
day—1–4 p.m., and 5–8 p.m. PDT; second day—6–9
a.m. and 9 a.m.–noon. A duplicate sample was collected
during the 9 a.m.–noon sampling period of the second
day by laboratories that have the ability to collect
parallel samples. A backup cartridge, placed in series
with the primary sample, was collected during the 1–4
p.m. period of the first sampling day and 6–9 a.m. period
of the second day of sampling. A minimum of two field
blanks was collected during the comparison, one for
each day of sampling.
Each analytical laboratory processed and analyzed all
comparison samples within 10 working days after
collection, and performed replicate analyses for all four
samples in order to determine analytical precision. Each
laboratory reported their data to the ARB within 4
weeks of field sampling. The submittal included: mixing
ratio data and associated uncertainties for individual
C1–C7 carbonyl compounds; field data needed to
calculate sample volumes including temperature and
pressure if volume adjustments are made and nominal
volume uncertainty; and laboratory data (mass of
analyte per sample, extraction volume and correction
for extraction efficiency and uncertainty if applicable,
and all blank samples used in deriving the mean blank
subtractions). Data were forwarded to DRI for analysis
after the ARB had received data from all participants.
2.4. Biogenic compounds
The purpose of these comparisons was to document
differences that may exist between measurement labora-
tories, and to compare isoprene values obtained from
canisters and solid adsorbent tubes. Isoprene was the
main compound of interest for this comparison.
Although some questions exist concerning the stability
of terpenes in canisters, these compounds were also
reported if observed in the sample.
UC Riverside collected two canister samples along
with adsorbent tube samples on the campus of UC
Riverside on 1 August 1997 from 2:30 to 6:15 p.m. The
two canisters, one supplied by BRC and one by DRI,
were collected simultaneously using a DRI sampler to a
minimum pressure of 15 psig. BRC and DRI analyzed
their respective canisters. DRI sent their canister to
ManTech after completing their analysis. Each labora-
tory submitted their data to the ARB, which forwarded
the data to DRI for evaluation.
2.5. Halogenated compounds
Halogenated compounds can be quantified from
canister samples, with the same column as used for
C3–C11 hydrocarbons. However, electron capture detec-
tion is used rather than flame ionization due to the
weaker and variable response of halogenated com-
pounds on the FID. This method was used by DGA
to measure peroxyacetylnitrate (PAN) as well as
perchloroethylene and methylchloroform at Azusa and
Simi Valley and by DRI (Schorran) to measure
halogenated ‘‘tracers of opportunity’’ at Lancaster and
Barstow.
ARTICLE IN PRESSE.M. Fujita et al. / Atmospheric Environment 37 Supplement No. 2 (2003) S135–S147 S139
Two canister samples that were collected at the Azusa
monitoring station during the second SCOS97-NAR-
STO IOP were analyzed in round-robin fashion by
laboratories performing measurements of halogenated
hydrocarbons. After speciated hydrocarbon analysis,
BRC also analyzed the two comparison samples for
halogenated hydrocarbons. These samples were then
sent to DRI (Zielinska), DRI (Schorran), and ManTech,
in round-robin fashion in that order, for analysis of
halogenated hydrocarbons. Continuous measurements
of halogenated hydrocarbons that were made at Azusa
by DGA were also included in the comparison. Each
laboratory submitted their data to the ARB who then
forwarded the data to DRI for evaluation.
3. Results and discussion
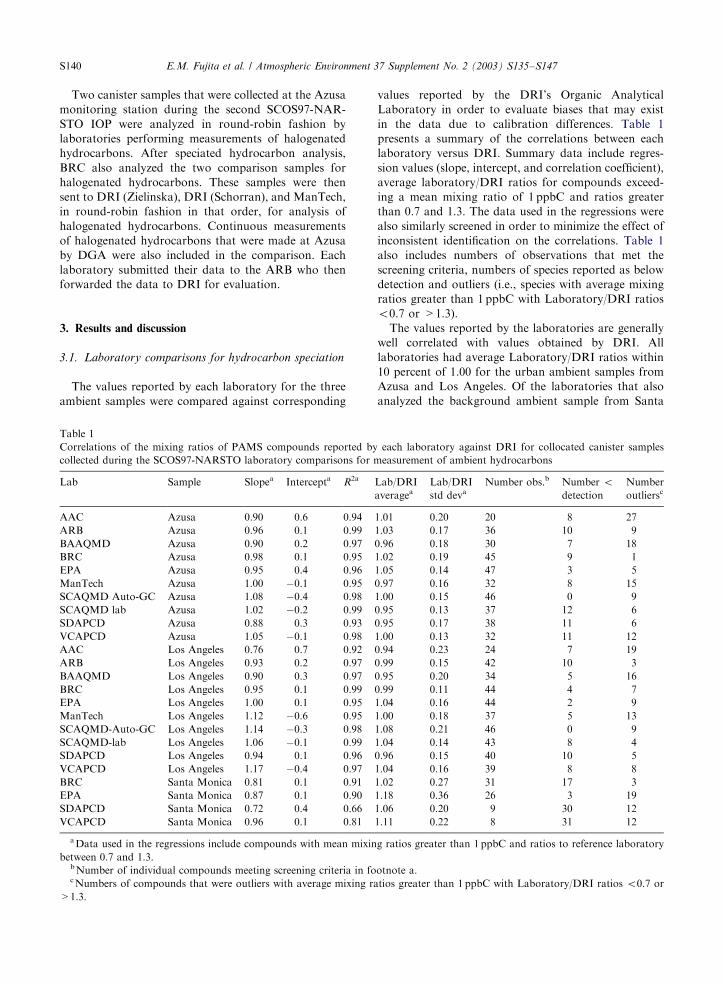
3.1. Laboratory comparisons for hydrocarbon speciation
The values reported by each laboratory for the three
ambient samples were compared against corresponding
values reported by the DRI’s Organic Analytical
Laboratory in order to evaluate biases that may exist
in the data due to calibration differences. Table 1
presents a summary of the correlations between each
laboratory versus DRI. Summary data include regres-
sion values (slope, intercept, and correlation coefficient),
average laboratory/DRI ratios for compounds exceed-
ing a mean mixing ratio of 1 ppbC and ratios greater
than 0.7 and 1.3. The data used in the regressions were
also similarly screened in order to minimize the effect of
inconsistent identification on the correlations. Table 1
also includes numbers of observations that met the
screening criteria, numbers of species reported as below
detection and outliers (i.e., species with average mixing
ratios greater than 1 ppbC with Laboratory/DRI ratios
o0.7 or >1.3).
The values reported by the laboratories are generally
well correlated with values obtained by DRI. All
laboratories had average Laboratory/DRI ratios within
10 percent of 1.00 for the urban ambient samples from
Azusa and Los Angeles. Of the laboratories that also
analyzed the background ambient sample from Santa
ARTICLE IN PRESS
Table 1
Correlations of the mixing ratios of PAMS compounds reported by each laboratory against DRI for collocated canister samples
collected during the SCOS97-NARSTO laboratory comparisons for measurement of ambient hydrocarbons
Lab Sample Slopea Intercepta R2a Lab/DRI
averageaLab/DRI
std devaNumber obs.b Number o
detection
Number
outliersc
AAC Azusa 0.90 0.6 0.94 1.01 0.20 20 8 27
ARB Azusa 0.96 0.1 0.99 1.03 0.17 36 10 9
BAAQMD Azusa 0.90 0.2 0.97 0.96 0.18 30 7 18
BRC Azusa 0.98 0.1 0.95 1.02 0.19 45 9 1
EPA Azusa 0.95 0.4 0.96 1.05 0.14 47 3 5
ManTech Azusa 1.00 �0.1 0.95 0.97 0.16 32 8 15
SCAQMD Auto-GC Azusa 1.08 �0.4 0.98 1.00 0.15 46 0 9
SCAQMD lab Azusa 1.02 �0.2 0.99 0.95 0.13 37 12 6
SDAPCD Azusa 0.88 0.3 0.93 0.95 0.17 38 11 6
VCAPCD Azusa 1.05 �0.1 0.98 1.00 0.13 32 11 12
AAC Los Angeles 0.76 0.7 0.92 0.94 0.23 24 7 19
ARB Los Angeles 0.93 0.2 0.97 0.99 0.15 42 10 3
BAAQMD Los Angeles 0.90 0.3 0.97 0.95 0.20 34 5 16
BRC Los Angeles 0.95 0.1 0.99 0.99 0.11 44 4 7
EPA Los Angeles 1.00 0.1 0.95 1.04 0.16 44 2 9
ManTech Los Angeles 1.12 �0.6 0.95 1.00 0.18 37 5 13
SCAQMD-Auto-GC Los Angeles 1.14 �0.3 0.98 1.08 0.21 46 0 9
SCAQMD-lab Los Angeles 1.06 �0.1 0.99 1.04 0.14 43 8 4
SDAPCD Los Angeles 0.94 0.1 0.96 0.96 0.15 40 10 5
VCAPCD Los Angeles 1.17 �0.4 0.97 1.04 0.16 39 8 8
BRC Santa Monica 0.81 0.1 0.91 1.02 0.27 31 17 3
EPA Santa Monica 0.87 0.1 0.90 1.18 0.36 26 3 19
SDAPCD Santa Monica 0.72 0.4 0.66 1.06 0.20 9 30 12
VCAPCD Santa Monica 0.96 0.1 0.81 1.11 0.22 8 31 12
aData used in the regressions include compounds with mean mixing ratios greater than 1 ppbC and ratios to reference laboratory
between 0.7 and 1.3.bNumber of individual compounds meeting screening criteria in footnote a.cNumbers of compounds that were outliers with average mixing ratios greater than 1 ppbC with Laboratory/DRI ratios o0.7 or
>1.3.
E.M. Fujita et al. / Atmospheric Environment 37 Supplement No. 2 (2003) S135–S147S140
Monica, BRC, SDAPCD, and VCAPCD had average
ratios to DRI of 1.02, 1.06, and 1.11, respectively. EPA
had consistently higher values with an average ratio to
DRI of 1.18.
While the correlations for several of the laboratories
show considerable scatter at lower mixing ratios
(especially for values below 5ppbC), the values for the
most abundant species are generally in good agreement.
Acetylene is a notable exception with reported values
varying by as much as a factor of three among the
laboratories. Analysis of acetylene standard by DRI
showed that its response on the FID is about 20 percent
lower than propane (i.e., measured mixing ratios are 20
percent higher for acetylene than other hydrocarbons).
Most laboratories typically do not take the lower FID
response of acetylene into account in their data
processing. Because values for ethylene and ethane are
in good agreement among the laboratories, misidentifi-
cation of acetylene or incomplete transfer from the
preconcentrator to the column are unlikely causes for
the variability. A more plausible explanation may be loss
of acetylene in the canister or within the analytical
system. Acetylene undergoes chemical reaction on
surfaces more readily than alkanes and alkenes and
may be lost on internal surfaces of canisters, dryers used
for water management, or adsorbents used for sample
preconcentration. These factors are not addressed in this
comparison study. More work is needed to investigate
these and other potential explanations for the large
variations that exist among laboratories for acetylene.
The numbers of species detected in each sample
indicate the relative sensitivity of the measurements
among the laboratories. The average percentages of
detectable species (i.e., reported by DRI) that were
reported as below detection are less than 10 percent for
SCAQMD-Auto GC and EPA, between 10 and 15
percent for BRC, EPA, BAAQMD, and AAC, and
between 15 and 20 percent for ARB, SCAQMD-Lab,
SDAPCD, and VCAPCD. These percentages are 7.3,
6.3, 58.8, and 60.8 for BRC, EPA, SDAPCD, and
VCAPCD, respectively, for the background sample
from Santa Monica.
In gas chromatographic analysis, compounds are
identified by the time required for individual compounds
to pass through the column to the detector. Peak
identification algorithms adjust for small shifts in
retention times caused by run-to-run variations in
operating condition and compare the adjusted times to
a retention time library which assigns individual species
to reference retention time windows. Because calibration
differences are generally within 10 percent, the numbers
of outliers shown in Table 1 are likely due to differences
in peak identification among the laboratories. The ratios
of outliers to number of compounds in the sample with
mixing ratios greater than 1 ppbC indicate the degree of
inconsistency in peak identification relative to DRI. The
average (Azusa and Los Angeles ambient samples)
percentages of outliers are less than 10 percent for
BRC and SCAQMD-Lab, between 10 and 15 percent
for ARB, EPA, and SDAPCD, and between 15 and 20
percent for SCAQMD-Auto GC and VCAPCD. The
percentage of outliers are 25.5, 30.9 and 43.5 for
ManTech, BAAQMD, and AAC, respectively. The
percentages of outliers for the background sample from
Santa Monica are 12.7, 39.6, 23.5, and 23.5 for BRC,
EPA, SDAPCD, and VCAPCD, respectively.
In general, the major peaks (i.e., most abundant
peaks) are consistently identified by all of the labora-
tories. Larger discrepancies exist for olefins greater than
C4 and for hydrocarbons greater than C8. Sample
contamination is evident in some samples, especially
those analyzed by EPA. The specific compounds that are
inconsistently identified vary from laboratory to labora-
tory and from sample to sample depending on how the
chromatographic data were processed. Although auto-
mated peak identification algorithms are commonly
used, some manual data processing is used by most
chromatographers for quality control purposes, and in
some cases, is the primary method of peak identification.
Because manual processing is used in varying degree to
process large numbers of complex chromatograms,
minor peaks can be easily misidentified.
Differences in the values reported by two laboratories
can also be traced to differences in analytical methods.
For example, some laboratories analyze light hydro-
carbons (C2–C4) on a separate column, while others
analyze the entire sample on one column. C2 compounds
are difficult to resolve completely with a single column,
especially with excessive moisture in the sample.
Excessive moisture can also cause nonlinear shifts in
retention times that can complicate peak identification.
Polar organic compounds complicate the chromatogram
and can coelute with hydrocarbon species of interest
(e.g., methanol coelutes with cis-2-butene). Use of dryers
to remove water and polar organic compounds stabilizes
retention times and simplifies the chromatogram, but
may also partially remove olefins and aromatics.
The differences between the sum of PAMS species and
TNMHC indicate the relative importance of organic
compounds that are not PAM target compounds and
their possible origin. For the ambient samples from Los
Angeles and Azusa, which reflects mostly motor vehicle
emissions, this total represents 10–25 percent of the
TNMHC (up to n-undecane). ManTech’s values for
total hydrocarbons are lower than other laboratories
because their method did not measure C2 or C3
compounds. The higher values reported by EPA appear
to be associated with possible contamination of the
canisters. All other laboratories produced similar sums
for PAMS target species.
Total nonmethane hydrocarbon (TNMHC) is an
operationally defined parameter, which reflects the
ARTICLE IN PRESSE.M. Fujita et al. / Atmospheric Environment 37 Supplement No. 2 (2003) S135–S147 S141
ARTICLE IN PRESS
Table 2
SCOS97-NARSTO hydrocarbon measurement comparison—total and subtotalsa
Laboratory Flagb Samplec Meand IDNMHC UNID TNMHC IDOxy PAMS Paraffin Olefin Aromatic
ManTech Azusa 164.4 107.1 6.4 50.9
ManTech Azusa 160.2 101.4 8.6 50.2
SCAQMD-lab Azusa x 173.7 241.7 181.9 120.5 19.4 42.0
SCAQMD-Auto Azusa x 198.1 330.4 198.1 126.1 21.0 51.0
SDAPCD Azusa x 232.9 76.3 309.2 233.1 158.0 27.0 48.1
BRC Azusa x 205.3 57.2 262.5 198.3 130.5 27.6 44.7
EPA Azusa 409.0 229.2 150.9 52.0 57.0
EPA d Azusa 470.2 237.2 178.2 65.0 50.1
VCAPCD Azusa 246.0 127.7 74.1 44.2
BAAQMD Azusa 303.0 196.3 118.5 29.8 67.5
DRI Azusa x 237.4 24.7 262.1 25.0 207.3 135.4 39.8 52.9
DRI d Azusa 234.3 22.2 256.5 19.4 204.5 133.7 38.9 51.5
DRI d,r Azusa 238.2 22.2 260.4 28.0 209.7 135.1 39.3 55.0
DRI r Azusa 234.3 21.1 255.4 30.6 205.1 133.0 38.6 53.6
AAC Azusa 236.0 236.0 142.0 29.0 65.0
ARB Azusa x 202.0 48.1 291.0 186.0 114.8 29.8 41.4
ARB Azusa 197.0 55.4 305.0 186.3 117.2 30.2 39.9
Meand 208.2 282.8 200.8 130.9 27.4 46.7
Std dev 23.6 33.3 18.3 15.1 7.3 4.8
CV% 11.4% 11.8% 9.1% 11.6% 26.6% 10.2%
ManTech Los Angeles 190.0 111.1 10.2 68.7
SCAQMD-lab Los Angeles x 240.5 357.4 258.1 161.4 28.7 68.0
SCAQMD-Auto Los Angeles x 276.4 448.4 276.5 172.0 31.7 72.8
SDAPCD Los Angeles x 264.0 60.8 324.8 264.2 170.0 34.2 60.0
BRC Los Angeles x 259.0 99.9 358.9 250.8 156.8 38.0 61.5
BRC d Los Angeles 256.5 62.9 319.4 248.1 155.1 36.8 61.8
EPA Los Angeles 593.2 285.7 199.8 103.3 73.2
VCAPCD Los Angeles 329.4 157.4 104.0 68.0
BAAQMD Los Angeles 349.0 259.6 157.4 40.7 79.7
DRI Los Angeles x 300.9 21.2 322.1 16.2 261.0 169.6 49.3 69.3
DRI d Los Angeles 294.8 20.2 315.0 9.7 261.1 169.6 49.1 67.9
DRI d,r Los Angeles 293.8 21.4 315.2 11.3 257.5 167.4 47.9 67.5
DRI r Los Angeles 300.1 21.3 321.4 18.3 260.8 168.8 49.0 70.0
AAC Los Angeles 234.0 234.0 142.0 27.0 65.0
ARB Los Angeles x 255.5 34.2 363.0 245.0 152.5 35.5 59.2
ARB d Los Angeles 260.6 48.6 355.0 245.5 149.6 36.8 60.3
Meand 266.1 362.4 259.3 163.7 36.2 65.1
Std dev 20.7 45.7 11.0 8.0 7.2 5.6
CV% 7.8% 12.6% 4.2% 4.9% 19.8% 8.7%
BRC Santa Monica 26.1 28.7 54.8 24.8 15.7 3.3 5.8
ManTech Santa Monica 28.9 5.6 4.4 18.9
SDAPCD Santa Monica 90.4 76.1 166.5 90.5 76.4 4.5 9.6
EPA Santa Monica 381.6 80.8 66.7 111.5 19.0
VCAPCD Santa Monica 51.5 11.2 32.4 7.9
DRI Santa Monica 45.8 6.0 51.8 10.4 33.3 19.7 16.8 11.1
DRI r Santa Monica 47.8 4.7 52.5 14.3 33.5 18.7 16.3 13.0
a IDNMHC=identified nonmethane hydrocarbons; Unid=total unidentified; TNMHC=total nonmethane hydrocarbons;
IDOxy=identified oxygenated organic compounds.bSamples with ‘‘d’’ are duplicates and ‘‘r’’ are analytical replicates.cCollected at Azusa on 6/10/97 beginning at 12:23 PDT for 283min; at Los Angeles-N. Main (LA) on 6/10/97 beginning at 8.00 PDT
for 240min; at Santa Monica (SM) on 6/10/97 beginning at 16.30 PDT for 70min.dFor six laboratories reporting TNMHC excluding duplicates and replicates.
E.M. Fujita et al. / Atmospheric Environment 37 Supplement No. 2 (2003) S135–S147S142
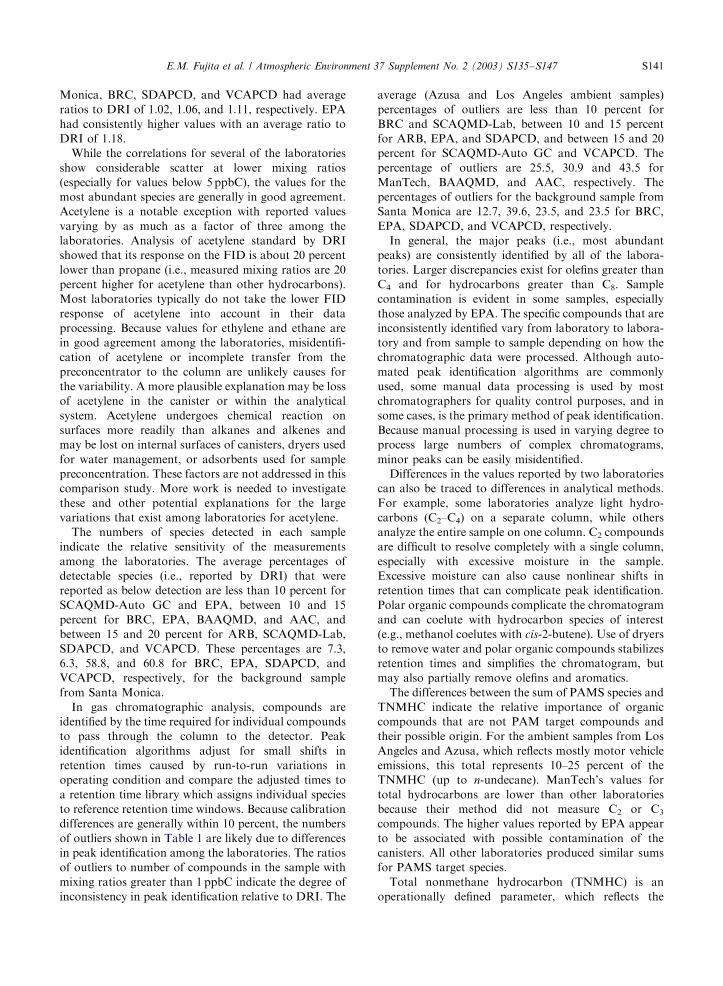
sensitivity and selectivity of the analytical methods.
Table 2 compares the sum of the PAMS target
compounds and TNMHC in the PAMS region of the
chromatogram (up to n-undecane) reported by each
laboratory, including the identified and unidentified por-
tions of TNMHC. Subtotals for paraffins, olefins, and
aromatic compounds are also shown. DRI also reported
identified oxygenated compounds based on compound
specific FID response factors. Among the six laboratories
reporting TNMHC, the coefficients of variation (i.e.,
standard deviation/mean) in TNMHC are 11.8 and 12.6
percent for samples from Azusa and Los Angeles,
respectively, and 9.1 and 4.2 percent, respectively, for sum
of the 55 PAMS target hydrocarbons. These results are
consistent with the previous regression statistics with most
laboratories reporting values within 10 percent of each other
and with the SCOS97-NARSTO data quality objectives.
The sums of paraffins and aromatic hydrocarbons are also
within data quality specifications. However, as noted earlier,
greater variations exists for the sum of olefins.
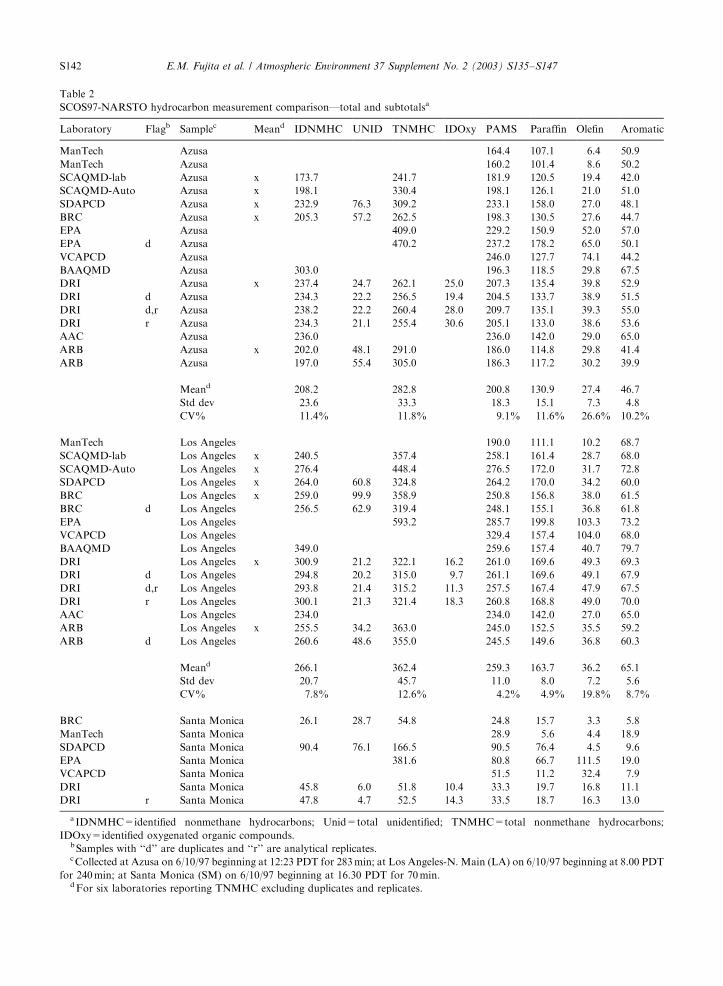
3.2. Performance audits for measurement of carbonyl
compounds
Fig. 1 shows the values reported by each laboratory to
DRI’s pre- and post-analysis of the 6-l transfer canisters.
The values are in mg/sample and are normalized to
volume of the standard mixture delivered to the
cartridge. The four panels correspond to the analysis
of four separate transfer canisters. Data for DRI’s
analysis prior to sending the canister the audited
laboratory and after its return are given in the figure
as DRI 1 and DRI 2, respectively. All other data are
shown in chronological order in which the various
laboratories analyzed the standard mixture. The values
obtained for formaldehyde and acetaldehyde are within
710 percent of DRI’s values for SCAQMD and
AtmAA and within 720 percent for SDAPCD. AtmAA
values for butanal and benzaldehyde are about 30 and
20 percent higher than DRI, respectively. Values
reported for AAC and VCAPCD were 5–9 times higher
than DRI for formaldehyde, and about two times higher
for acetaldehyde. While VCAPCD collected their own
samples, the chemical analyses were performed by AAC
and which accounts for the consistent biases for both
AAC and VCAPCD relative to DRI. Butanal and
benzaldehyde are in good agreement with DRI but
butanal is misidentified in the AAC sample as MEK.
The levels of acetone measured by DRI in some of the
initial samples (i.e., DRI 1) were twice as high relative to
the standard and the final measurements. This was
traced to high ambient levels of acetone in the
laboratory and breakthrough of acetone past the
scrubber cartridge. Measures were taken by DRI to
minimize this interference in the final measurements,
and comparisons to DRI’s post analysis show agreement
within about 20 percent. With the exception of acetone,
for the reasons given, the pre- and post-analysis by DRI
show that the carbonyls in the transfer standard canister
were stable during the time required to conduct the
audit. The results of the audit are generally consistent
with the SCOS97-NARSTO data quality objectives.
3.3. Field comparison for measurement of carbonyl
compounds
Results of the field measurement comparison in Table 3
show greater variations among the three laboratories than
indicated by sampling and analysis of the standard
mixture. These results may reflect the affects of potential
sampling artifacts, which the performance audits did not
address. The mean coefficients of variation for the field
comparison are 39, 19, 36, 26, 32, and 55 percent for
formaldehyde, acetaldehyde, acetone, propionaldehyde,
methyl ethyl ketone, and butanal, respectively. DRI
reported consistently lower values than AtmAA and
VCAPCD for formaldehyde and higher values for MEK.
There is generally good agreement among the three
laboratories for the other carbonyl compounds.
3.4. Measurement comparisons for biogenic
hydrocarbons
Table 4 shows that the average isoprene mixing ratios
reported by the four laboratories ranged from 22.05 to
26.79 ppbC with an overall average of 24.0072.05. The
average of the adsorbent tube samples analyzed by GC/
MS were 13 percent higher than the average of the DRI
and BRC analysis of canister samples by GC/FID.
Although ManTech’s replicate analyses of the canister
samples by GC/MS varied widely, the average of the two
analyses was only 7 percent lower than the average of
the GC/FID analyses.
3.5. Measurement comparisons for halogenated
compounds
Table 5 shows the results of the measurement in-
tercomparisons for F12, methylbromide, F11, F114,
chloroform, methyl chloroform, carbon tetrachloride,
trichloroethylene, chlorodibromomethane, perchloroethy-
lene, m-dichlorobenzene, p-dichlorobenzene, and o-dichlo-
robenzene. The coefficients of variation for the two tracers
of opportunity were 18.2 and 3.7 percent for methyl
chloroform and perchloroethylene, respectively. The
average CV for all reported halogenated compounds
was 12.4 percent.
4. Conclusions
The results of the various laboratory intercompar-
isons indicate that the quality of the hydrocarbon,
ARTICLE IN PRESSE.M. Fujita et al. / Atmospheric Environment 37 Supplement No. 2 (2003) S135–S147 S143
ARTICLE IN PRESS
0
1
2
3
4
5
6
formaldehyde acetaldehyde acetone MEK butanal benzaldehyde
ug/s
ampl
eDRI_1
SCAQMD_1
SCAQMD_2
SDAPCD_1
SDAPCD_2
SDAPCD_1 (bag)
SDAPCD_2 (bag)
DRI_2
0
1
2
3
4
5
6
formaldehyde acetaldehyde acetone MEK butanal benzaldehyde
ug/s
ampl
e
DRI_1
DRI_1r
AtmAA_1
AtmAA_1r
AtmAA_2
AtmAA_1 (bag)
AtmAA_1r (bag)
AtmAA_2 (bag)
DRI_2
-1
0
1
2
3
4
5
6
formaldehyde acetaldehyde acetone MEK butanal benzaldehyde
ug/s
ampl
e
DRI_1
AAC_1
AAC_2
AAC_3
DRI_2
0
1
2
3
4
5
6
formaldehyde acetaldehyde acetone MEK butanal benzaldehyde
ug/s
ampl
e
DRI_1
VCAPCD
DRI_2
Fig. 1. SCOS97-NARSTO performance audits for measurement of carbonyl compounds by EPA Method TO-11. Data are presented
in order in which the respective laboratories analyzed the standard mixture of formaldehyde, acetaldehyde, acetone, butanal, and
benzaldehyde. Sequential numbers indicate duplicate samples and ‘‘r’’ indicates analytical replicate.
E.M. Fujita et al. / Atmospheric Environment 37 Supplement No. 2 (2003) S135–S147S144
ARTIC
LEIN
PRES
S
Table 3
SCOS97-NARSTO field comparison for measurement of carbonyl compounds at Azusa
Date Start hour Duration
(min)
Type Formaldehyde Acetaldehyde Acetone Propanal Methy ethyl
ketone
Butanal
DRI 9/23/1997 1300 182.2 Sample 3.0 2.3 6.4 0.5 1.8 0.3
DRI 9/23/1997 1300 182.2 Backup 0.2 0.0 0.0 0.0 0.0 0.0
AtmAA 9/23/1997 1300 180 Sample 6.0 3.7 5.7 0.8 0.9 0.8
AtmAA 9/23/1997 1300 180 Backup 0.2 0.1 0.1 0.0 0.0 0.0
VCPACD 9/23/1997 1300 180 Sample 7.3 4.5 4.0 1.0 1.6 0.9
DRI 9/23/1997 1700 183.3 Sample 3.6 4.2 7.3 1.0 2.0 0.2
AtmAA 9/23/1997 1700 180 Sample 7.3 3.7 6.7 0.8 1.4 0.7
AtmAA 9/23/1997 1700 180 Replicate 7.3 3.8 6.7 0.8 1.4 0.7
VCPACD 9/23/1997 1700 180 Sample 5.7 3.6 3.7 0.7 1.1 0.6
DRI 9/24/1997 0600 179 Sample 2.1 1.6 8.0 0.3 2.7 0.1
DRI 9/24/1997 0600 179 Backup 0.5 0.0 0.0 0.0 0.0 0.0
AtmAA 9/24/1997 0600 180 Sample 5.0 2.1 8.2 0.4 2.0 0.4
AtmAA 9/24/1997 0600 180 Backup 0.2 �0.1 �0.1 0.0 0.0 0.0
VCPACD 9/24/1997 0600 180 Sample 5.5 3.0 3.5 0.7 1.4 0.8
DRI 9/24/1997 0905 178 Sample 2.8 2.6 8.3 0.7 1.4 0.2
DRI 9/24/1997 0905 178.5 Collocated 3.4 2.5 7.9 0.4 1.4 0.2
AtmAA 9/24/1997 0900 180 Sample 6.2 2.6 7.9 0.6 1.1 0.5
AtmAA 9/24/1997 0900 180 Duplicate 5.9 2.6 7.9 0.6 1.0 0.5
VCPACD 9/24/1997 0900 180 Sample 5.2 2.7 3.0 0.6 0.8 0.5
VCPACD 9/24/1997 0900 180 Backup 0.4 0.6 2.5 0.1 0.4 0.1
Mean7SD 9/23/1997 1300 Sample 5.472.2 3.571.1 5.471.2 0.870.2 1.470.5 0.770.3
Mean7SD 9/23/1997 1700 Sample 5.571.8 3.870.3 5.972.0 0.870.2 1.570.5 0.570.2
Mean7SD 9/24/1997 0600 Sample 4.271.8 2.270.7 6.672.7 0.470.2 2.070.7 0.570.4
Mean7SD 9/24/1997 0900 Sample 4.771.8 2.770.1 6.472.9 0.670.0 1.170.3 0.470.2
Mean Coefficient of Variation Sample 38.5% 18.5% 35.6% 26.4% 31.9% 54.7%
Mean Ratio and SD (AtmAA/DRI) 2.1470.15 1.1970.32 0.9570.06 1.1370.36 0.6670.12 2.8070.17
Mean Ratio and SD (VCAPCD/DRI) 2.1170.47 1.4370.55 0.4870.11 1.5070.84 0.6270.18 3.5571.77
Mean Ratio and SD (VCAPCD/AtmAA) 0.9970.21 1.1870.23 0.5270.15 1.2770.45 1.0270.56 1.2770.60
E.M
.F
ujita
eta
l./
Atm
osp
heric
En
viron
men
t3
7S
up
plem
ent
No
.2
(2
00
3)
S1
35
–S
14
7S145
halocarbon, and biogenic measurements that were made
during SCOS97-NARSTO is generally consistent with
specified data quality objectives. Comparisons of the
sum of the PAM target compounds and total NMHC
are generally in good agreement among the laboratories
with coefficient of variations within 75–15 percent for
the comparison ambient samples from Los Angeles
and Azusa. Although the abundant hydrocarbons are
consistently identified by all of the laboratories, discre-
pancies occur for olefins greater than C4 and for
hydrocarbons greater than C8. The specific compounds
that are inconsistently identified vary from laboratory to
laboratory and from sample to sample depending
on how the chromatographic data were processed.
Values reported by the nine participating laboratories
for speciated hydrocarbons are generally within 10
percent for species with mixing ratios above 5 ppbC.
Acetylene is a notable exception with reported values
varying by as much as a factor of three among the
laboratories. Analysis by DRI of an acetylene
standard showed that its response on the FID is about
20 percent lower than propane (i.e., measured mixing
ratios are 20 percent higher for acetylene than other
hydrocarbons). More work is needed to investigate the
variations that exist among laboratories in the values for
acetylene.
ARTICLE IN PRESS
Table 4
SCOS97-NARSTO biogenic compounds measurement comparison of collocated samples collected at UC, Riverside on the afternoon
of 1, August 1997
Laboratory Analysis date Sample type Analysis method Sample ID Isoprene (ppbC)
ManTech 9/12/1997 Canister GC/MS X098 16.9
ManTech 9/12/1997 Canister GC/MS X098r 27.2
DRI 8/7/1997 Canister GC/FID X098 24.0
DRI 8/12/1997 Canister GC/FID X098r 24.3
BRC 8/13/1997 Canister GC/FID 4 23.0
UCR 8/1997 Carbotrap GC/MSD-SIM 1 26.0
UCR 8/1997 Carbotrap GC/MSD-SIM 2 24.4
UCR 8/1997 Carbotrap GC/MSD-SIM 3 27.5
UCR 8/1997 Carbotrap GC/MSD-SIM 4 27.3
UCR 8/1997 Carbotrap GC/MSD-SIM 5 28.9
ManTech Mean 22.1
DRI Mean 24.2
BRC Mean 23.0
UCR Mean 26.8
All Mean 24.0
All Standard deviation 2.1
All Coefficient of variation (%) 8.6%
Table 5
SCOS97-NARSTO halocarbon measurement comparisons (pptv) of collocated samples collected at Azusa on 5 August, 1997 during
13.00–16.00 PDT
Species Formula BRC DRI DRI DGA Mean Standard CV (%)
OAL Schorran deviation
F12 (dichlorodifluoromethane) CCl2F2 884 780 832 74 8.8
F11 (trichlorofluoromethane) CCl3F 352 330 366 349 18 5.2
F113 (trichlorotrifluoroethane) Cl3CCF3 1110 1410 1126 1215 169 13.9
Chloroform CCl3 56 50 53 4 8.0
Methyl chloroform CH3CCl3 654 630 868 717 131 18.2
Carbon tetrachloride CCl4 103 90 176 123 46 37.7
Trichloroethylene Cl2CCHCl 53 50 53 52 2 3.4
Perchloroethylene (tetra) Cl2CCCl2 775 770 823 434a 789 29 3.7
aNot included in average.
E.M. Fujita et al. / Atmospheric Environment 37 Supplement No. 2 (2003) S135–S147S146
The average isoprene mixing ratios reported by the
four laboratories ranged from 22.1 to 26.8 ppbC with an
overall average of 24.072.1. The average of the
adsorbent tube samples analyzed by GC/MS were 13
percent higher than the average of the DRI and BRC
analysis of canister samples by GC/FID. The coefficients
of variation were 18.2 and 3.7 percent for methyl
chloroform and perchloroethylene, respectively. The
average CV for all reported halogenated compounds
was 12.4 percent.
The values obtained for carbonyl compounds by
SCAQMD, SDAPCD and AtmAA were within 10–20
percent of those obtained by the reference laboratory.
AAC and VCAPCD reported substantially higher
values, especially for formaldehyde. Results of the field
measurement comparison showed variations among the
three laboratories ranging from 20 to 40 percent for
C1–C3 carbonyl compounds. The greater variations
observed in the field measurement comparison may
reflect the affects of potential sampling artifacts, which
the performance audits did not address.
Acknowledgements
The authors gratefully acknowledge the cooperation
of the SCOS97-NARSTO measurement laboratories
that participated in the various audits and comparisons.
We especially acknowledge Mike Miguel and Randy
Pasek of the California Air Resources Board for their
assistance in coordinating the audits and comparisons
and compilation of data. We also gratefully acknowl-
edge Pat Harrington of the Air Resources Board for his
assistance with sample collection during the hydrocar-
bon measurement comparisons.
References
Apel, E., Calvert, J., Riemer, D., Pos, W., Zika, R.,
Kleindienst, T., Lonneman, W., Fung, K., Fujita, E.,
Shepson, P., Starn, T., 1998. Measurements comparison of
oxygenated volatile organic compounds at a rural site
during the 1995 SOS Nashville intensive. Journal of
Geophysical Research 98JD01753, 103, 22295–22316.
Arnts, R.R., Tejada, S., 1989. 2,4-Dinitrophenylhydrazine-
coated silica gel cartridge method for determination of
formaldehyde in air: identification of an ozone interference.
Environmental Science and Technology 23, 1428.
Fujita, E.M., Bowen, J.L., Green, M.C., Moosmuller, H.,
1997a. 1997 Southern California Ozone Study (SCOS97-
NARSTO) Quality Assurance Plan. Prepared for the Cali-
fornia Air Resource Board, Sacramento, CA, April, 1997.
Fujita, E., Lu, Z., Harshfield, G., Zielinska, B., 1997b.
NARSTO-Northeast: hydrocarbon and carbonyl measure-
ment audits for the 1995 Field Study. Final Report Prepared
for the Electric Power Research Institute, Palo Alto, CA,
July 1997.
Fujita, E.M., Moosmuller, H., Green, M.C., Bowen, J.L.,
Rodgers, F., Dolislager, L., Lashgari, A., Motellebi, N.,
Pasek, R., Pederson, J., 1999. SCOS97-NARSTO 1997
Southern California Ozone Study and Aerosol Study Vol.
IV: summary of quality assurance. Prepared for the
California Air Resource Board, Sacramento, CA, December
1999.
Fung, K., 1993. Carbonyl measurements with DNPH car-
tridges: species concentration, ozone interference and blank
observations. Paper OT-21.1 Presented at the International
Specialty Conference on Regional Photochemical Measure-
ment and Modeling Studies, San Diego, CA, November
1993.
Fung, K., Wright, B., 1990. Measurement of formaldehyde and
acetaldehyde using the DNPH method during the carbo-
naceous species comparison study. Aerosol Science and
Technology 12, 44.
Lawson, D.R., Biermann, H.W., Tuazon, E.C., Winer, A.M.,
Mackay, G.I., Schiff, H.I., Kok, G.L., Dasgupta, P.K.,
Fung, K., 1990. Aerosol Science and Technology 12, 64.
United States Environmental Protection Agency (USEPA)
1999a. Compendium Method TO14A: determination of
volatile organic compounds (VOCs) in ambient air using
specially prepared canisters with subsequent analysis by gas
chromatography. Compendium of Methods for the Deter-
mination of Toxic Organic Compounds in Ambient Air, 2nd
Edition, EPA/625/R-96/010b, January 1999, Center for
Environmental Research Information, Office of Research
and Development, U.S. Environmental Protection Agency,
Cincinnati, OH.
United States Environmental Protection Agency (USEPA)
1999b. Compendium method TO-11A: determination of
formaldehyde in ambient air using adsorbent cartridge
followed by high performance liquid chromatography
(HPLC) [Active Sampling Methodology]. Compendium of
Methods for the Determination of Toxic Organic Com-
pounds in Ambient Air, 2nd Edition, EPA/625/R-96/010b,
January 1999, Center for Environmental Research Informa-
tion, Office of Research and Development, U.S. Environ-
mental Protection Agency, Cincinnati, OH.
ARTICLE IN PRESSE.M. Fujita et al. / Atmospheric Environment 37 Supplement No. 2 (2003) S135–S147 S147