Embed Size (px)
Citation preview

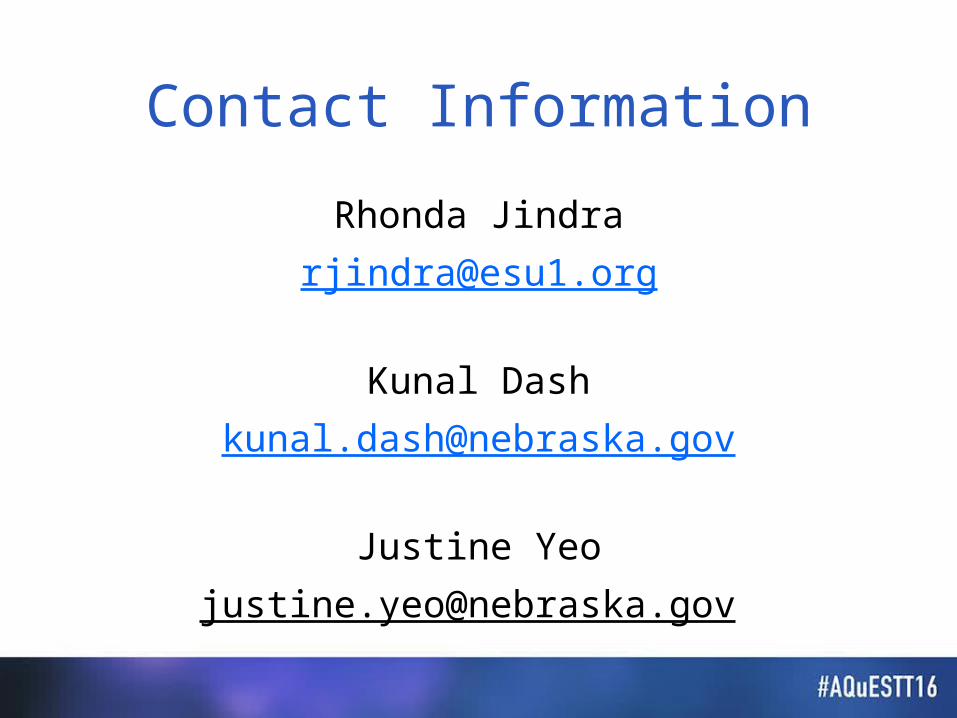
Perceptual Data as a Tool
by Rhonda Jindra, Kunal Dash, and Justine Yeo
Purpose for Today’s Session
• Understand the importance of perceptual data
• Investigate a variety of tools that support the analysis of perceptual text data
Perceptual Data
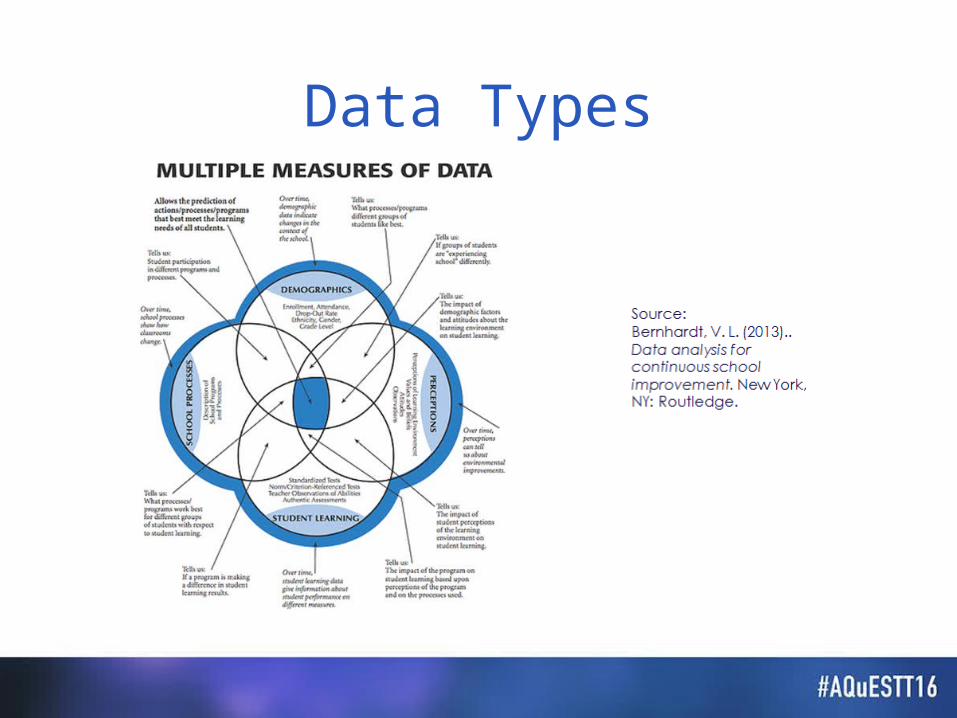
Data Types
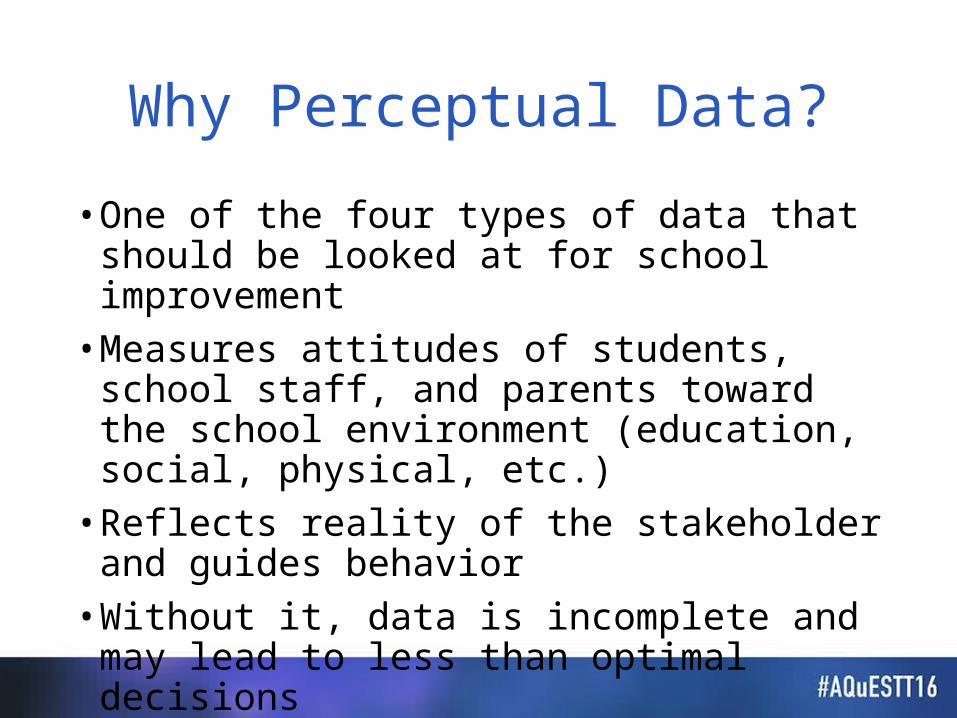
Why Perceptual Data?• One of the four types of data that should
be looked at for school improvement• Measures attitudes of students, school
staff, and parents toward the school environment (education, social, physical, etc.)
• Reflects reality of the stakeholder and guides behavior
• Without it, data is incomplete and may lead to less than optimal decisions
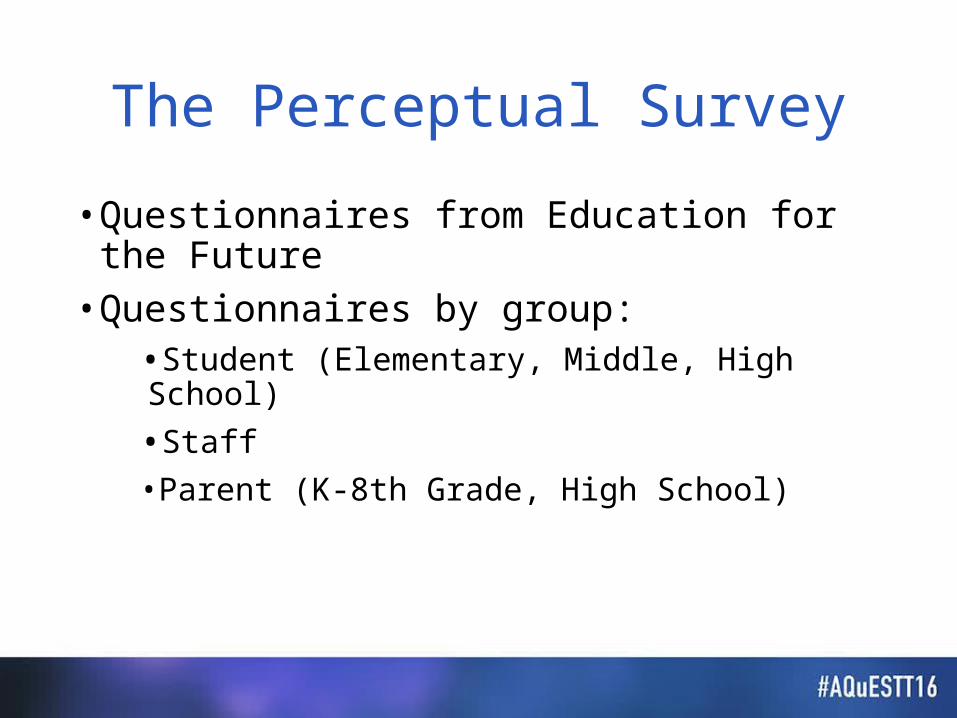
The Perceptual Survey• Questionnaires from Education for the
Future• Questionnaires by group:
•Student (Elementary, Middle, High School)•Staff•Parent (K-8th Grade, High School)
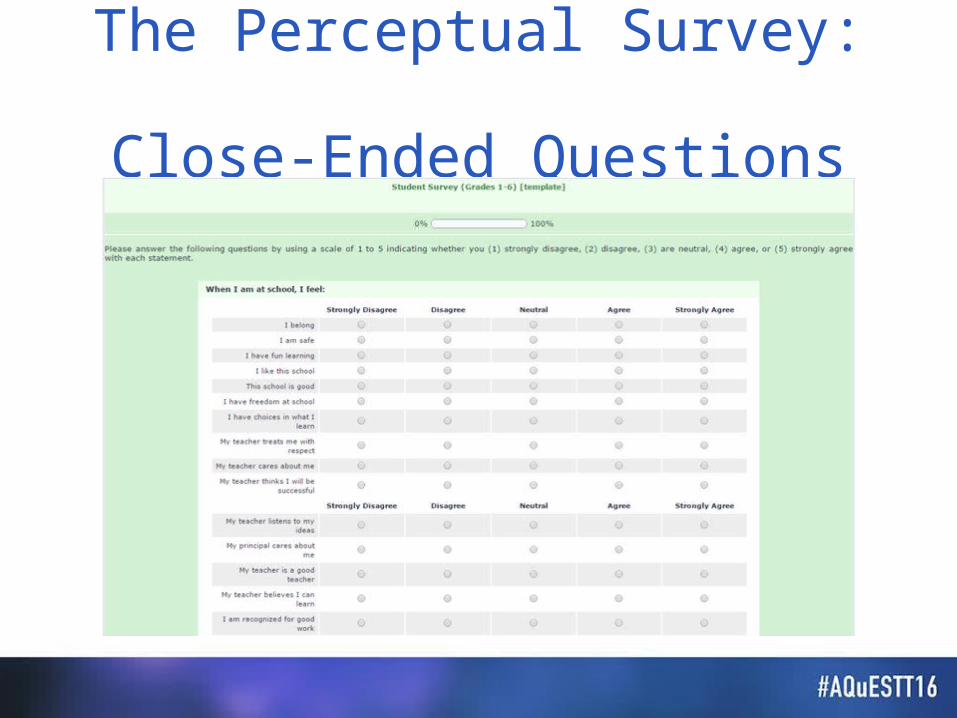
The Perceptual Survey: Close-Ended Questions
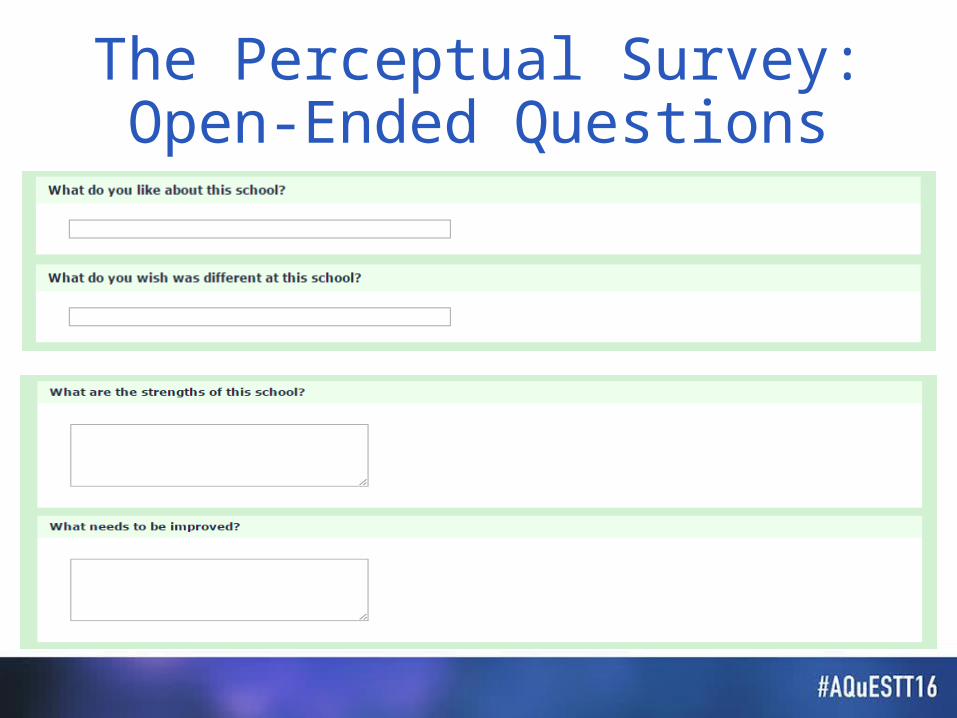
The Perceptual Survey:Open-Ended Questions
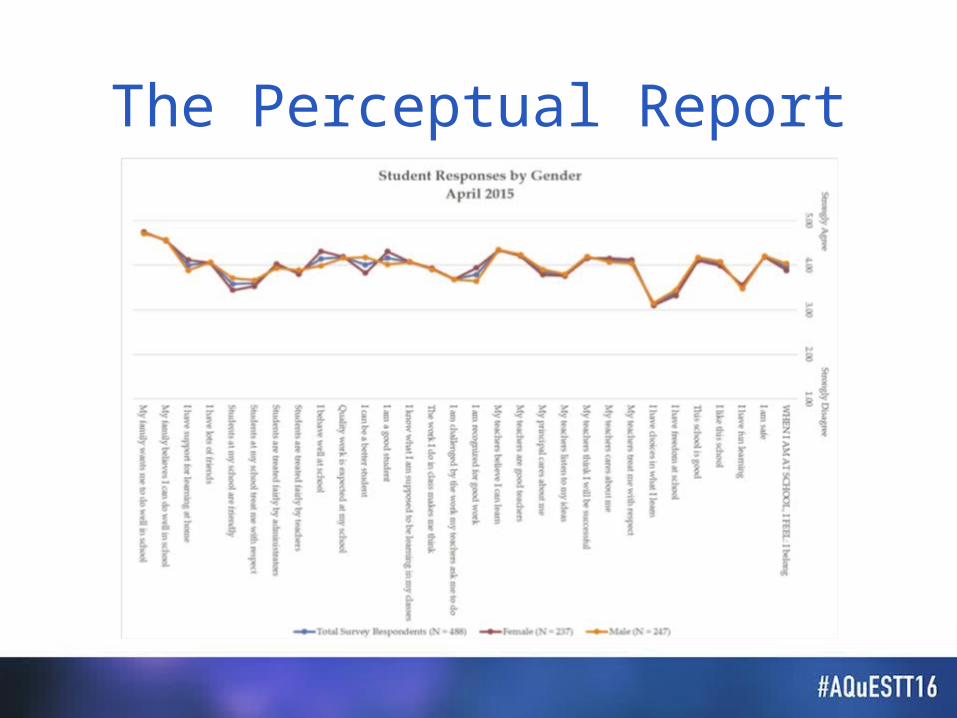
The Perceptual Report
The Current State• Perceptual data also used to improve
data literacy among school staff by having them analyze and interpret graphs in the reports
• However, methods for analyzing perceptual text data have not been explored yet
• Text data provides very rich insights for continuous improvement
Resource for Analyzing Perceptual Data
• Strengths; Challenges; Implications; So What, Now What?
• Across Surveys: Agreements and Disagreements (Student, Staff, Parent)
Visualizing Text Data
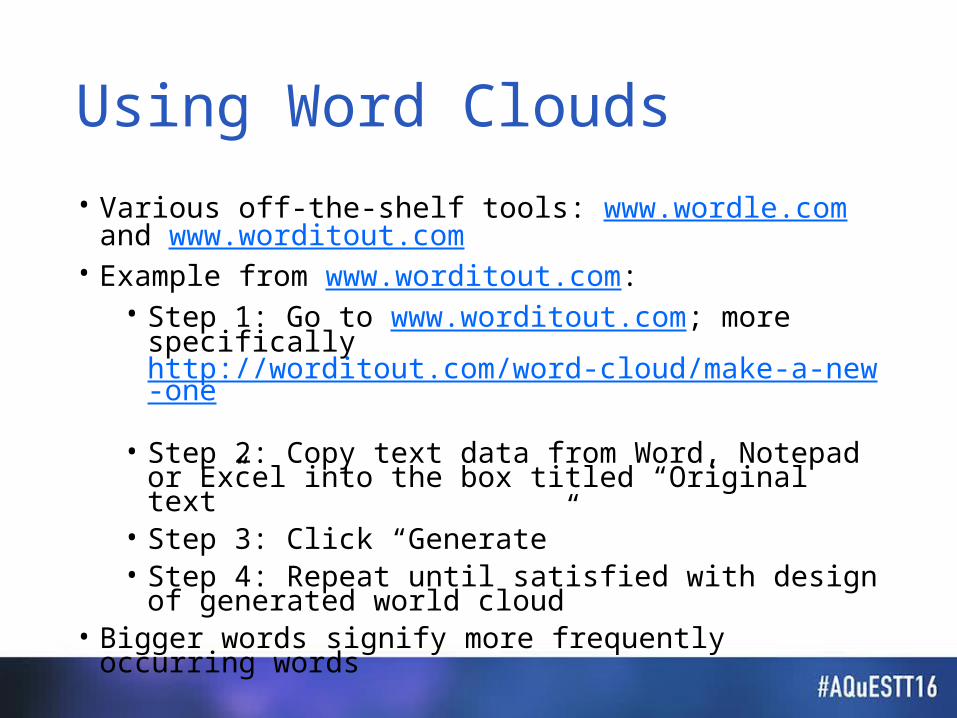
Using Word Clouds• Various off-the-shelf tools: www.wordle.com and www.worditout.com • Example from www.worditout.com:
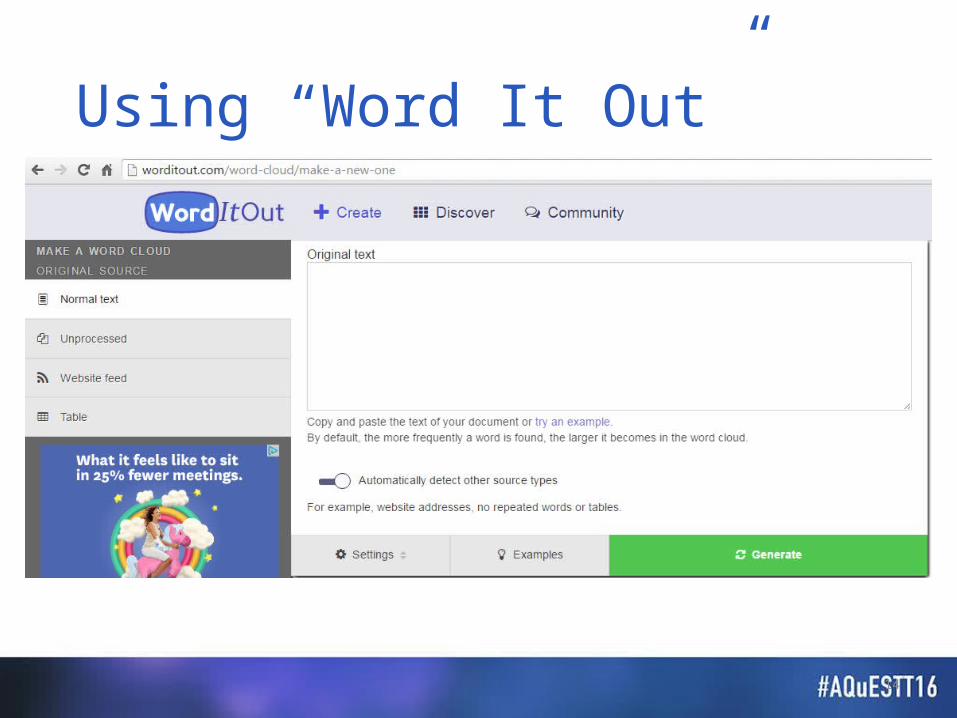
• Step 1: Go to www.worditout.com; more specifically http://worditout.com/word-cloud/make-a-new-one • Step 2: Copy text data from Word, Notepad or Excel into the box titled “Original text”• Step 3: Click “Generate”• Step 4: Repeat until satisfied with design of generated world cloud
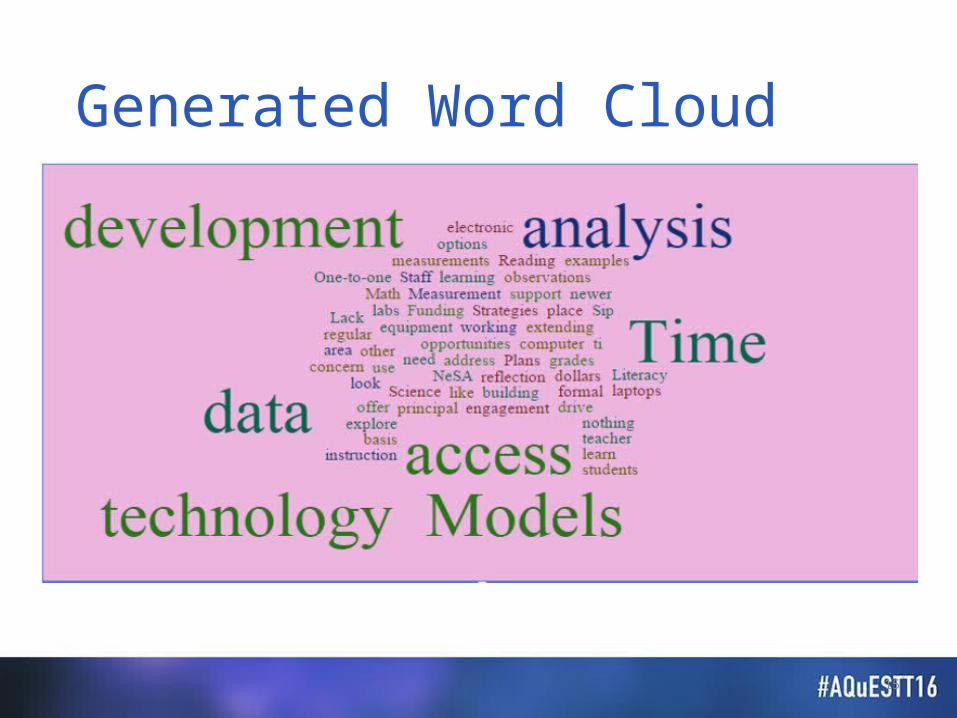
• Bigger words signify more frequently occurring words
14
Using “Word It Out”
15
Generated Word Cloud
Sentiment Analysis using “Meaning Cloud”

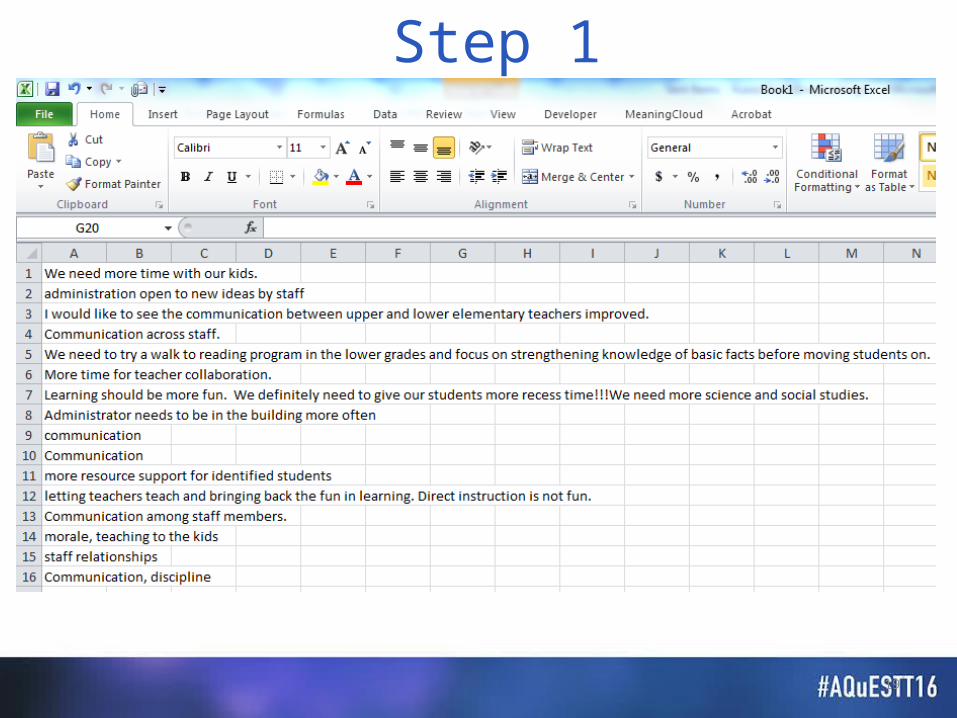
Sentiment Analysis• Analysis of a text to determine the underlying tone• Tones can be positive, negative, neutral or undetermined• Possible to analyze and glean insights from text as data just as much as numbers• A relatively affordable sentiment analysis tool or software which we will discuss is an Excel add in - meaning it can be used to analyze text data laid out in a spreadsheet• Software is called “Meaning Cloud”• Subsequent slides: Use one of “Student”, “Staff” or “Parents” text data and understand results
“Meaning Cloud” Sentiment Analysis:A Demo
19
Step 1
20
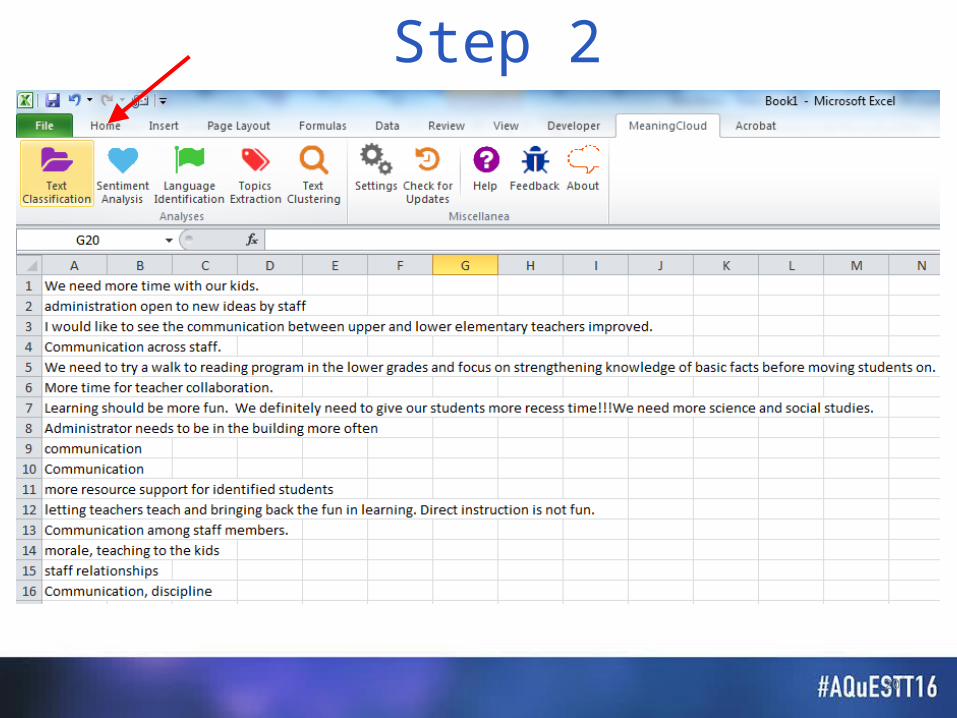
Step 2
21
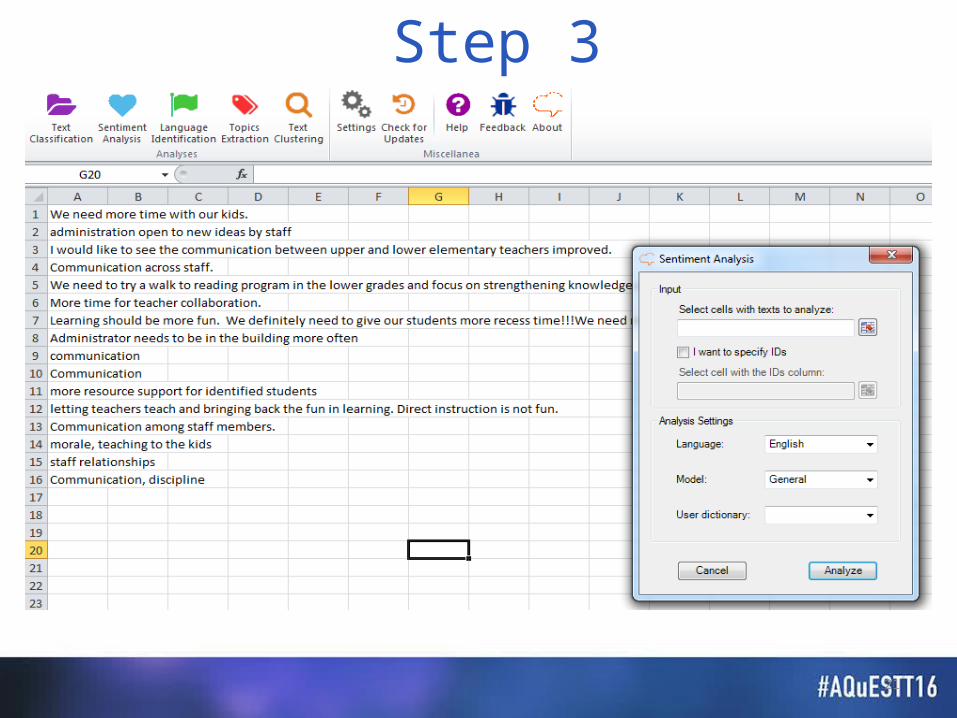
Step 3
22
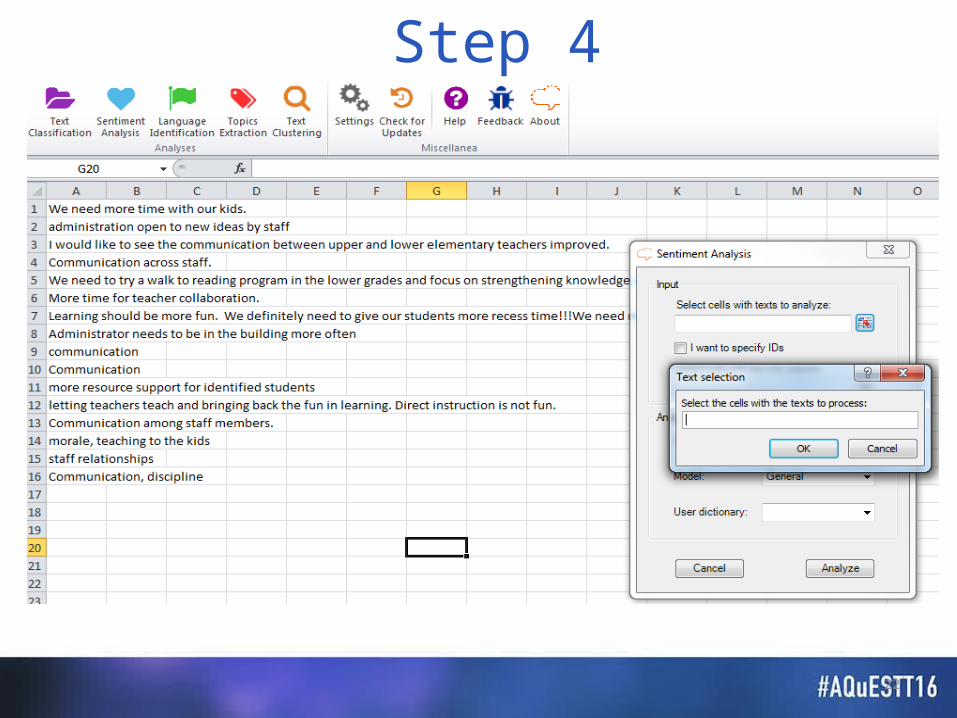
Step 4
23
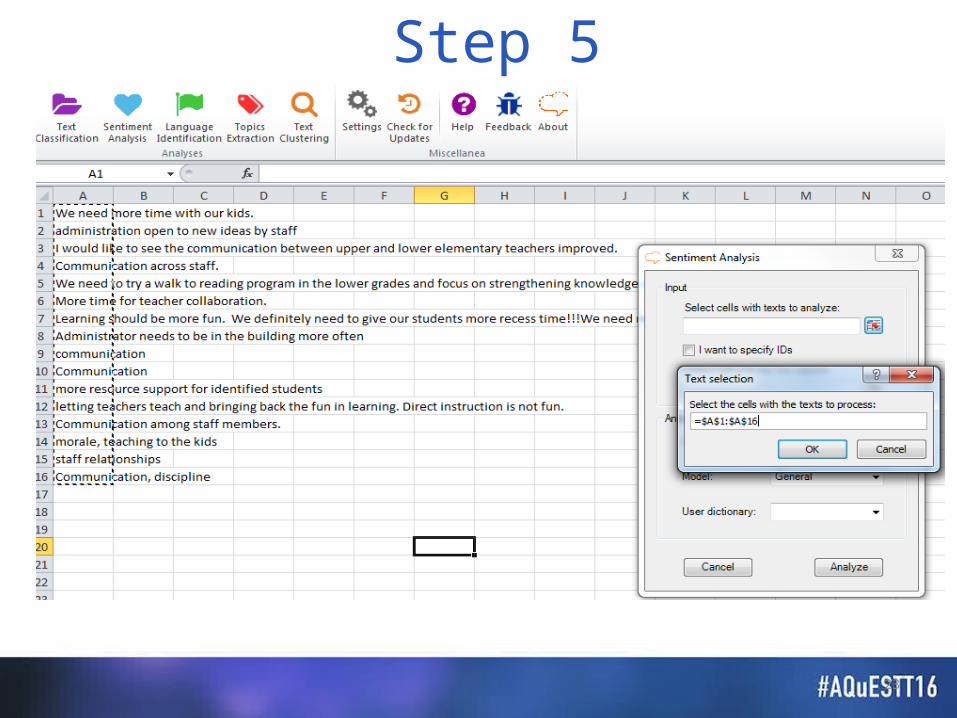
Step 5
24
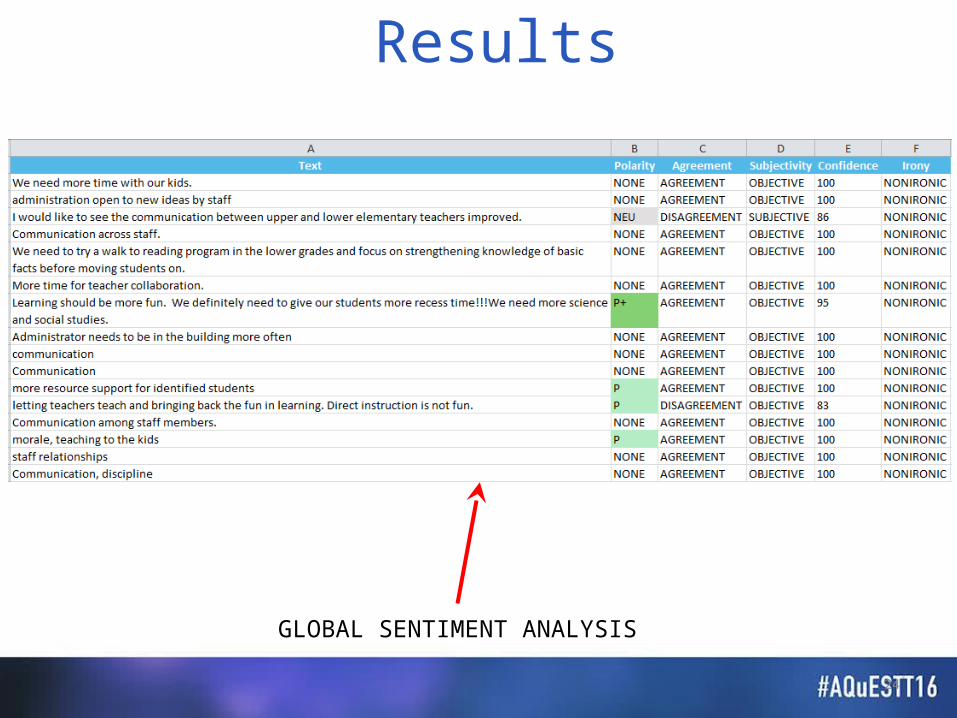
GLOBAL SENTIMENT ANALYSIS
Results
25
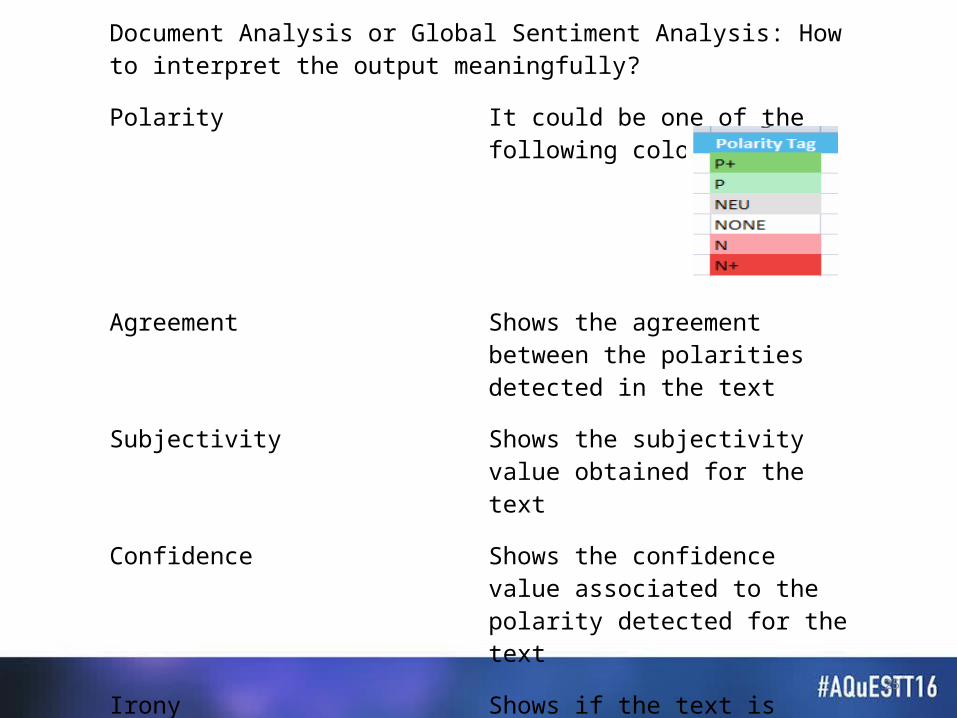
EXPLANATION OF OUTPUTDocument Analysis or Global Sentiment Analysis: How to interpret the output meaningfully?
Polarity It could be one of the following colors:
Agreement Shows the agreement between the polarities detected in the text
Subjectivity Shows the subjectivity value obtained for the text
Confidence Shows the confidence value associated to the polarity detected for the text
Irony Shows if the text is considered ironic
26
2ND OUTPUT GENERATED
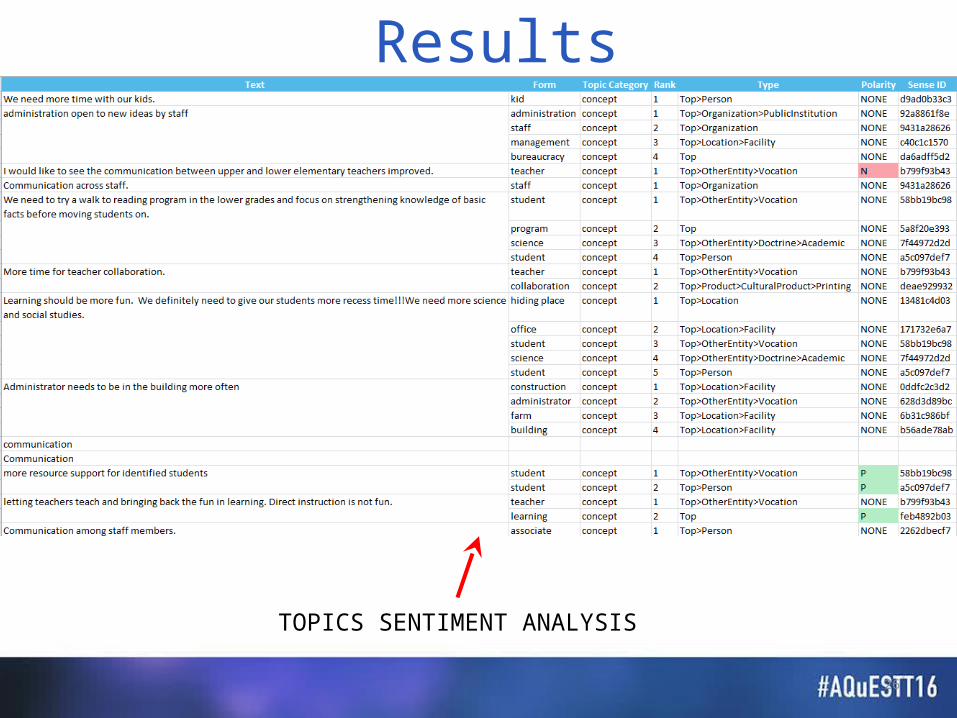
TOPICS SENTIMENT ANALYSIS
Results
27
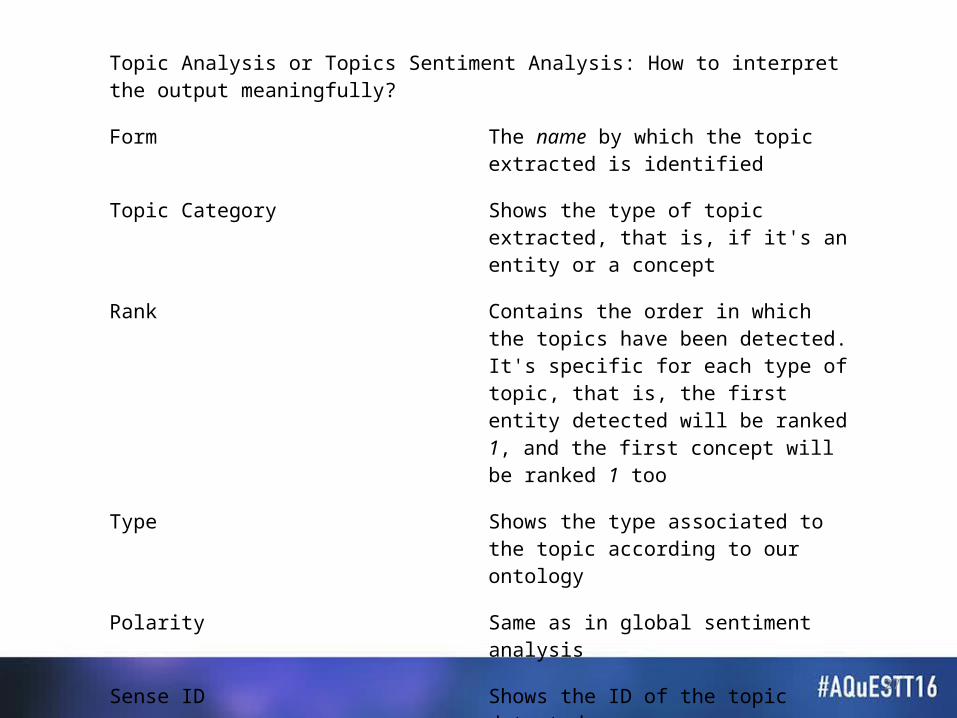
EXPLANATION OF OUTPUTTopic Analysis or Topics Sentiment Analysis: How to interpret the output meaningfully?
Form The name by which the topic extracted is identified
Topic Category Shows the type of topic extracted, that is, if it's an entity or a concept
Rank Contains the order in which the topics have been detected. It's specific for each type of topic, that is, the first entity detected will be ranked 1, and the first concept will be ranked 1 too
Type Shows the type associated to the topic according to our ontology
Polarity Same as in global sentiment analysis
Sense ID Shows the ID of the topic detected
For more information, you can visit the help page on MeaningCloud

28
Couple of things to remember:How can you use the free version of this software?
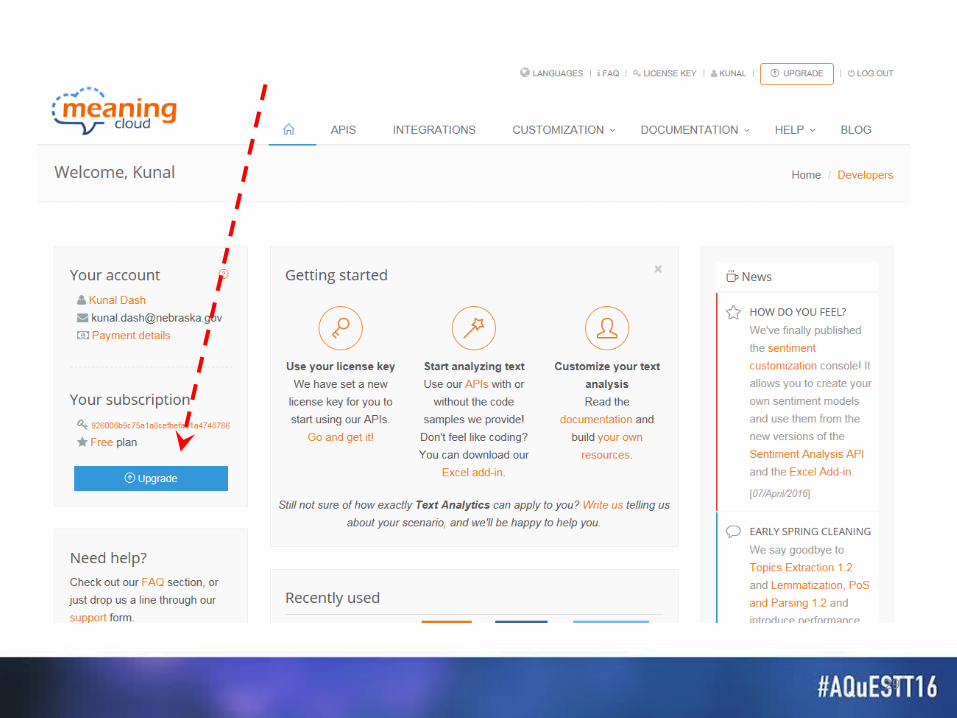
29
Couple of things to remember:Where can you find your activation or API key once you
have installed the add in?
Additional Tips, Tricks, and Strategies
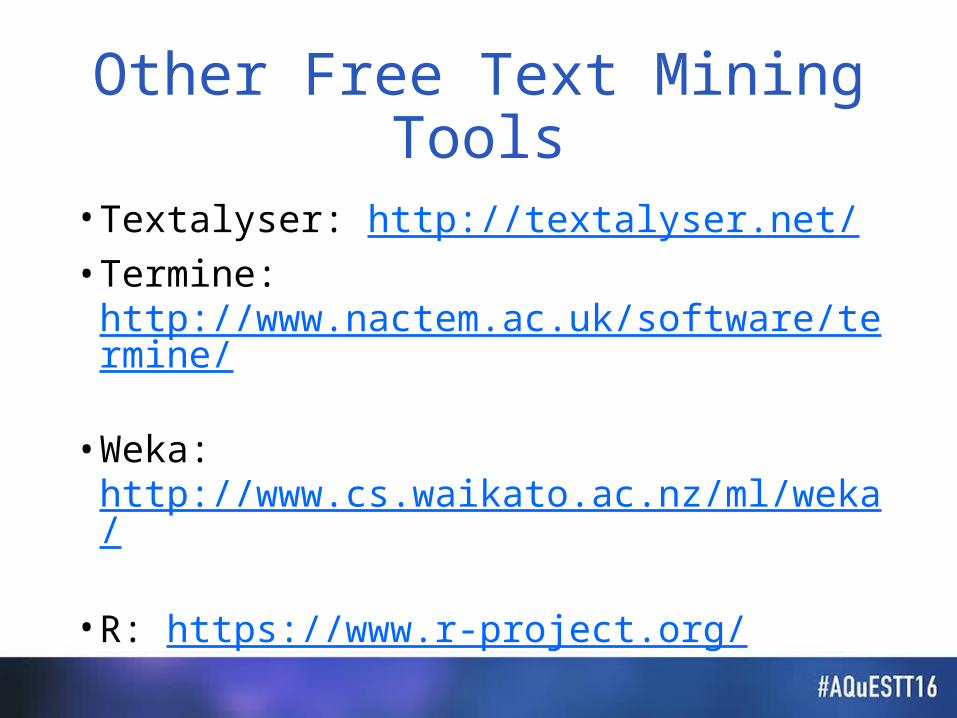
Other Free Text Mining Tools
• Textalyser: http://textalyser.net/ • Termine:
http://www.nactem.ac.uk/software/termine/
• Weka: http://www.cs.waikato.ac.nz/ml/weka/
• R: https://www.r-project.org/
Ways to Increase Response Rates
• Multiple contacts: pre-notification, follow-up
• Incentives: class credit• Personalization: personal salutation in
email to staff• Reduce burden: computers during parent
visits/conferences/events
BONUS:Working with Google Maps, Tables, and Charts

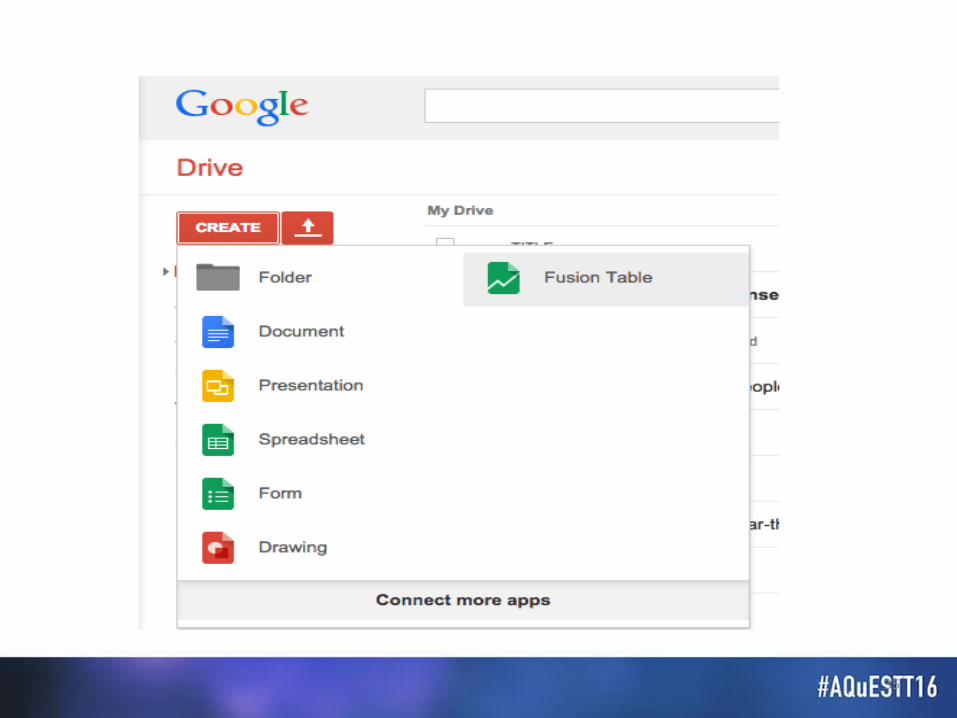
A Google Advantage• To work with Google Maps and Tables,
you need to have a Google account; if you do not have one, then you need to create one
• Once created, please open www.drive.google.com and log in
• Next steps are shown visually• Reference website:
https://www.geolounge.com/make-map-excel-data-using-google-fusion-tables/
35
36
37
38
39

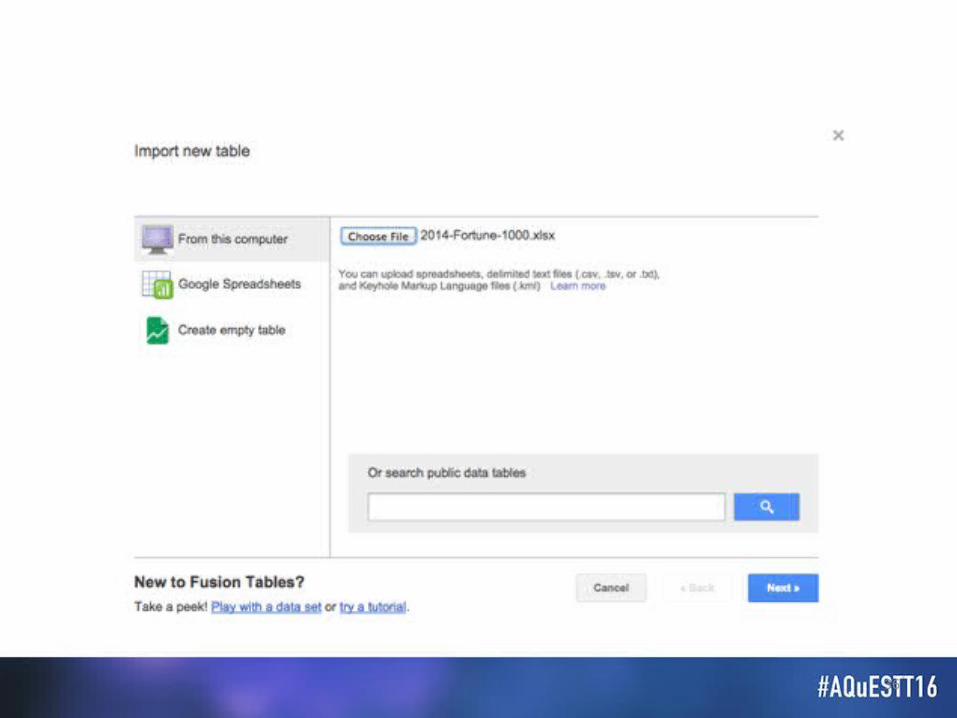
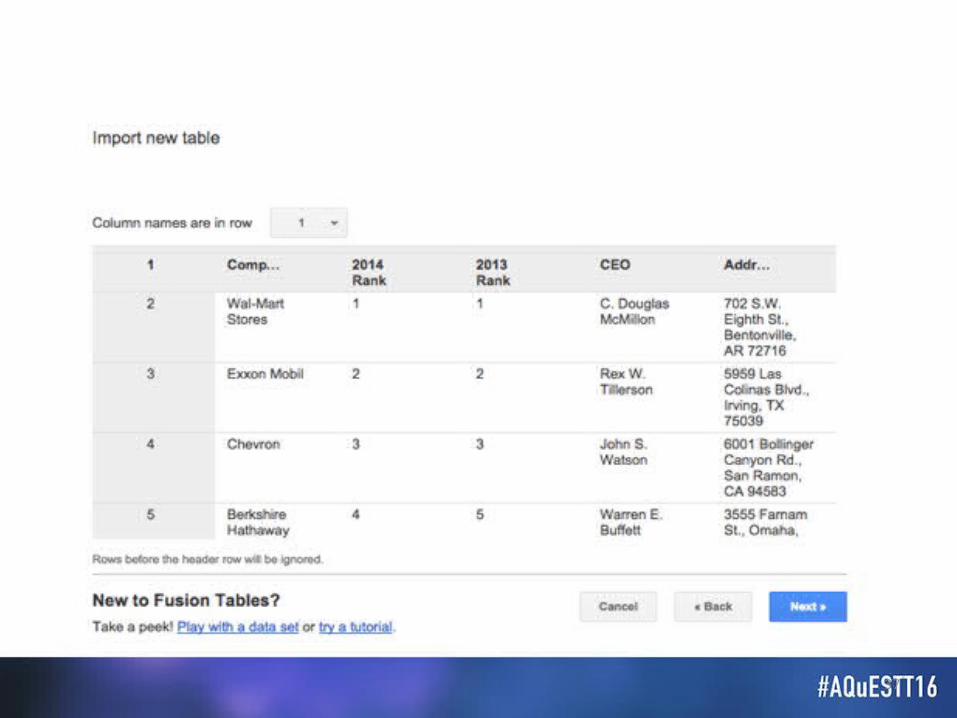
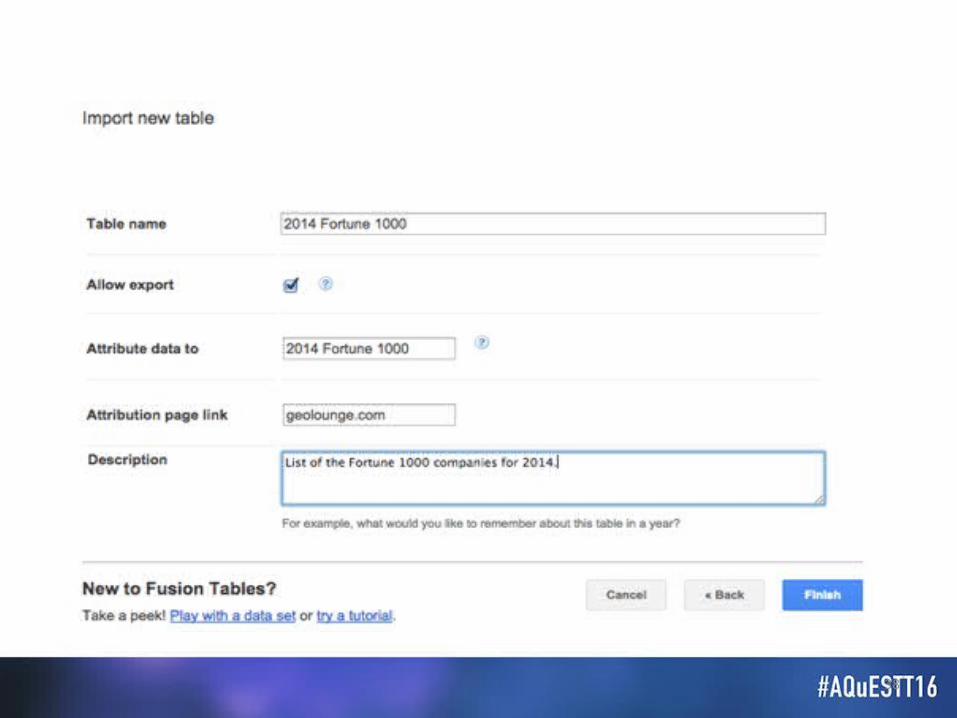
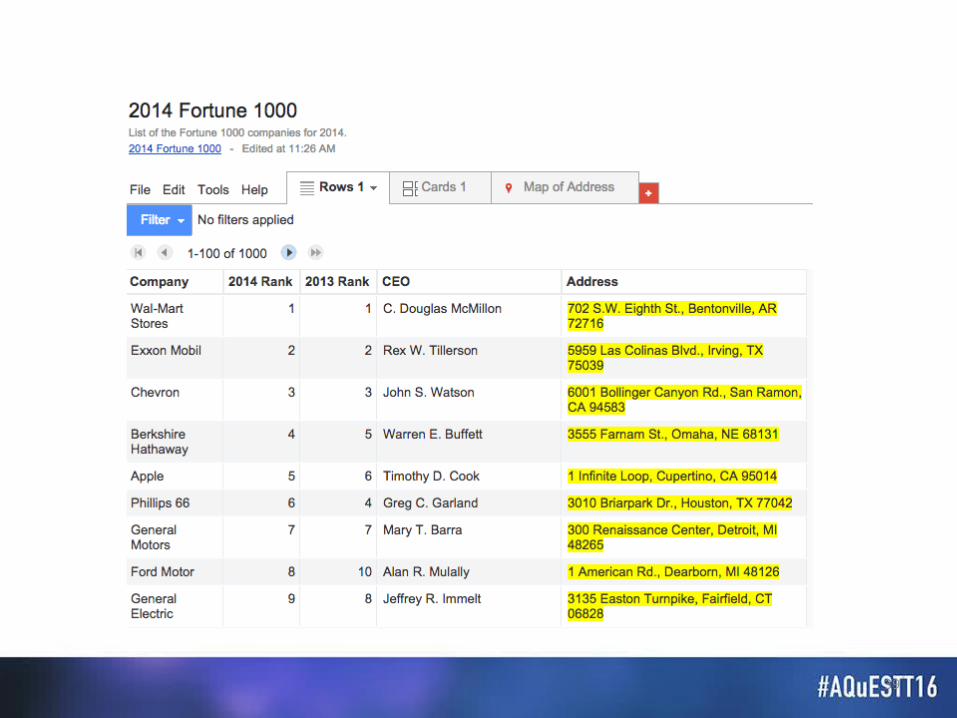
Setting Up Excel Data to Create a Map
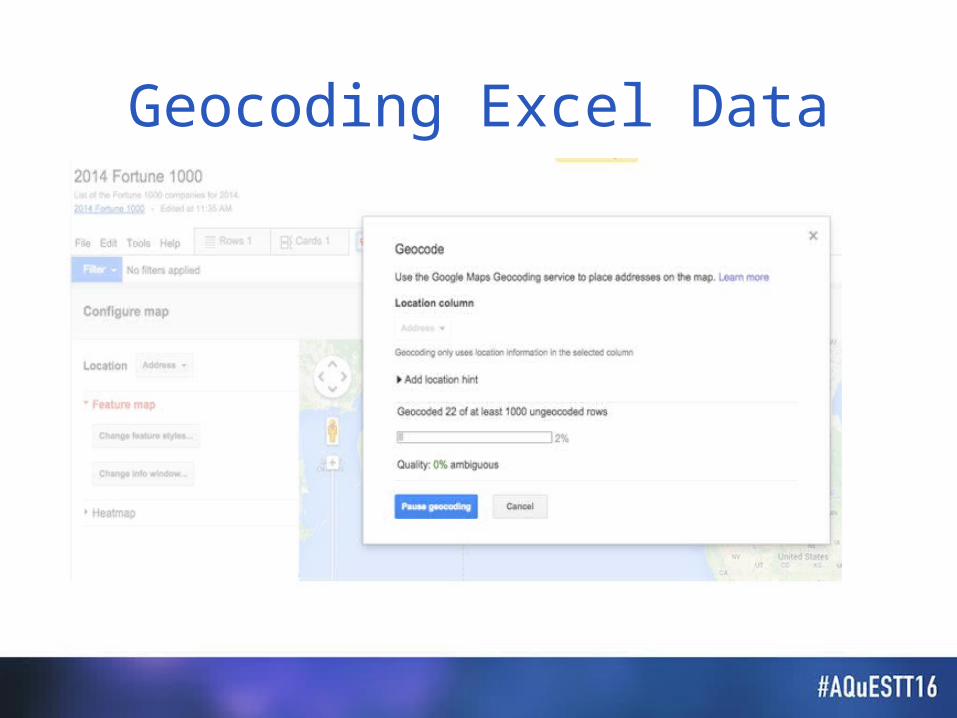
Geocoding Excel Data
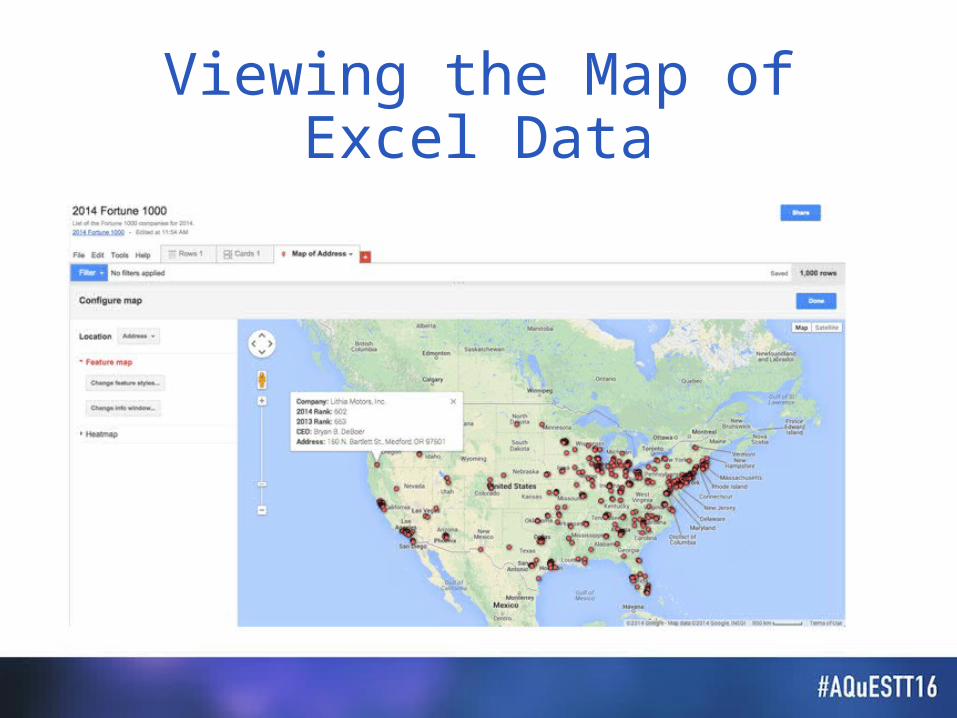
Viewing the Map of Excel Data
Customizing the Map
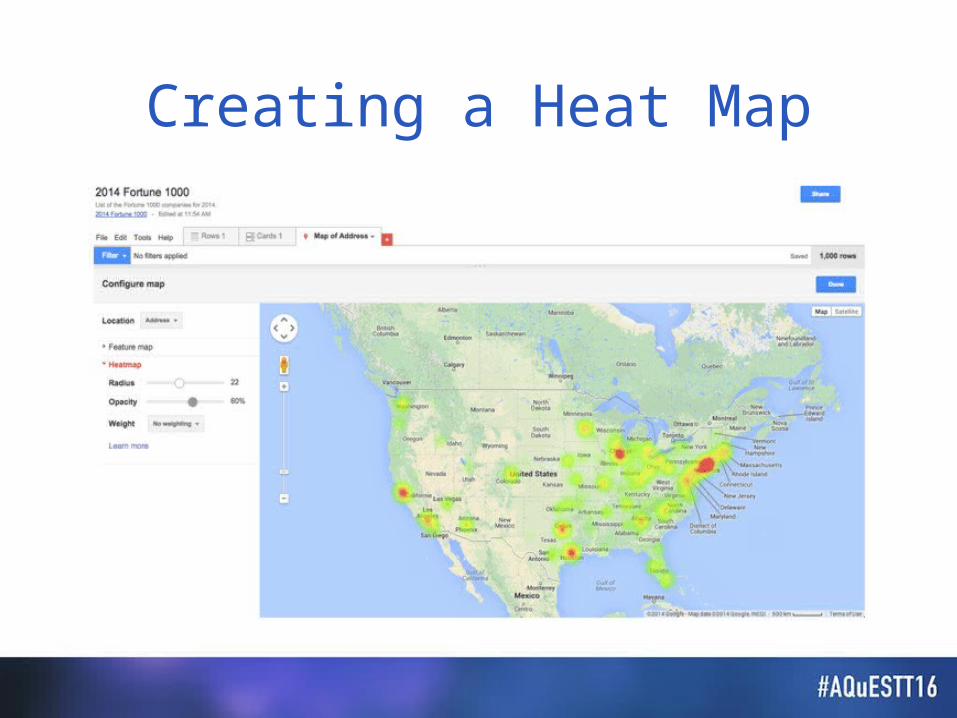
Creating a Heat Map
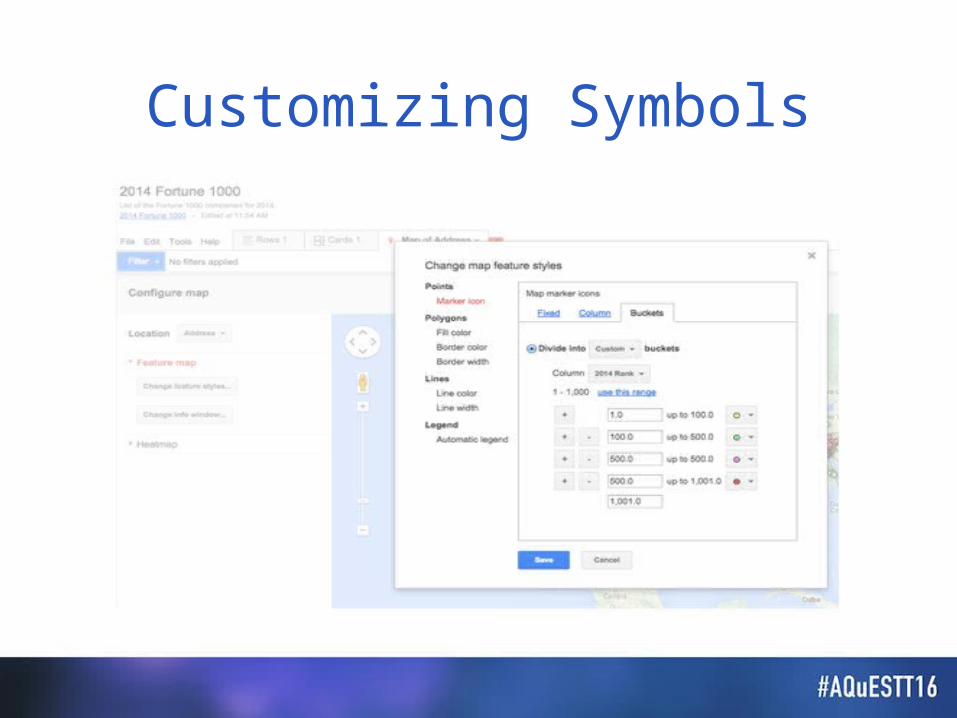
Customizing Symbols
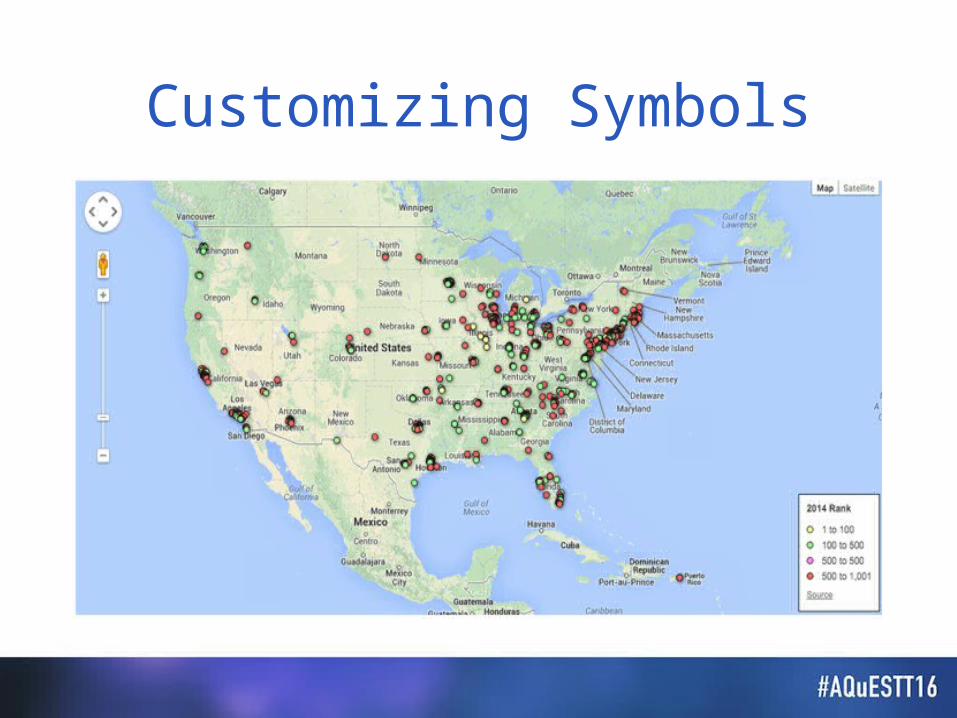
Customizing Symbols

Adding a Legend

Purpose for Today’s Session
• Understand the importance of perceptual data
• Investigate a variety of tools that support the analysis of perceptual text data

Thank you!
Follow us @NDE_GOV!