Embed Size (px)
Citation preview
Volume-II, Issue-XI December 2016 69
International Research Journal of Interdisciplinary & Multidisciplinary Studies (IRJIMS) A Peer-Reviewed Monthly Research Journal ISSN: 2394-7969 (Online), ISSN: 2394-7950 (Print) Volume-II, Issue-XI, December 2016, Page No. 69-90 Published by: Scholar Publications, Karimganj, Assam, India, 788711 Website: http://www.irjims.com
Perception of College Students towards Online Stores in Sivakasi Dr. R. Sorna Priya
Assistant Prof., Dept. of Commerce, Ayya Nadar Janaki Ammal College, Tamil Nadu, India
Dr. M. Rifaya Meera
Assistant Prof., Dept. of Commerce, Ayya Nadar Janaki Ammal College,Tamil Nadu, India
P. Vishwanath
Research Scholar, Dept. of Commerce, Ayya Nadar Janaki Ammal College, Tamil Nadu
Abstract
India has more than 100 million internet users out of which one half opts for online
purchases and the number is rising sharply every year. The growth in the number of online
shoppers is greater than the growth in Internet users, indicating that more Internet users
are becoming comfortable to shop online. The present article is an attempt that has been
made to study the perception of college students towards online shopping stores at Sivakasi.
In this study an attempt has been made perception on college students about online stores
has been playing a vital role in these scenarios day to day activities in the mind of
customers. Customer perception is typically affected in the way of broadly such as
advertising, reviews, public relations, social media and personal experiences etc. Today we
say that customers are mind blowing while go for an online shopping because the wide
range of internet facilities in the world. Thus the validated questionnaire was used to collect
data from 80 respondents. The researchers have adopted random convenient sampling
technique to gather the data from in and around college students in Sivakasi area. The data
are analyzed using the simple percentage analysis and chi-square tests. The result of this
study reveals that customers are intake in the future online shopping in the way of intention
for getting products through internet websites such as EBay, Flipkart etc.
Key Words: Online purchases, Online Shoppers, College students, Customer perception,
Sivakasi, Internet.
Introduction: Shopping is a form of electronic commerce which allows consumers to
directly buy goods or services from a seller over the internet using a web browser. An
online shop evokes the physical analogy of buying products or services at a bricks and
motor retailer or shopping center; the process is called business-to-consumer (B2C) online
shopping. This is evident because of the increase in retailers now offering online store
interfaces for consumers. With the growth of new market footprint coverage opportunities
for stores that can appropriately cater to offshore market demands and service requirements.
Perception of College Students towards Online… R. Sorna Priya, M. Rifaya Meera & P. Vishwanath
Volume-II, Issue-XI December 2016 70
Web applications have three main purposes to sell a product, to share general
information about a specific subject, and to share information about you. Internet has been
constantly gaining importance now a day. The number of people preferring internet for their
day to day activities also keeps on increasing. People to-day are doing most of their
domestic works online. Few examples are electricity payments, mobile bill, taxes, and
insurance payments through online. In today’s world people are running out of time for
doing normal activities like shop-ping. Internet and online shopping is been a boon to
people to manage their shopping and work equally. Online shopping allows the consumers
to directly buy goods from the seller through Internet. It is also called as web-store, e-shop
or online store. . Online customers must have access to the internet to buy goods from
online. People can look at these websites of online stores and purchase products in comfort
from home. For this study few well known websites such as Flipkart, ebay, Amazon,
Snapdeal, Myntra and jabong are taken.
In order to satisfy and gain the loyalty of their online customers, it is imperative for
businesses to leverage on the unique opportunities offered by e-commerce, particularly in
identifying customer’s shopping motivations. For online merchants, the motivations and
needs of customers may be surmised from the strategies they employ while visiting an
online store. For instance, some customers may choose to adopt a focused strategy to
deliberately search for product information when visiting an online store; while others may
prefer to casually explore an online store for the sake of shopping enjoyment.
Electronic commerce becomes one of the essential characteristics in the internet area.
According to UCLA Center for communication policy (2001), online shopping has become
the third most popular internet activity, immediately following e-mail using instant
messaging and web browsing. It is even more popular than seeking out entertainment
information and news, two commonly thought of activities when considering what internet
users do when online. Of internet users, 48.9 percent made online purchase in 2001, with
three-quarters of purchases indicating that they make purchase per year. Hence this study
made to know the customer preference towards online stores in sivakasi with sample
respondents of 80. This research also aims to find out the key factors that influence online
buying behavior of customers and to identify the determinants of online purchase intention
among customers.
Statement of the Problem: An increasing number and variety of firms and organizations
are exploiting and creating business opportunities on the Internet statistics indicate the repid
growth in the field of virtual store. With this emerging field of shopping the interest of
marketers is also increasing in studying what actually motivates customers to shop online.
Fierce competitions among online sellers have forced them to gain the competitive edge in
the field of virtual store. In order to gain competitive edge in the market, marketers need to
know the customer behavior in the field of online store. Online store commonly used by all
types of people especially students. They also influence then friends and family to make use
of it. So the researcher would like to study the reason why student prefer online stores. So it
is important to analyze and identify the factors which influence customers to shop online.
Perception of College Students towards Online… R. Sorna Priya, M. Rifaya Meera & P. Vishwanath
Volume-II, Issue-XI December 2016 71
Other than the factors which influence customers to shop online, online shopper’s
demography in terms of age, gender, income and education is equally important to define
their preference of online shopping.
Scope of the Study: This study has made a clear insight about the online store preference
among the respondents. An attempt has been made to find out the online store, which is
popular among the existing online store of customers this study also helps to understand the
factors that influence the customer to purchase from a particular online store.
Objectives of the Study:
To study the socio- economic status of the respondents.
To analyze the factors influencing the respondents to use online stores.
To identify the reason for preferring a particular online store.
To examine the satisfaction levels of the respondents towards the preferred online
store.
To analyze the problems faced by respondents in online store.
To offer suitable suggestions based on the finding of the study.
Hypotheses:
There is no association between age and preference for online stores.
There is no relationship between educational qualification and type of product
purchased through online stores.
Methodology:
The researcher has under taken an analytical study. The effectiveness of online store in
Sivakasi has been analyzed among college students.
Source of Data: The data required for the study are collected through Primary and
Secondary sources.
Primary Data: Primary data were collected from the college students through pretested
Interview schedule.
Secondary Data: The secondary data collected from various books, journals, magazines,
websites and so on.
Sampling Design: Since, the population of the study is large in number; it was decided to
use convenient sampling method. The researcher has used simple random sampling method
and has selected 80 college students in Sivakasi.
Review of Literature: Susan Rose et al, (2011) identified online purchase in particular
continues to rise, as adoption and penetration levels of Internet technology continuously
increase. By 2007, European Internet penetration stood at 43% of the population with a
231% usage growth year on year. In North America, penetration was at 71% of the
population with 120% growth (Internet World Stats 2007). This is also evidenced by

Perception of College Students towards Online… R. Sorna Priya, M. Rifaya Meera & P. Vishwanath
Volume-II, Issue-XI December 2016 72
increasing levels of online sales, which in the US reached US$128.1bn in 2007 and were
projected to reach US$165.9bn by 2009 (source: US Census Bureau 2009).
Kodandarama Setty (2013) stated that “We are facing some threat from online stores in
these electronics categories; however, in the big market of consumer durables we are safe
for now”. K. Vaitheesewaran (2013) examined the convenience of online shopping “With
product getting standardized, specifications getting fixed and the concept of service getting
eroded, the post-sale responsibility of the retailer has come down drastically. Hence
customers go to stores to explore the product physically detail but by online at a cheaper
rate. Heavy discounts of e-commerce firms are possible because of their no warehouse
model.”
Dr. R. Shanthi Dr. Desti Kannaia (2015), “Consumers’ Perception on Online Shopping”
through this study it is found that majority of students of University of Madras and Madras
Christians College are well aware of the online shopping and 90% of them have made
online purchase which indicates the growing popularity of the online shopping within the
youngsters. Transformation in the trends of shopping is occurring because of the changing
lifestyle of the consumers in India and expansion in online activity. Major draw card of
online shopping is the ease and discounts available for different kind of products.
Understanding the young online shoppers enable the e-retailers to develop suitable
marketing strategy in order to attract and convert potential customer as an active customers.
Vidya Shree DV et al, (2015), “A Comparative study on consumer Preferences towards
online retail marketers-with special reference to Flipkart, Jabong, Amazon, Snapdeal
Myntra and fashion and you” online shopping won’t ever completely eliminate its physical
counterpart. There are still areas where we prefer to go into a shop and select items–they’re
part of any community, from newsagents to supermarkets. But there’s no going back, and
online shopping will become an even more central part of our lives, growing more
sophisticated with each passing year.
Meharaj Banu et al, (2014), “A Study on Customer Preference towards Online Shopping
with special Reference to Tiruchirappall District”, this study investigates the determinants
that are responsible for choosing of the online purchasing portals by the consumers
whenever they decide for purchasing products. Furthermore, the study was taken ahead with
the conclusions drawn from the empirical survey and developing innovations important for
the online purchasing portals. The empirical results show that consumers preferred to accept
on line purchasing portals for their purchases whenever they perceived that the determinants
like product preference through the respective purchasing portals, variety options available
in the portals and convenience of online shopping and in accordance to their preferences.
This research shows that online shopping is having very bright future in India.
Dr. A. T. Jaganathan et al (2016), “A study on customer perception towards online
shopping, Namakkal”, the consumer’s perception on online shopping varies from person to
another and the perception is limited to a certain extent with the availability of the proper
Perception of College Students towards Online… R. Sorna Priya, M. Rifaya Meera & P. Vishwanath
Volume-II, Issue-XI December 2016 73
connectivity and the exposure to the online shopping has to be improved to make the
customer satisfied. The perception of the consumer also has similarities and difference
based on their personal characteristics usage based on their needs and demand. The study
reveals that mostly the students are attached to the online shopping and hence the elder
people don’t use online shopping much as compared to the younger ones, so awareness has
been fashioned in the coming era. Finally we are suggested that the online transaction
should be flexible for the customers who perceived in shopping.
Zia Ul Haq (2015), Perception towards online shopping: an empirical study of Indian
consumers, The result of our study shows that the perception of online shoppers is
independent of their age and gender but not independent of their qualification & gender and
income & gender The analytical results of our study further indicate relationships between
consumers’ perceptions of the factors that influence their intention to buy through online.
More specifically, consumers’ perceptions of the customer service, commitment and web
security of online purchasing exhibit significant relationships with their online buying
intention.
Dr. Rakshita Puranik and Dr. Alok Bansal (2014), A Study of Internet Users' Perception
towards E-shopping, The results of the study helps the company to understand customer
perception towards the online services provided before, during and after the purchase of
product/service. Findings of this research in terms of internet users' perceptions could help
firms to understand the internet users' needs and consequently, relate the marketing
policies/strategies/program to be applied. Study is of relevance to both e-marketers and e-
tailors, since it enables them to assess the features that specifically attract consumers to
shop on the Internet. This paper provides a framework that also helps researchers
understand the drivers of consumers' perception and their intention to shop on the Internet.
Researchers can conduct similar studies in different geographical areas to validate the
findings of this study.
Kanwal Gurleen (2012), “Consumer’s Perception towards Online Shopping- The Case of
Punjab” It was seen from the study that most of the Respondents of the age group 36-45
years were found to be adopters of online shopping. Most of the Males were the adopters as
compared to females, where 53.7% were non-adopters. The adopters were mostly post
graduates with monthly income in the range of Rs.20000-Rs.30000. The respondents those
who use internet from 5 to 7 hours a day were found to be adopters of online shopping.
Further, the factor analysis was applied to understand the various reasons for adoption and
non-adoption of online shopping by the respondents. The following four factors were found
to be significant Price Consciousness, Convenience and Variety, Easy Payment options and
Challenges of Online Shopping. Also the online purchases take a longer time in shipments
and deliveries.
Results and Discussion:
Table 1 Gender wise Classification of the Respondents
Perception of College Students towards Online… R. Sorna Priya, M. Rifaya Meera & P. Vishwanath
Volume-II, Issue-XI December 2016 74
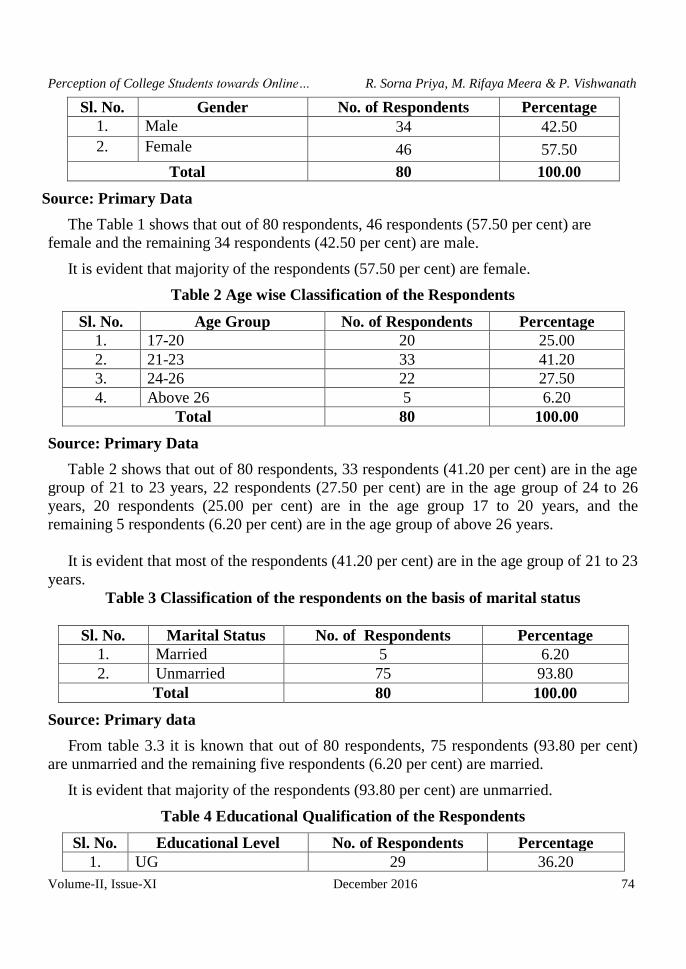
Sl. No. Gender No. of Respondents Percentage
1. Male 34 42.50
2. Female 46 57.50
Total 80 100.00
Source: Primary Data
The Table 1 shows that out of 80 respondents, 46 respondents (57.50 per cent) are
female and the remaining 34 respondents (42.50 per cent) are male.
It is evident that majority of the respondents (57.50 per cent) are female.
Table 2 Age wise Classification of the Respondents
Sl. No. Age Group No. of Respondents Percentage
1. 17-20 20 25.00
2. 21-23 33 41.20
3. 24-26 22 27.50
4. Above 26 5 6.20
Total 80 100.00
Source: Primary Data
Table 2 shows that out of 80 respondents, 33 respondents (41.20 per cent) are in the age
group of 21 to 23 years, 22 respondents (27.50 per cent) are in the age group of 24 to 26
years, 20 respondents (25.00 per cent) are in the age group 17 to 20 years, and the
remaining 5 respondents (6.20 per cent) are in the age group of above 26 years.
It is evident that most of the respondents (41.20 per cent) are in the age group of 21 to 23
years.
Table 3 Classification of the respondents on the basis of marital status
Sl. No. Marital Status No. of Respondents Percentage
1. Married 5 6.20
2. Unmarried 75 93.80
Total 80 100.00
Source: Primary data
From table 3.3 it is known that out of 80 respondents, 75 respondents (93.80 per cent)
are unmarried and the remaining five respondents (6.20 per cent) are married.
It is evident that majority of the respondents (93.80 per cent) are unmarried.
Table 4 Educational Qualification of the Respondents
Sl. No. Educational Level No. of Respondents Percentage
1. UG 29 36.20
Perception of College Students towards Online… R. Sorna Priya, M. Rifaya Meera & P. Vishwanath
Volume-II, Issue-XI December 2016 75
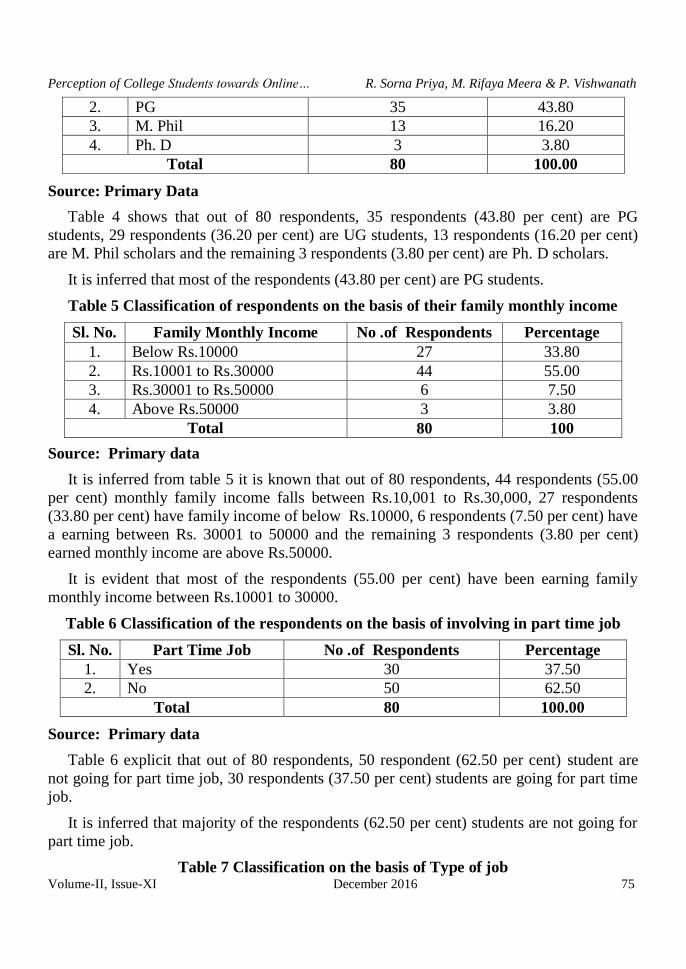
2. PG 35 43.80
3. M. Phil 13 16.20
4. Ph. D 3 3.80
Total 80 100.00
Source: Primary Data
Table 4 shows that out of 80 respondents, 35 respondents (43.80 per cent) are PG
students, 29 respondents (36.20 per cent) are UG students, 13 respondents (16.20 per cent)
are M. Phil scholars and the remaining 3 respondents (3.80 per cent) are Ph. D scholars.
It is inferred that most of the respondents (43.80 per cent) are PG students.
Table 5 Classification of respondents on the basis of their family monthly income
Sl. No. Family Monthly Income No .of Respondents Percentage
1. Below Rs.10000 27 33.80
2. Rs.10001 to Rs.30000 44 55.00
3. Rs.30001 to Rs.50000 6 7.50
4. Above Rs.50000 3 3.80
Total 80 100
Source: Primary data
It is inferred from table 5 it is known that out of 80 respondents, 44 respondents (55.00
per cent) monthly family income falls between Rs.10,001 to Rs.30,000, 27 respondents
(33.80 per cent) have family income of below Rs.10000, 6 respondents (7.50 per cent) have
a earning between Rs. 30001 to 50000 and the remaining 3 respondents (3.80 per cent)
earned monthly income are above Rs.50000.
It is evident that most of the respondents (55.00 per cent) have been earning family
monthly income between Rs.10001 to 30000.
Table 6 Classification of the respondents on the basis of involving in part time job
Sl. No. Part Time Job No .of Respondents Percentage
1. Yes 30 37.50
2. No 50 62.50
Total 80 100.00
Source: Primary data
Table 6 explicit that out of 80 respondents, 50 respondent (62.50 per cent) student are
not going for part time job, 30 respondents (37.50 per cent) students are going for part time
job.
It is inferred that majority of the respondents (62.50 per cent) students are not going for
part time job.
Table 7 Classification on the basis of Type of job

Perception of College Students towards Online… R. Sorna Priya, M. Rifaya Meera & P. Vishwanath
Volume-II, Issue-XI December 2016 76
Sl. No. Type of Part Time Job No. of Respondents Percentage
1. Sales Person 8 26.67
2. Collection & Delivery 6 20.00
3. Tuition center 8 26.67
4. Others 8 26.67
Total 30 100.00
Source: Primary Data
Table 7 explicit that out of 30 respondents, Eight respondents (26.67 per cent) are
working as sales person, Eight respondents (26.67 per cent) are working as teachers in
tuition center, Eight respondents (26.67 per cent) belong to some other category and the
remaining Six respondents (20.00 per cent) have the nature of work as Collection &
Delivery.
It is understood that most of the respondents (26.67 per cent) are equally distributed as
the sales person, teachers, and other category like online business, outsourcing.
Table 8 Monthly Income of Part Time Job
Sl. No. Monthly Income No .of Respondents Percentage
1. Below Rs.1000 3 10.00
2. Rs.1001 to Rs.3000 10 33.33
3. Rs.3001 to Rs.5000 12 40.00
4. Above Rs.5000 5 16.67
Total 30 100.00
Source: Primary data
From table 8 it is known that out of 80 respondents, 12 respondents (40.00 per cent) earn
between Rs.3001 to Rs.5000 through their part time job, 10 respondents (33.33 per cent)
earn between Rs.1001 to Rs.3000, Five respondents (16.67 per cent) earn above Rs.5000,
and the remaining three respondents (10.00 per cent) earn below Rs.1000 from their part
time job.
It is evident that most of the respondents (40.00 per cent) earn between Rs.3000 to
Rs.5000 from their part time job.
Perception of College Students towards Online… R. Sorna Priya, M. Rifaya Meera & P. Vishwanath
Volume-II, Issue-XI December 2016 77
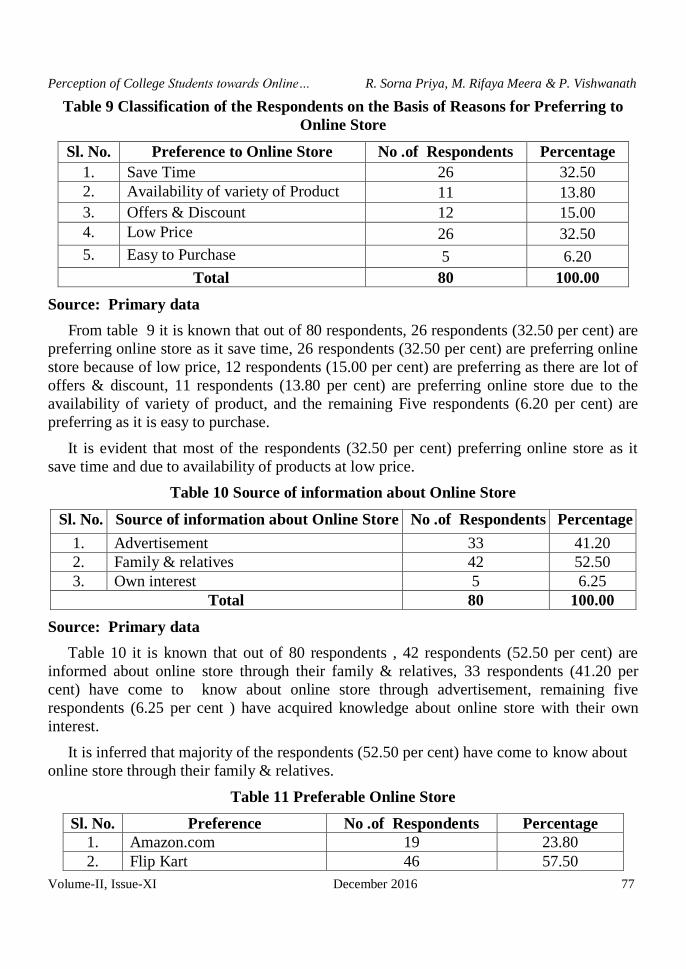
Table 9 Classification of the Respondents on the Basis of Reasons for Preferring to
Online Store
Sl. No. Preference to Online Store No .of Respondents Percentage
1. Save Time 26 32.50
2. Availability of variety of Product 11 13.80
3. Offers & Discount 12 15.00
4. Low Price 26 32.50
5. Easy to Purchase 5 6.20
Total 80 100.00
Source: Primary data
From table 9 it is known that out of 80 respondents, 26 respondents (32.50 per cent) are
preferring online store as it save time, 26 respondents (32.50 per cent) are preferring online
store because of low price, 12 respondents (15.00 per cent) are preferring as there are lot of
offers & discount, 11 respondents (13.80 per cent) are preferring online store due to the
availability of variety of product, and the remaining Five respondents (6.20 per cent) are
preferring as it is easy to purchase.
It is evident that most of the respondents (32.50 per cent) preferring online store as it
save time and due to availability of products at low price.
Table 10 Source of information about Online Store
Sl. No. Source of information about Online Store No .of Respondents Percentage
1. Advertisement 33 41.20
2. Family & relatives 42 52.50
3. Own interest 5 6.25
Total 80 100.00
Source: Primary data
Table 10 it is known that out of 80 respondents , 42 respondents (52.50 per cent) are
informed about online store through their family & relatives, 33 respondents (41.20 per
cent) have come to know about online store through advertisement, remaining five
respondents (6.25 per cent ) have acquired knowledge about online store with their own
interest.
It is inferred that majority of the respondents (52.50 per cent) have come to know about
online store through their family & relatives.
Table 11 Preferable Online Store
Sl. No. Preference No .of Respondents Percentage
1. Amazon.com 19 23.80
2. Flip Kart 46 57.50
Perception of College Students towards Online… R. Sorna Priya, M. Rifaya Meera & P. Vishwanath
Volume-II, Issue-XI December 2016 78
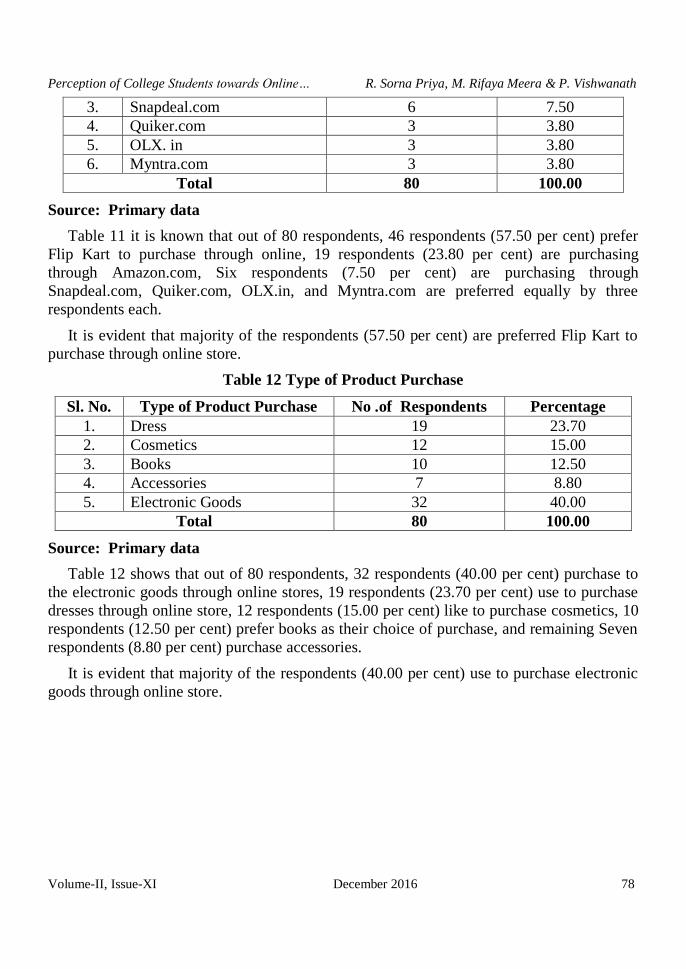
3. Snapdeal.com 6 7.50
4. Quiker.com 3 3.80
5. OLX. in 3 3.80
6. Myntra.com 3 3.80
Total 80 100.00
Source: Primary data
Table 11 it is known that out of 80 respondents, 46 respondents (57.50 per cent) prefer
Flip Kart to purchase through online, 19 respondents (23.80 per cent) are purchasing
through Amazon.com, Six respondents (7.50 per cent) are purchasing through
Snapdeal.com, Quiker.com, OLX.in, and Myntra.com are preferred equally by three
respondents each.
It is evident that majority of the respondents (57.50 per cent) are preferred Flip Kart to
purchase through online store.
Table 12 Type of Product Purchase
Sl. No. Type of Product Purchase No .of Respondents Percentage
1. Dress 19 23.70
2. Cosmetics 12 15.00
3. Books 10 12.50
4. Accessories 7 8.80
5. Electronic Goods 32 40.00
Total 80 100.00
Source: Primary data
Table 12 shows that out of 80 respondents, 32 respondents (40.00 per cent) purchase to
the electronic goods through online stores, 19 respondents (23.70 per cent) use to purchase
dresses through online store, 12 respondents (15.00 per cent) like to purchase cosmetics, 10
respondents (12.50 per cent) prefer books as their choice of purchase, and remaining Seven
respondents (8.80 per cent) purchase accessories.
It is evident that majority of the respondents (40.00 per cent) use to purchase electronic
goods through online store.
Perception of College Students towards Online… R. Sorna Priya, M. Rifaya Meera & P. Vishwanath
Volume-II, Issue-XI December 2016 79
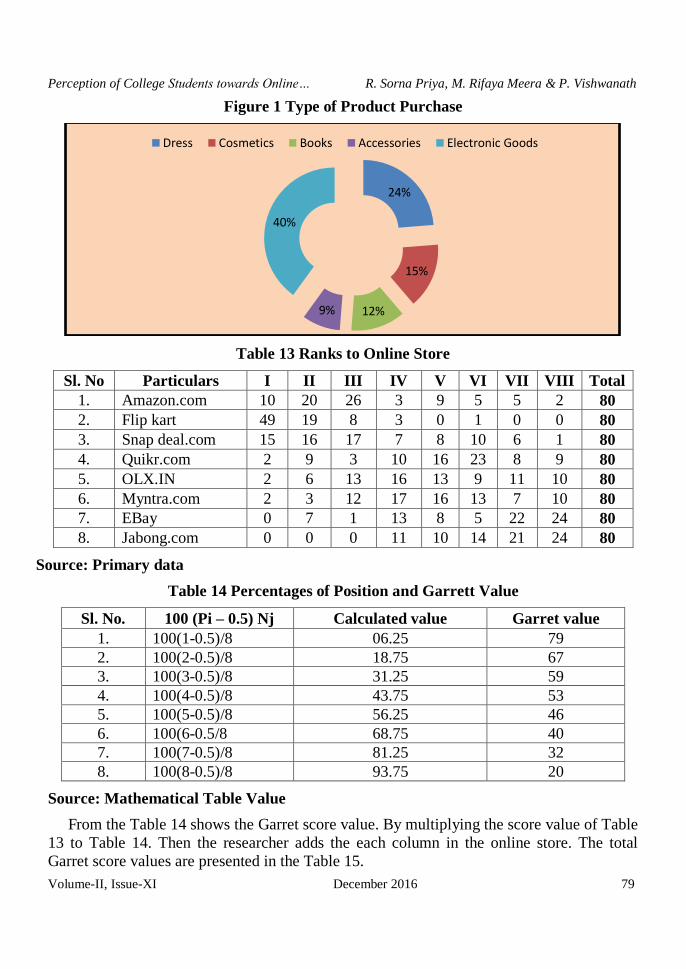
Figure 1 Type of Product Purchase
Table 13 Ranks to Online Store
Sl. No Particulars I II III IV V VI VII VIII Total
1. Amazon.com 10 20 26 3 9 5 5 2 80
2. Flip kart 49 19 8 3 0 1 0 0 80
3. Snap deal.com 15 16 17 7 8 10 6 1 80
4. Quikr.com 2 9 3 10 16 23 8 9 80
5. OLX.IN 2 6 13 16 13 9 11 10 80
6. Myntra.com 2 3 12 17 16 13 7 10 80
7. EBay 0 7 1 13 8 5 22 24 80
8. Jabong.com 0 0 0 11 10 14 21 24 80
Source: Primary data
Table 14 Percentages of Position and Garrett Value
Sl. No. 100 (Pi – 0.5) Nj Calculated value Garret value
1. 100(1-0.5)/8 06.25 79
2. 100(2-0.5)/8 18.75 67
3. 100(3-0.5)/8 31.25 59
4. 100(4-0.5)/8 43.75 53
5. 100(5-0.5)/8 56.25 46
6. 100(6-0.5/8 68.75 40
7. 100(7-0.5)/8 81.25 32
8. 100(8-0.5)/8 93.75 20
Source: Mathematical Table Value
From the Table 14 shows the Garret score value. By multiplying the score value of Table
13 to Table 14. Then the researcher adds the each column in the online store. The total
Garret score values are presented in the Table 15.
24%
15%
12% 9%
40%
Dress Cosmetics Books Accessories Electronic Goods
Perception of College Students towards Online… R. Sorna Priya, M. Rifaya Meera & P. Vishwanath
Volume-II, Issue-XI December 2016 80
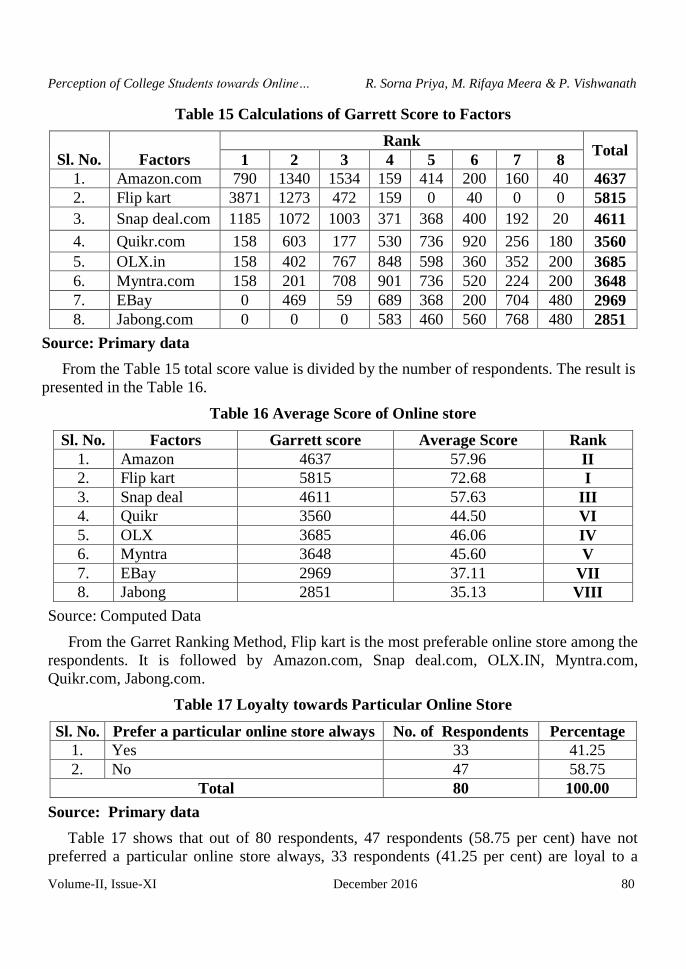
Table 15 Calculations of Garrett Score to Factors
Sl. No.
Factors
Rank Total
1 2 3 4 5 6 7 8
1. Amazon.com 790 1340 1534 159 414 200 160 40 4637
2. Flip kart 3871 1273 472 159 0 40 0 0 5815
3. Snap deal.com 1185 1072 1003 371 368 400 192 20 4611
4. Quikr.com 158 603 177 530 736 920 256 180 3560
5. OLX.in 158 402 767 848 598 360 352 200 3685
6. Myntra.com 158 201 708 901 736 520 224 200 3648
7. EBay 0 469 59 689 368 200 704 480 2969
8. Jabong.com 0 0 0 583 460 560 768 480 2851
Source: Primary data
From the Table 15 total score value is divided by the number of respondents. The result is
presented in the Table 16.
Table 16 Average Score of Online store
Sl. No. Factors Garrett score Average Score Rank
1. Amazon 4637 57.96 II
2. Flip kart 5815 72.68 I
3. Snap deal 4611 57.63 III
4. Quikr 3560 44.50 VI
5. OLX 3685 46.06 IV
6. Myntra 3648 45.60 V
7. EBay 2969 37.11 VII
8. Jabong 2851 35.13 VIII
Source: Computed Data
From the Garret Ranking Method, Flip kart is the most preferable online store among the
respondents. It is followed by Amazon.com, Snap deal.com, OLX.IN, Myntra.com,
Quikr.com, Jabong.com.
Table 17 Loyalty towards Particular Online Store
Sl. No. Prefer a particular online store always No. of Respondents Percentage
1. Yes 33 41.25
2. No 47 58.75
Total 80 100.00
Source: Primary data
Table 17 shows that out of 80 respondents, 47 respondents (58.75 per cent) have not
preferred a particular online store always, 33 respondents (41.25 per cent) are loyal to a

Perception of College Students towards Online… R. Sorna Priya, M. Rifaya Meera & P. Vishwanath
Volume-II, Issue-XI December 2016 81
particular online store always. It is evident that most of the respondents (58.75 per cent)
have not preferred a particular online store always.
Table 18 Reason for Preferring a Particular Online Store
Sl. No. Reason for Preferring a
Particular Online Store
No .of Respondents Percentage
1. Best service 13 39.40
2. Safety 4 12.12
3. Variety of product 10 30.30
4. Goodwill 6 18.18
Total 33 100.00
Source: Primary data
From table 18 it is known that out of 80 respondents, 13 respondents (39.40 per cent) are
preferring for a particular online store for its best service, 10 respondents (30.30 per cent)
are preferring a online store due its variety of product, Six respondents (18.18 per cent) are
preferring for its goodwill, Four respondents (12.12 per cent) feel that their choice of online
store is safe to shop. It is evident that most of the respondents (39.80 per cent) are reason for
preferring a particular online store due to its best service.
Table 19 Online Store Usage
Sl. No. Online store usage No .of Respondents Percentage
1. Frequently 9 11.20
2. Need Arises 32 40.00
3. At the time of offers 8 10.00
4. Rarely 31 38.80
Total 80 100.00
Source: Primary data
Table 19 explicit that out of 80 respondents, 32 respondents (40.00 per cent) use online
store as & when need arises, 31 respondents (38.80 per cent) make use of online store
rarely, 9 respondents (11.20 per cent) frequently use of online stores, eight respondents
(10.00 per cent) use at the time of offers.
It is inferred that majority of the respondents (40.00 per cent) use to purchase through
online stores when need arises.
Table 20 Source of Information about Offers & Discounts
Sl. No. Source of Information about
Offers & Discounts
No .of Respondents Percentage
1. Family & friends 14 17.50
2. Advertisements 52 65.00
3. Own interest 3 3.80
Perception of College Students towards Online… R. Sorna Priya, M. Rifaya Meera & P. Vishwanath
Volume-II, Issue-XI December 2016 82
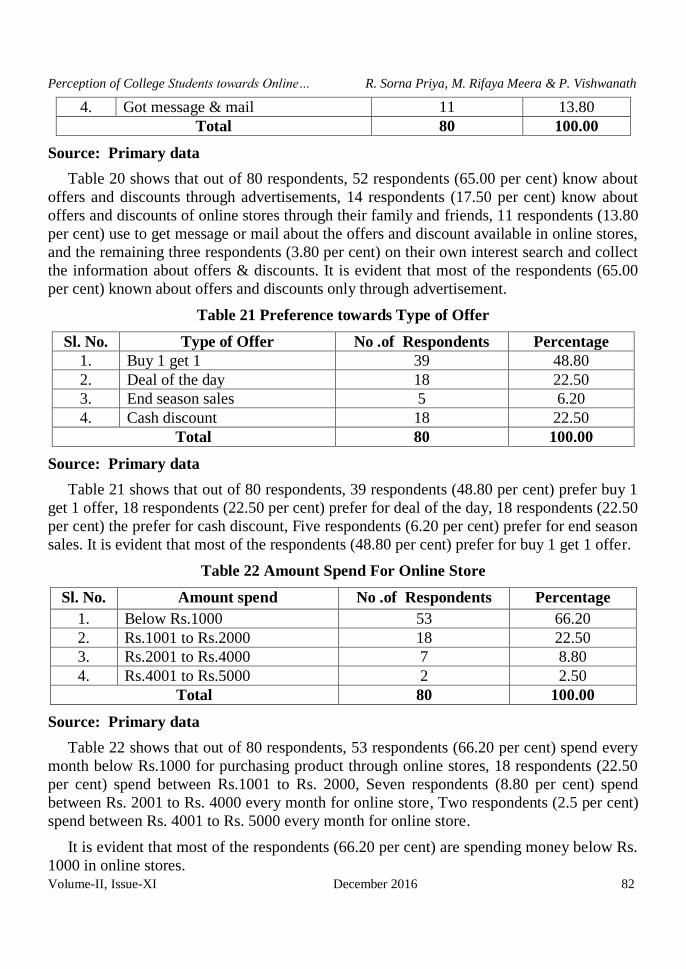
4. Got message & mail 11 13.80
Total 80 100.00
Source: Primary data
Table 20 shows that out of 80 respondents, 52 respondents (65.00 per cent) know about
offers and discounts through advertisements, 14 respondents (17.50 per cent) know about
offers and discounts of online stores through their family and friends, 11 respondents (13.80
per cent) use to get message or mail about the offers and discount available in online stores,
and the remaining three respondents (3.80 per cent) on their own interest search and collect
the information about offers & discounts. It is evident that most of the respondents (65.00
per cent) known about offers and discounts only through advertisement.
Table 21 Preference towards Type of Offer
Sl. No. Type of Offer No .of Respondents Percentage
1. Buy 1 get 1 39 48.80
2. Deal of the day 18 22.50
3. End season sales 5 6.20
4. Cash discount 18 22.50
Total 80 100.00
Source: Primary data
Table 21 shows that out of 80 respondents, 39 respondents (48.80 per cent) prefer buy 1
get 1 offer, 18 respondents (22.50 per cent) prefer for deal of the day, 18 respondents (22.50
per cent) the prefer for cash discount, Five respondents (6.20 per cent) prefer for end season
sales. It is evident that most of the respondents (48.80 per cent) prefer for buy 1 get 1 offer.
Table 22 Amount Spend For Online Store
Sl. No. Amount spend No .of Respondents Percentage
1. Below Rs.1000 53 66.20
2. Rs.1001 to Rs.2000 18 22.50
3. Rs.2001 to Rs.4000 7 8.80
4. Rs.4001 to Rs.5000 2 2.50
Total 80 100.00
Source: Primary data
Table 22 shows that out of 80 respondents, 53 respondents (66.20 per cent) spend every
month below Rs.1000 for purchasing product through online stores, 18 respondents (22.50
per cent) spend between Rs.1001 to Rs. 2000, Seven respondents (8.80 per cent) spend
between Rs. 2001 to Rs. 4000 every month for online store, Two respondents (2.5 per cent)
spend between Rs. 4001 to Rs. 5000 every month for online store.
It is evident that most of the respondents (66.20 per cent) are spending money below Rs.
1000 in online stores.
Perception of College Students towards Online… R. Sorna Priya, M. Rifaya Meera & P. Vishwanath
Volume-II, Issue-XI December 2016 83
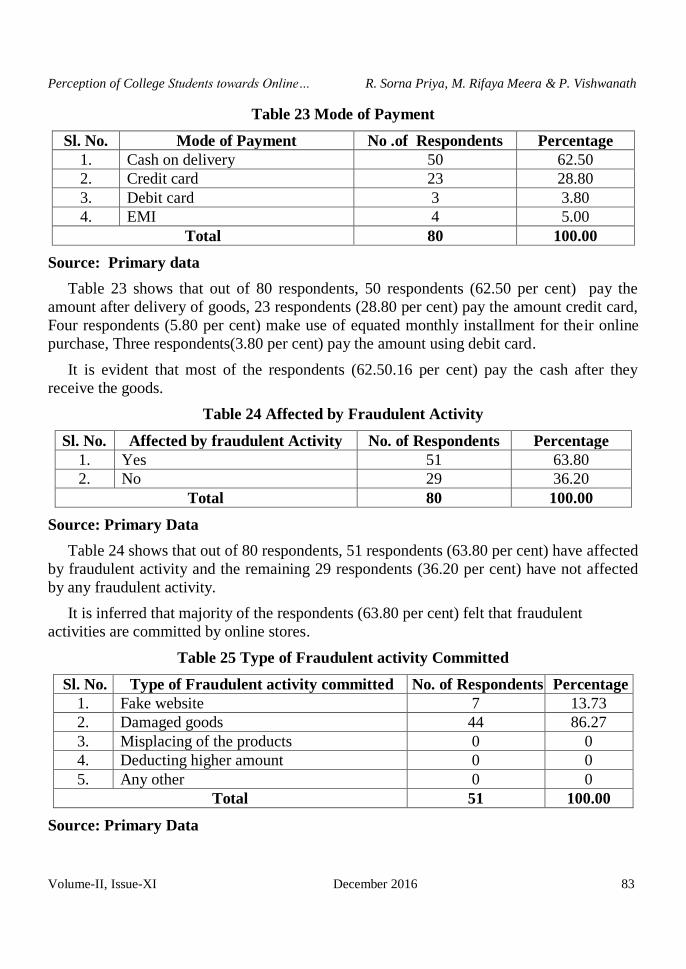
Table 23 Mode of Payment
Sl. No. Mode of Payment No .of Respondents Percentage
1. Cash on delivery 50 62.50
2. Credit card 23 28.80
3. Debit card 3 3.80
4. EMI 4 5.00
Total 80 100.00
Source: Primary data
Table 23 shows that out of 80 respondents, 50 respondents (62.50 per cent) pay the
amount after delivery of goods, 23 respondents (28.80 per cent) pay the amount credit card,
Four respondents (5.80 per cent) make use of equated monthly installment for their online
purchase, Three respondents(3.80 per cent) pay the amount using debit card.
It is evident that most of the respondents (62.50.16 per cent) pay the cash after they
receive the goods.
Table 24 Affected by Fraudulent Activity
Sl. No. Affected by fraudulent Activity No. of Respondents Percentage
1. Yes 51 63.80
2. No 29 36.20
Total 80 100.00
Source: Primary Data
Table 24 shows that out of 80 respondents, 51 respondents (63.80 per cent) have affected
by fraudulent activity and the remaining 29 respondents (36.20 per cent) have not affected
by any fraudulent activity.
It is inferred that majority of the respondents (63.80 per cent) felt that fraudulent
activities are committed by online stores.
Table 25 Type of Fraudulent activity Committed
Sl. No. Type of Fraudulent activity committed No. of Respondents Percentage
1. Fake website 7 13.73
2. Damaged goods 44 86.27
3. Misplacing of the products 0 0
4. Deducting higher amount 0 0
5. Any other 0 0
Total 51 100.00
Source: Primary Data
Perception of College Students towards Online… R. Sorna Priya, M. Rifaya Meera & P. Vishwanath
Volume-II, Issue-XI December 2016 84
Table 25 shows that out of 51 respondents, 44 respondents (86.27 per cent) have
received damaged goods through their online shopping, seven respondents (13.73 per cent)
have accessed fake website.
It is evident that most of the respondents (86.27 per cent) have received damaged goods
from online stores against their orders.
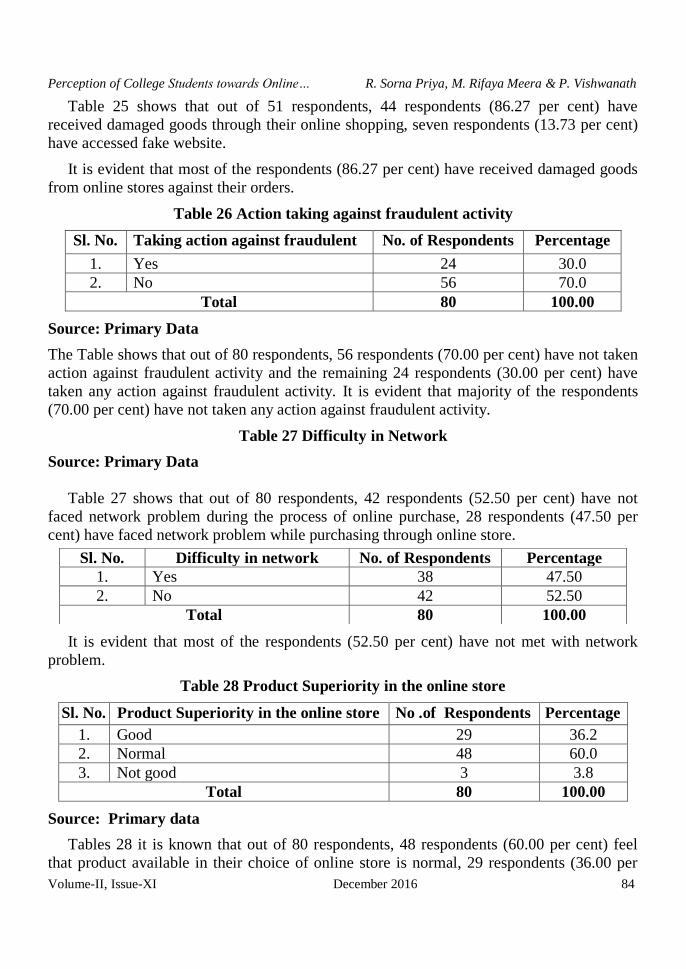
Table 26 Action taking against fraudulent activity
Sl. No. Taking action against fraudulent No. of Respondents Percentage
1. Yes 24 30.0
2. No 56 70.0
Total 80 100.00
Source: Primary Data
The Table shows that out of 80 respondents, 56 respondents (70.00 per cent) have not taken
action against fraudulent activity and the remaining 24 respondents (30.00 per cent) have
taken any action against fraudulent activity. It is evident that majority of the respondents
(70.00 per cent) have not taken any action against fraudulent activity.
Table 27 Difficulty in Network
Source: Primary Data
Table 27 shows that out of 80 respondents, 42 respondents (52.50 per cent) have not
faced network problem during the process of online purchase, 28 respondents (47.50 per
cent) have faced network problem while purchasing through online store.
It is evident that most of the respondents (52.50 per cent) have not met with network
problem.
Table 28 Product Superiority in the online store
Sl. No. Product Superiority in the online store No .of Respondents Percentage
1. Good 29 36.2
2. Normal 48 60.0
3. Not good 3 3.8
Total 80 100.00
Source: Primary data
Tables 28 it is known that out of 80 respondents, 48 respondents (60.00 per cent) feel
that product available in their choice of online store is normal, 29 respondents (36.00 per
Sl. No. Difficulty in network No. of Respondents Percentage
1. Yes 38 47.50
2. No 42 52.50
Total 80 100.00
Perception of College Students towards Online… R. Sorna Priya, M. Rifaya Meera & P. Vishwanath
Volume-II, Issue-XI December 2016 85
cent) feel it is superior to other online products and three respondents (3.80 per cent) feel it
is not superior to other online stores.
It is inferred that most of the respondents (60.00 per cent) feel that product available in
their choice of online store is normal.
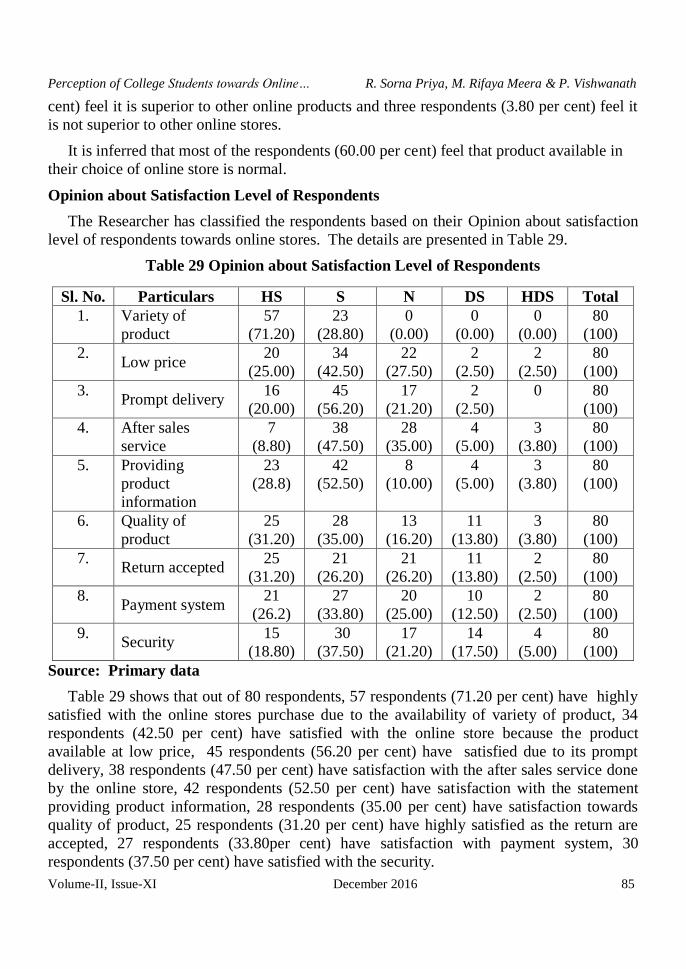
Opinion about Satisfaction Level of Respondents
The Researcher has classified the respondents based on their Opinion about satisfaction
level of respondents towards online stores. The details are presented in Table 29.
Table 29 Opinion about Satisfaction Level of Respondents
Source: Primary data
Table 29 shows that out of 80 respondents, 57 respondents (71.20 per cent) have highly
satisfied with the online stores purchase due to the availability of variety of product, 34
respondents (42.50 per cent) have satisfied with the online store because the product
available at low price, 45 respondents (56.20 per cent) have satisfied due to its prompt
delivery, 38 respondents (47.50 per cent) have satisfaction with the after sales service done
by the online store, 42 respondents (52.50 per cent) have satisfaction with the statement
providing product information, 28 respondents (35.00 per cent) have satisfaction towards
quality of product, 25 respondents (31.20 per cent) have highly satisfied as the return are
accepted, 27 respondents (33.80per cent) have satisfaction with payment system, 30
respondents (37.50 per cent) have satisfied with the security.
Sl. No. Particulars HS S N DS HDS Total
1. Variety of
product
57
(71.20)
23
(28.80)
0
(0.00)
0
(0.00)
0
(0.00)
80
(100)
2. Low price
20
(25.00)
34
(42.50)
22
(27.50)
2
(2.50)
2
(2.50)
80
(100)
3. Prompt delivery
16
(20.00)
45
(56.20)
17
(21.20)
2
(2.50)
0 80
(100)
4. After sales
service
7
(8.80)
38
(47.50)
28
(35.00)
4
(5.00)
3
(3.80)
80
(100)
5. Providing
product
information
23
(28.8)
42
(52.50)
8
(10.00)
4
(5.00)
3
(3.80)
80
(100)
6. Quality of
product
25
(31.20)
28
(35.00)
13
(16.20)
11
(13.80)
3
(3.80)
80
(100)
7. Return accepted
25
(31.20)
21
(26.20)
21
(26.20)
11
(13.80)
2
(2.50)
80
(100)
8. Payment system
21
(26.2)
27
(33.80)
20
(25.00)
10
(12.50)
2
(2.50)
80
(100)
9. Security
15
(18.80)
30
(37.50)
17
(21.20)
14
(17.50)
4
(5.00)
80
(100)

Perception of College Students towards Online… R. Sorna Priya, M. Rifaya Meera & P. Vishwanath
Volume-II, Issue-XI December 2016 86
Test of Hypothesis – Application of Chi-Square Test
H 1: “There is no association between age and preference for online stores”
Table 30 Analysis of age of the Respondents and Preference for online stores
Source: Computed Data
Table 31 Chi-Square Tests Result
Value Df Asymp. Sig. (2-sided)
Pearson Chi-Square 17.885a 15 0.269
Likelihood Ratio 21.087 15 0.134
Linear-by-Linear
Association 0.699 1 0.403
N of Valid Cases 80
a. 19 cells (79.20%) have expected count less than 5. The minimum expected count is
.19.
Source: SPSS Result
From the table 31, it is found that the significant value of the chi-square value of
(17.885) for the 15 degrees of freedom at 5% level of significance (0.269). Calculated value
is greater than the table value. So the null hypothesis is accepted. Hence, there is no
significant association between age of the respondents and preference for online stores.
H 2: There is no relationship between educational qualification and type of product
purchased through online stores.
Age Amazon Flip Kart Snapdeal Quiker OLX.in Myntra Total
17 years to
20 years
1
(1.50)
12
(11.50)
6
(4.80)
0
(0.80)
0
(0.80)
1
(0.80)
20
20.00
21 years to
23 years
3
(2.50)
18
(19.00)
9
(7.80)
3
(1.20)
0
(1.20)
0
(1.20)
33
33.00
24 years to
26 years
2
(1.60)
12
(12.60)
4
(5.20)
0
(0.80)
2
(0.80)
2
(0.80)
22
22.00
Above 26
years
0
(0.40)
4
(2.90)
0
(1.20)
0
(0.20)
1
(0.20)
0
(0.20)
5
5.00
Perception of College Students towards Online… R. Sorna Priya, M. Rifaya Meera & P. Vishwanath
Volume-II, Issue-XI December 2016 87
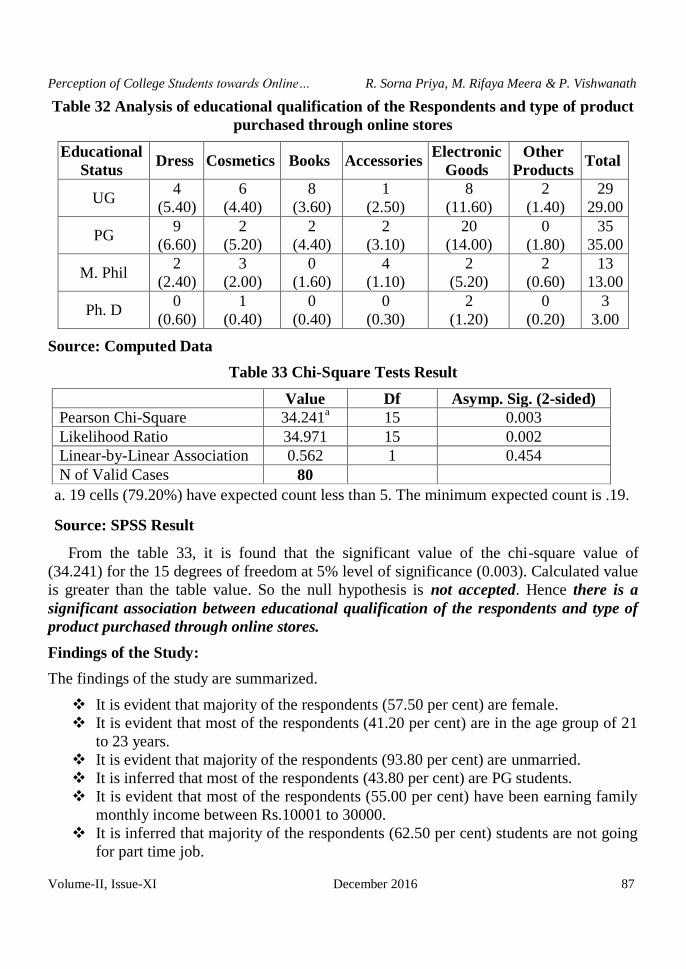
Table 32 Analysis of educational qualification of the Respondents and type of product
purchased through online stores
Educational
Status Dress Cosmetics Books Accessories
Electronic
Goods
Other
Products Total
UG 4
(5.40)
6
(4.40)
8
(3.60)
1
(2.50)
8
(11.60)
2
(1.40)
29
29.00
PG 9
(6.60)
2
(5.20)
2
(4.40)
2
(3.10)
20
(14.00)
0
(1.80)
35
35.00
M. Phil 2
(2.40)
3
(2.00)
0
(1.60)
4
(1.10)
2
(5.20)
2
(0.60)
13
13.00
Ph. D 0
(0.60)
1
(0.40)
0
(0.40)
0
(0.30)
2
(1.20)
0
(0.20)
3
3.00
Source: Computed Data
Table 33 Chi-Square Tests Result
Value Df Asymp. Sig. (2-sided)
Pearson Chi-Square 34.241a 15 0.003
Likelihood Ratio 34.971 15 0.002
Linear-by-Linear Association 0.562 1 0.454
N of Valid Cases 80
a. 19 cells (79.20%) have expected count less than 5. The minimum expected count is .19.
Source: SPSS Result
From the table 33, it is found that the significant value of the chi-square value of
(34.241) for the 15 degrees of freedom at 5% level of significance (0.003). Calculated value
is greater than the table value. So the null hypothesis is not accepted. Hence there is a
significant association between educational qualification of the respondents and type of
product purchased through online stores.
Findings of the Study:
The findings of the study are summarized.
It is evident that majority of the respondents (57.50 per cent) are female.
It is evident that most of the respondents (41.20 per cent) are in the age group of 21
to 23 years.
It is evident that majority of the respondents (93.80 per cent) are unmarried.
It is inferred that most of the respondents (43.80 per cent) are PG students.
It is evident that most of the respondents (55.00 per cent) have been earning family
monthly income between Rs.10001 to 30000.
It is inferred that majority of the respondents (62.50 per cent) students are not going
for part time job.
Perception of College Students towards Online… R. Sorna Priya, M. Rifaya Meera & P. Vishwanath
Volume-II, Issue-XI December 2016 88
It is understood that most of the respondents (26.67 per cent) are equally distributed
as the sales person, teachers, and other category like online business, outsourcing.
It is evident that most of the respondents (40.00 per cent) earn between Rs.3000 to
Rs.5000 from their part time job.
It is evident that most of the respondents (32.50 per cent) preferring online store as it
save time and due to availability of products at low price.
It is inferred that majority of the respondents (52.50 per cent) have come to know
about online store through their family & relatives.
It is evident that majority of the respondents (57.50 per cent) are preferring Flip Kart
to purchase through online store.
It is evident that majority of the respondents (40.00 per cent) use to purchase
electronic goods through online store.
It is the finding of the study that majority (72.68 per cent) of the respondents
preferable for Flip kart.
It is evident that most of the respondents (58.75 per cent) have not preferred a
particular online store always.
It is evident that most of the respondents (39.80 per cent) are reason for preferring a
particular online store due to its best service.
It is inferred that majority of the respondents (40.00 per cent) use to purchase
through online stores when need arises.
It is evident that most of the respondents (65.00 per cent) known about offers and
discounts only through advertisement.
It is evident that most of the respondents (48.80 per cent) prefer for buy 1 get 1
offer.
It is evident that most of the respondents (66.20 per cent) are spending money below
Rs. 1000 in online stores.
It is evident that most of the respondents (62.50.16 per cent) pay the cash after they
receive the goods.
It is inferred that majority of the respondents (63.80 per cent) felt that fraudulent
activities are committed by online stores.
It is evident that most of the respondents (86.27 per cent) have received damaged
goods from online stores against their orders.
It is evident that majority of the respondents (70.00 per cent) have not taken any
action against fraudulent activity.
It is evident that most of the respondents (52.50 per cent) have not met with network
problem.
It is inferred that most of the respondents (60.00 per cent) feel that product available
in their choice of online store is normal.
The finding of the study is majority (71.20 per cent) of the respondents have highly
satisfied with the online stores purchase due to the availability of variety of product.
There is no significant association between age of the respondents and preference
for online stores.
Perception of College Students towards Online… R. Sorna Priya, M. Rifaya Meera & P. Vishwanath
Volume-II, Issue-XI December 2016 89
There is a significant association between educational qualification of the
respondents and type of product purchased through online stores.
Recommendations:
Online stores can provide more information about the product and service
availability which will improve the knowledge of the customers and help them shop
easily.
Formalities & forms to be filled during payment can be minimized, by recording the
personal details of the customers. So that when a customer gives his name or mail id
for shopping his personal information will appear by default.
They should try to reduce the cost and introduce many cheap plans to make it
affordable to those who cannot afford it which will in turn help them to increase
their customers.
Online companies must focus on providing extra facilities like goods exchange
policy to online shoppers so that shoppers will have easy to purchase products over
online.
Most of the educated people are familiar with online shopping and so they can try
focusing on people who are less educated by creating awareness and educating
them.
Banking should promote Debit card, Credit card facility in online shopping.
Conclusion: The study investigates the determinants that are responsible for choosing of
the online purchasing portals by the consumers whenever they decide for purchasing
products. Furthermore, the study was taken ahead with the conclusions drawn from the
empirical survey and developing innovations important for the online purchasing portals.
The empirical results show that consumers preferred to accept on line purchasing portals for
their purchases whenever they perceived that the determinants like product preference
through the respective purchasing portals, variety options available in the portals and
convenience of online shopping and in accordance to their preferences. The customers also
feel that it is very easy to purchase goods online rather than to move shop to shop. From the
research it can be set that in today’s fast moving world people don’t have time to travel to
buy goods and other factors like distance, traffic make it even more difficult for a person to
manually go to shops and buy goods and hence people have started using online shopping
for purchasing and because of payment modes like cash on delivery has rapidly increased
the number of the online shoppers and this list will keep on increasing. The project reveals
that mainly college students prefer purchasing on online among the students Flip kart is
preferred by majority of the students because of its best service. Most of the customers are
satisfied by online shopping, but the only hinder is that they are not fully secured.
Government has to improve security laws related to online websites so that the online
customers feel secured in case of debit card, credit card or online payments. This research
shows that online shopping is having very bright future in India. Perception towards online
shopping is getting better in India.
Perception of College Students towards Online… R. Sorna Priya, M. Rifaya Meera & P. Vishwanath
Volume-II, Issue-XI December 2016 90
Reference:
Kanwal Gurleen, “Consumer’s Perception Towards Online Shopping- The Case of
Punjab”, International Journal of Management & Information Technology, Volume
1, No 1, May, 2012, pp.1-6.
Dr. Rakshita Puranik and Dr. Alok Bansal, “A Study of Internet Users' Perception
towards E-shopping”, Pacific Business Review, Volume 6, Issue 9, March 2014,
pp.37-44.
Zia Ul Haq, “Perception towards Online Shopping: An Empirical Study of Indian
Consumers”, Abhinav National Monthly Refereed Journal of Research in Commerce
& Management, Volume No.1, Issue No.8, pp.9-22.
Dr. A. T. Jaganathan, AStudyOnCustomerPerceptionTowardsOnline Shopping,
Namakkal, “International Education & Research Journal [IERJ]”, Vol.2, Issue: 7,
July 2016, pp. 65-66.
Meharaj Banu , “A Study On Customer Preference Towards Online Shopping With
Special Reference To Tiruchirappall District”, International Journal of Advanced
Research in Management and Social Sciences, Vol. 3, No. 5, May 2014, pp. 205-
214.
Vidya shree DV, “A Comparative study on consumer Preferences towards online
retail marketers-with special reference to Flipkart, Jabong, Amazon, Snapdeal
Myntra and fashion and you”, International Journal of Applied Research, 1(10), pp.
1021-1026.
Dr. R. Shanthi, “Consumers’ Perception on Online Shopping”, Journal of Marketing
and Consumer Research, Vol.13, 2015, pp. 14-20.