Embed Size (px)
Citation preview
PEER-REVIEWED REVIEW ARTICLE bioresources.com
Pereira (2015). “Rationale of cork properties,” BioResources 10(3), 6207-6229. 6207
The Rationale behind Cork Properties: A Review of Structure and Chemistry
Helena Pereira
Cork is a natural cellular material of biological origin with a combination of properties that make it suited for worldwide use as a wine sealant and insulation material. Cork has low density, is buoyant, is not very permeable to fluids, has a low thermal coefficient, exhibits elasticity and deformation without fracturing under compression, and has considerable durability. Such characteristics result from the features of its cellular structure, primarily its cell dimensions and topology, and from the chemical composition of the cell wall. The characteristics of the two main chemical components (suberin and lignin, which represent 53% and 26%, respectively, of the cell wall) have been analyzed. The limits of natural variation and their impacts on cork properties are discussed and used to define the material as “cork”.
Keywords: Cork; Quercus suber; Suberin; Lignin; Cellular structure; Compression; Properties
Contact information: Centro de Estudos Florestais, Instituto Superior de Agronomia, Universidade de
Lisboa, Tapada da Ajuda, 1349-017, Lisboa, Portugal; E-mail: [email protected]
INTRODUCTION
Cork is a natural material used worldwide as the sealant for wine bottles. It has been
used to “cork” glass bottles since their emergence in the beginning of the seventeenth
century, and it sealed ceramic amphora many centuries earlier (Taber 2007; Pereira 2007).
Cork is of biological origin and occurs in the periderm of tree barks. It forms a
protective barrier (designated phellem in plant anatomy) at the interface of the innermost
living tissues and the exterior (Evert and Eichhorn 2006). Protection against temperature
variation, water loss, fire, and biological attack are provided by cork as a result of its
specialized cellular structure and chemical composition.
The properties of cork attracted attention long ago. It is a light material with very
low permeability to liquids and gases that demonstrates buoyancy, can withstand
compressive deformation without fracture, and has low heat transfer properties (Fortes et
al. 2004; Pereira 2007). Cork has been used in various applications, including floating
devices, sealing products, and insulation, energy absorption, and surfacing materials. The
aesthetic character of cork in combination with its properties also led to recent applications
in design products, e.g. for outdoor and indoor furniture, household, and personal use items.
The use of cork as a biosorbent was also researched in relation to heavy metals (Chubar et
al. 2004; Sen et al. 2012b), polycyclic aromatic hydrocarbons (Olivella et al. 2011), and
oil (Pintor et al. 2013). Other applications of cork, such as composites, are reviewed in
Silva et al. (2005) and Pereira (2007).
Cork is the raw material for a dedicated industrial chain of great economic
importance. Commercial cork is produced in the western Mediterranean regions from the
cork oak (Quercus suber L.) through the periodic removal of the tree bark periderm under
a sustainable exploitation management system throughout the tree’s lifetime (Pereira and
PEER-REVIEWED REVIEW ARTICLE bioresources.com
Pereira (2015). “Rationale of cork properties,” BioResources 10(3), 6207-6229. 6208
Tomé 2004). Cork oak forests are usually multifunctional systems that provide a rich array
of environmental services and biodiversity that sustain the favorable ecological footprint
of cork.
Wine stoppers are the iconic product derived from cork, but other well-known
applications in insulation and surfacing consume most of the industrial cork side-streams
and wastes, making the overall use of cork a highly efficient raw material utilization
process. Some novel applications have received considerable attention recently,
particularly those associated with its use in buildings or events that have received large
media coverage, such as in the Sagrada Familia cathedral in Barcelona, the Serpentine
Gallery Pavilion in London (2012), or the Portuguese pavilion in the World Exhibition of
Shanghai (2010).
The cellular structure of cork was studied in the early days of experimental research
(Hooke 1665) and, later on, as a bridge to understand the material’s properties (Gibson et
al. 1981; Pereira et al. 1987). Its chemical composition was first studied long ago
(Brugnatelli 1787), but is a subject still under extensive research (as reviewed in Pereira
2007). Its structural features, chemical composition, and the molecular structures of the
components of cork are the keys to better understanding the material’s properties. They are
the rationale behind such important performance features as the oxygen ingress into corked
wine bottles and the compressive behavior underlying the bottling and maintenance of cork
stoppers in the bottleneck.
This review paper presents cork’s anatomy and chemistry, primarily regarding the
characteristics of its two main components (suberin and lignin), that underlie the different
properties that make cork special. The limits of natural variation and their impact on cork
behavior are also discussed.
CELLULAR STRUCTURE OF CORK
Cork is a foam with closed cells. Its structural characteristics were briefly described
by Gibson et al. (1981) and discussed in detail by Pereira et al. (1987). Its formation and
development were characterized by Graça and Pereira (2004). Cork cells are formed by the
phellogen, a meristematic layer (i.e., with cell division capability) that produces the bark
periderm.
The cork tissue is compact, without intercellular voids, and with a regular
honeycomb arrangement. This biological tissue is homogeneous with regard to cell type:
the cells are dead parenchymateous cells with hollow, air-filled interiors. The cells are
prismatic, hexagonal on average, and are stacked base-to-base in an alignment oriented in
the tree’s radial direction. All cells in one radial row derive from one phellogen mother-
cell: after cellular division, the cork cell differentiates and subsequently expands in the
radial direction. The cell rows are arranged parallel to each other with the prism bases in
staggered positions in adjacent rows.
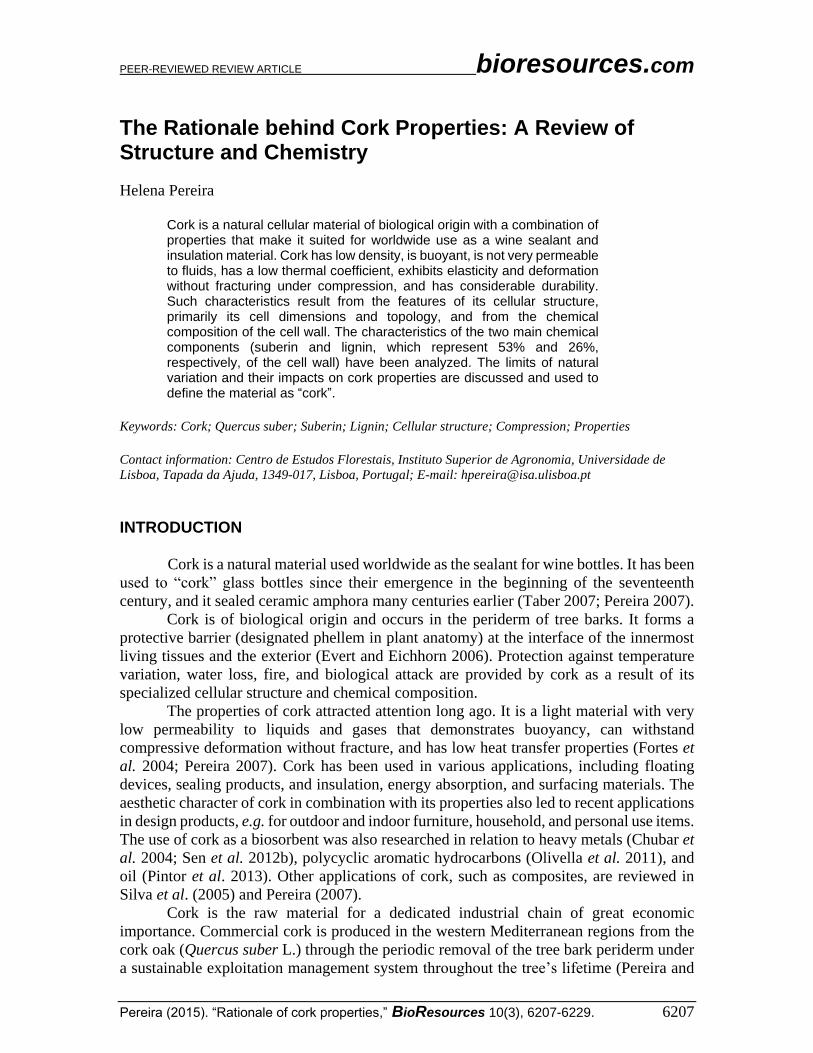
The cellular structure appears differently in the three main sections: in a radial
plane, as well as in a transverse plane, the 2-D arrangement is of a brick-layered type; in
the tangential plane, the cells appear hexagonal on average in a honeycomb arrangement
(Fig. 1). In spite of the different sectional layouts, the cells are topologically similar with
an average of six sides (Pereira et al. 1987). Geometrically, the tissue is axisymmetric, with
a symmetry axis along the prism’s height.
PEER-REVIEWED REVIEW ARTICLE bioresources.com
Pereira (2015). “Rationale of cork properties,” BioResources 10(3), 6207-6229. 6209
It must be noted that the description of the cork structure should use the terminology
of sections adopted by plant anatomy: the transverse section is the plane perpendicular to
the axial direction, the tangential section is perpendicular to the radial direction, and the
radial section is perpendicular to the tangential direction (see e.g. Pereira 2007).
The cells are small and have dimensions under those of synthetic foams. The area
of the prism base is 4 to 6 x 10⁻⁶ cm2 with a mean prism base edge of 13 to 15 m; prism
height is usually in the range of 30 to 40 m. The mean cell volume is approximately 2 x
10-8 cm3 and the number of cells per unit volume is 4 to 7 x 107 cm-3. The cell walls are
thin with thicknesses of 1 to 1.5 m. The solid mass volume fraction of the cork is therefore
very small, approximately 10%.
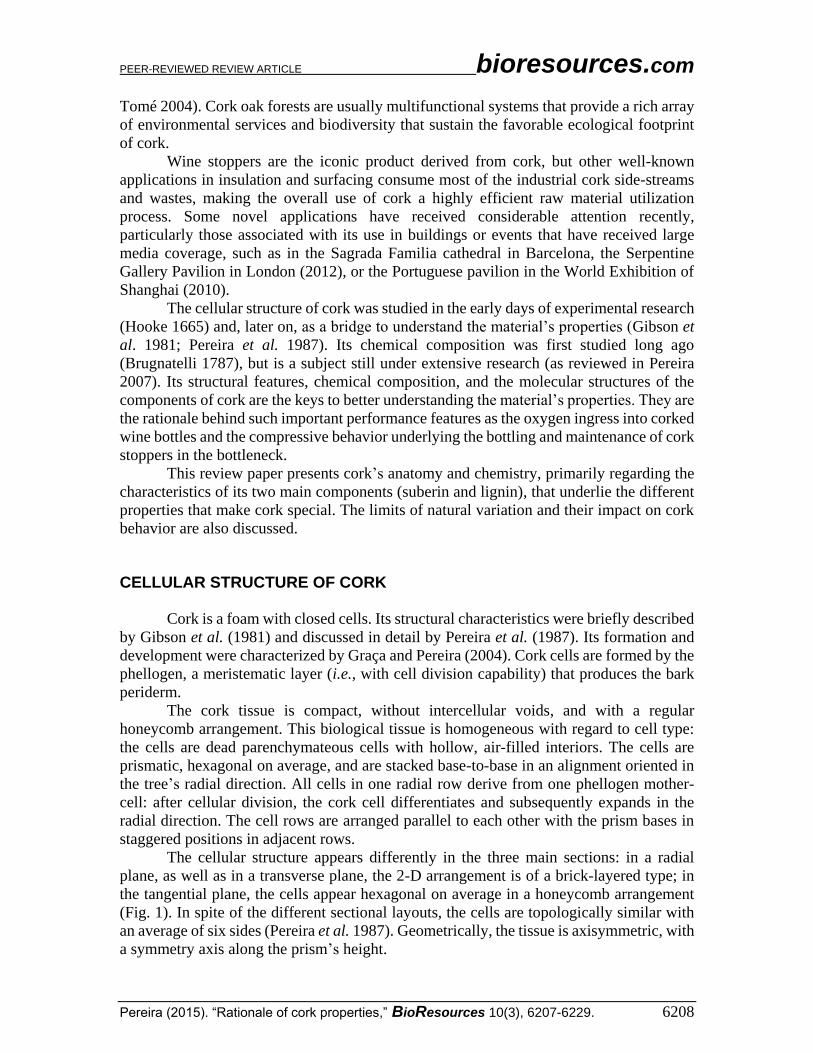
The solid mass of cork is concentrated in its cell walls. The thickness of the cell
walls is constant in the different directions, with similar values in the cell edges and faces
and only with a small enlargement because of rounding at face junctions (Fig. 2). There
are no microscopic openings (i.e., at the m level) in the walls for cell-to-cell connection
like the pits in wood cells. There are, however, minute, stuffed channels at the sub-
microscopic level that occasionally cross the cell walls (Fig. 2). These are termed the
plasmodesmata and are observable by transmission electron microscopy with a cross-
sectional diameter of approximately 100 nm. They are remnants of the connections
between the cells during division as used for cytoplasmatic exchanges (Teixeira and Pereira
2009).
Fig. 1. Structure of cork as observed by scanning electron microscopy in the three main sections: (left) tangential section, perpendicular to the tree’s radial direction; (middle) transverse section, perpendicular to the tree’s axial direction; and (right) radial section, the tree’s radial section
Fig. 2. Cross-section of the cell wall of cork as observed by transmission electron microscopy, showing one plasmodesma (right)
Despite the overall regularity of cork’s structure, it contains natural heterogeneity
given by the formation of the annual rings that represent the yearly growth rhythm of cork,
similar to what happens in wood. Cork formation stops in October or November and starts
a new growth season in April or May (Costa et al. 2002). The last few cells that are
PEER-REVIEWED REVIEW ARTICLE bioresources.com
Pereira (2015). “Rationale of cork properties,” BioResources 10(3), 6207-6229. 6210
produced in a year are called latecork cells and have a smaller prism height (10 to 15 m)
and thicker cell walls (2 to 3 m). In a cork annual ring, the number of latecork cells is
small (4 to 8 cells in one radial growth ring), while the so-called earlycork cells represent
about 40 to 200 cells in a row (Pereira et al. 1992). Although the cellular characteristics of
cork are largely dominated by earlycork (which represents 90 to 95% of the total volume),
the presence of the latecork layers, with their approximately 20% volume fraction,
influences the overall properties of cork.
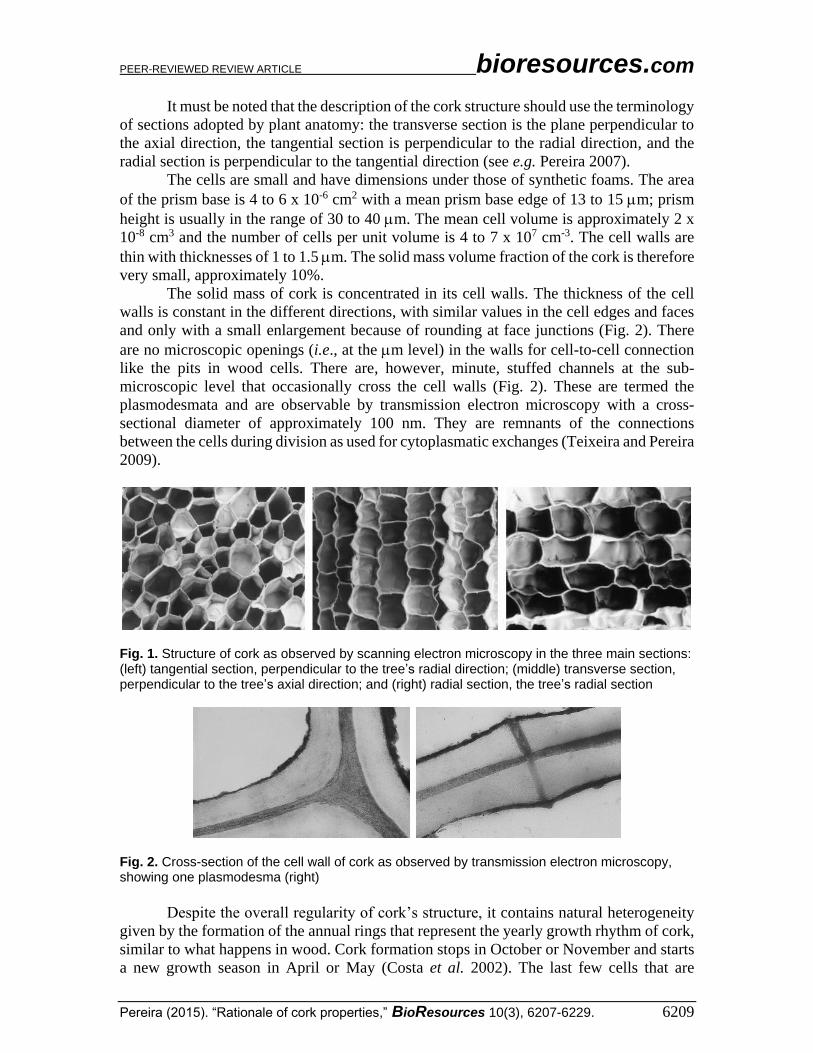
Another factor of the natural variation in cork cells is the undulation of their cell
walls. The lateral faces of the cell prisms are not straight and usually exhibit undulations,
often 2 per face, that run rather uniformly and parallel. This pattern varies, and stronger
undulations or corrugations can appear such that, in special cases, near cell collapse can
occur. This is often the case in the first cells formed in the early spring of a growth year as
these cells grow radially against the previous season’s latecork cells. Figure 3 shows an
example of the transition between two cork rings and of this type of undulation. The
capacity of the corrugation of cork cell walls without fracture is a consequence of the cell
wall’s chemical composition, as will be discussed.
Fig. 3. Transition between two annual growth rings (left) and a magnified view of the ring boundary region between earlycork cells of one year and latecork cells of the previous year
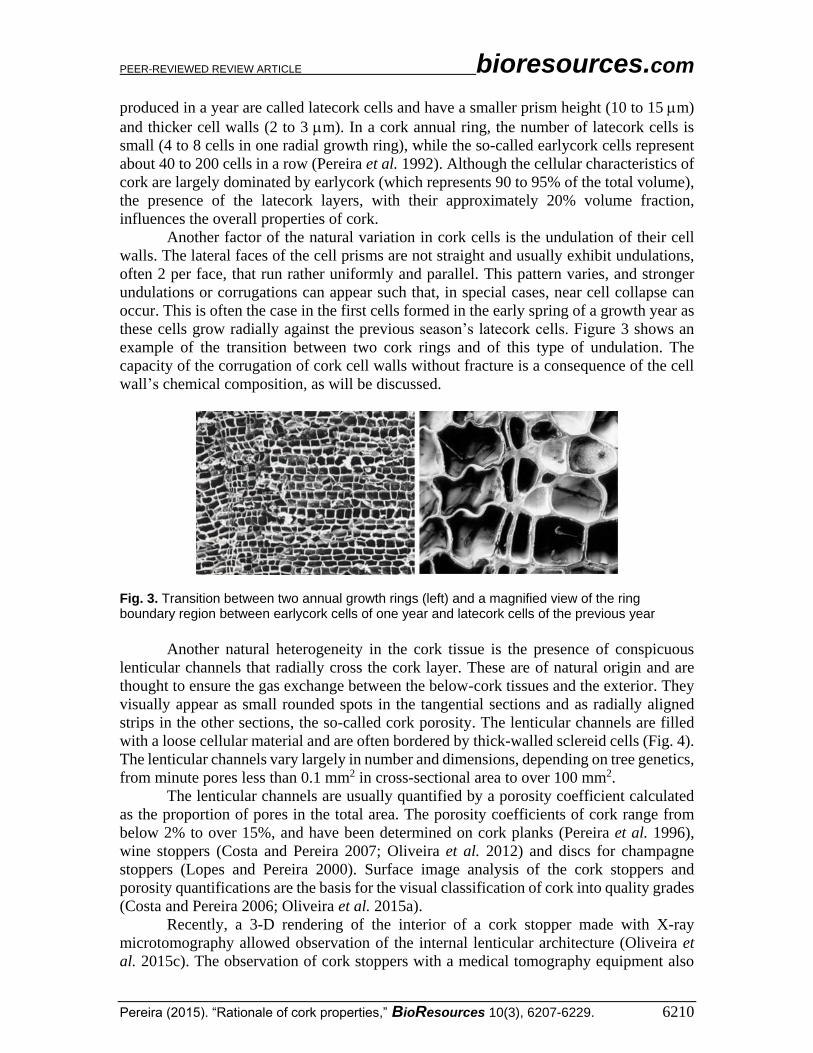
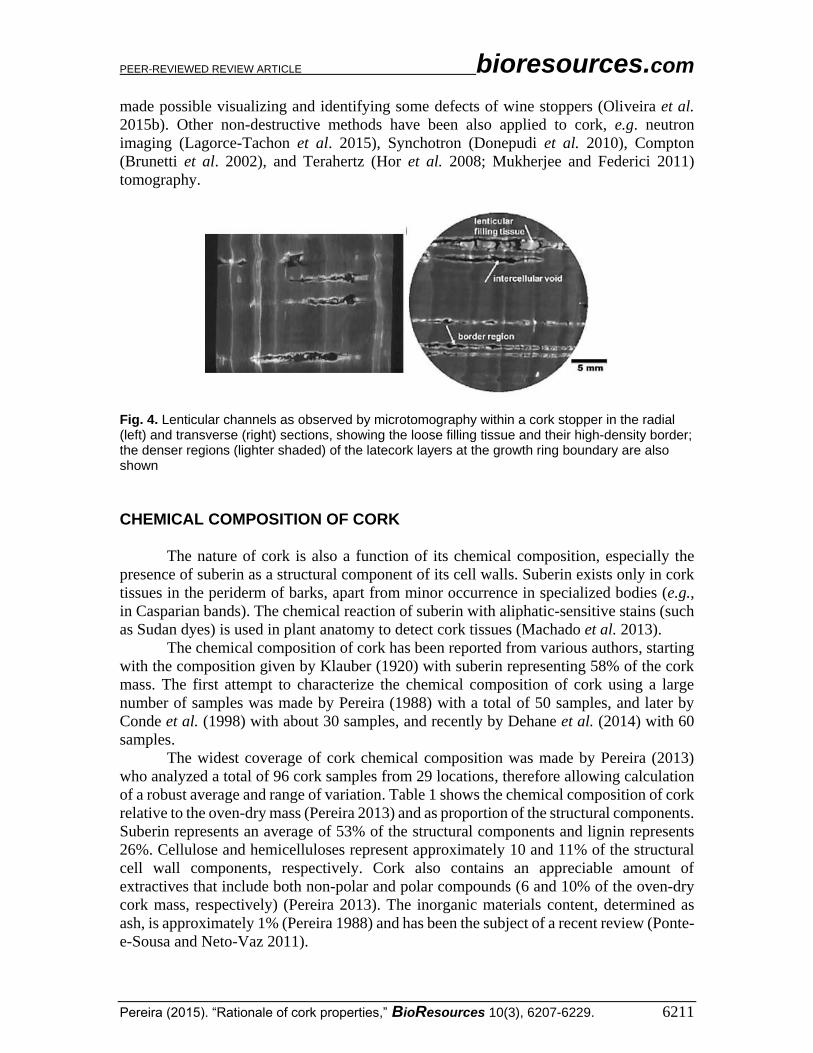
Another natural heterogeneity in the cork tissue is the presence of conspicuous
lenticular channels that radially cross the cork layer. These are of natural origin and are
thought to ensure the gas exchange between the below-cork tissues and the exterior. They
visually appear as small rounded spots in the tangential sections and as radially aligned
strips in the other sections, the so-called cork porosity. The lenticular channels are filled
with a loose cellular material and are often bordered by thick-walled sclereid cells (Fig. 4).
The lenticular channels vary largely in number and dimensions, depending on tree genetics,
from minute pores less than 0.1 mm2 in cross-sectional area to over 100 mm2.
The lenticular channels are usually quantified by a porosity coefficient calculated
as the proportion of pores in the total area. The porosity coefficients of cork range from
below 2% to over 15%, and have been determined on cork planks (Pereira et al. 1996),
wine stoppers (Costa and Pereira 2007; Oliveira et al. 2012) and discs for champagne
stoppers (Lopes and Pereira 2000). Surface image analysis of the cork stoppers and
porosity quantifications are the basis for the visual classification of cork into quality grades
(Costa and Pereira 2006; Oliveira et al. 2015a).
Recently, a 3-D rendering of the interior of a cork stopper made with X-ray
microtomography allowed observation of the internal lenticular architecture (Oliveira et
al. 2015c). The observation of cork stoppers with a medical tomography equipment also
PEER-REVIEWED REVIEW ARTICLE bioresources.com
Pereira (2015). “Rationale of cork properties,” BioResources 10(3), 6207-6229. 6211
made possible visualizing and identifying some defects of wine stoppers (Oliveira et al.
2015b). Other non-destructive methods have been also applied to cork, e.g. neutron
imaging (Lagorce-Tachon et al. 2015), Synchotron (Donepudi et al. 2010), Compton
(Brunetti et al. 2002), and Terahertz (Hor et al. 2008; Mukherjee and Federici 2011)
tomography.
Fig. 4. Lenticular channels as observed by microtomography within a cork stopper in the radial (left) and transverse (right) sections, showing the loose filling tissue and their high-density border; the denser regions (lighter shaded) of the latecork layers at the growth ring boundary are also shown
CHEMICAL COMPOSITION OF CORK
The nature of cork is also a function of its chemical composition, especially the
presence of suberin as a structural component of its cell walls. Suberin exists only in cork
tissues in the periderm of barks, apart from minor occurrence in specialized bodies (e.g.,
in Casparian bands). The chemical reaction of suberin with aliphatic-sensitive stains (such
as Sudan dyes) is used in plant anatomy to detect cork tissues (Machado et al. 2013).
The chemical composition of cork has been reported from various authors, starting
with the composition given by Klauber (1920) with suberin representing 58% of the cork
mass. The first attempt to characterize the chemical composition of cork using a large
number of samples was made by Pereira (1988) with a total of 50 samples, and later by
Conde et al. (1998) with about 30 samples, and recently by Dehane et al. (2014) with 60
samples.
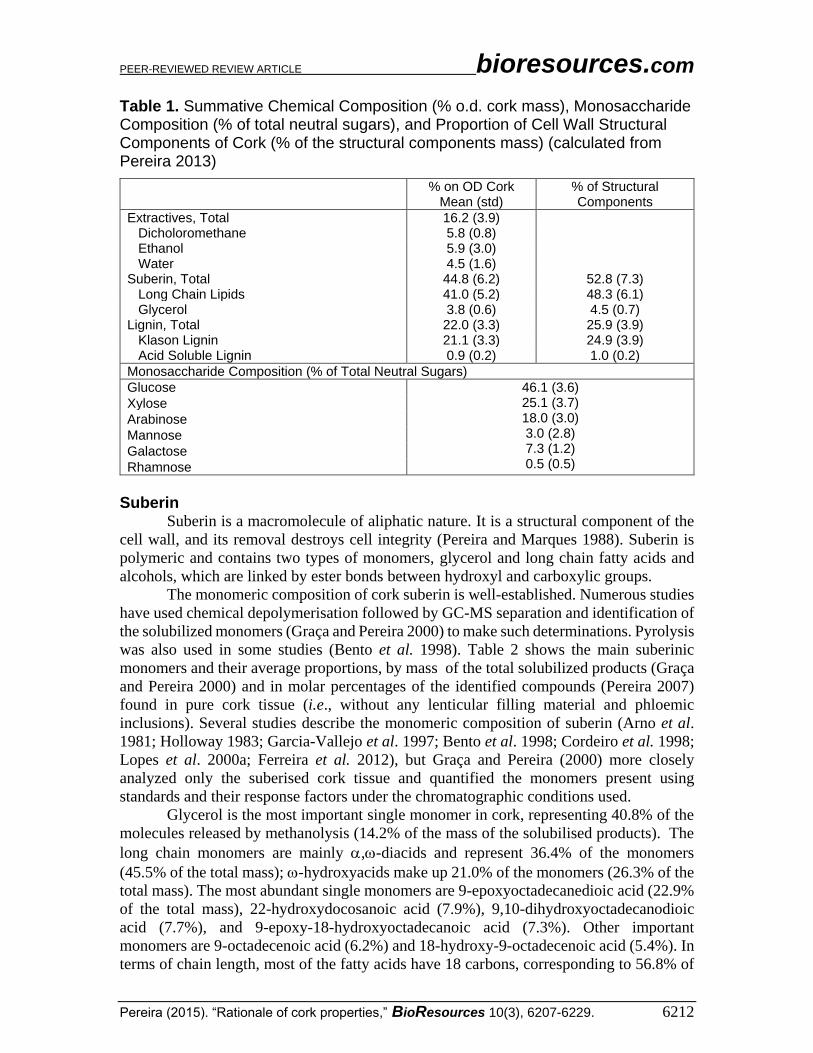
The widest coverage of cork chemical composition was made by Pereira (2013)
who analyzed a total of 96 cork samples from 29 locations, therefore allowing calculation
of a robust average and range of variation. Table 1 shows the chemical composition of cork
relative to the oven-dry mass (Pereira 2013) and as proportion of the structural components.
Suberin represents an average of 53% of the structural components and lignin represents
26%. Cellulose and hemicelluloses represent approximately 10 and 11% of the structural
cell wall components, respectively. Cork also contains an appreciable amount of
extractives that include both non-polar and polar compounds (6 and 10% of the oven-dry
cork mass, respectively) (Pereira 2013). The inorganic materials content, determined as
ash, is approximately 1% (Pereira 1988) and has been the subject of a recent review (Ponte-
e-Sousa and Neto-Vaz 2011).
PEER-REVIEWED REVIEW ARTICLE bioresources.com
Pereira (2015). “Rationale of cork properties,” BioResources 10(3), 6207-6229. 6212
Table 1. Summative Chemical Composition (% o.d. cork mass), Monosaccharide Composition (% of total neutral sugars), and Proportion of Cell Wall Structural Components of Cork (% of the structural components mass) (calculated from Pereira 2013)
% on OD Cork Mean (std)
% of Structural Components
Extractives, Total 16.2 (3.9) Dicholoromethane 5.8 (0.8) Ethanol 5.9 (3.0) Water 4.5 (1.6) Suberin, Total 44.8 (6.2) 52.8 (7.3) Long Chain Lipids 41.0 (5.2) 48.3 (6.1) Glycerol 3.8 (0.6) 4.5 (0.7) Lignin, Total 22.0 (3.3) 25.9 (3.9) Klason Lignin 21.1 (3.3) 24.9 (3.9) Acid Soluble Lignin 0.9 (0.2) 1.0 (0.2)
Monosaccharide Composition (% of Total Neutral Sugars)
Glucose 46.1 (3.6) 25.1 (3.7) 18.0 (3.0) 3.0 (2.8) 7.3 (1.2) 0.5 (0.5)
Xylose
Arabinose
Mannose
Galactose
Rhamnose
Suberin Suberin is a macromolecule of aliphatic nature. It is a structural component of the
cell wall, and its removal destroys cell integrity (Pereira and Marques 1988). Suberin is
polymeric and contains two types of monomers, glycerol and long chain fatty acids and
alcohols, which are linked by ester bonds between hydroxyl and carboxylic groups.
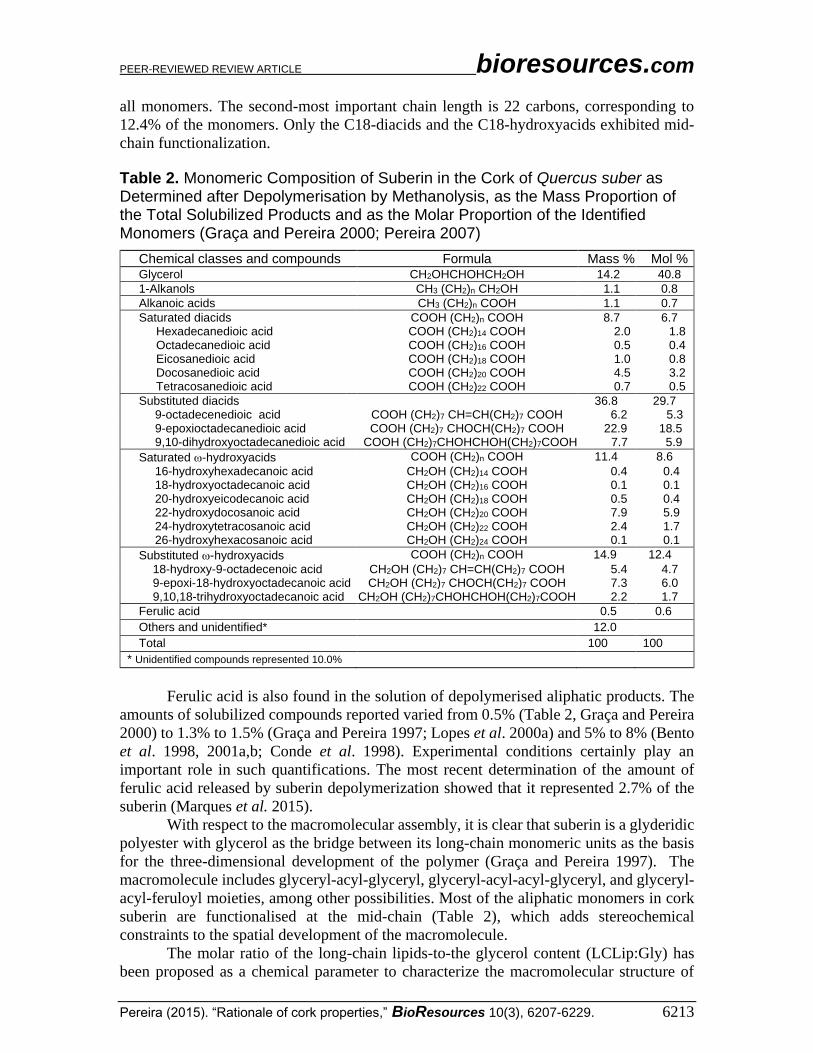
The monomeric composition of cork suberin is well-established. Numerous studies
have used chemical depolymerisation followed by GC-MS separation and identification of
the solubilized monomers (Graça and Pereira 2000) to make such determinations. Pyrolysis
was also used in some studies (Bento et al. 1998). Table 2 shows the main suberinic
monomers and their average proportions, by mass of the total solubilized products (Graça
and Pereira 2000) and in molar percentages of the identified compounds (Pereira 2007)
found in pure cork tissue (i.e., without any lenticular filling material and phloemic
inclusions). Several studies describe the monomeric composition of suberin (Arno et al.
1981; Holloway 1983; Garcia-Vallejo et al. 1997; Bento et al. 1998; Cordeiro et al. 1998;
Lopes et al. 2000a; Ferreira et al. 2012), but Graça and Pereira (2000) more closely
analyzed only the suberised cork tissue and quantified the monomers present using
standards and their response factors under the chromatographic conditions used.
Glycerol is the most important single monomer in cork, representing 40.8% of the
molecules released by methanolysis (14.2% of the mass of the solubilised products). The
long chain monomers are mainly ,-diacids and represent 36.4% of the monomers
(45.5% of the total mass); -hydroxyacids make up 21.0% of the monomers (26.3% of the
total mass). The most abundant single monomers are 9-epoxyoctadecanedioic acid (22.9%
of the total mass), 22-hydroxydocosanoic acid (7.9%), 9,10-dihydroxyoctadecanodioic
acid (7.7%), and 9-epoxy-18-hydroxyoctadecanoic acid (7.3%). Other important
monomers are 9-octadecenoic acid (6.2%) and 18-hydroxy-9-octadecenoic acid (5.4%). In
terms of chain length, most of the fatty acids have 18 carbons, corresponding to 56.8% of
PEER-REVIEWED REVIEW ARTICLE bioresources.com
Pereira (2015). “Rationale of cork properties,” BioResources 10(3), 6207-6229. 6213
all monomers. The second-most important chain length is 22 carbons, corresponding to
12.4% of the monomers. Only the C18-diacids and the C18-hydroxyacids exhibited mid-
chain functionalization.
Table 2. Monomeric Composition of Suberin in the Cork of Quercus suber as Determined after Depolymerisation by Methanolysis, as the Mass Proportion of the Total Solubilized Products and as the Molar Proportion of the Identified Monomers (Graça and Pereira 2000; Pereira 2007)
Chemical classes and compounds Formula Mass % Mol % Glycerol CH2OHCHOHCH2OH 14.2 40.8
1-Alkanols CH3 (CH2)n CH2OH 1.1 0.8
Alkanoic acids CH3 (CH2)n COOH 1.1 0.7
Saturated diacids COOH (CH2)n COOH 8.7 6.7 Hexadecanedioic acid COOH (CH2)14 COOH 2.0 1.8 Octadecanedioic acid COOH (CH2)16 COOH 0.5 0.4 Eicosanedioic acid COOH (CH2)18 COOH 1.0 0.8 Docosanedioic acid COOH (CH2)20 COOH 4.5 3.2 Tetracosanedioic acid COOH (CH2)22 COOH 0.7 0.5
Substituted diacids 36.8 29.7 9-octadecenedioic acid COOH (CH2)7 CH=CH(CH2)7 COOH 6.2 5.3 9-epoxioctadecanedioic acid COOH (CH2)7 CHOCH(CH2)7 COOH 22.9 18.5 9,10-dihydroxyoctadecanedioic acid COOH (CH2)7CHOHCHOH(CH2)7COOH 7.7 5.9
Saturated -hydroxyacids COOH (CH2)n COOH 11.4 8.6
16-hydroxyhexadecanoic acid CH2OH (CH2)14 COOH 0.4 0.4 18-hydroxyoctadecanoic acid CH2OH (CH2)16 COOH 0.1 0.1 20-hydroxyeicodecanoic acid CH2OH (CH2)18 COOH 0.5 0.4 22-hydroxydocosanoic acid CH2OH (CH2)20 COOH 7.9 5.9 24-hydroxytetracosanoic acid CH2OH (CH2)22 COOH 2.4 1.7 26-hydroxyhexacosanoic acid CH2OH (CH2)24 COOH 0.1 0.1
Substituted -hydroxyacids COOH (CH2)n COOH 14.9 12.4
18-hydroxy-9-octadecenoic acid CH2OH (CH2)7 CH=CH(CH2)7 COOH 5.4 4.7 9-epoxi-18-hydroxyoctadecanoic acid CH2OH (CH2)7 CHOCH(CH2)7 COOH 7.3 6.0 9,10,18-trihydroxyoctadecanoic acid CH2OH (CH2)7CHOHCHOH(CH2)7COOH 2.2 1.7
Ferulic acid 0.5 0.6
Others and unidentified* 12.0
Total 100 100
* Unidentified compounds represented 10.0%
Ferulic acid is also found in the solution of depolymerised aliphatic products. The
amounts of solubilized compounds reported varied from 0.5% (Table 2, Graça and Pereira
2000) to 1.3% to 1.5% (Graça and Pereira 1997; Lopes et al. 2000a) and 5% to 8% (Bento
et al. 1998, 2001a,b; Conde et al. 1998). Experimental conditions certainly play an
important role in such quantifications. The most recent determination of the amount of
ferulic acid released by suberin depolymerization showed that it represented 2.7% of the
suberin (Marques et al. 2015).
With respect to the macromolecular assembly, it is clear that suberin is a glyderidic
polyester with glycerol as the bridge between its long-chain monomeric units as the basis
for the three-dimensional development of the polymer (Graça and Pereira 1997). The
macromolecule includes glyceryl-acyl-glyceryl, glyceryl-acyl-acyl-glyceryl, and glyceryl-
acyl-feruloyl moieties, among other possibilities. Most of the aliphatic monomers in cork
suberin are functionalised at the mid-chain (Table 2), which adds stereochemical
constraints to the spatial development of the macromolecule.
The molar ratio of the long-chain lipids-to-the glycerol content (LCLip:Gly) has
been proposed as a chemical parameter to characterize the macromolecular structure of
PEER-REVIEWED REVIEW ARTICLE bioresources.com
Pereira (2015). “Rationale of cork properties,” BioResources 10(3), 6207-6229. 6214
suberin because it may be associated with the proportion of LCLip-intermonomeric
linkages in the macromolecule (Pereira 2013). The average ratio was found to be 3.2.
The degree of polymerization is not known, although mild depolymerization
yielded solubilized fragments containing up to approximately 40 long-chain components
(Bento et al. 2001b). Similarly, suberin solubilization using ionic liquids allowed
researchers to obtain polymeric, film-forming suberin fragments (Ferreira et al. 2012,
2013; Garcia et al. 2014).
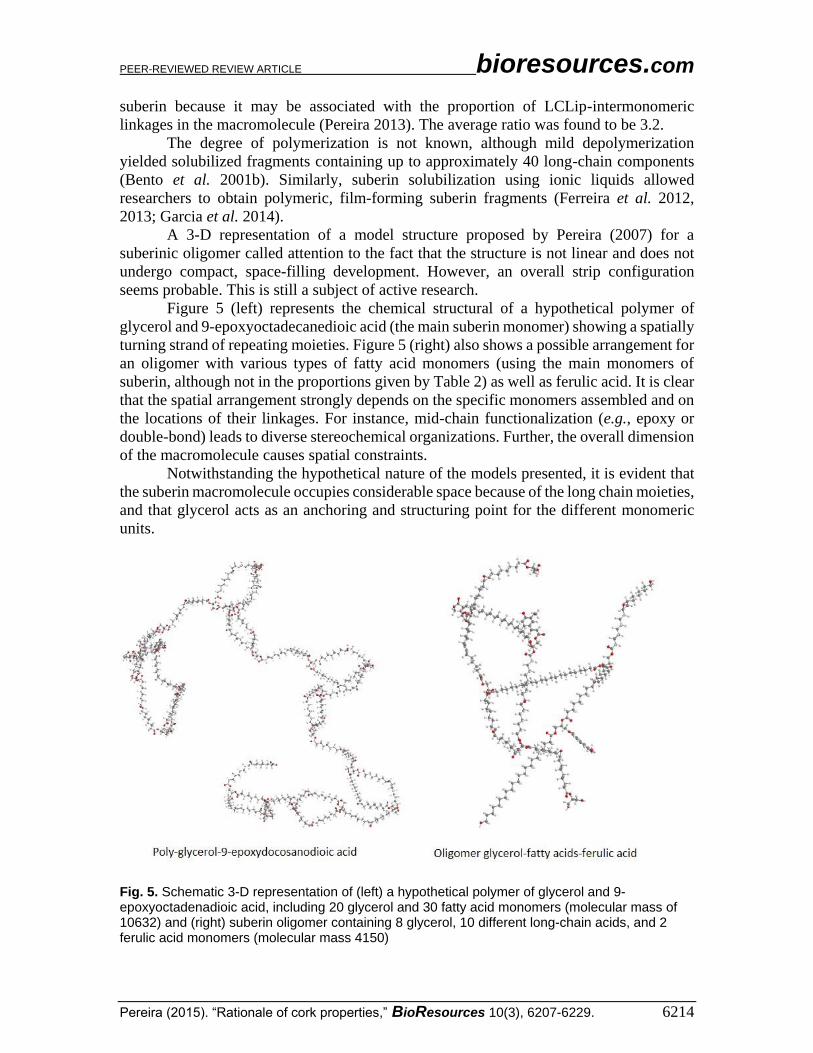
A 3-D representation of a model structure proposed by Pereira (2007) for a
suberinic oligomer called attention to the fact that the structure is not linear and does not
undergo compact, space-filling development. However, an overall strip configuration
seems probable. This is still a subject of active research.
Figure 5 (left) represents the chemical structural of a hypothetical polymer of
glycerol and 9-epoxyoctadecanedioic acid (the main suberin monomer) showing a spatially
turning strand of repeating moieties. Figure 5 (right) also shows a possible arrangement for
an oligomer with various types of fatty acid monomers (using the main monomers of
suberin, although not in the proportions given by Table 2) as well as ferulic acid. It is clear
that the spatial arrangement strongly depends on the specific monomers assembled and on
the locations of their linkages. For instance, mid-chain functionalization (e.g., epoxy or
double-bond) leads to diverse stereochemical organizations. Further, the overall dimension
of the macromolecule causes spatial constraints.
Notwithstanding the hypothetical nature of the models presented, it is evident that
the suberin macromolecule occupies considerable space because of the long chain moieties,
and that glycerol acts as an anchoring and structuring point for the different monomeric
units.
Fig. 5. Schematic 3-D representation of (left) a hypothetical polymer of glycerol and 9-epoxyoctadenadioic acid, including 20 glycerol and 30 fatty acid monomers (molecular mass of 10632) and (right) suberin oligomer containing 8 glycerol, 10 different long-chain acids, and 2 ferulic acid monomers (molecular mass 4150)
PEER-REVIEWED REVIEW ARTICLE bioresources.com
Pereira (2015). “Rationale of cork properties,” BioResources 10(3), 6207-6229. 6215
Lignin Lignin is the second most important structural cell wall component in cork (Table
1). Different from suberin, lignin is not specific to cork and is present in most of the
secondary cellular tissues of plants. It has been studied for many decades due to its
importance in wood pulping, and more recently, for biomass deconstruction (Achyuthan et
al. 2010).
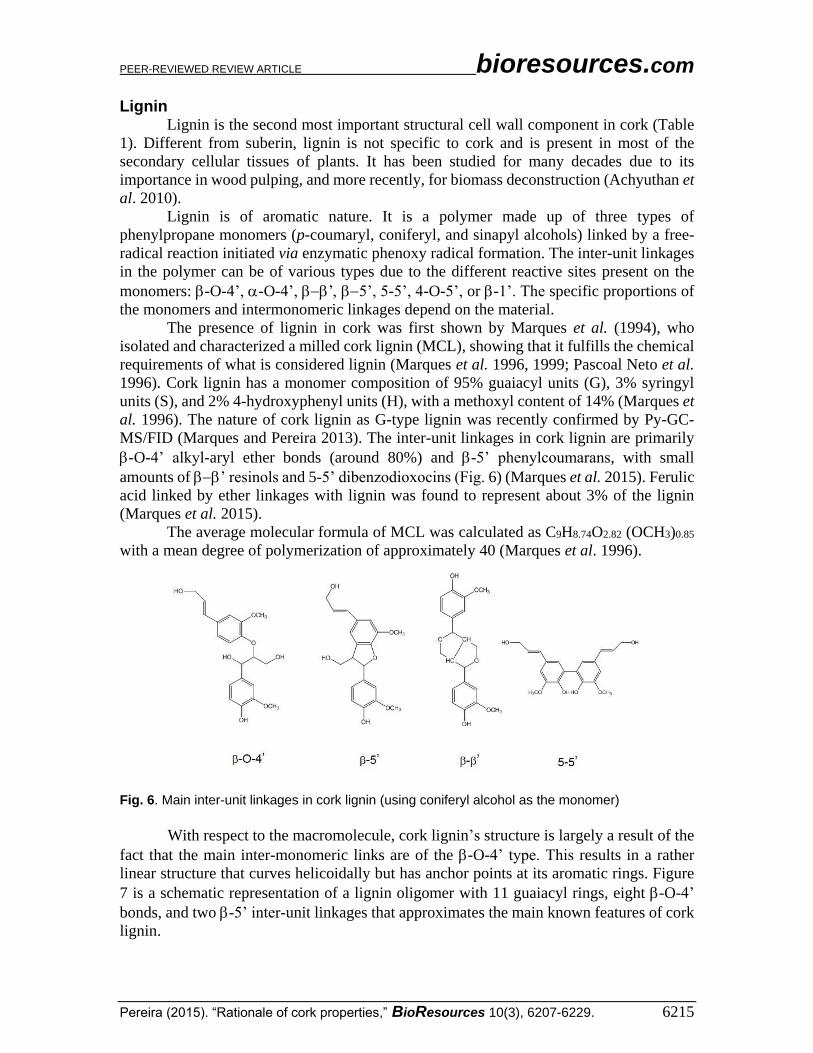
Lignin is of aromatic nature. It is a polymer made up of three types of
phenylpropane monomers (p-coumaryl, coniferyl, and sinapyl alcohols) linked by a free-
radical reaction initiated via enzymatic phenoxy radical formation. The inter-unit linkages
in the polymer can be of various types due to the different reactive sites present on the
monomers: -O-4’, -O-4’, ’5’, 5-5’, 4-O-5’, or -1’. The specific proportions of
the monomers and intermonomeric linkages depend on the material.
The presence of lignin in cork was first shown by Marques et al. (1994), who
isolated and characterized a milled cork lignin (MCL), showing that it fulfills the chemical
requirements of what is considered lignin (Marques et al. 1996, 1999; Pascoal Neto et al.
1996). Cork lignin has a monomer composition of 95% guaiacyl units (G), 3% syringyl
units (S), and 2% 4-hydroxyphenyl units (H), with a methoxyl content of 14% (Marques et
al. 1996). The nature of cork lignin as G-type lignin was recently confirmed by Py-GC-
MS/FID (Marques and Pereira 2013). The inter-unit linkages in cork lignin are primarily
-O-4’ alkyl-aryl ether bonds (around 80%) and -5’ phenylcoumarans, with small
amounts of ’ resinols and 5-5’ dibenzodioxocins (Fig. 6) (Marques et al. 2015). Ferulic
acid linked by ether linkages with lignin was found to represent about 3% of the lignin
(Marques et al. 2015).
The average molecular formula of MCL was calculated as C9H8.74O2.82 (OCH3)0.85
with a mean degree of polymerization of approximately 40 (Marques et al. 1996).
Fig. 6. Main inter-unit linkages in cork lignin (using coniferyl alcohol as the monomer)
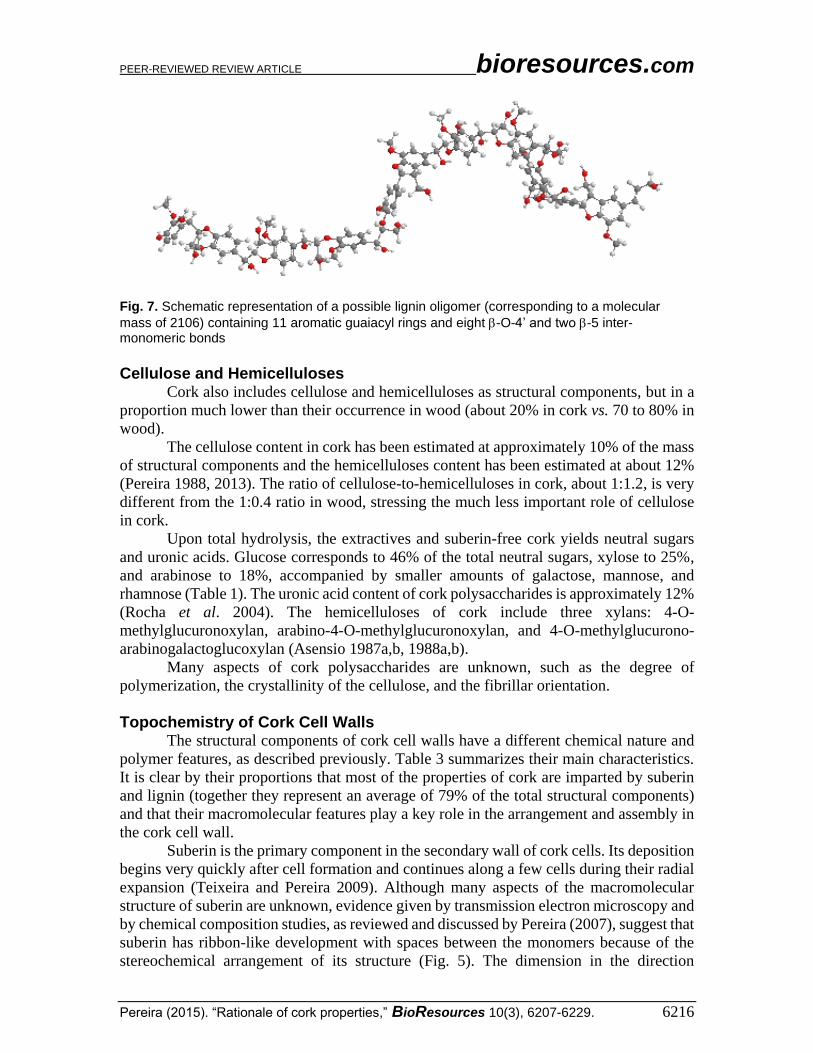
With respect to the macromolecule, cork lignin’s structure is largely a result of the
fact that the main inter-monomeric links are of the -O-4’ type. This results in a rather
linear structure that curves helicoidally but has anchor points at its aromatic rings. Figure
7 is a schematic representation of a lignin oligomer with 11 guaiacyl rings, eight -O-4’
bonds, and two -5’ inter-unit linkages that approximates the main known features of cork
lignin.
PEER-REVIEWED REVIEW ARTICLE bioresources.com
Pereira (2015). “Rationale of cork properties,” BioResources 10(3), 6207-6229. 6216
Fig. 7. Schematic representation of a possible lignin oligomer (corresponding to a molecular
mass of 2106) containing 11 aromatic guaiacyl rings and eight -O-4’ and two -5 inter-monomeric bonds
Cellulose and Hemicelluloses Cork also includes cellulose and hemicelluloses as structural components, but in a
proportion much lower than their occurrence in wood (about 20% in cork vs. 70 to 80% in
wood).
The cellulose content in cork has been estimated at approximately 10% of the mass
of structural components and the hemicelluloses content has been estimated at about 12%
(Pereira 1988, 2013). The ratio of cellulose-to-hemicelluloses in cork, about 1:1.2, is very
different from the 1:0.4 ratio in wood, stressing the much less important role of cellulose
in cork.
Upon total hydrolysis, the extractives and suberin-free cork yields neutral sugars
and uronic acids. Glucose corresponds to 46% of the total neutral sugars, xylose to 25%,
and arabinose to 18%, accompanied by smaller amounts of galactose, mannose, and
rhamnose (Table 1). The uronic acid content of cork polysaccharides is approximately 12%
(Rocha et al. 2004). The hemicelluloses of cork include three xylans: 4-O-
methylglucuronoxylan, arabino-4-O-methylglucuronoxylan, and 4-O-methylglucurono-
arabinogalactoglucoxylan (Asensio 1987a,b, 1988a,b).
Many aspects of cork polysaccharides are unknown, such as the degree of
polymerization, the crystallinity of the cellulose, and the fibrillar orientation.
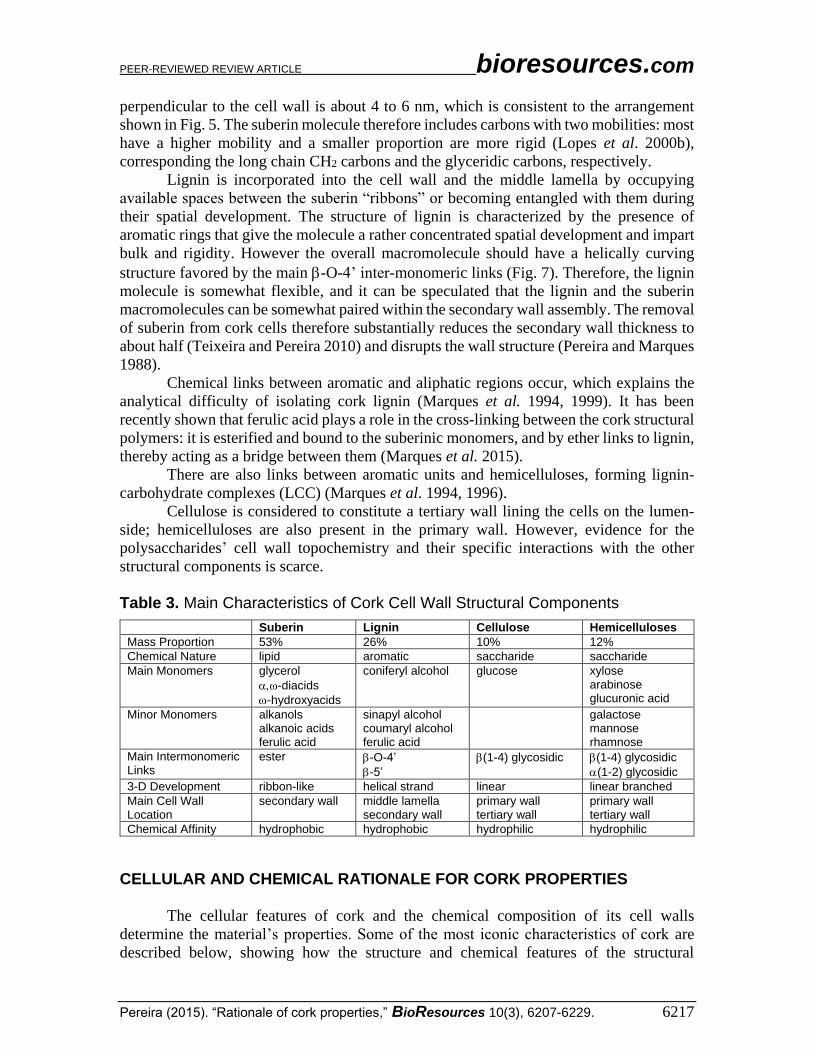
Topochemistry of Cork Cell Walls The structural components of cork cell walls have a different chemical nature and
polymer features, as described previously. Table 3 summarizes their main characteristics.
It is clear by their proportions that most of the properties of cork are imparted by suberin
and lignin (together they represent an average of 79% of the total structural components)
and that their macromolecular features play a key role in the arrangement and assembly in
the cork cell wall.
Suberin is the primary component in the secondary wall of cork cells. Its deposition
begins very quickly after cell formation and continues along a few cells during their radial
expansion (Teixeira and Pereira 2009). Although many aspects of the macromolecular
structure of suberin are unknown, evidence given by transmission electron microscopy and
by chemical composition studies, as reviewed and discussed by Pereira (2007), suggest that
suberin has ribbon-like development with spaces between the monomers because of the
stereochemical arrangement of its structure (Fig. 5). The dimension in the direction
PEER-REVIEWED REVIEW ARTICLE bioresources.com
Pereira (2015). “Rationale of cork properties,” BioResources 10(3), 6207-6229. 6217
perpendicular to the cell wall is about 4 to 6 nm, which is consistent to the arrangement
shown in Fig. 5. The suberin molecule therefore includes carbons with two mobilities: most
have a higher mobility and a smaller proportion are more rigid (Lopes et al. 2000b),
corresponding the long chain CH2 carbons and the glyceridic carbons, respectively.
Lignin is incorporated into the cell wall and the middle lamella by occupying
available spaces between the suberin “ribbons” or becoming entangled with them during
their spatial development. The structure of lignin is characterized by the presence of
aromatic rings that give the molecule a rather concentrated spatial development and impart
bulk and rigidity. However the overall macromolecule should have a helically curving
structure favored by the main -O-4’ inter-monomeric links (Fig. 7). Therefore, the lignin
molecule is somewhat flexible, and it can be speculated that the lignin and the suberin
macromolecules can be somewhat paired within the secondary wall assembly. The removal
of suberin from cork cells therefore substantially reduces the secondary wall thickness to
about half (Teixeira and Pereira 2010) and disrupts the wall structure (Pereira and Marques
1988).
Chemical links between aromatic and aliphatic regions occur, which explains the
analytical difficulty of isolating cork lignin (Marques et al. 1994, 1999). It has been
recently shown that ferulic acid plays a role in the cross-linking between the cork structural
polymers: it is esterified and bound to the suberinic monomers, and by ether links to lignin,
thereby acting as a bridge between them (Marques et al. 2015).
There are also links between aromatic units and hemicelluloses, forming lignin-
carbohydrate complexes (LCC) (Marques et al. 1994, 1996).
Cellulose is considered to constitute a tertiary wall lining the cells on the lumen-
side; hemicelluloses are also present in the primary wall. However, evidence for the
polysaccharides’ cell wall topochemistry and their specific interactions with the other
structural components is scarce.
Table 3. Main Characteristics of Cork Cell Wall Structural Components
Suberin Lignin Cellulose Hemicelluloses
Mass Proportion 53% 26% 10% 12%
Chemical Nature lipid aromatic saccharide saccharide
Main Monomers glycerol
-diacids
-hydroxyacids
coniferyl alcohol glucose xylose arabinose glucuronic acid
Minor Monomers alkanols alkanoic acids ferulic acid
sinapyl alcohol coumaryl alcohol ferulic acid
galactose mannose rhamnose
Main Intermonomeric Links
ester -O-4’
-5’
(1-4) glycosidic (1-4) glycosidic
(1-2) glycosidic
3-D Development ribbon-like helical strand linear linear branched
Main Cell Wall Location
secondary wall middle lamella secondary wall
primary wall tertiary wall
primary wall tertiary wall
Chemical Affinity hydrophobic hydrophobic hydrophilic hydrophilic
CELLULAR AND CHEMICAL RATIONALE FOR CORK PROPERTIES
The cellular features of cork and the chemical composition of its cell walls
determine the material’s properties. Some of the most iconic characteristics of cork are
described below, showing how the structure and chemical features of the structural
PEER-REVIEWED REVIEW ARTICLE bioresources.com
Pereira (2015). “Rationale of cork properties,” BioResources 10(3), 6207-6229. 6218
components explain the functionality of cork. Density, buoyancy, thermal insulation, fire
behavior, compression, and permeability are discussed.
Density and Buoyancy
The density of cellular materials is expressed as their solid mass fraction and the
density of the solid. The density of air-dried cork is usually about 150 to 160 kg m-3, but a
broader range of values can be observed in nature, as influenced by several factors.
The density of the solid (i.e., cell walls) is estimated as 1250 kg m-3 (Flores et al.
1992). As the cell wall density varies only slightly, the differences in cork density are
derived from its structural features such as cell size and cell wall corrugation (Fig. 1), the
proportion of earlycork and latecork in the annual ring (Fig. 3), the extent of porosity (Fig.
4), and inclusions and discontinuities.
The average dimensions of earlycork and latecork cells indicate densities of 110
and 420 kg m-3, respectively. The higher density of the latecork layer is clearly seen in Fig.
4. Large annual rings and thin annual rings have different densities, according to their
differing proportions of earlycork and latecork cells (95:5 and 75:25, respectively): 126
and 188 kg m-3, respectively.
The corrugation of the lateral prism walls of the earlycork cells also impacts the
material’s density. The effect on density depends on the corrugation parameter (the
quotient between the length of the corrugated wall and the length of the wall if it were
straightened) in a way such that the density is higher when cells are more corrugated. The
straightening of the cell walls, by thermal treatments or boiling in water, will decrease cork
density; on the contrary, treatments that increase the cellular corrugation will yield denser
corks (e.g., the compression of a stopper in the neck of a bottle).
Regarding the porosity resulting from lenticular channels, the general tendency is
toward higher density values in corks with more and larger lenticular channels. In fact,
lenticular channels contain a filling material, and in most cases they are bordered by thicker
cells (Fig. 4).
Cork has been used since antiquity as a floatation device. The buoyancy of cork is
derived from its low density and the fact that the cells in cork are closed and without open
connections to one another at m level. Another reason for the floating capacity of cork is
the very small diffusion of water into it: the diffusion coefficient of water in cork has been
found to be between 1.4 x 10⁻¹⁰ m2 s-1 (Fonseca et al. 2013), 2 x 10-11 m2 s-1 at 20 °C (Rosa
and Fortes 1993), and 7 x 10-13 m2 s-1 at 25 °C (Marat-Mendes and Neagu 2004).
Thermal Insulation and Fire Behavior The rate of heat transfer through cork is very low because of the material’s
structural characteristics. Its solid fraction is small, and the gas enclosed in the cells of cork
has low thermal conductivity. The cells are small and closed, which eliminates convection.
Radiation is reduced through repeated absorption and reflection at the numerous cork cell
walls.
In comparison with other synthetic insulation foams, cork has smaller cells but
higher density, which results in comparable heat transfer properties. The chemical
composition of the cell wall of cork imparts appreciable thermal stability as compared to
that of synthetic polymers (e.g, polystyrene or polyurethane), which degrade and melt at
comparatively low temperatures. In cork, the small polysaccharides content and the thermal
stability of suberin (Sen et al. 2012a, 2014) facilitate better performance at elevated
temperatures. At 350 °C, cork maintains its cellular structure but has expanded cells and
PEER-REVIEWED REVIEW ARTICLE bioresources.com
Pereira (2015). “Rationale of cork properties,” BioResources 10(3), 6207-6229. 6219
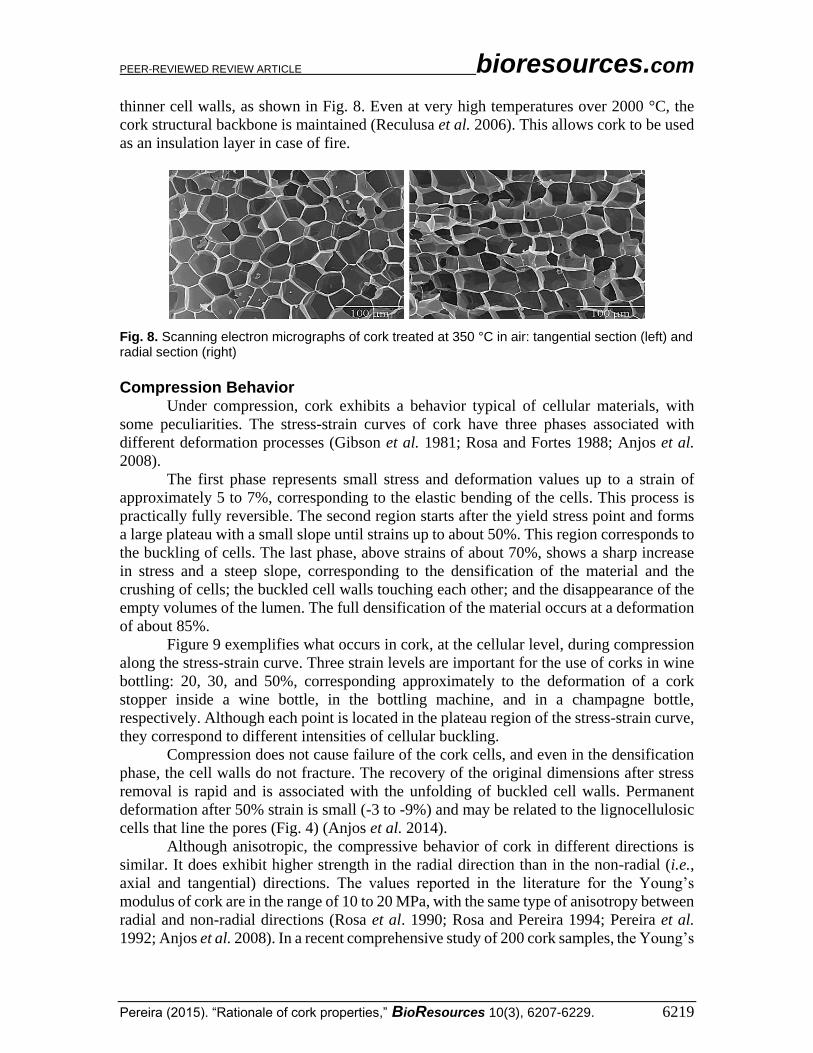
thinner cell walls, as shown in Fig. 8. Even at very high temperatures over 2000 °C, the
cork structural backbone is maintained (Reculusa et al. 2006). This allows cork to be used
as an insulation layer in case of fire.
Fig. 8. Scanning electron micrographs of cork treated at 350 °C in air: tangential section (left) and radial section (right)
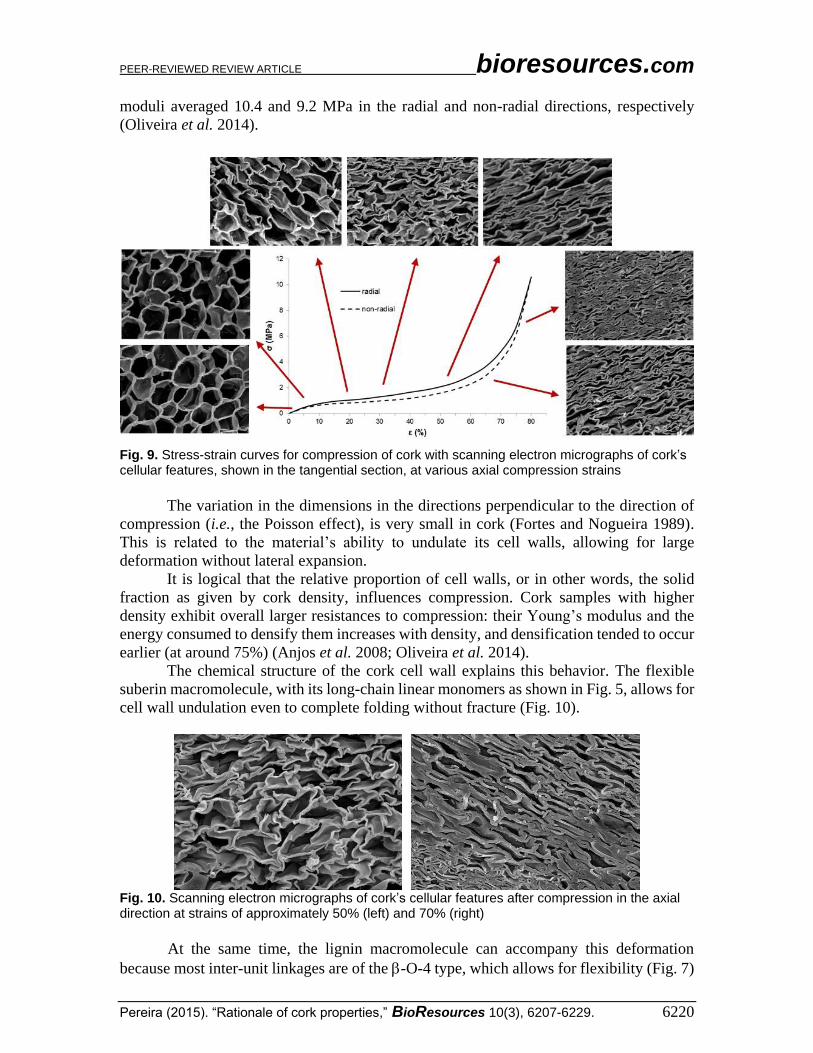
Compression Behavior Under compression, cork exhibits a behavior typical of cellular materials, with
some peculiarities. The stress-strain curves of cork have three phases associated with
different deformation processes (Gibson et al. 1981; Rosa and Fortes 1988; Anjos et al.
2008).
The first phase represents small stress and deformation values up to a strain of
approximately 5 to 7%, corresponding to the elastic bending of the cells. This process is
practically fully reversible. The second region starts after the yield stress point and forms
a large plateau with a small slope until strains up to about 50%. This region corresponds to
the buckling of cells. The last phase, above strains of about 70%, shows a sharp increase
in stress and a steep slope, corresponding to the densification of the material and the
crushing of cells; the buckled cell walls touching each other; and the disappearance of the
empty volumes of the lumen. The full densification of the material occurs at a deformation
of about 85%.
Figure 9 exemplifies what occurs in cork, at the cellular level, during compression
along the stress-strain curve. Three strain levels are important for the use of corks in wine
bottling: 20, 30, and 50%, corresponding approximately to the deformation of a cork
stopper inside a wine bottle, in the bottling machine, and in a champagne bottle,
respectively. Although each point is located in the plateau region of the stress-strain curve,
they correspond to different intensities of cellular buckling.
Compression does not cause failure of the cork cells, and even in the densification
phase, the cell walls do not fracture. The recovery of the original dimensions after stress
removal is rapid and is associated with the unfolding of buckled cell walls. Permanent
deformation after 50% strain is small (-3 to -9%) and may be related to the lignocellulosic
cells that line the pores (Fig. 4) (Anjos et al. 2014).
Although anisotropic, the compressive behavior of cork in different directions is
similar. It does exhibit higher strength in the radial direction than in the non-radial (i.e.,
axial and tangential) directions. The values reported in the literature for the Young’s
modulus of cork are in the range of 10 to 20 MPa, with the same type of anisotropy between
radial and non-radial directions (Rosa et al. 1990; Rosa and Pereira 1994; Pereira et al.
1992; Anjos et al. 2008). In a recent comprehensive study of 200 cork samples, the Young’s
PEER-REVIEWED REVIEW ARTICLE bioresources.com
Pereira (2015). “Rationale of cork properties,” BioResources 10(3), 6207-6229. 6220
moduli averaged 10.4 and 9.2 MPa in the radial and non-radial directions, respectively
(Oliveira et al. 2014).
Fig. 9. Stress-strain curves for compression of cork with scanning electron micrographs of cork’s cellular features, shown in the tangential section, at various axial compression strains
The variation in the dimensions in the directions perpendicular to the direction of
compression (i.e., the Poisson effect), is very small in cork (Fortes and Nogueira 1989).
This is related to the material’s ability to undulate its cell walls, allowing for large
deformation without lateral expansion.
It is logical that the relative proportion of cell walls, or in other words, the solid
fraction as given by cork density, influences compression. Cork samples with higher
density exhibit overall larger resistances to compression: their Young’s modulus and the
energy consumed to densify them increases with density, and densification tended to occur
earlier (at around 75%) (Anjos et al. 2008; Oliveira et al. 2014).
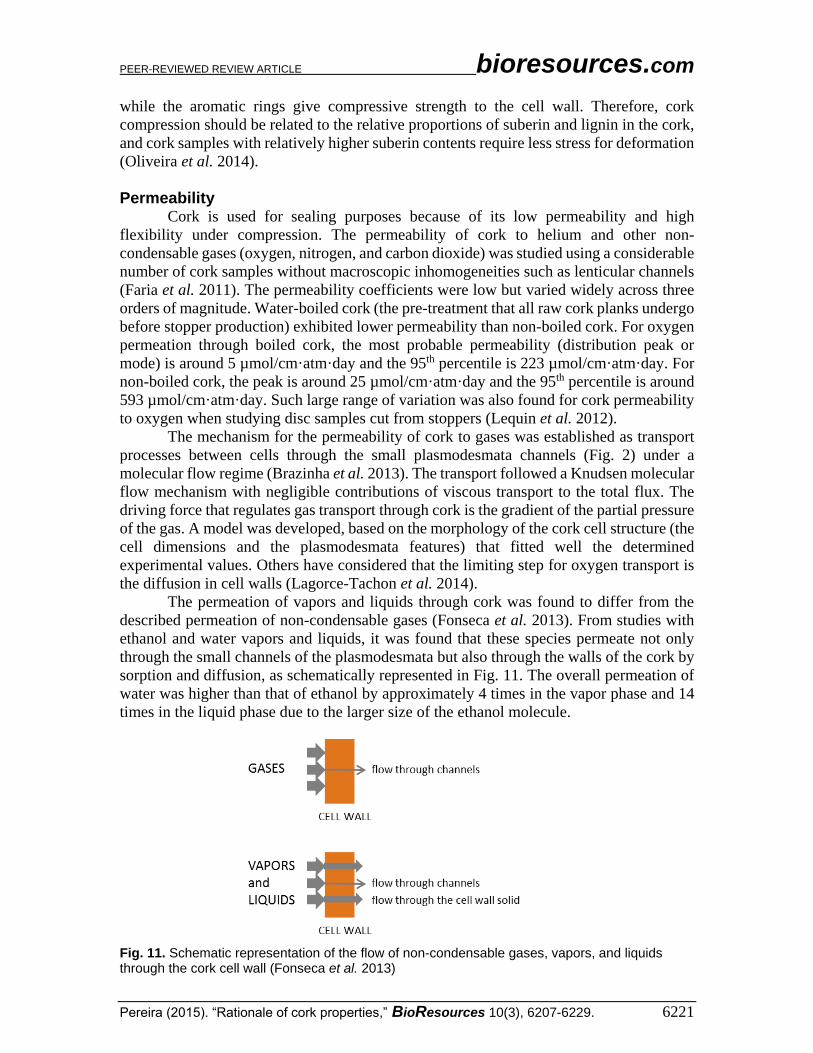
The chemical structure of the cork cell wall explains this behavior. The flexible
suberin macromolecule, with its long-chain linear monomers as shown in Fig. 5, allows for
cell wall undulation even to complete folding without fracture (Fig. 10).
Fig. 10. Scanning electron micrographs of cork’s cellular features after compression in the axial direction at strains of approximately 50% (left) and 70% (right)
At the same time, the lignin macromolecule can accompany this deformation
because most inter-unit linkages are of the -O-4 type, which allows for flexibility (Fig. 7)
PEER-REVIEWED REVIEW ARTICLE bioresources.com
Pereira (2015). “Rationale of cork properties,” BioResources 10(3), 6207-6229. 6221
while the aromatic rings give compressive strength to the cell wall. Therefore, cork
compression should be related to the relative proportions of suberin and lignin in the cork,
and cork samples with relatively higher suberin contents require less stress for deformation
(Oliveira et al. 2014).
Permeability Cork is used for sealing purposes because of its low permeability and high
flexibility under compression. The permeability of cork to helium and other non-
condensable gases (oxygen, nitrogen, and carbon dioxide) was studied using a considerable
number of cork samples without macroscopic inhomogeneities such as lenticular channels
(Faria et al. 2011). The permeability coefficients were low but varied widely across three
orders of magnitude. Water-boiled cork (the pre-treatment that all raw cork planks undergo
before stopper production) exhibited lower permeability than non-boiled cork. For oxygen
permeation through boiled cork, the most probable permeability (distribution peak or
mode) is around 5 µmol/cm·atm·day and the 95th percentile is 223 µmol/cm·atm·day. For
non-boiled cork, the peak is around 25 µmol/cm·atm·day and the 95th percentile is around
593 µmol/cm·atm·day. Such large range of variation was also found for cork permeability
to oxygen when studying disc samples cut from stoppers (Lequin et al. 2012).
The mechanism for the permeability of cork to gases was established as transport
processes between cells through the small plasmodesmata channels (Fig. 2) under a
molecular flow regime (Brazinha et al. 2013). The transport followed a Knudsen molecular
flow mechanism with negligible contributions of viscous transport to the total flux. The
driving force that regulates gas transport through cork is the gradient of the partial pressure
of the gas. A model was developed, based on the morphology of the cork cell structure (the
cell dimensions and the plasmodesmata features) that fitted well the determined
experimental values. Others have considered that the limiting step for oxygen transport is
the diffusion in cell walls (Lagorce-Tachon et al. 2014).
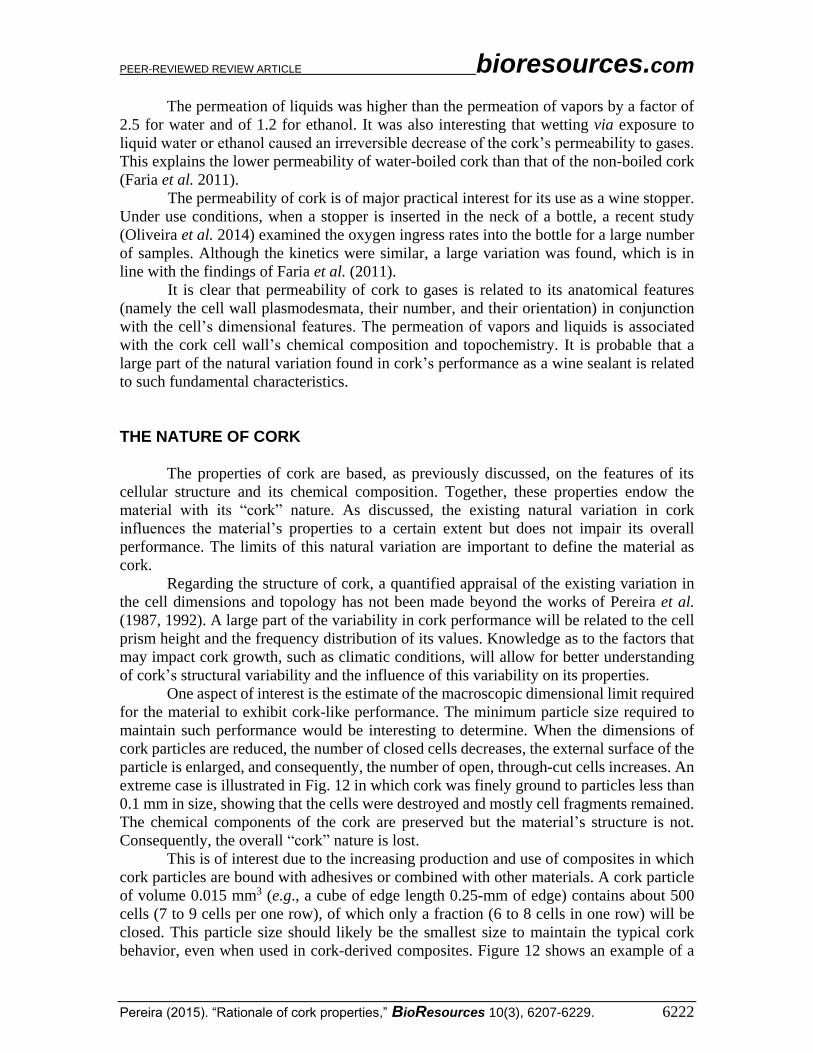
The permeation of vapors and liquids through cork was found to differ from the
described permeation of non-condensable gases (Fonseca et al. 2013). From studies with
ethanol and water vapors and liquids, it was found that these species permeate not only
through the small channels of the plasmodesmata but also through the walls of the cork by
sorption and diffusion, as schematically represented in Fig. 11. The overall permeation of
water was higher than that of ethanol by approximately 4 times in the vapor phase and 14
times in the liquid phase due to the larger size of the ethanol molecule.
Fig. 11. Schematic representation of the flow of non-condensable gases, vapors, and liquids through the cork cell wall (Fonseca et al. 2013)
PEER-REVIEWED REVIEW ARTICLE bioresources.com
Pereira (2015). “Rationale of cork properties,” BioResources 10(3), 6207-6229. 6222
The permeation of liquids was higher than the permeation of vapors by a factor of
2.5 for water and of 1.2 for ethanol. It was also interesting that wetting via exposure to
liquid water or ethanol caused an irreversible decrease of the cork’s permeability to gases.
This explains the lower permeability of water-boiled cork than that of the non-boiled cork
(Faria et al. 2011).
The permeability of cork is of major practical interest for its use as a wine stopper.
Under use conditions, when a stopper is inserted in the neck of a bottle, a recent study
(Oliveira et al. 2014) examined the oxygen ingress rates into the bottle for a large number
of samples. Although the kinetics were similar, a large variation was found, which is in
line with the findings of Faria et al. (2011).
It is clear that permeability of cork to gases is related to its anatomical features
(namely the cell wall plasmodesmata, their number, and their orientation) in conjunction
with the cell’s dimensional features. The permeation of vapors and liquids is associated
with the cork cell wall’s chemical composition and topochemistry. It is probable that a
large part of the natural variation found in cork’s performance as a wine sealant is related
to such fundamental characteristics.
THE NATURE OF CORK
The properties of cork are based, as previously discussed, on the features of its
cellular structure and its chemical composition. Together, these properties endow the
material with its “cork” nature. As discussed, the existing natural variation in cork
influences the material’s properties to a certain extent but does not impair its overall
performance. The limits of this natural variation are important to define the material as
cork.
Regarding the structure of cork, a quantified appraisal of the existing variation in
the cell dimensions and topology has not been made beyond the works of Pereira et al.
(1987, 1992). A large part of the variability in cork performance will be related to the cell
prism height and the frequency distribution of its values. Knowledge as to the factors that
may impact cork growth, such as climatic conditions, will allow for better understanding
of cork’s structural variability and the influence of this variability on its properties.
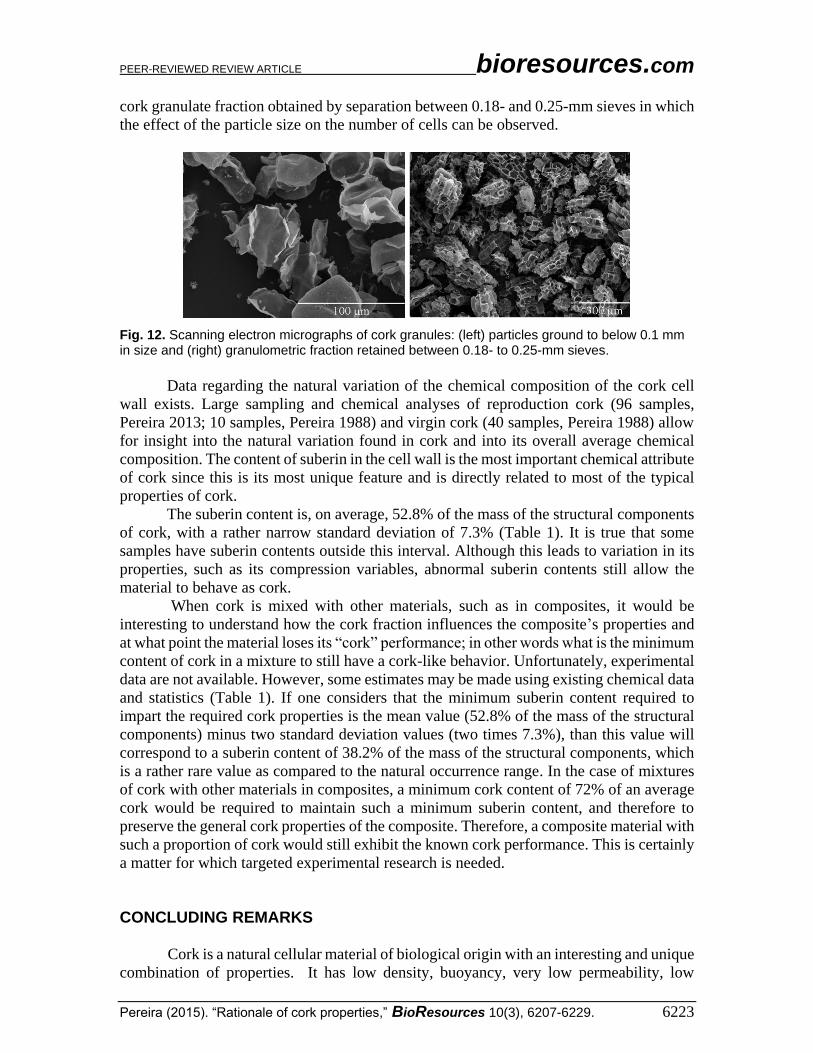
One aspect of interest is the estimate of the macroscopic dimensional limit required
for the material to exhibit cork-like performance. The minimum particle size required to
maintain such performance would be interesting to determine. When the dimensions of
cork particles are reduced, the number of closed cells decreases, the external surface of the
particle is enlarged, and consequently, the number of open, through-cut cells increases. An
extreme case is illustrated in Fig. 12 in which cork was finely ground to particles less than
0.1 mm in size, showing that the cells were destroyed and mostly cell fragments remained.
The chemical components of the cork are preserved but the material’s structure is not.
Consequently, the overall “cork” nature is lost.
This is of interest due to the increasing production and use of composites in which
cork particles are bound with adhesives or combined with other materials. A cork particle
of volume 0.015 mm3 (e.g., a cube of edge length 0.25-mm of edge) contains about 500
cells (7 to 9 cells per one row), of which only a fraction (6 to 8 cells in one row) will be
closed. This particle size should likely be the smallest size to maintain the typical cork
behavior, even when used in cork-derived composites. Figure 12 shows an example of a
PEER-REVIEWED REVIEW ARTICLE bioresources.com
Pereira (2015). “Rationale of cork properties,” BioResources 10(3), 6207-6229. 6223
cork granulate fraction obtained by separation between 0.18- and 0.25-mm sieves in which
the effect of the particle size on the number of cells can be observed.
Fig. 12. Scanning electron micrographs of cork granules: (left) particles ground to below 0.1 mm in size and (right) granulometric fraction retained between 0.18- to 0.25-mm sieves.
Data regarding the natural variation of the chemical composition of the cork cell
wall exists. Large sampling and chemical analyses of reproduction cork (96 samples,
Pereira 2013; 10 samples, Pereira 1988) and virgin cork (40 samples, Pereira 1988) allow
for insight into the natural variation found in cork and into its overall average chemical
composition. The content of suberin in the cell wall is the most important chemical attribute
of cork since this is its most unique feature and is directly related to most of the typical
properties of cork.
The suberin content is, on average, 52.8% of the mass of the structural components
of cork, with a rather narrow standard deviation of 7.3% (Table 1). It is true that some
samples have suberin contents outside this interval. Although this leads to variation in its
properties, such as its compression variables, abnormal suberin contents still allow the
material to behave as cork.
When cork is mixed with other materials, such as in composites, it would be
interesting to understand how the cork fraction influences the composite’s properties and
at what point the material loses its “cork” performance; in other words what is the minimum
content of cork in a mixture to still have a cork-like behavior. Unfortunately, experimental
data are not available. However, some estimates may be made using existing chemical data
and statistics (Table 1). If one considers that the minimum suberin content required to
impart the required cork properties is the mean value (52.8% of the mass of the structural
components) minus two standard deviation values (two times 7.3%), than this value will
correspond to a suberin content of 38.2% of the mass of the structural components, which
is a rather rare value as compared to the natural occurrence range. In the case of mixtures
of cork with other materials in composites, a minimum cork content of 72% of an average
cork would be required to maintain such a minimum suberin content, and therefore to
preserve the general cork properties of the composite. Therefore, a composite material with
such a proportion of cork would still exhibit the known cork performance. This is certainly
a matter for which targeted experimental research is needed.
CONCLUDING REMARKS
Cork is a natural cellular material of biological origin with an interesting and unique
combination of properties. It has low density, buoyancy, very low permeability, low
PEER-REVIEWED REVIEW ARTICLE bioresources.com
Pereira (2015). “Rationale of cork properties,” BioResources 10(3), 6207-6229. 6224
thermal coefficients, elasticity, and withstands large deformation without fracture under
compression. These properties are the reason for the material’s various applications,
namely as a sealant and insulator.
Cork’s properties are the combined result of the features of its cellular structure,
particularly its cell dimensions and topology, its cell wall ultrastructure, and the cell wall
chemical composition. The chemicals in the cell wall include suberin, the major chemical
component and cork’s fingerprint. Together, these properties define cork’s behavior.
ACKNOWLEDGEMENTS
This research was carried out in the Centro de Estudos Florestais, a research unit
funded by Fundação para a Ciência e a Tecnologia (Portugal) within PEst-
OE/AGR/UI0239/2014. Thanks are due to Duarte Neiva for helping to design the
molecular lignin and suberin models, Rita Teixeira for the TEM figures, and Vanda
Oliveira for the microtomography figures.
REFERENCES CITED
Achyuthan, K. E., Achyutan, A. M., Adams, P. D., Dirk, S. M., Harper, J. C., Simmons,
B. A., and Singh, A. K. (2010). “Supramolecular self-assembled chaos: Polyphenolic
lignin’s barrier to cost-effective lignocellulosic biofuels,” Molecules 15(12), 8641-
8688. DOI: 10.3390/molecules15118641
Anjos, O., Pereira, H., and Rosa, M. E. (2008). “Effect of quality, porosity and density on
the compression properties of cork,” Holz Roh-Werkst. 66(4), 295-301. DOI:
10.1007/s00107-008-0248-2
Anjos, O., Rodrigues, C., Morais, J., and Pereira, H. (2014). “Effect of density on the
compression behaviour of cork,” Mater. Des. 53, 1089-1096. DOI:
10.1016/j.matdes.2013.07.038
Arno, M., Serra, M. C., and Seoane, E. (1981). “Metanolisis de la suberina del corcho.
Identificacion y estimacion de sus componentes ácidos como ésteres metílicos,”
Anales Quim. 77, 82-86.
Asensio, A. (1987a). “Quercus suber polysaccharides. 1. Structural studies of the
hemicellulose-A from the cork of Quercus suber,” Carbohydr. Res. 161(1), 167-170.
DOI: 10.1016/0008-6215(87)84017-X
Asensio, A. (1987b). “Quercus suber polysaccharides. 2. Structural studies of a
hemicellulose-B fraction from the cork of Quercus suber,” Carbohydr. Res. 165(1),
134-138. DOI: 10.1016/0008-6215(87)80088-5
Asensio, A. (1988a). “Quercus suber polysaccharides. 3. Structural studies of a
hemicellulose B fraction (B-2) from the cork of Quercus suber,” Canadian J. Chem.
66(3), 449-453. DOI: 10.1139/v88-078
Asensio, A. (1988b). “Polysaccharides from the cork of Quercus suber. II.
Hemicellulose,” J. Natural Prod. 51(3), 488-491. DOI: 10.1021/np50057a004
Bento, M. F., Pereira, H., Cunha, M. A., Moutinho, A. M. C., van der Berg, K. J., and
Boon, J. J. (1998). “Thermally assisted transmethylation gas chromatography-mass
spectrometry of suberin components in cork from Quercus suber L.,” Phytochem.
PEER-REVIEWED REVIEW ARTICLE bioresources.com
Pereira (2015). “Rationale of cork properties,” BioResources 10(3), 6207-6229. 6225
Anal. 9(2), 57-87. DOI: 10.1002/(SICI)1099-1565(199803/04)9:2<75::AID-
PCA386>3.0.CO;2-8
Bento, M. F. S., Pereira, H., Cunha, M. A., Moutinho, A. M. C., van den Berg, K. J., and
Boon, J. J. (2001a). “A study of variability of suberin composition in cork from
Quercus suber L. using thermally assisted transmethylation GC–MS,” J. Anal. Appl.
Pyrolysis 57(1), 45-55. DOI: 10.1016/S0165-2370(00)00093-0
Bento, M. F., Pereira, H., Cunha, M. A., Moutinho, A. M. C., van der Berg, K. J., Boon,
J. J., van den Brink, O., and Heeren, R. M. A. (2001b). “Fragmentation of suberin and
composition of aliphatic monomers released by methanolysis of cork from Quercus
suber L. analysed by GC-MS SEC and MALDI-MS,” Holzforschung 55(5), 487-493.
DOI: 10.1515/HF.2001.080
Brazinha, C., Fonseca, A. P., Pereira, H., Teodoro, O. M. N. D., and Crespo, J. G. (2013).
“Gas transport through cork: Modelling gas permeation based on the morphology of a
natural polymer material,” J. Membrane Sci. 428, 52-62. DOI:
10.1016/j.memsci.2012.10.019
Brugnatelli, D. (1787). Elementi di Chimica, Tomo II.
Brunetti, A., Cesareo, R., Golosio, B., Luciano, P., and Ruggero, A. (2002). “Cork
quality estimation by using Compton tomography,” Nuclear Instr. Methods in Physics
Res. Section B: Beam Interactions with Materials and Atoms, 169(1-2), 161-168.
DOI: 10.1016/S0168-583X(02)01289-2
Chubar, N., Carvalho, J. R., Correia, M. N. J. (2004).” Cork biomass as biosorbent for
Cu(II), Zn(II) and Ni(II),” Colloid Surf A 230(1-3), 57-65. DOI:
10.1016/j.colsurfa.2003.09.014
Conde, E., Cadahia, E., Garcia-Vallejo, M. C., and Adrados, J. R. G. (1998). “Chemical
characterization of reproduction cork from Spanish Quercus suber,” J. Wood Chem.
Technol. 18(4), 447-469. DOI: 10.1080/02773819809349592
Cordeiro, N., Belgacem, M. N., Silvestre, A. J. D., Pascoal Neto, C., and Gandini, A.
(1998). “Cork suberin as a new source of chemicals. 1. Isolation and chemical
characterization of its composition,” Int. J. Biol. Macromol. 22(2), 71-80. DOI:
10.1016/S0141-8130(97)00090-1
Costa, A., and Pereira, H. (2006). “Decision rules for computer-vision quality
classification of wine natural cork stoppers,” Am. J. Enol. Vitic. 57(2), 210-219.
Costa, A., and Pereira, H. (2007). “Influence of vision systems, black and white, coloured
and visual digitalization, in natural cork stopper quality estimation,” J. Sci. Food
Agric. 87(12), 2222-2228. DOI: 10.1002/jsfa.2947
Costa, A., Pereira, H., and Oliveira, A. (2002). “Influence of climate on the seasonality of
radial growth of cork oak during a cork production cycle,” Ann. For. Sci. 59(4), 429-
437. DOI: 10.1051/forest:2002017
Dehane, B., Benrahou, A., Bouhraoua, R., Hamani, F. Z., and Belhoucine, L. (2014).
“Chemical composition of Algerian cork according the origin and the quality,” Int. J.
Res. Envir. Studies 1(2), 17-25.
Donepudi, V. R., Cesareo, R., Brunetti, A., Zhong, Z., Yuasa, T., Akatsuka, T., Takeda,
T., and Gigante, G. E. (2010). “Cork embedded internal features and contrast
mechanisms with Dei using 18, 20, 30, 36, and 40 keV Synchrotron X-rays,” Res.
Nondestruct. Eval. 21(3), 171-183. DOI: 10.1080/09349847.2010.493990
Evert, R. F., and Eichhorn, S. E. (2006). Esau’s Plant Anatomy, Meristems, Cells, and
Tissues of the Plant Body: Their Structure, Function, and Development, 3rd ed. John
Wiley & Sons, New York.
PEER-REVIEWED REVIEW ARTICLE bioresources.com
Pereira (2015). “Rationale of cork properties,” BioResources 10(3), 6207-6229. 6226
Faria, D. P., Fonseca, A. L., Pereira, H., and Teodoro, O. M. N. D. (2011). “Permeability
of cork to gases,” J. Agric. Food Chem. 59(8), 3590-3597. DOI: 10.1021/jf200491
Ferreira, R., Garcia, H., Sousa, A. F., Petkovic, M., Lamosa, P., Freire, C. S. R.,
Silvestre, A. J. D., Rebelo, L. P. N., and Silva-Pereira, C. (2012). “Suberin isolation
process from cork using ionic liquids. Characterization of ensuing products,” New J.
Chem. 36(5), 2014-2024. DOI: 10.1039/C2NJ40433H
Ferreira, R., Garcia, H., Sousa, A. F., Freire, C. S. R., Silvestre, A. J. D., Rebelo, L. P. N.,
and Silva-Pereira, C. (2013). “Isolation of suberin from birch outer bark and cork
using ionic liquids: A new source of macromonomers,” Ind. Crops Prod. 44, 520-
527. DOI: 10.1016/j.indcrop.2012.10.002
Flores, M., Rosa, M. E., Barlow, C. Y., Fortes, M. A., and Ashby, M. F. (1992).
“Properties and uses of consolidated cork dust,” J. Mat. Sci. 27(20), 5629-5634. DOI:
10.1007/BF00541634
Fonseca, A. L., Brazinha, C., Pereira, H., Crespo, J. G., and Teodoro, O. M. (2013).
“Permeability of cork for water and ethanol,” J. Agric. Food Chem. 61(40), 9672-
9679. DOI: 10.1021/jf4015729.
Fortes, M. A., and Nogueira, M. T. (1989). “The poison effect in cork,” Mat. Sci. Eng. A
122(2), 227-232. DOI: 10.1016/0921-5093(89)90634-5
Fortes, M. A., Rosa, M. E., and Pereira, H. (2004). A Cortiça, IST Press, Lisboa.
Garcia, H., Ferreira, R , Martins, C., Sousa, A. F., Freire, C. S. R., Silvestre, A. J. D.,
Kunz, W., Rebelo, L. P. N., and Silva Pereira, C. (2014). “Ex-situ reconstitution of
the plant biopolyester suberin as a film,” Biomacromolecules 15(5), 1806-1813. DOI:
10.1021/bm500201s
García-Vallejo, M. C., Conde, E., Cadahía, E., and Simón, F. (1997). “Suberin
composition of reproduction cork from Quercus suber,” Holzforschung 51(3), 219-
224. DOI: 10.1515/hfsg.1997.51.3.219
Gibson, L. J., and Ashby, M. F. (1997). Cellular Solids. Structure and properties, 2nd ed.,
Cambridge University Press, Cambridge.
Gibson, L. J., Easterling, K. E., and Ashby, M. F. (1981). “The structure and mechanics
of cork,” Proc. Roy. Soc. London A 377(1769), 99-117. DOI: 10.1098/rspa.1981.0117
Graça, J., and Pereira, H. (1997). “Cork suberin: A glyceryl based polyester,”
Holzforschung 51(3), 225-234. DOI: 10.1515/hfsg.1997.51.3.225
Graça, J., and Pereira, H. (2000). “Methanolysis of bark suberins: Analysis of glycerol
and acid monomers,” Phytochem. Anal. 11(1), 45-51. DOI: 10.1002/(SICI)1099-
1565(200001/02)11:1<45::AID-PCA481>3.0.CO;2-8
Graça, J., and Pereira, H. (2004). “The periderm development in Quercus suber L.,”
IAWA J. 25(3), 325-335. DOI: 10.1163/22941932-90000369
Holloway, P. (1983). “Some variation in the composition of suberin from cork layers of
higher plants,” Phytochemistry 22(2), 495-502. DOI: 10.1016/0031-9422(83)83033-7
Hooke, R. (1665). Micrographia, or Some Physiological Descriptions of Minute Bodies
Made by Magnifying Glasses. With Observations and Inquiries Thereon, Martyn and
Allestry, for the Royal Society, London.
Hor, Y. L., Federici, J. F., and Wample, R. L. (2008). “Nondestructive evaluation of cork
enclosures using terahertz/millimetre wave spectroscopy and imaging,” Appl. Optics
47(1), 72-78. DOI: 10.1364/AO.47.000072
Klauber, A. (1920). Die Monographie des Korkes. Berlin.
Lagorce-Tachon, A., Karbowiak, T., Loupiac, C., Gaudry, A., Ott, F., Alba-Simionesco,
C., Gougeon, R. D., Alcantara, V., Mannes, D., Kaestner, A., Lehmann, E., and
PEER-REVIEWED REVIEW ARTICLE bioresources.com
Pereira (2015). “Rationale of cork properties,” BioResources 10(3), 6207-6229. 6227
Bellat, J.-P. (2015). “The cork viewed from the inside,” J. Food Eng. 149, 214-221.
DOI: 10.1016/j.jfoodeng.2014.10.023
Lagorce-Tachon, A., Karbowiak, T., Simon, J.-M., Gougeon, R., and Bellat, J.-P. (2014).
“Diffusion of oxygen through cork stopper; is it a Knudsen or a Fickian nechanism?,”
J. Agric. Food Chem. 62(37), 9180-9185. DOI: 10.1021/jf501918n
Lequin, S., Chassagne, D., Karbowiak, T., Simon, J.-M., Paulin, C., and Bellat, J.-P.
(2012). “Diffusion of oxygen in cork,” J. Agri. Food Chem. 60(13), 3348-3356. DOI:
10.1021/jf204655c
Lopes, F., and Pereira, H. (2000). “Definition of quality classes for champagne cork
stoppers in the high quality range,” Wood Sci. Technol. 34(1), 3-10.
Lopes, M., Gil, A., Silvestre, A., and Pascoal Neto, C. (2000a). “Composition of suberin
extracted upon gradual alkaline methanolysis of Quercus suber L. cork,” J. Agric.
Food Chem. 48(2), 383-391. DOI: 10.1021/jf9909398
Lopes, M. H., Sarychev, A., Pascoal Neto, C., and Gil, A.M. (2000b). “Spectral editing of 13C CP/MAS-NMR spectra of complex systems: Application to the structural
characterisation of cork cell walls,” Solid State Nucl. Magn. Reson. 16(3), 109-121.
DOI: 10.1016/S0926-2040(00)00065-5
Machado, A., Pereira, H., and Teixeira, R. (2013). “Anatomy and development of the
endodermis and phellem of Quercus suber L. roots,” Microsc. Microanal. 19(3), 525-
534. DOI: 10.1017/S1431927613000287
Marat-Mendes, J. N., and Neagu, E. R. (2004). “The influence of water on direct current
conductivity of cork,” Mat. Sci. Forum 455-456, 446-449. DOI:
10.4028/www.scientific.net/MSF.455-456.446
Marques, A. V., and Pereira, H. (2013). “Lignin monomeric composition of corks from
the barks of Betula pendula, Quercus suber and Quercus cerris determined by Py-
GC-MS/FID,” J. Anal. Appl. Pyrolysis 100, 88-94. DOI: 10.1016/j.jaap.2012.12.001
Marques, A. V., Pereira, H., Meier, D., and Faix, O. (1996). “Isolation and
characterization of a guaiacyl lignin from saponified cork of Quercus suber L.,”
Holzforschung 50(5), 393-400. DOI: 10.1515/hfsg.1996.50.5.393
Marques, A. V., Pereira, H., Meier, D., and Faix, O. (1999). “Structural characterization
of cork lignin by thioacidolysis and permanganate oxidation,” Holzforschung 53(2),
167-174. DOI: 10.1515/HF.1999.028
Marques, A. V., Rencoret, J., Gutierres Suarez, A., del Rio, J., and Pereira, H. (2015).
“Ferulates and lignin structural composition in cork,” Holzforschung (ahead of print).
DOI: 10.1515/hf-2015-0014
Mukherjee, S., and Federici, J. (2011). “Study of structural defects inside natural cork by
pulsed terahertz tomography,” in: Proceedings of 36th International Conference on
Infrared, Millimeter and Terahertz Waves (IRMMW-THz), Houston, USA. DOI:
10.1109/irmmw-THz.2011.6104965
Oliveira, V., Knapic, S., and Pereira, H. (2012). “Natural variability of surface porosity of
wine cork stoppers of different commercial classes,” J. Int. Sci. Vigne Vin 46(4), 331-
340.
Oliveira, V., Knapic, S., and Pereira, H. (2015a). “Classification modelling based on
surface porosity for the grading of natural cork stoppers for quality wines,” Food
Bioproducts Proc. 93, 69-76. DOI: 10.1016/j.fbp.2013.11.004
Oliveira, V., Lopes, P., Cabral, M., and Pereira, H. (2015b). “Influence of cork defects in
the oxygen ingress through wine stoppers: Insights with X-ray tomography,” J. Food
Eng. 165, 66-73. DOI: 10.1016/j.jfoodeng.2015.05.019
PEER-REVIEWED REVIEW ARTICLE bioresources.com
Pereira (2015). “Rationale of cork properties,” BioResources 10(3), 6207-6229. 6228
Oliveira, V., Rosa, M. E., and Pereira, H. (2014), “Variability of the compression
properties of cork,” Wood Sci. Technol. 48(5), 937-948. DOI: 10.1007/s00226-014-
0651-2
Oliveira, V., van den Bulcke, J., van Acker, J., Schryver, T., and Pereira, H. (2015c).
“Cork structural discontinuities studied with X-ray microtomography,”
Holzforschung (ahead of print). DOI: 10.1515/hf-2014-0245
Olivella, M. A., Jové, P., Sen, A., Pereira, H., Villaescusa, I., and Fiol, N. (2011).
“Sorption performance of Quercus cerris cork with polycyclic aromatic hydrocarbons
and toxicity testing,” BioResources 6(3), 3363-3375.
Pascoal Neto, C., Cordeiro, N., Seca, A., Domingues, F., Gandini, A., and Robert, D.
(1996). “Isolation and characterization of a lignin-like polymer of cork of Quercus
suber L.,” Holzforschung 50(6), 563-565. DOI: 10.1515/hfsg.1996.50.6.563
Pereira, H. (1988). “Chemical composition and variability of cork from Quercus suber
L.,” Wood Sci. Technol. 22(3), 211-21. DOI: 10.1007/BF00386015
Pereira, H. (2007). Cork: Biology, Production and Uses, Elsevier, Amsterdam.
Pereira, H. (2013). “Variability of the chemical composition of cork,” BioResources 8(2),
2246-2256. DOI: 10.15376/biores.8.2.2246-2256
Pereira, H., Graça, J., and Baptista, C. (1992). “The effect of growth rate on the structure
and compressive properties of cork from Quercus suber L.,” IAWA Bull. 13(4), 389-
396. DOI: 10.1163/22941932-90001294
Pereira, H., and Marques, A. V. (1988). “The effect of chemical treatments on the cellular
structure of cork,” IAWA Bull. 9(4), 337-345. DOI: 10.1163/22941932-90001093
Pereira, H., and Tomé, M. (2004). “Cork oak,” in: Encyclopedia of Forest Sciences, J.
Burley, J. Evans, and J. Youngquist (eds.), Elsevier, Oxford, pp. 613-620.
Pereira, H., Rosa, M. E., and Fortes, M. A. (1987). “The cellular structure of cork from
Quercus suber L.,” IAWA Bull. 8(3), 213-218. DOI: 10.1163/22941932-90001048
Pereira, H., Graça, J., and Baptista, C. (1992). “The effect of growth rate on the structure
and compressive properties of cork from Quercus suber L.,” IAWA Bull. 13(4), 389-
396. DOI: 10.1163/22941932-90001294
Pereira, H., Lopes, F., and Graça, J. (1996). “The evaluation of the quality of cork planks
by image analysis,” Holzforschung 50(2), 111-115. DOI: 10.1515/hfsg.1996.50.2.111
Pintor, A., Silvestres-Albero, A. M., Ferreira, C., Pereira, J., Vilar, V.J. P., and Botelho,
C. M. S. (2013). “Textural and surface characterization of cork-based sorbents for the
removal of oil from water.” Ind. Eng. Chem. Res. 52(46). DOI: 10.1021/ie402038n
Ponte-e-Sousa, J. C. A. C. C., and Neto-Vaz, A. M. (2011). “Cork and metals: A review,”
Wood Sci. Technol. 45(1), 183-202. DOI: 10.1007/s00226-009- 0288-8
Reculusa, S., Trinquecoste, M., Dariol, L., and Delhaès, P. (2006). “Formation of low-
density carbon materials through thermal degradation of a cork-based composite,”
Carbon 44(7), 1298-1352. DOI: 10.1016/j.carbon.2005.12.051
Rocha, M. S., Coimbra M. A., and Delgadillo, I. (2004). “Occurrence of furfuraldehydes
during the processing of Quercus suber L. cork. Simultaneous determination of
furfural, 5-hydroxymethylfurfural and 5-methylfurfural and their relation with cork
polysaccharides,” Carbohydr. Polym. 56(3), 287-293. DOI:
10.1016/j.carbpol.2004.03.002
Rosa, M. E., and Fortes, M. A. (1988). “Rate effects on the compression and recovery of
dimensions of cork,” J. Materials Sci. 23(3), 879-885. DOI: 10.1007/BF01153983
Rosa, M. E., and Fortes, M. A. (1993). “Water-absorption by cork,” Wood Fiber Sci.
25(4), 339-348.
PEER-REVIEWED REVIEW ARTICLE bioresources.com
Pereira (2015). “Rationale of cork properties,” BioResources 10(3), 6207-6229. 6229
Rosa, M. E., and Pereira, H. (1994). “The effect of long term treatment at 100ºC-150ºC
on the structure, chemical composition and compression behavior of cork,”
Holzforschung 48(3), 226-232. DOI: 10.1515/hfsg.1994.48.3.226
Rosa, M. E., Pereira, H., and Fortes, M. A. (1990). “Effects of water treatment on the
structure and properties of cork,” Wood Fiber Sci. 22(2), 149-164.
Sen, A., Miranda, I., and Pereira, H. (2012a). “Temperature-induced structural and
chemical changes in cork from Quercus cerris,” Ind. Crops Prod. 37(1), 508-513.
DOI: 10.1016/j.indcrop.2011.07.028
Sen, A., Olivella, M. A., Fiol, N., Miranda, I., Villaescusa, I., and Pereira, H. (2012b).
“Removal of chromium (VI) in aqueous environments using cork and heat-treated
cork samples from Quercus cerris and Quercus suber,” BioResources 7(4), 4843-
4857.
Sen, A., van den Bulcke, J., Defoirdt, N., van Acker, J., and Pereira, H. (2014). “Thermal
behaviour of cork and cork components,” Thermochimica Acta 582, 94-100. DOI:
10.1016/j.tca.2014.03.007
Silva, S. P., Sabino, M. A., Fernandes, E. M., Correlo, V. M., Boesel, L. F., and Reis, R.
(2005). “Cork: properties, capabilities and applications,” Int. Mat. Reviews 50(6),
345-365. DOI: 10.1179/174328005X41168
Taber, G. M. (2007). To Cork or Not to Cork, Scribner, New York.
Teixeira, R., and Pereira, H. (2009). “Ultrastructural observations reveal the presence of
channels between cork cells,” Microsc. Microanal. 15(6), 539-544. DOI:
10.1017/S1431927609990432
Teixeira, R., and Pereira, H. (2010). “Suberized cell walls of cork from cork oak differ
from other species,” Microsc. Microanal. 16(5), 569-575. DOI:
10.1017/S1431927610093839
Article submitted: February 16, 2015; Peer review completed: June 10, 2015; Revised
version received: June 15, 2015; Accepted: June 24, 2015; Published: July 2, 2015.
DOI: 10.15376/biores.10.3.Pereira