Embed Size (px)
Citation preview

Gebauer/Matthews: MIS 213 Hands-on Tutorials and Cases, Spring 2015 iii
Table of Contents 1. Access Tutorial: Sales Reps ............................................................ 1
A. CREATING A DATABASE FILE IN ACCESS ........................................................1 B. CREATING TABLES IN ACCESS (Employees).....................................................3 C. SETTING A PRIMARY KEY FOR A TABLE ..........................................................6 D. SAVING YOUR TABLE ..........................................................................................7 E. CREATING OTHER TABLES (Branches, Sales) ...................................................7 F. CREATING RELATIONSHIPS IN ACCESS ...........................................................9 G. ENTERING DATA INTO YOUR TABLES ............................................................13 H. CREATING QUERIES IN ACCESS .....................................................................15 I. CREATING A SIMPLE SELECT QUERY (Select_Employees) ...........................16 J. CREATING A CRITERIA SELECT QUERY (Select_WILNC) ..............................18 K. CREATING A CALCULATED QUERY (CalcField_Commission) .........................20 L. CREATING A TOTALS QUERY (Totals_BranchSales) .......................................24 M. CREATING A PARAMETER QUERY (Parameter_SalesOnDate) .......................27
N. ADDITIONAL QUERIES (Select_Sales, Select_DateHired, Select_CHANCon4-2, CalcField_Bonus, CalcField_NewBasePay, Totals_NumberOfEmployees, Totals_AverageBasePay, Parameter_EmployeeLookup) .............................................................................29
O. CREATING FORMS IN ACCESS (BranchEmployees, EmployeeSales) .............36 P. CREATING REPORTS IN ACCESS (Select_Sales, SalesbyBranch) ..................39 Q. USING GROUPING, SORTING, AND TOTALS IN A REPORT (SalesByBranch)42 R. ADDITIONAL FORMATTING OF REPORTS (SalesByBranch) ...........................45 S. ANOTHER REPORT (SalesByEmployee) ...........................................................46 T. SUBMITTING YOUR ASSIGNMENT to Entropy ..................................................49
2. Access Case: Course Registration for Small University ............ 51
A. GETTING STARTED ............................................................................................51 B. SETTING UP THE TABLES (Courses, Students, Instructors, Sections, Registrations) .................................................................................................................51 C. BUILDING RELATIONSHIPS BETWEEN THE TABLES .....................................52 D. ENTERING THE DATA ........................................................................................53 E. CREATING FORMS (InstructorsSections, SectionsRegistrations) ......................55 F. CREATING QUERIES (SelectHealthy, Select_MIS213, CalcField_InStateTuition, CalcField_OutStateTuition, Totals_Numberstudents, TotalsExpression_SeatsRemaining) ..............................................................................56 G. CREATING REPORTS (CourseList, InStateTuitionSummary, OutStateTuitionSummary, StudentSchedules) ..............................................................62 H. UPLOADING TO ENTROPY ................................................................................65

Gebauer/Matthews: MIS 213 Hands-on Tutorials and Cases, Spring 2015 1
1. Access Tutorial: Sales Reps Purpose: To introduce you to databases and building your first Access database with tables, relationships, queries, forms, and reports. Within a business, there can be a large amount of data that needs to be managed. This data needs to be managed consistently and in such a way that it can be easily accessed, updated, and reviewed as needed. Databases allow a company to collect data in one central location. Databases consist of a collection of related objects. Typically, these objects are either tables, queries, forms, or reports. The following tutorial gives a brief introduction to each object and some of the characteristics and terminology for each. After completing this tutorial, you will have created your first database using Access.
A. CREATING A DATABASE FILE IN ACCESS 1. In Access, all objects for a database are stored in one file. This file should end with an .ACCDB
extension, which is reserved for Access Database files after version 2007.
To create a new database file, start by opening Access. Your screen should be similar to Figure 1-1. Unless you are given a database file to use and modify, you start with a Blank Database.
Figure 1-1: Starting screen for Access
2. Before you begin developing content for your database, you should choose a File Name and Location for storage. These details are located in the bottom right of the Access screen (Figure 1-2).

2 Gebauer/Matthews: MIS 213 Hands-on Tutorials and Cases, Spring 2015
Figure 1-2: Choose a File Name and Location for storing your database file.
To browse to a saving location, click the folder icon to the right of the File Name box and select a drive and directory that is easy to locate at a later date. We suggest you use your Timmy drive or a flash drive. Next, enter YourLastName-AccessTutorial.accdb as the file name. Finally, click the Create button to create your blank database file.
Once Access has created your file, you will see a screen similar to Figure 1-3.
Figure 1-3: Starting template for a blank database file in Access
NOTE: After creating a new file, you can browse to the location you chose to save your file. You should notice a new .ACCDB file. This file is your Access database. After you have closed Access, you can open this database by double-clicking this file. This is the best way to resume work within an already existing Access database.
3. Initially, Access will give a “starting Table”, but it is recommended that you close this table by right-
clicking on the tab labeled Table1 and selecting Close (Figure 1-4).
Figure 1-4: Closing a table

Gebauer/Matthews: MIS 213 Hands-on Tutorials and Cases, Spring 2015 3
B. CREATING TABLES IN ACCESS (EMPLOYEES) Tables generally represent a group of similar items. For example, you may have an Employees table that gives data about employees at your company. Tables are comprised of rows and columns. Each column within a table represents a single field of data. For example, one field may represent an employee’s first name. The collection of fields into a related group is called a record. Each row within a table represents a single record. For example, a record may represent one employee. This record will have many fields of data about a particular employee – employee id, first name, last name, date hired, etc. Tables will usually contain multiple records, each one containing data about individual items (employees in this example case). In order to be stored correctly, each field of data must have a data type. Table 1-1 shows the common data types you will be using in your Access databases. Table 1-1: Data Types in Access Data type Used for Example data Text Characters or words (letters, numbers, and symbols) Thomas
X60-MM Number: Long Integer Positive and negative whole numbers (with no
decimal) 47 -23390
Number: Double Positive and negative values with decimal parts -739.4 9.2454
Date/Time Valid date and time representations 3/2/2007 11/28/2003 9:00:00 AM
Currency Positive and negative values with two decimal places, used to represent money (includes $-sign)
$516,541.12 ($456.51)
AutoNumber Automated field value that counts starting at 1, each new record will have the next integer value (2, 3, 4, etc)
1 2
Yes/No Yes or No (also interpreted as True or False) Yes No
When creating a table, it is always important to choose the correct data type for each field. If all data for a specific field will represent money, Currency will be a good choice for a data type for that field. If any of the data for a field will require letters or words, Text will be the appropriate data type. With your Access database file open, notice the menu ribbon bar is displayed at the top of your Access window (Figure 1-5). This is where many of the options will be displayed that will allow you to create and modify objects within the database. You will be using several different tabs within this menu ribbon.
Figure 1-5: The top menu ribbon within Access 4. Before you are introduced to the other objects within Access, you must input data. As described at
the start of this section, data is input into tables within the database. Tables are created with several fields and data is entered into rows within the tables. Access contains two useful views for tables – Datasheet View and Design View. To start a new table, you should begin in Design View. This view allows you to see the field names you will be using and easily assign them an appropriate name and data type.

4 Gebauer/Matthews: MIS 213 Hands-on Tutorials and Cases, Spring 2015
Start a new table in Design View by choosing the Create tab from the menu ribbon and selecting the Table Design icon in the Tables section of the Create menu ribbon (Figure 1-6).
Figure 1-6: How to create a new table in Design View
In Design View, each line will represent an individual field. Field names should be descriptive of the data that will be stored in the field. The data types are available via a drop down. For this tutorial, you will first create a table to store employee data. You will need to anticipate the possible data used for each field and determine what data type to use for each field. This table will have the following seven fields: - EmployeeID - FirstName - LastName - DateHired - BranchID - BaseWeeklyPay - CommissionPercent NOTE: Be sure to name the fields EXACTLY as indicated in these instructions. Also note that the field names do not have spaces in them! Do not add data until you build all tables and relationships, these instructions are written in the order that you should perform the actions. This is important! Several of these fields require letters to represent the data; these should be of type Text. These fields are EmployeeID, FirstName, LastName, and BranchID.
5. In Design View, type the field name EmployeeID on the left and choose Text from the Data Type drop
down. You do not need to add a Description. Figure 1-7 shows the creation of EmployeeID. NOTE: Change the field size from 255 to 4 under Field Properties – this is explained in the next few paragraphs.
When you select a Data Type for a field, the bottom Field Properties panel will display several options. Depending on your data type, you may need to set a few options for the field. Text fields should have a Field Size set. The field size determines how many characters a field can use. The default is 255. For this tutorial, the following decisions have been made: - EmployeeID will always be 4 characters. (An example EmployeeID is 1227.) - FirstName can be restricted to no more than 30 characters. - LastName can be restricted to no more than 50 characters. - BranchID will always be 5 characters. (An example BranchID is WILNC.) Keep in mind that even though EmployeeID will be 4 digits, you should make the field Text instead of Number: Long Integer. The reasoning for this is two-fold. First, Text will store any leading zeros that may occur. For example, 0053 will be stored as 4 characters in a Text field, while the 00 will be dropped and only 53 will be stored as a Number: Long Integer field. Second, Number types should really only be used if arithmetic will be performed on the field values. You will never add or multiply EmployeeID values, so there is no need to store these as data type Number. Calculations will be discussed more in depth when queries are introduced.

Gebauer/Matthews: MIS 213 Hands-on Tutorials and Cases, Spring 2015 5
Figure 1-7: Setup for field EmployeeID in table Employees
6. Continue the setup for the fields of the table Employees using Figure 1-8 as a guide. Don’t forget to
set appropriate field sizes for text fields as shown above. Field sizes only have to be set for text fields.
Figure 1-8: Setup for all fields in table Employees As a final note on data types, when setting up a field of data type Number, pay attention to the Field Properties at the bottom of your screen. Depending on your desired data, you may need to configure the properties. The default size for a Number is Long Integer. Remember that integers are WHOLE numbers and CANNOT contain a decimal part. For CommissionPercent in this setup, decimal representations of the percentage are needed. To allow decimal places, you should use the Double setting for Field Size of the Number field. Figure 1-9 shows the Field Properties for CommissionPercent.

6 Gebauer/Matthews: MIS 213 Hands-on Tutorials and Cases, Spring 2015
Figure 1-9: Setup for field CommissionPercent (table Employees)
C. SETTING A PRIMARY KEY FOR A TABLE Before saving your table, you need to designate a primary key. A primary key is a field in the table whose value can distinguish a record from all other records. Primary keys must be UNIQUE. No two records can share the same primary key value. Primary keys also cannot be NULL (blank or empty). Primary key fields MUST contain a value before the record can be created. 7. Looking at the table Employees, every field should be analyzed to determine the primary key.
Immediately, some fields can be ruled out as NOT unique. DateHired, BranchID, BaseWeeklyPay, and CommissionPercent will most likely NOT be unique. Different employees can share these details. These cannot be the primary key. FirstName will most likely not be unique as well and should not be the primary key. Many people make the mistake of creating fields such as LastName as the primary key. This is not a good idea because once a value is used for a record, it cannot be reused. When you are entering data for employees, two employees may have the same last name – Smith for example. To be a primary key, the value MUST BE UNIQUE for every record. LastName is not a good primary key candidate. Sometimes selecting a primary key can require a bit of forethought – you must anticipate possible future data that “could” be used throughout the lifetime of a database.
In the table Employees that you just created, Employee ID is the only field that is guaranteed to be unique and not null. This will be the primary key. Create a primary key on the field EmployeeID in the table Employees. To do this, select the small gray square to the left of the field name EmployeeID. This will highlight this field. Now click the Design tab in the menu ribbon. Select the Primary Key button in the Tools section of the Design menu ribbon. A small key will be placed next to the highlighted field. Figure 1-10 shows this process.
Figure 1-10: Setting a primary key within a table

Gebauer/Matthews: MIS 213 Hands-on Tutorials and Cases, Spring 2015 7
Good to know: Some tables require more than one field as a primary key. This is known as a compound key. With a compound key, the combination of the data in all fields selected must be unique and not null. To create a compound key, you must select all fields of interest. To do this, you would first click the gray square to left of the first field. Then – on your keyboard – press and hold the CTRL key and click the gray square to the left of the second field. You can continue this process until all desired fields are highlighted. Then you can select the Primary Key button in the Design menu ribbon just as above. This tutorial does not require any compound keys, but you may see them in future cases and assignments.
D. SAVING YOUR TABLE 8. After setting up your fields and designating a primary key, you can now save your table.
Save your table by clicking the Save icon located in the extreme top left of your screen. You should get a popup asking for the name of the table. The table name should be descriptive of the types of record within the table. This is a table where every record represents an employee, so name it Employees. Figure 1-11 shows the save dialog you will see.
Figure 1-11: Save dialog for table Employees
After saving the table, notice the left panel of Access that now shows Employees listed under the heading Tables. This panel lists all Access Objects (tables, queries, forms, and reports). As you create new objects, they become visible in this panel. Looking back to the table Design View on the right, you can right-click the Employees tab and choose Close to close the table. You have successfully created your first table.
E. CREATING OTHER TABLES (BRANCHES, SALES) 9. Create a table named Branches with the following 3 fields:
- BranchID will be 5 characters. - City should be no more than 100 characters. - State should be 2 characters.
You should be able to determine the appropriate data types for each field given. Remember to set the appropriate Field Properties when needed. In addition, each table needs to have a primary key. You should be able to determine which field should be the primary key. Use Figure 1-12 as a guide.
10. Using Figure 1-13 as a guide, create a table named Sales with the following 4 fields: - SaleID should be automatically generated. - EmployeeID will be 4 characters. - DateOfSale (HINT: This is a date.) - Amount (HINT: This is money.)
8 Gebauer/Matthews: MIS 213 Hands-on Tutorials and Cases, Spring 2015
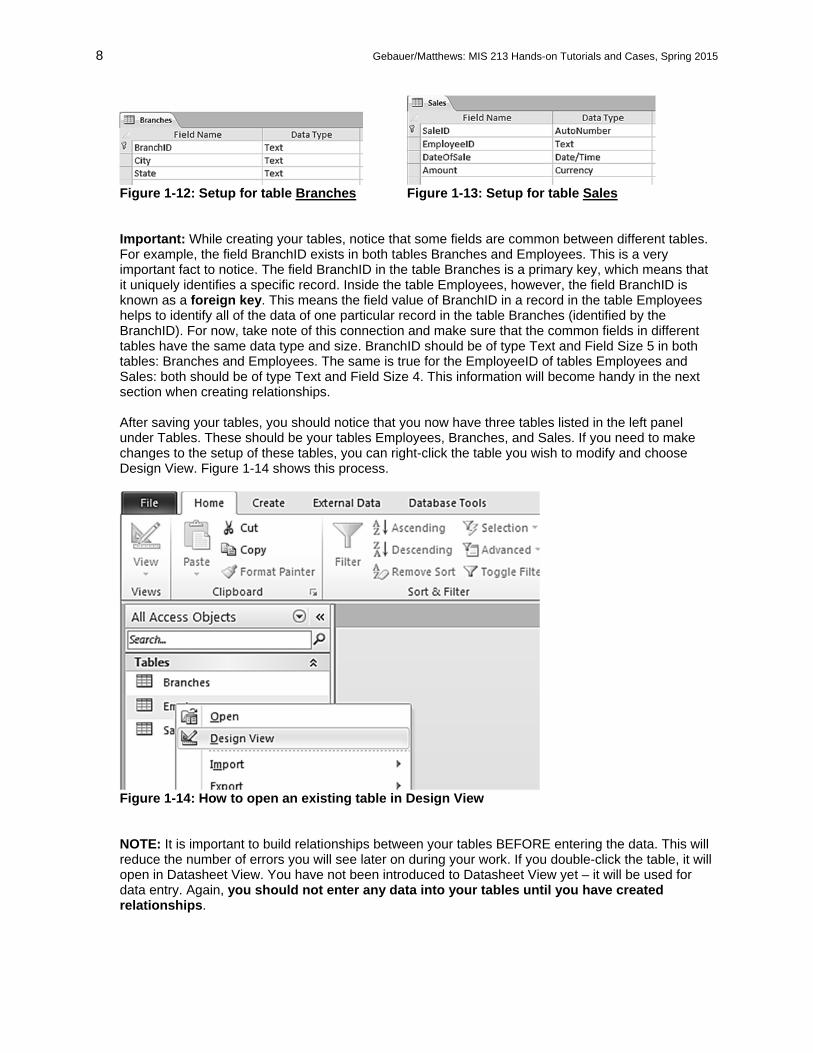
Figure 1-12: Setup for table Branches Figure 1-13: Setup for table Sales
Important: While creating your tables, notice that some fields are common between different tables. For example, the field BranchID exists in both tables Branches and Employees. This is a very important fact to notice. The field BranchID in the table Branches is a primary key, which means that it uniquely identifies a specific record. Inside the table Employees, however, the field BranchID is known as a foreign key. This means the field value of BranchID in a record in the table Employees helps to identify all of the data of one particular record in the table Branches (identified by the BranchID). For now, take note of this connection and make sure that the common fields in different tables have the same data type and size. BranchID should be of type Text and Field Size 5 in both tables: Branches and Employees. The same is true for the EmployeeID of tables Employees and Sales: both should be of type Text and Field Size 4. This information will become handy in the next section when creating relationships. After saving your tables, you should notice that you now have three tables listed in the left panel under Tables. These should be your tables Employees, Branches, and Sales. If you need to make changes to the setup of these tables, you can right-click the table you wish to modify and choose Design View. Figure 1-14 shows this process.
Figure 1-14: How to open an existing table in Design View
NOTE: It is important to build relationships between your tables BEFORE entering the data. This will reduce the number of errors you will see later on during your work. If you double-click the table, it will open in Datasheet View. You have not been introduced to Datasheet View yet – it will be used for data entry. Again, you should not enter any data into your tables until you have created relationships.

Gebauer/Matthews: MIS 213 Hands-on Tutorials and Cases, Spring 2015 9
F. CREATING RELATIONSHIPS IN ACCESS 11. Before moving on, you must close all open tables. If you have tables open, right-click each table tab
and select Close. Figure 1-15 shows this process:
Figure 1-15: Close all tables before working on relationships
12. Once you have built all three tables, you can now tell the tables how to “share” data. Remember the concept of a foreign key. When a foreign key is provided, we can then “share” specific data between tables. This concept is known as a relationship. Relationships are created on common fields – fields that represent the same type of data. A relationship will exist on a field that is a primary key in one table and a foreign key in another table. To create the relationships between tables, you will create a relationship diagram. This diagram shows which tables are connected and on what fields. A relationship diagram is a graphical way to illustrate the relationships within a database.
Start building a relationship diagram in your database. To do this, select the Database Tools menu ribbon and click the Relationships icon in the Relationships section (Figure 1-16).
Figure 1-16: How to open the relationship diagram to build relationships
13. After clicking the Relationships icon, you should see a popup labeled Show Table (Figure 1-17). If
you do not see this popup, click the Show Table icon in the Design menu ribbon. This popup lists all of the tables you have created (Branches, Employees, and Sales).
Add all three tables to your diagram. Do so for each table by first clicking the table name to highlight it and then clicking the Add button. You may also double-click the table name to automatically add it to the diagram. As you add a table, you will see it in the background relationship diagram. If needed, move the popup in order to see the tables that you have already added.

10 Gebauer/Matthews: MIS 213 Hands-on Tutorials and Cases, Spring 2015
Figure 1-17: Table dialog for relationships Once you have added all three tables, click Close to view the diagram. Your screen should look like Figure 1-18.
Figure 1-18: Relationship diagram after adding all three tables
You should notice that the relationship diagram displays the tables and the field names you have created. In addition, you can see which fields you have selected as the primary keys. You can resize the tables individually in the diagram if you want to see more or less. 14. To create relationships, you need to determine which fields are in common between two tables. For
example, the field BranchID exists in both the table Branches and the table Employees. This is a field where a relationship should exist. A relationship will exist on a field that is a primary key in one table and a foreign key in another table. If you create a relationship on the field BranchID, then the table Branches can “share” data with the table Employees via this common field.
To create a relationship between the common field BranchID in the table Branches and in the table Employees, please do the following: Click and hold your mouse button above BranchID in the table Branches. Drag and release the mouse button on top of the field BranchID field in the table Employees. Please note that it is very important to connect the COMMON fields. You should get a popup with settings like Figure 1-19.

Gebauer/Matthews: MIS 213 Hands-on Tutorials and Cases, Spring 2015 11
Figure 1-19: Relationship settings between tables Branches and Employees Notice that there are two columns in the settings popup. Please, verify that the two tables of interest (Branches and Employees) are listed. In addition, make sure that the Field selected in the drop downs is the common field (BranchID). If the data does not match what you expect, you may Cancel the popup and try again or manually change the drop down selections. From here, you also want to select Enforce Referential Integrity. Referential integrity means that a record must exist in the primary table (left column of the popup) BEFORE it can be used in the secondary table (right column of the popup). For this example, a record with a particular BranchID value (e.g., WILNC) must be created in the table Branches BEFORE that BranchID can be used in a record in the table Employees. All of your relationships should enforce referential integrity because this will prevent typos and other problems when entering data into the tables. Also take note of the Relationship Type at the bottom of the popup. Based on your table setup, Access will automatically determine the relationship type for your relationships. This will be One-To-Many, One-To-One, or Many-To-Many. NOTE: While creating relationships, you may encounter the popup shown in Figure 1-20. If you get this error, Cancel all popups and go back to step 11 to close all open tables. You cannot create relationships unless all tables are closed first.
Figure 1-20: Error received if tables are open when attempting to create relationships.
15. Once you have checked your data and selected Enforce Referential Integrity, you can click Create to
create the relationship. Your diagram should now resemble Figure 1-21.

12 Gebauer/Matthews: MIS 213 Hands-on Tutorials and Cases, Spring 2015
Figure 1-21: Relationship diagram showing relationship between tables Branches and Employees Notice the line drawn between the tables Branches and Employees. The line should begin and end on the BranchID fields. Also notice the symbols used. These represent the Relationship Type for this specific relationship. If you do not see the symbols on your lines, go back to make sure you have checked Enforce Referential Integrity. To edit a relationship, right-click on the line created. It can be hard to get just on the line with your mouse cursor. Once you have selected the relationship, you see two options: Edit Relationship and Delete. Figure 1-22 shows the proper options for altering a relationship that has already been created. To remove the selected relationship, chose Delete. To see the settings popup again, choose Edit Relationship.
Figure 1-22: Options displayed after right-clicking on an existing relationship
16. Create another relationship between the tables Employees and Sales. Remember to use the common
field and to select Enforce Referential Integrity in the setup. Your finalized relationship diagram for this tutorial should look like Figure 1-23.
Figure 1-23: Relationship diagram for this database
17. To finish, click the Close button in the Design menu ribbon. You should be prompted to save. Choose
Yes. Only one relationship diagram can be created for a database – you do not have to name your database diagram. See Figure 1-24.

Gebauer/Matthews: MIS 213 Hands-on Tutorials and Cases, Spring 2015 13
Figure 1-24: Saving and closing the relationship diagram
G. ENTERING DATA INTO YOUR TABLES 18. Remember that there are two useful views within Access for viewing your tables. For creating tables,
Design View is used. Once a table has been created, you will generally want to view your table using Datasheet View. This is the default view when opening a table. If you locate a table on the left panel of Access and double-click the name, the table will open in Datasheet View. Open the table Branches in Datasheet View (Figure 1-25).
Figure 1-25: Table Branches in Datasheet View
Notice that the field names you created are now listed as column headings in Datasheet View. Remember, each row within a table represents one record. In the table Branches, each row (=record) is designed to contain values for the fields BranchID, City, and State of one specific branch.
19. Begin your data entry by typing the field values displayed in Figure 1-26. To move between the
different fields/columns, you can use the Tab key on your keyboard. Once you have reached the end of a record, you will be automatically moved to a new record.
Figure 1-26: Data for the table Branches NOTE: Changes made to the data in Datasheet View are AUTOMATICALLY saved once you move to another record. You do not have to continually click the Save icon. As long as the asterisk (*) appears

14 Gebauer/Matthews: MIS 213 Hands-on Tutorials and Cases, Spring 2015
to the left of the record, the record is in Edit mode. If you make a mistake in Edit mode, you can press the ESC key on your keyboard to cancel the current edits.
20. Enter the data for the table Employees as shown in Figure 1-27. Please, note that BranchID is a
foreign key field in the table Employees that is related with the primary key field BranchID in the table Branches. Since you created the records in the table Branches first (#19), you can now refer to them by entering appropriate values into the field BranchID in the table Employees. During data entry, you may notice that you can only enter values for BranchID in the table Employees that also exist in the table Branches. Any typos or unrecognized field values will trigger an error message and need to be corrected before you can move on to the next record. This is a direct result of enforcing referential integrity during relationship definition (#14, Figure 1-19).
While entering data, notice also how the data type selections you made while creating your table designs come into play. EmployeeID will only allow you to enter 4 characters. DateHired is formatted as a date (2/5/2001), BaseWeeklyPay is formatted as Currency, BranchID will only allow you to enter 5 characters, and CommissionPercent allows decimal places. This is why it was important to spend time learning the different data types and their specific limitations and uses.
Figure 1-27: Data for the table Employees
21. Finally, enter the data for the table Sales as shown in Figure 1-28. Notice that you do not have to
(and actually cannot) enter any values into the field SaleID. The data type of this field is set to be AutoNumber, which automatically increments field values starting with 1. If you make an error and delete a record, AutoNumber may skip a number in the sequence, which you can do nothing about. So, please do not worry if the values in your field SaleID differ from Figure 1-28. Everything else should match, however.

Gebauer/Matthews: MIS 213 Hands-on Tutorials and Cases, Spring 2015 15
Figure 1-28: Data for the table Sales (values in the field SaleID are generated automatically and may vary)
H. CREATING QUERIES IN ACCESS Data stored in tables is often relatively useless on its own. The power of a database lies in its ability to share this data (through relationships), and answer questions or show information based on the data. The way to answer a question with a database is by creating a query (pronounced “kweer-ee”). A query is basically a repeated question: once a query is set up, it can be executed over and over. Each execution collects and manipulates the most recent data from the tables in the database, and supplies a set of result records. From the tables Branches, Employees, and Sales that you have already created, possible questions a company may be interested are: - Which employees are at the Wilmington branch? - Who in the company has worked here for over 10 years? - Which employees make a commission rate above 3%? - What are the total overall sales for each branch? - How many sales are made each day? - What are the full details of a specific sale? As you can see, the answers to these questions may be different today than they will be tomorrow, next week, or next month. Every time you run a query, it supplies you with the most recent answers. Queries are created by using existing fields and tables. In a query you can reorganize the data, perform arithmetic calculations, and determine totals, such as Sum, Average, etc. In Access, you can build queries with an interactive system known as query by example (QBE). QBE makes it easy to manipulate existing tables and extract the data needed to answer particular questions. 22. Like for tables, Access also contains two useful views for queries – Datasheet View and Design
View. To start a new query, you should begin in Design View. This view allows easy manipulation of existing tables and fields. Design View provides the QBE method to build queries.
Please, start a new query by choosing the Create tab from the menu ribbon and select the Query Design button within the Queries section of the Create menu ribbon (Figure 1-29).

16 Gebauer/Matthews: MIS 213 Hands-on Tutorials and Cases, Spring 2015
Figure 1-29: How to create a new query in Design View
Once you have created the query, you should immediately see a prompt labeled Show Table. This is the same prompt that you used when creating your relationships (Figure 1-16). The prompt should list all tables within the database (Branches, Employees, and Sales). Unlike for the relationships, however, you SHOULD NOT add all tables for every query. Before you can determine which tables to use, you must think about what data you need. In the next part of this tutorial, we presented you with a series of example queries to help you get familiar with the query Design View in Access.
I. CREATING A SIMPLE SELECT QUERY (SELECT_EMPLOYEES) Example Query 1 (Select_Employees): What are the names and employee IDs of all employees? 23. To answer this question, we will create a query that displays the values for EmployeeID, LastName,
and FirstName of all employees. This data should be sorted in alphabetical order by last name. Keep reading for details on how to create this query. This is a simple select query. In a simple select query, you are not manipulating data; you are just displaying the data in a specific order or view.
The first step in creating a query is to determine what tables are needed to answer the question. We note that the fields LastName and FirstName only appear in the table Employees, so we will definitely need the table Employees for the query. Add the table Employees using the Show Table popup.
EmployeeID is a field in both tables Employees and Branches. A good rule when adding tables to the query designer is to include the FEWEST tables that still provide all the fields needed. We note that all 3 fields needed for this query are available in JUST the one table Employees. As a result, we do not need to add the other tables Branches or Sales to the query, and after adding the Employees table to the query, you can close the Show Table popup. You should see a screen similar to Figure 1-30. This is where you will manipulate your query fields.
Figure 1-30: Design View for first query Select_Employees with table Employees added

Gebauer/Matthews: MIS 213 Hands-on Tutorials and Cases, Spring 2015 17
24. The next step is to add the desired fields to your query. In the top half of the Design View, find the fields you are interested in and double-click them. This will add each field – in order – to the bottom panel. This bottom panel determines what data will be output when this query is executed.
Add EmployeeID, LastName, and FirstName to the query to be displayed. Each field should display in its own column in the bottom panel of the Design View. When you are finished, your bottom panel will look like Figure 1-31.
Figure 1-31: Design View for first query Select_Employees after adding desired fields Only the fields displayed at the bottom of the Design View can be displayed when the query is executed. If you wish to hide a selected field, please uncheck the Show box for that particular field. In addition, you can use the drop down available to change Field and Table selections in the bottom panel.
25. During execution, query results are sorted by default in ascending order (smaller to larger) from left to right. This means our query will be sorted ascending by EmployeeID (low numbers to high numbers). For this query, however, we want to sort by LastName and we want the sort to be alphabetical. To change the default sort, we use the Sort line in the Design View. Alphabetical (A-Z) is considered ascending order (A is LOWER than Z).
Change the sort for LastName to be Ascending. Leave the other sort values blank. Your completed Design should look like Figure 1-32.
Figure 1-32: Design View for first query Select_Employees after adding sort
26. View the results that this query will display. To do so, click the Run icon in the Results section of the
Design menu ribbon. This is shown in Figure 1-33.
Figure 1-33: Use the Run icon to execute a query You should see the results shown in Figure 1-34.
18 Gebauer/Matthews: MIS 213 Hands-on Tutorials and Cases, Spring 2015
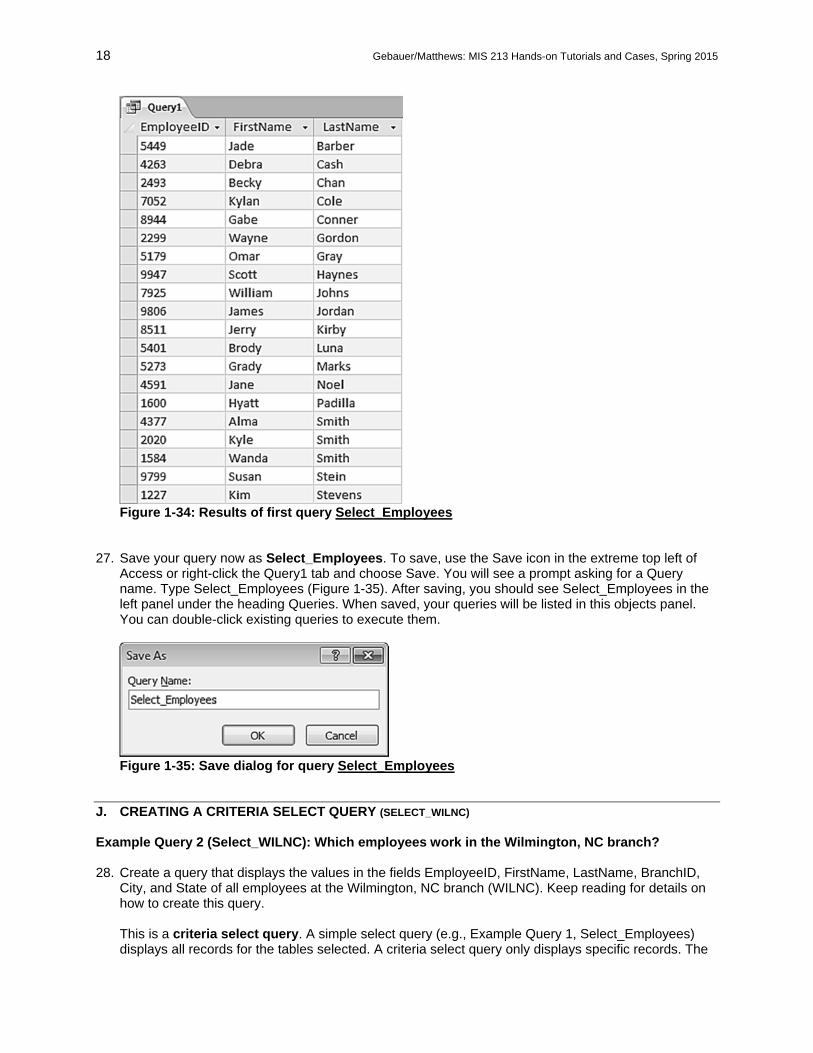
Figure 1-34: Results of first query Select_Employees
27. Save your query now as Select_Employees. To save, use the Save icon in the extreme top left of
Access or right-click the Query1 tab and choose Save. You will see a prompt asking for a Query name. Type Select_Employees (Figure 1-35). After saving, you should see Select_Employees in the left panel under the heading Queries. When saved, your queries will be listed in this objects panel. You can double-click existing queries to execute them.
Figure 1-35: Save dialog for query Select_Employees
J. CREATING A CRITERIA SELECT QUERY (SELECT_WILNC) Example Query 2 (Select_WILNC): Which employees work in the Wilmington, NC branch? 28. Create a query that displays the values in the fields EmployeeID, FirstName, LastName, BranchID,
City, and State of all employees at the Wilmington, NC branch (WILNC). Keep reading for details on how to create this query.
This is a criteria select query. A simple select query (e.g., Example Query 1, Select_Employees) displays all records for the tables selected. A criteria select query only displays specific records. The

Gebauer/Matthews: MIS 213 Hands-on Tutorials and Cases, Spring 2015 19
records displayed must match given criteria on certain fields. For this query, you will show values ONLY for employees at the Wilmington branch. To accomplish this, you set up the query to select only the records where WILNC is listed as the value in the BranchID field.
Create a new query in Design Mode. Determine which tables are required to create this query and add them.
EmployeeID, FirstName, and LastName exist as field names in the table Employees. BranchID is a field in both tables Employees and Branches. City and State are fields only contained in the table Branches. So, this query requires the two tables Employees and Branches. Once you have added these two tables through the Show Table popup and have closed the popup, you see a screen similar to Figure 1-36. If you have set up your relationships as described earlier in this tutorial, you can see a line connecting the field BranchID in the table Employees with the field BranchID in the table Branches.
Figure 1-36: Design View for second query Select_WILNC after adding required tables
29. Add the required fields from the tables to the query Design View. Remember, you can double-click
each field to do this. You should select the fields in the order you wish them to be displayed. Choose EmployeeID, FirstName, LastName, BranchID (doesn’t matter which one, but typically you should choose the “root” table: Branches), City, and State. Your bottom panel should look like Figure 1-37.
Figure 1-37: Design View for second query Select_WILNC after adding required fields
To create a criteria select query, you utilize the Criteria option in the bottom panel of the query Design View. Typically, you use a comparison for your criteria. Comparisons can come in many different forms. The simplest forms are equal, not equal, greater than, less than, greater than or equal to, or less than or equal to. The symbols used for each of these comparisons are shown in Table 1-2. If no comparison symbol is used, equality is assumed. NOTE: When doing comparisons with Text (i.e., characters like letters), you should surround the phrase with quotes (Example: “Bob”). When using Dates, you should surround the date with hash tags (Example: #1/21/2004#).

20 Gebauer/Matthews: MIS 213 Hands-on Tutorials and Cases, Spring 2015
Table 1-2: Symbols used for comparisons in Access Comparison Symbol Example Usage Equal to = = 47
= “Bob” = Yes = #1/21/2004#
Not equal to <> <> -1 <> “Blue” <> No <> #12/31/2012#
Greater than After (with dates)
> > 0 > 50000 > #1/1/2012#
Less than Before (with dates)
< < 0 < 100 < #1/1/2000#
Greater than or equal to On or after (with dates)
>= >= 0 >= 500 >= #1/1/2012#
Less than or equal to On or before (with dates)
<= <= 0 <= 250000 <= #12/31/1999#
30. Add criteria under the field BranchID to require it to be equal to WILNC. Your Design View will look
like Figure 1-38.
Figure 1-38: Design View for second query Select_WILNC after adding criteria
31. Run your query. Your results should match Figure 1-39. Save this query as Select_WILNC.
Figure 1-39: Results of second query Select_WILNC
K. CREATING A CALCULATED QUERY (CALCFIELD_COMMISSION) Sometimes, the questions you wish to answer require more than just reading data values from tables. For example, in our case, employees are paid a commission for each sale. The dollar amount of each commission payment depends on the commission percent that each employee is entitled to and the

Gebauer/Matthews: MIS 213 Hands-on Tutorials and Cases, Spring 2015 21
amount of the sale (in $). Yet, there is no field in any of our tables that shows the dollar amount of each commission payment. So, in order to answer the question about what commission is paid out for each sale we can manipulate the data by defining a new field as part of a query1. In other words, we use the values in one or more data fields that do exist in the tables (namely commission percent and amount of sale) to determine the values of a new field (namely the commission value in $ for each sale). The new field is called a calculated field; the query that includes it is called a query with a calculated field or calculated query for short. To calculate new field values in a query, you can perform various arithmetic operations on existing field values. The simplest arithmetic operations are add, subtract, multiply, and divide. Table 1-3 shows the operation symbols that you can use to construct a formula that calculates the needed values for a query. Please, note that the standard order of operations used in mathematics principles applies. Therefore, you may need to use parenthesis to ensure that you build a formula correctly. Table 1-3: Symbols used for simple arithmetic operations in Access Operation Symbol Example Usage Add + [BaseWeeklyPay] + 500 Subtract - [HourlyPay] - 1.25 Multiply * [CommissionPercent] * [Amount] Divide / [AnnualSalary] / 52 Operations can be performed with numbers or with field references. Notice in the examples that if you are using a field reference in a formula, the field name should be surrounded by square brackets (e.g., [BaseWeeklyPay]). In addition, the field name MUST match spelling. If you misspell a field reference, Access will not be able to find the field you need and produce an error message when running the query. Example Query 3 (CalcField_Commission): What is the commission value for each sale? 32. Create a query that shows SaleID, Amount, and Commission for all sales records. Commission
should be a calculated field: it is calculated by multiplying the CommissionPercent of the employee who made the sale by the Amount of the sale. Sort the results in Ascending order by SaleID. Keep reading for details on how to create this query.
To begin, let’s determine the formula for the calculation. To calculate the commission value, we take the value CommissionPercent in the table Employees and multiply it by the value Amount in the table Sales. So, we already know that we need those two tables. In addition, SaleID and Amount are both in the table Sales. It turns out that for this query we will not need the table Branches, just the tables Employees and Sales.
Create a new query in Design Mode. Add the two required tables for this query.
33. Access requires you to type the formula for the calculated field manually, which we will do shortly. For
now, add the first two NON-calculated fields as you normally would by double-clicking the field names in the table. You can also add the sorting as required. To create more room for the upcoming calculated field, please expand the third column. Your Design View should look like Figure 1-40.
1 Manipulation in the context of a calculated field does NOT mean that we change any data values in the tables in our database. It merely refers to the data values that we use and display in our QUERIES and that may now be different from the data values that are in the tables.

22 Gebauer/Matthews: MIS 213 Hands-on Tutorials and Cases, Spring 2015
Figure 1-40: Design View for third query CalcField_Commission after adding required tables, fields, and sorting
34. The formula for the calculated query is [CommissionPercent] * [Amount]. Remember: Field Names
should be surrounded by square brackets2 and MUST be spelled correctly.
Manually type the formula for Commission into the third column of the Design View. After typing the formula, press the Enter key on your keyboard.
You should notice that the column is now filled with the following:
Expr1: [CommissionPercent] * [Amount]
Every column must have a name. Since this field is not recognized as an already existing field name, it must be given a name. If you do not designate a name to your field, Access will assign a random name, e.g., Expr1.
35. Rename the column that you created to read Commission. To do this, replace Expr1: with
Commission. You MUST keep the colon in order for the renaming to work correctly. Your Design View should look like Figure 1-41.
Figure 1-41: Design View for third query CalcField_Commission after adding the calculated field and renaming it
2 Square brackets are mandatory for field names that contain blanks (spaces).

Gebauer/Matthews: MIS 213 Hands-on Tutorials and Cases, Spring 2015 23
36. Figure 1-42 partially shows the query results after you click the Run button. Notice that the field Commission is not yet formatted as currency.
Figure 1-42: Results from running third query CalcField_Commission before formatting Commission field
To format the query field Commission, go back to Design View and then alter the field properties as follows: Right click on the column you wish to format and select Properties. You should notice a panel named Property Sheet on the right of your screen (Figure 1-43). Under the General tab, locate the Format option and choose Currency from the drop down. This will add the $ symbol and 2 decimal places to the selected field. This must be done in Design View.
Figure 1-43: Property Sheet panel for query Design View After changing the Field Properties, you can leave the Property Sheet panel open or you may close it by clicking the small X in the top right corner of the panel.
37. Run your query. Your results should match Figure 1-44. Save this query as CalcField_Commission.
Figure 1-44: Results of third query CalcField_Commission

24 Gebauer/Matthews: MIS 213 Hands-on Tutorials and Cases, Spring 2015
L. CREATING A TOTALS QUERY (TOTALS_BRANCHSALES) Some queries require more than a calculation for each record. Many questions related to data within a database require some type of aggregation. In other words, it may be necessary to summarize the data from multiple records into a group. This type of query is known as a totals query. The common functions of totals queries include: Sum, Average, Minimum, Maximum, and Count. You may be able to identify the need for a totals query by the phrasing of the question you are trying to answer. Table 1-4 gives examples of common phrases for each type of totals query. Please, note that totals queries group a collection of similar records together and display one total or summary value for the entire group, rather than providing individual values for each record. Table 1-4: Common phrases for totals queries Function Example Phrases Sum What is the total…?
How much…? Average What is the average…?
On average, how much…? Minimum What is the least…?
Identify the lowest… Maximum What is the highest…?
Identify the most… Count How many…?
Determine the number of… Totals queries require activating a part of the query Design View that does not show by default. Example Query 4 (Totals_BranchSales): What are the total sales for each branch? 38. Create a query that shows BranchID, City, State, and TotalSales. TotalSales will need to be a
summary field based on the collection of sales records at each branch. In order to answer this question, you will need to create a totals query. Keep reading for details on how to create this query. To determine TotalSales, you will want to add together the Amount value of each sale at a particular branch. You need to group records by their branch in order to perform this accumulation. To begin, create a new query in Design Mode.
First, you must determine what tables are required for the query: BranchID, City, and State are in the table Branches; Amount (to be used for TotalSales) is in the table Sales. When you add these two tables, you should notice that they are NOT connected, meaning that there are no common fields or defined relationships. So, before setting up the query details, these tables need to be linked in some way: Remember that each record in the table Sales includes an EmployeeID. Also, each record in the table Employees includes a BranchID. This means that if we add the Employees table, there will be a link from Branches to Sales (via Employees). You may want to reorder your tables in the designer to better see the flow of data. After adding all tables, your Design View should look like Figure 1-45.
Figure 1-45: Design View for fourth query Totals_BranchSales after adding required tables

Gebauer/Matthews: MIS 213 Hands-on Tutorials and Cases, Spring 2015 25
NOTE: If you have already closed the Show Table popup and need to add additional tables, you can click the Show Table icon in the Query Setup section of the Design menu ribbon.
39. Add the fields required for the query to the Design View by double-clicking them: include BranchID,
City, State, and Amount. Your Design View should look like Figure 1-46. Next you will be modifying the query to allow totals, which will alter the Amount field.
Figure 1-46: Design View for fourth query Totals_BranchSales after adding required fields
40. Before you can get the total of the sales amounts for each branch, you need to provide some grouping of records. To designate this query as a totals query, click the Totals icon in the Show/Hide section of the Design menu ribbon (Figure 1-47).
Figure 1-47: The Totals icon in the Design menu ribbon
Notice that you have a new line available in the bottom panel of the Design View. This line is labeled Total. The new Query Design panel is shown in Figure 1-48.
Figure 1-48: Design View for fourth query Totals_BranchSales after designating the query as a totals query
Notice that every field chosen in the Design View now says Group By as the selection for the Total line. The power of the totals query comes from the ability to group based on records with the same value for designated fields. For this query, you will want to group all sales that have the same BranchID, City, and State, so these 3 fields should remain as Group By for the Total selection. The field that is “different” is Amount where we want to obtain the sum of all the sales. Figure 1-49 shows the drop down selections for the Total line of the query designer. To get the Total Sales, you need to ADD all of the Amounts of the sales. This is a Sum.

26 Gebauer/Matthews: MIS 213 Hands-on Tutorials and Cases, Spring 2015
Figure 1-49: Selections provided for Total option in Design View
41. Create a Sum on the field Amount by choosing Sum from the drop down that is provided in the Total-
row. Your Design View should look like Figure 1-50.
Figure 1-50: Design View for fourth query Totals_BranchSales after setting the appropriate total for the field Amount
42. After you run the query as is, notice the column headings (Figure 1-51). Like with calculated field
names, Access gives totals fields a new name. For the fourth field here, Access has named it SumOfAmount. Instead of this, we want to rename the field to TotalSales.
Figure 1-51: Field names before renaming the Totals-field To rename a field, you must use the following format in the top line in Design View: DesiredName: [FieldName] There are several key notes about this format.
- The desired field name comes first. In this query, our desired name is TotalSales. - After the desired field name, you MUST include a colon (:). Without this colon, Access will not
know that you want to rename the field. - All previously existing field names MUST be spelled exactly the same way as in the tables. A
misspelling will result in error messages during query execution. In Design View, rename the fourth field TotalSales. You may need to extend the width of the column to see its entire contents. When finished, your Design View should look like Figure 1-52.
Figure 1-52: Design View for fourth query Totals_BranchSales after renaming fourth column

Gebauer/Matthews: MIS 213 Hands-on Tutorials and Cases, Spring 2015 27
43. Run your query. Your results should match Figure 1-53. Save this query as Totals_BranchSales.
Figure 1-53: Results of fourth query Totals_BranchSales
M. CREATING A PARAMETER QUERY (PARAMETER_SALESONDATE) If the answer to a question depends on input provided by the user who runs the query, you can create a parameter query. A parameter query allows new data to be included in the query when it is executed. For example, you may want to know the details of all sales on a specific date. Instead of creating a query for every conceivable date up-front, you can create a parameter query that allows looking up sales records “on the fly”. Example Query 5 (Parameter_SalesOnDate): What are the details for sales that occurred on - - / - - / - - - -? 44. Create a query that shows DateOfSale, SaleID, Amount, EmployeeID, LastName, and BranchID for
sales on a specific, user-defined date. This will require a parameter query that prompts the user for the DateOfSale to be used when running the query. Keep reading for details on how to create this query.
Create a new query in Design Mode. Add the required tables for this query. Your Design View should look like Figure 1-54.
Figure 1-54: Design View for fifth query Parameter_SalesOnDate after adding required tables
45. Add the required fields for this query. Your Design View should look like Figure 1-55.
Figure 1-55: Design View for fifth query Parameter_SalesOnDate after adding required fields

28 Gebauer/Matthews: MIS 213 Hands-on Tutorials and Cases, Spring 2015
46. If you were to run the query at this point, you would see ALL sales records. You need to restrict the DateOfSale to a specific date. If this value were known, you could create a criteria select query that used the value given. Since the value will be given DURING execution of the query, you must provide a parameter. This will pause the query during execution and wait for the user to enter in a value. Keep reading for details on how to create a parameter.
Parameters are created using square brackets in the Criteria line of the Design View. This will signal Access to provide a popup prompt to the user with a message that you supply. The format of your parameter is as follows: =[Message user will see during execution] Modify the message within the square brackets to fit the query that you are building. Remember, this parameter should be placed in the Criteria line of the field that you want to restrict. Also, keep in mind that parameters – like any criteria – can use any of the comparison symbols listed in Table 1-2. In this case, we use equal to. Also remember that if no comparison symbol is used, equality is assumed. NOTE: Since parameters are formed with square brackets AND field references are also formed with square brackets, you CANNOT use a parameter that has a message that is the same as an existing field name. It’s good practice to format your parameter message as a question. At minimum, you could just add a question mark to an existing field name for your parameter. Example: =[DateOfSale?]. While this will work, a better parameter would be =[What date?]. Add a parameter to restrict the records displayed to a specific DateOfSale. To do this, enter criteria for DateOfSale to prompt the user for a date. Your Design View will look like Figure 1-56.
Figure 1-56: Design View for fifth query Parameter_SalesOnDate after adding parameter
Every time you run this query, you will notice a prompt that displays the message you typed in your parameter (Figure 1-57). The results of the query depend on the date that is supplied by the user.
Figure 1-57: Prompt displayed when executing fifth query Parameter_SalesOnDate
47. Run your query. If you type in 4/2/2012 when prompted for the date, your results should match Figure
1-58. If you type in 4/4/2012 when prompted for the date, your results should match Figure 1-59. Save this query as Parameter_SalesOnDate. NOTE: This is ONE query – NOT two separate queries! The output depends on the value given for the parameter – that may change each time.

Gebauer/Matthews: MIS 213 Hands-on Tutorials and Cases, Spring 2015 29
Figure 1-58: Results of fifth query Parameter_SalesOnDate (when given 4/2/2012 as parameter value)
Figure 1-59: Results of fifth query Parameter_SalesOnDate (when given 4/4/2012 as parameter value)
N. ADDITIONAL QUERIES (SELECT_SALES, SELECT_DATEHIRED, SELECT_CHANCON4-2, CALCFIELD_BONUS, CALCFIELD_NEWBASEPAY, TOTALS_NUMBEROFEMPLOYEES, TOTALS_AVERAGEBASEPAY, PARAMETER_EMPLOYEELOOKUP)
48. Select Query (Select_Sales): What are the full details of all sales made?
Create a query that shows SaleID, DateOfSale, Amount, EmployeeID, FirstName, LastName, and BranchID for all sales. Sort the results ascending by DateOfSale. You may use Table 1-5 below to develop the lower part of your query.
Table 1-5: Design for query Select_Sales
Field
Table
Sort
Show
Criteria
Or:
Compare your results with Figure 1-60 below and save your query as Select_Sales.

30 Gebauer/Matthews: MIS 213 Hands-on Tutorials and Cases, Spring 2015
Figure 1-60: Results for query Select_Sales (show 7 fields, 15 records, values for SaleID may vary)
49. Select Query (Select_DateHired): At the end of this year, which employees will have been with
the company for 10 years or more?
Create a query that shows EmployeeID, FirstName, LastName, BranchID, and DateHired for employees that were hired on or before 12/31/2002. Sort the results ascending by DateHired. The employee hired first should be at the top of your results. You may use Table 1-6 below to develop the lower part of your query. NOTE: When referencing dates in criteria, you need to surround the date with hash tags. Example: #3/17/1989# - keep in mind that this is NOT the same date you need to use in this query. See also Table 1-2, p. 20!) Table 1-6: Design for query Select_DateHired
Field
Table
Sort
Show
Criteria
Or:
Compare your results with Figure 1-61 below and save your query as Select_DateHired.

Gebauer/Matthews: MIS 213 Hands-on Tutorials and Cases, Spring 2015 31
Figure 1-61: Results of query Select_DateHired (show 5 fields, 11 records)
50. Select Query (Select_CHANCon4-2): What sales were made by employees from the Charlotte
branch on April 2, 2012?
Create a query that shows SaleID, Amount, EmployeeID, and LastName for any sales that were made on 4/2/2012 AND by employees from branch CHANC. You need to put criteria restrictions on DateOfSale AND BranchID but you DO NOT want to show these columns. Uncheck the Show option to restrict without displaying in the output of the query. You may use Table 1-7 below to develop the lower part of your query. NOTE: Remember to put the criteria entries in the same column as the field you wish to restrict. For Example, you will want to put =#4/2/2012# underneath the DateOfSale field. When you want multiple restrictions to be required, you will place the criteria on the SAME row (Criteria) in your Design View. If you wanted one criteria OR the other, you would place the criteria on SEPARATE rows (one on Criteria, and one on the OR line). Table 1-7: Design for query Select_CHANCon4-2
Field
Table
Sort
Show
Criteria
Or:
Compare your results with Figure 1-62 below and save your query as Select_CHANCon4-2.

32 Gebauer/Matthews: MIS 213 Hands-on Tutorials and Cases, Spring 2015
Figure 1-62: Results of query Select_CHANCon4-2 (show 4 fields, 2 records, values for SaleID may vary)
51. Calculated Field (CalcField_Bonus): Management of the Raleigh branch is going to give a 5%
bonus on sales. What is the bonus for each sale at the Raleigh branch?
Create a query that shows SaleID, Amount, Bonus, and EmployeeID for any sales that were made at the Raleigh branch. Bonus will be a calculated field that calculates 5% (0.05) of the Amount. You may use Table 1-8 below to develop the lower part of your query. NOTE: Don’t forget to format the Bonus calculated field to currency. In addition, you should rename the calculated field to read Bonus when the query is executed. Table 1-8: Design for query CalcField_Bonus
Field
Table
Sort
Show
Criteria
Or:
Compare your results with Figure 1-63 below and save your query as CalcField_Bonus.
Figure 1-63: Results of query CalcField_Bonus (show 4 fields, 4 records, values for SaleID may vary)
52. Calculated Field (CalcField_NewBasePay): All employees will receive an increase of $115 on
their weekly base pay. What will the new weekly base pay be for each employee?
Create a query that shows BranchID, EmployeeID, FirstName, LastName, and NewBaseWeeklyPay. NewBaseWeeklyPay will be a calculated field that increases the current BaseWeeklyPay by 115. Sort the results ascending by BranchID. You may use Table 1-9 below to develop the lower part of your query.

Gebauer/Matthews: MIS 213 Hands-on Tutorials and Cases, Spring 2015 33
Table 1-9: Design for query CalcField_NewBasePay
Field
Table
Sort
Show
Criteria
Or:
Compare your results with Figure 1-64 below and save your query as CalcField_NewBasePay.
Figure 1-64: Results of query CalcField_NewBasePay (show 5 fields, 20 records)
53. Totals Query (Totals_NumberOfEmployees): How many employees do we have?
Create a query that shows NumberOfEmployees. You will need to Count the EmployeeID within the Employees table. NOTE: This will require only ONE field and there will be ONE row in output. Don’t forget to rename the field to NumberOfEmployees.

34 Gebauer/Matthews: MIS 213 Hands-on Tutorials and Cases, Spring 2015
You may use Table 1-10 below to develop the lower part of your query. Table 1-10: Design for query Totals_NumberOfEmployees
Field
Table
Total
Sort
Show
Criteria
Or:
Compare your results with Figure 1-65 below and save your query as Totals_NumberOfEmployees.
Figure 1-65: Results of query Totals_NumberOfEmployees (show 1 field, 1 record)
54. Totals Query (Totals_AverageBasePay): What is the average weekly base pay of all employees
at the Wilmington branch? Create a query that shows AverageBasePay for employees at the WILNC branch. You may use Table 1-11 below to develop the lower part of your query. NOTE: This will require TWO fields in your Design View, but only ONE will show in the results. Your output will have ONE row and ONE column in it. Don’t forget to rename the field to AverageBasePay. Table 1-11: Design for query Totals_AverageBasePay
Field
Table
Total
Sort
Show
Criteria
Or:

Gebauer/Matthews: MIS 213 Hands-on Tutorials and Cases, Spring 2015 35
Compare your results with Figure 1-66 below and save your query as Totals_AverageBasePay.
Figure 1-66: Results of query Totals_AverageBasePay (show 1 field, 1 record)
55. Totals Query (Totals_EmployeeSales): What are the total sales for each employee?
Create a query that shows EmployeeID, LastName, and TotalSales for each employee. You will need to group the employees and add the Amount of each sales record in the database. Sort the results alphabetical by last name. You may use Table 1-12 below to develop the lower part of your query. Table 1-12: Design for query Totals_EmployeeSales
Field
Table
Total
Sort
Show
Criteria
Or:
Compare your results with Figure 1-67 below and save your query as Totals_EmployeeSales.
Figure 1-67: Results for query Totals_EmployeeSales (show 3 fields, 12 records)

36 Gebauer/Matthews: MIS 213 Hands-on Tutorials and Cases, Spring 2015
56. Parameter Query (Parameter_EmployeeLookup): What are the details of the employee with EmployeeID ####?
Create a query that shows EmployeeID, FirstName, LastName, DateHired, BranchID, BaseWeeklyPay, and CommissionPercent for a specific employee. You will need to prompt the user for the EmployeeID to use when showing details. This will require a parameter query. You may use Table 1-13 below to develop the lower part of your query. NOTE: Your output should be only ONE record! Remember that you cannot use existing field names as a parameter. Your message to the user should read “What EmployeeID?” Table 1-13: Design for query Parameter_EmployeeLookup
Field
Table
Sort
Show
Criteria
Or:
Compare your results with Figure 1-68 below when given Employee ID 2020 and Figure 1-69 below when given Employee ID 9799. Save your query as Parameter_EmployeeLookup. NOTE: This should be ONE query – not two separate queries.
Figure 1-68: Results for query Parameter_EmployeeLookup (when given 2020 as parameter value) (show 7 fields, 1 record)
Figure 1-69: Results for query Parameter_EmployeeLookup (when given 9799 as parameter value) (show 7 fields, 1 record)
O. CREATING FORMS IN ACCESS (BRANCHEMPLOYEES, EMPLOYEESALES) So far, the only method for data entry has been via the Datasheet View of each table. Some users, especially those without database experience, however, may not understand the concept of tables or the Datasheet View method of data entry. In this section, we introduce Forms to provide an easier and more intuitive way to input data into tables in your database. Once you have your table design and relationships set up, forms are relatively easy to create. Access has great built-in tools for creating forms literally “with the click of a button.” This is only useful IF you have a good table design and have set up the proper relationships based on common fields within your tables.
Gebauer/Matthews: MIS 213 Hands-on Tutorials and Cases, Spring 2015 37
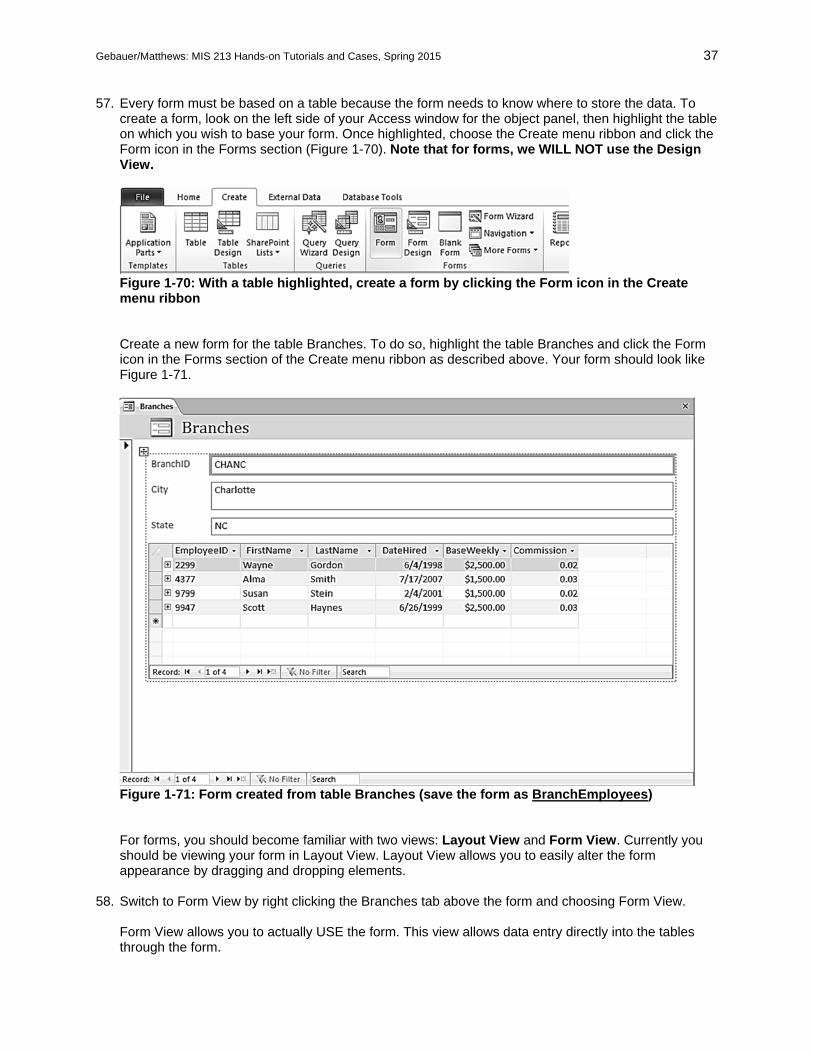
57. Every form must be based on a table because the form needs to know where to store the data. To create a form, look on the left side of your Access window for the object panel, then highlight the table on which you wish to base your form. Once highlighted, choose the Create menu ribbon and click the Form icon in the Forms section (Figure 1-70). Note that for forms, we WILL NOT use the Design View.
Figure 1-70: With a table highlighted, create a form by clicking the Form icon in the Create menu ribbon
Create a new form for the table Branches. To do so, highlight the table Branches and click the Form icon in the Forms section of the Create menu ribbon as described above. Your form should look like Figure 1-71.
Figure 1-71: Form created from table Branches (save the form as BranchEmployees)
For forms, you should become familiar with two views: Layout View and Form View. Currently you should be viewing your form in Layout View. Layout View allows you to easily alter the form appearance by dragging and dropping elements.
58. Switch to Form View by right clicking the Branches tab above the form and choosing Form View.
Form View allows you to actually USE the form. This view allows data entry directly into the tables through the form.

38 Gebauer/Matthews: MIS 213 Hands-on Tutorials and Cases, Spring 2015
Notice that the form created shows several things: - The fields contained in the table Branches (Branch ID, City, and State). Box #1 in Figure 1-72. - A sub-form with Employee details for all employees at this branch. Box #2 in Figure 1-72. - A panel for moving through the records that are displayed. Box #3 in Figure 1-72. Since you have created a relationship between the tables Branches and Employees, the sub-form was created automatically for you. This sub-form allows managing employee records directly from the Branches form. This can be very useful.
Figure 1-72: Important sections of the form BranchEmployees
To move between records in the table Branches, use the bottom panel. The arrows move forward and
back through branch records. There is also an icon to create a new record and ability to search for content within the existing records.
59. Save the form as BranchEmployees. 60. Create a second form based on the existing fields and relationships for the table Employees. Your
form should look like Figure 1-73.
Notice that this form includes a sub-form for the sales records that exist for each employee. Like for the form BranchEmployees, this sub-form exists because of the relationships that you created earlier.
61. Save the current form as EmployeeSales.

Gebauer/Matthews: MIS 213 Hands-on Tutorials and Cases, Spring 2015 39
Figure 1-73: Form EmployeeSales
P. CREATING REPORTS IN ACCESS (SELECT_SALES, SALESBYBRANCH) If you want to create formatted output instead of the “spreadsheet style” output that you get from queries, you should build a report. Reports allow formatting data in a much more readable and attractive manner, and can be passed out to stakeholders, management, or team members for review and decision making. Some people find it difficult to extract data from query output, so reports can provide an easier way to understand data quickly. This can be a great benefit within an organization. Reports should be based on a query in your database. When you run a report, the query is first executed behind the scenes and the records that result from the query’s execution are then used to generate the report. Access applies the formatting specifications that you defined in your report layout. Besides the fields defined in the underlying query, you can display additional totals and groupings in the report. 62. To create a report, begin by highlighting the query in the object panel to the left of your Access
window on which you wish to base your report. Once highlighted, choose the Create menu ribbon and click the Report icon in the Reports section (Figure 1-74). Note that for reports you WILL NOT use the Design View.
Figure 1-74: With a query highlighted, create a report by clicking the Report icon in the Create menu ribbon

40 Gebauer/Matthews: MIS 213 Hands-on Tutorials and Cases, Spring 2015
When you first create a report, you will view it in Layout View. Layout View allows easy manipulation of fields and formatting on the report. To view the resulting report with all data, switch to Report View. Ideally, Report View will be printed and distributed as needed.
Create a new report based on the query Select_Sales that was created previously. (If you did not create this query, go back and do that before you move on.) To start the report, highlight the query Select_Sales and click the Report button in the Reports section of the Create menu ribbon as described above. Your report will appear in Layout View and should look like Figure 1-75. (For now, ignore the Group & Sorting panel if it appears at the bottom of your screen.)
Figure 1-75: Layout View for Report SalesbyBranch, created from query Select_Sales
63. First, notice the gray dotted lines around Layout View. These are the designated page margins. If you
were to print this report right now, parts of it would be cut off. In order to fit the contents to one page, you need to resize some columns. To resize a column, click the field title you wish to resize. Once highlighted, move your mouse to the left or right side of the highlighted box. When your cursor turns to a double sided arrow, click and drag to change the width of a column. You could also use the same process to change row height of the report.
Resize FirstName and LastName so that the full contents of the report fit within the page margins. Your report Layout View should resemble Figure 1-76.
Figure 1-76: Layout View for Report SalesbyBranch after resizing column widths

Gebauer/Matthews: MIS 213 Hands-on Tutorials and Cases, Spring 2015 41
NOTE: When making changes, remember you can use the UNDO option. The Undo icon is located near the Save icon in the extreme top left of your Access window. Also, you can use Ctrl+Z to activate an UNDO.
64. Next, notice the date and time that are printed in the top right to indicate when the report was
generated. In addition, a title is created on the top left. By default, the title of the report is the same as the name of the query on which the report is based. To change the title, double-click the existing title in Layout View and edit the text.
Change the title of the report to be Sales by Branch. Your title should now match Figure 1-77.
Figure 1-77: Layout View for Report SalesbyBranch after changing the title
65. While in Layout View, you can also rearrange fields or remove fields. Before you perform either of
these actions, select the entire column you wish to manipulate. To select an entire column, click within the column and select the Arrange menu ribbon on top of your screen. Click the Select Column button in the Rows & Columns section of the Arrange menu ribbon (Figure 1-78).
Figure 1-78: Highlight an entire column by selecting the Select Column icon in the Rows & Columns section of the Arrange menu ribbon. To delete a column once highlighted, hit the delete key on your keyboard. You may also right click the highlighted column and choose Delete Column. To move a column once highlighted, click and hold on the column and drag the column left or right. The cursor will show a notification of where the column will be placed. Release the mouse button to move the column to the selected location.
Rearrange the fields of the report so that they appear in this order: BranchID, DateOfSale, EmployeeID, LastName, SaleID, and then Amount. Notice that FirstName should be removed. After rearranging the fields, your report Layout View should look like Figure 1-79.

42 Gebauer/Matthews: MIS 213 Hands-on Tutorials and Cases, Spring 2015
Figure 1-79: Layout View for Report SalesbyBranch after rearranging fields
66. Before moving on to make some additional changes, make sure that all contents of the report are
within the page margins. If they are not, click to highlight each object and resize or move it into the page boundaries. Also make sure the contents of all rows can be seen. If they cannot, resize their height accordingly. For example, take note of the bottom of the report. Page 1 of 1 is displayed but it may be outside of the page margins. Anything outside the gray dotted line should be moved inside the margins. Also, there is an automated total at the bottom of the amount column. Notice how the contents of this field cannot be fully seen, so the height of this field has to be changed.
67. Save the report as SalesByBranch.
Q. USING GROUPING, SORTING, AND TOTALS IN A REPORT (SALESBYBRANCH) 68. For this report, we want to highlight the sales for each individual branch. In addition, we want to total
the sales for each branch and display the totals on the report. All of these additions to the query can be done in report Layout View.
One of the great additions you can apply with reports is grouping and sorting. Notice the bottom panel of your report Layout View that has buttons that read Add a group and Add a sort (Figure 1-80).

Gebauer/Matthews: MIS 213 Hands-on Tutorials and Cases, Spring 2015 43
Figure 1-80: The Group, Sort, and Total panel If the Group, Sort, and Total panel is hidden, look on top of your screen and click the Group & Sort button in the Grouping & Totals section of the Design menu ribbon (Figure 1-81).
Figure 1-81: Add groups or sorts by activating the Group & Sort panel When you click Add a group or Add a sort, you will be asked to choose a field. Grouping will pull all records with the same value for the selected field and display them together in the report. Sorting will reorder the records based on the values of the selected field.
Group this report by BranchID, and Sort the records by DateOfSale. After adding a group and a sort, the Layout View of your report should look like Figure 1-82.
Figure 1-82: Layout View for Report SalesbyBranch after adding a group and a sort

44 Gebauer/Matthews: MIS 213 Hands-on Tutorials and Cases, Spring 2015
69. When a report has a grouping, you may wish to add up the values from a certain column, count the
records within a group, or perform other functions. To do so, select the column, then click the Totals icon in the Grouping & Totals section in the Design menu ribbon. Figure 1-83 shows the options available for Totals.
Figure 1-83: Totals options within report Layout View
Add a Sum to the Amount column for each branch: Highlight the Amount column and click the Totals icon in the Grouping & Totals section of the Design menu ribbon. Select Sum. Resize the height for the total so that the entire content is displayed. Your Layout View should look like Figure 1-84.
Figure 1-84: Layout View for Report SalesbyBranch after adding a total to Amount
70. Make sure to save the report often.

Gebauer/Matthews: MIS 213 Hands-on Tutorials and Cases, Spring 2015 45
R. ADDITIONAL FORMATTING OF REPORTS (SALESBYBRANCH) Usually you will want to modify the formatting of a report. This could be as simple as bolding a particular field, changing the fonts, or modifying the borders. Each column has its own set of formatting in a report. Similar to what we did so far, you can make formatting changes in the Layout View of the report. 71. The most common formatting options are available in the Format menu ribbon (Figure 1-85). You can
modify Font attributes, Borders, Backgrounds, and Number Formatting.
Figure 1-85: Formatting options for reports are located in the Format menu ribbon
Format the report SalesByBranch to resemble Figure 1-86. Give all fields except the totals a transparent outline. Remove all alternating row colors. Bold the values in the field BranchID. Define the background of the rows that contain a BranchID value as light gray (remember, remove alternating row colors first). Make the column headings italicized. Getting familiar with these controls should be intuitive but it may take some time to get the desired results. Remember that you can always use the Undo icon and you should save your report often! NOTE: Make sure that you have highlighted what you would like to format before clicking the options in the Format menu ribbon. You may need to select an entire column or multiple items before formatting.

46 Gebauer/Matthews: MIS 213 Hands-on Tutorials and Cases, Spring 2015
Figure 1-86: Report SalesByBranch
S. ANOTHER REPORT (SALESBYEMPLOYEE) 72. Generate a second report based on the query Select_Sales. In this report, change the title to Sales
By Employee. Group the results by EmployeeID and sort by DateOfSale. Add a Sum to the field Amount and a Count to the field SaleID (use Count Records). Reorder and resize fields so that your results resemble Figure 1-87. Save this report as SalesByEmployee.

Gebauer/Matthews: MIS 213 Hands-on Tutorials and Cases, Spring 2015 47
Figure 1-87: Start of Report SalesByEmployee
73. In this report, some employees have duplicate information. Scroll down to see Jane Noel and Omar
Gray (Figure 1-88).
Figure 1-88: Multiple sales records for employees in Report SalesByEmployee
When an employee has multiple sales records listed, there is no real reason to duplicate the employee details every time. Only the unique parts for each sales record need to be displayed (these are DateOfSale, SaleID, and Amount). Move the FirstName, LastName, and BranchID up to the same line as the EmployeeID. In Layout View, you can move the contents of the fields between rows. To do this, click to highlight a field value within a column. Click and hold on the value and drag it up to the desired location – you will notice the cursor designates where the placement will be. Release the mouse button to drop the field in the new location. After moving FirstName, LastName, and BranchID, your Layout View should look like Figure 1-89.

48 Gebauer/Matthews: MIS 213 Hands-on Tutorials and Cases, Spring 2015
Figure 1-89: Layout View of report SalesByEmployee after moving field values for employee records
74. Change the formatting of the report to resemble Figure 1-90. Save your results.

Gebauer/Matthews: MIS 213 Hands-on Tutorials and Cases, Spring 2015 49
Figure 1-90: Report SalesByEmployee
T. SUBMITTING YOUR ASSIGNMENT TO ENTROPY 1. Make sure your database is closed. Access should not be open when you upload it to Entropy.
2. Be sure to save a copy of your database onto a permanent storage device (your Timmy drive or a
flash drive). You may need this database for multiple assignments, so please save it so you can retrieve it later! If you are in the labs on campus, that computer’s hard drive is most likely NOT permanent because chances are that it is reset daily.
3. Open a web browser.
4. Go to Entropy (https://csbapp.uncw.edu/Entropy/ or http://bit.ly/2entropy). Enter your Entropy UserID
and Password and select the appropriate class.
5. Click the Upload Assignment option.
Top of Report
Bottom of Report

50 Gebauer/Matthews: MIS 213 Hands-on Tutorials and Cases, Spring 2015
6. Find the correct assignment you wish to upload. This will vary based on your instructor.
7. Click Upload Now beside the appropriate assignment.
8. Click the Browse… button and locate your database file. NOTE: Again, make sure the file is closed! Files may not upload correctly if they are currently open.
9. Click the Click here once… button.
10. You should get a green OK message with a unique file number. This is an indication that your file has
been uploaded correctly. If you see a red message it might imply you uploaded the wrong file or a shortcut to a file. Ask your instructor for help or try again.
NOTES: You should check your file size: If it is small (under 500KB or zero), there’s a good chance that you either left the database open when you attempted to upload it or you uploaded a shortcut link to your database. In either case, move the actual database file to a permanent storage location (your Timmy drive or a flash drive) and then upload the file again, making sure to follow the steps above. If you accidentally uploaded the wrong file, you can re-upload until the due date. Every new upload overrides all previous uploads with the new file. Your instructor will only receive the most recent upload from you. You CANNOT email the file as most mail systems block database files.