Embed Size (px)
Citation preview
FOOD COMPOSITION AND ADDITIVES
Polymerase Chain Reaction Technology as Analytical Tool inAgricultural Biotechnology
MARKUS LIPP
Monsanto Co., 800 N. Lindbergh Blvd, St. Louis, MO 63167RAYMOND SHILLITO
Bayer CropScience, PO Box 12014, 2 T.W. Alexander Dr, Research Triangle Park, NC 27709RANDAL GIROUX
Cargill Inc., 2301 Crosby Rd, Wayzata, MN 55391FRANK SPIEGELHALTER
GeneScan USA, 2315 N. Causeway Blvd, Suite 200, Metairie, LA 70001STACY CHARLTON
Syngenta Biotechnology, PO Box 12257, 3054 Cornwallis Rd, Research Triangle Park, NC 27709-2257DAVID PINERO
Eurofins Scientific, 3507 Delaware, Des Moines, IA 50313PING SONG
Dow AgroSciences, 9330 Zionsville Rd, Indianapolis, IN 46268-1053
The agricultural biotechnology industry appliespolymerase chain reaction (PCR) technology atnumerous points in product development.Commodity and food companies as well asthird-party diagnostic testing companies also relyon PCR technology for a number of purposes. Theprimary use of the technology is to verify thepresence or absence of genetically modified (GM)material in a product or to quantify the amount ofGM material present in a product. This articledescribes the fundamental elements of PCRanalysis and its application to the testing of grains. The document highlights the many areas to whichattention must be paid in order to produce reliabletest results. These include sample preparation,method validation, choice of appropriate referencematerials, and biological and instrumental sourcesof error. The article also discusses issues relatedto the analysis of different matrixes and the effectthey may have on the accuracy of the PCRanalytical results.
The class of plant products developed through modernbiotechnology has been described as geneticallymodified (GM), genetically engineered (GE),
genetically modified organism (GMO), transgenic, biotech,and recombinant. For the present discussion, the term“genetically modified” (GM) will be used for its simplicityand broad recognition. This discussion will address
polymerase chain reaction (PCR) technology as it applies tofood biotechnology in the soybean and corn (maize) industries only, though the principles are applicable to other crops aswell. PCR is only one of the techniques that are used for thedetection of GM material in a product. Althoughprotein-based test technology is available and applied totesting (1), especially in the seed and grain industry, theremainder of the article will focus exclusively on PCRtechnology.
A number of countries have adopted, or are in the processof developing, legislation related to the approval of GMproducts. Authorities in many countries require that DNAsequence information be provided as part of the registrationpackage. In addition, a PCR detection method that is specificto the event may also be requested. The term “event” is used to describe a plant and its offspring that contain a specificinsertion of DNA. Such an event is distinguishable from otherevents by its unique site of integration of the introduced DNA. A PCR method that can distinguish such an event from allother events is described as being “event-specific” andgenerally is based on the detection of a junction fragmentbetween the original plant DNA and the introduced DNA.
Uses of PCR Technology
The agricultural biotechnology industry applies PCRtechnology at numerous steps throughout productdevelopment, much as it does with immunoassays (1). Themajor uses of PCR technology during product developmentinclude gene discovery and cloning, vector construction,transformant identification, screening and characterization,and seed quality control. Commodity and food companies, aswell as third-party diagnostic testing companies, rely on PCR
136 LIPP ET AL.: JOURNAL OF AOAC INTERNATIONAL VOL. 88, NO. 1, 2005
Received February 27, 2004. Accepted by AH July 28, 2004.Corresponding author's e-mail: [email protected].
technology to verify the presence or absence of GM materialin a product or to quantify the amount of GM material presentin a product. Quantitative PCR technology also has been usedto estimate GM copy number and zygosity in seeds andplants (2–4).
The grain handling and grain processing industry usesPCR to certify compliance with contracts between buyer andseller. PCR testing is used for 4 specific purposes in the grainhandling/processing industry:
PCR testing for unapproved events.—In countries thathave a defined approval process for GM crops, an event maybe approved for use in the country of production but not yetapproved for use in an importing country. In these instances,the importing country often requires that the grain shipmentbe tested for the presence of specific GM events to ensure thatthe grain shipment does not contain these unapproved events.Such testing often relies on qualitative PCR because thedetection of these events, in most cases, is at a zero-tolerancethreshold.
PCR testing for GM content.—Most countries that haveadopted mandatory labeling rules for food or feed have settolerances for the adventitious presence of GM material ingrain products or the final foods based on a percent GM(weight-to-weight) content. In these countries, food and feedmanufacturers and retailers often choose to originate/obtaingrain and grain products below the defined regulatorythreshold to avoid labeling their products. In this case, grainmust come from a non-GM identity preservation program andbe certified to contain GM grains at a level below thethreshold specified in the contract. To meet this need fortesting, several laboratories currently are adoptingquantitative PCR for percent GM determinations.
PCR testing for non-GM labeling.—In some cases, foodmanufacturers and retailers wish to use positive labeling fortheir non-GM products. These companies hope to gain market share among consumers who wish to avoid GM products. Inmost cases, the use of positive labeling requires that the grainand grain products originate from a non-GM identitypreservation program and test negative or at least below acertain threshold for GM DNA. Qualitative PCR testing ismost often used to certify compliance with a non-GMcontract.
PCR testing for presence of a high-value commodity.—Incertain cases, it is desirable to show that a commodity is madeup of a specific crop commodity (e.g., low phytate maize,soybean with altered oil profile). PCR could be used for thispurpose by testing for the GM trait that conveys thecharacteristic, although the grain may also be tested byquantifying the improved quality of the commodity.
The PCR Process
The PCR process mimics in vitro the natural process ofDNA replication occurring in all cellular organisms in whichthe DNA molecules of a cell are duplicated prior to celldivision. In contrast to natural DNA replication, the DNAreproduction during PCR does not cover the entire sequence
of the original DNA molecules but is restricted and targets aspecific, relatively short, region of the template DNAmolecules. Short, single-stranded, synthetic DNA moleculescalled the primers give the specificity of the reaction. They are designed to be complementary to their intended binding site.Most commonly, 2 primers are involved and the DNA sectionin between the distal ends of their binding sites are replicatedduring the reaction.
A single cycle of the PCR and the correspondingtemperature profile are typically divided into the 3 phases:denaturation, annealing, and elongation. At the end of thisprocedure, the targeted DNA region has been replicated into2 copies of the original double-helix molecule. This process of selective duplication is repeated multiple times in a cyclicreaction. The repetitive DNA duplication is driven solelythrough quick and precise shifts in the reaction temperature,facilitated by the thermocycler instrument. DNA replication iscatalyzed by heat-stable DNA polymerases, previouslyisolated and characterized from Thermus aquaticus (5). Thekinetics of the DNA reproduction resemble an exponentialamplification in which the replicas of distinct length(amplicons) accumulate quickly and outnumber the originaltemplate molecules. The distinct size of the amplified copiesallows them to be detected by gel electrophoresis in thebackground of nonamplified DNA.
Sample Preparation
Sampling
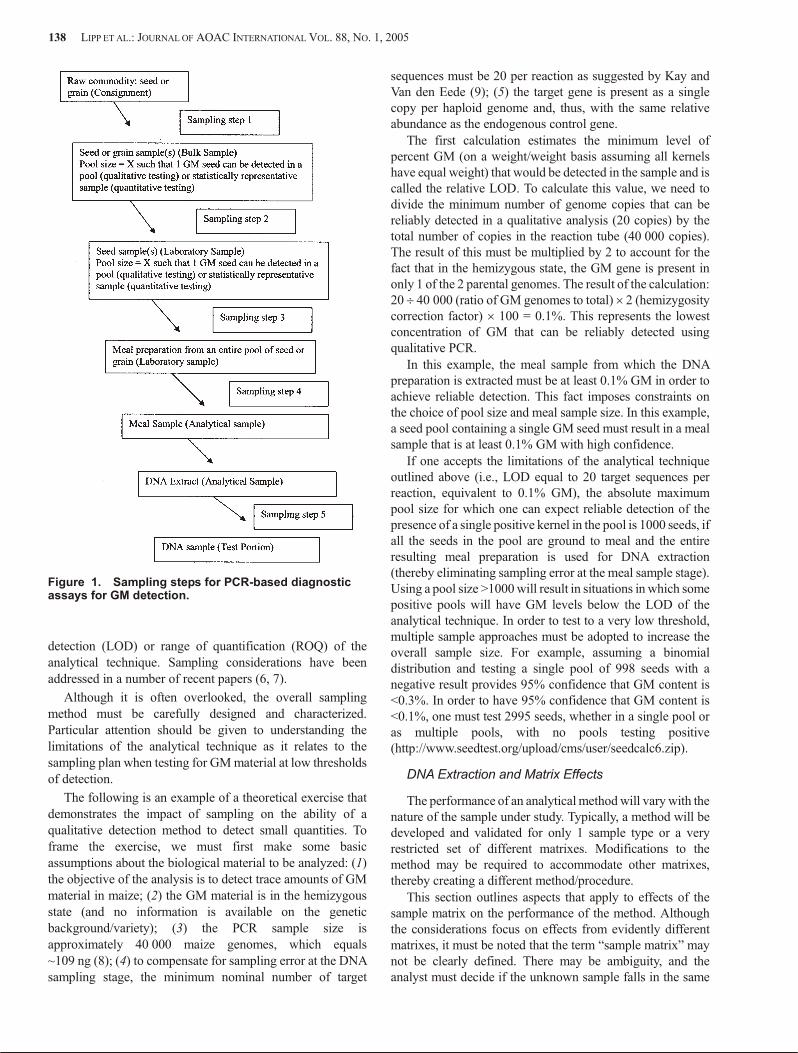
If applying PCR to test for GM material, one must carefully conduct the sampling in a manner that avoids erroneousresults. When PCR-based diagnostic assays are used to test for the presence of GM material in seed or grain, a number ofsampling steps occur (Figure 1): (1) Sampling theconsignment of seed or grain to obtain the bulk sample.(2) Sampling the bulk sample to obtain the laboratory sample.(3) Subsampling the laboratory sample to obtain the testsample. (4) Sampling the meal that results from grinding thetest sample to obtain the analytical sample. (5) Sampling theDNA solution that results from extraction of the meal sampleto obtain the test portion.
Typically, sampling considerations are limited to thelaboratory and test sample with regard to the desired threshold of detection. The subsequent sampling step (meal) is typicallydriven by the traditional procedures of a particular laboratoryor the capacity of the equipment used. It is incumbent on theanalytical laboratory to have characterized and standardizedthe production of the meal sample as part of the methoddevelopment. The final sampling step (DNA to be used in asingle PCR) is typically constrained to <200 ng DNA by thelimitations of the technique and the equipment used.
Each of the sampling steps has the potential to introduceerror that may impact the detection of GM material at thedesired threshold. As such, designing a sampling strategy thatwill be suitably representative requires knowledge of theparticle size characteristics of the test sample and the meal, the genome size of the species in question, and the limit of
LIPP ET AL.: JOURNAL OF AOAC INTERNATIONAL VOL. 88, NO. 1, 2005 137
detection (LOD) or range of quantification (ROQ) of theanalytical technique. Sampling considerations have beenaddressed in a number of recent papers (6, 7).
Although it is often overlooked, the overall samplingmethod must be carefully designed and characterized.Particular attention should be given to understanding thelimitations of the analytical technique as it relates to thesampling plan when testing for GM material at low thresholdsof detection.
The following is an example of a theoretical exercise thatdemonstrates the impact of sampling on the ability of aqualitative detection method to detect small quantities. Toframe the exercise, we must first make some basicassumptions about the biological material to be analyzed: (1)the objective of the analysis is to detect trace amounts of GMmaterial in maize; (2) the GM material is in the hemizygousstate (and no information is available on the geneticbackground/variety); (3) the PCR sample size isapproximately 40 000 maize genomes, which equals~109 ng (8); (4) to compensate for sampling error at the DNAsampling stage, the minimum nominal number of target
sequences must be 20 per reaction as suggested by Kay andVan den Eede (9); (5) the target gene is present as a singlecopy per haploid genome and, thus, with the same relativeabundance as the endogenous control gene.
The first calculation estimates the minimum level ofpercent GM (on a weight/weight basis assuming all kernelshave equal weight) that would be detected in the sample and is called the relative LOD. To calculate this value, we need todivide the minimum number of genome copies that can bereliably detected in a qualitative analysis (20 copies) by thetotal number of copies in the reaction tube (40 000 copies).The result of this must be multiplied by 2 to account for thefact that in the hemizygous state, the GM gene is present inonly 1 of the 2 parental genomes. The result of the calculation: 20 ̧ 40 000 (ratio of GM genomes to total) ́ 2 (hemizygositycorrection factor) ´ 100 = 0.1%. This represents the lowestconcentration of GM that can be reliably detected usingqualitative PCR.
In this example, the meal sample from which the DNApreparation is extracted must be at least 0.1% GM in order toachieve reliable detection. This fact imposes constraints onthe choice of pool size and meal sample size. In this example,a seed pool containing a single GM seed must result in a mealsample that is at least 0.1% GM with high confidence.
If one accepts the limitations of the analytical techniqueoutlined above (i.e., LOD equal to 20 target sequences perreaction, equivalent to 0.1% GM), the absolute maximumpool size for which one can expect reliable detection of thepresence of a single positive kernel in the pool is 1000 seeds, if all the seeds in the pool are ground to meal and the entireresulting meal preparation is used for DNA extraction(thereby eliminating sampling error at the meal sample stage).Using a pool size >1000 will result in situations in which some positive pools will have GM levels below the LOD of theanalytical technique. In order to test to a very low threshold,multiple sample approaches must be adopted to increase theoverall sample size. For example, assuming a binomialdistribution and testing a single pool of 998 seeds with anegative result provides 95% confidence that GM content is<0.3%. In order to have 95% confidence that GM content is<0.1%, one must test 2995 seeds, whether in a single pool oras multiple pools, with no pools testing positive(http://www.seedtest.org/upload/cms/user/seedcalc6.zip).
DNA Extraction and Matrix Effects
The performance of an analytical method will vary with the nature of the sample under study. Typically, a method will bedeveloped and validated for only 1 sample type or a veryrestricted set of different matrixes. Modifications to themethod may be required to accommodate other matrixes,thereby creating a different method/procedure.
This section outlines aspects that apply to effects of thesample matrix on the performance of the method. Althoughthe considerations focus on effects from evidently differentmatrixes, it must be noted that the term “sample matrix” maynot be clearly defined. There may be ambiguity, and theanalyst must decide if the unknown sample falls in the same
138 LIPP ET AL.: JOURNAL OF AOAC INTERNATIONAL VOL. 88, NO. 1, 2005
Figure 1. Sampling steps for PCR-based diagnosticassays for GM detection.
category as the samples used during validation of the method.A detailed scope of the method will minimize such ambiguitybut cannot entirely prevent it.
PCR methods for detection of GM traits are commonlydeveloped and validated with samples of ground seed because validation studies, proficiency schemes, and check sampleprograms with large samples of whole seed are not practical.However, initiating validation and proficiency programs withground seeds ignores the variability in the preparationprocess. Some organizations, notably the International SeedTesting Association (ISTA), have carried out proficiencyprograms using whole seed.
In routine applications, the analyst will frequently use PCR to analyze grain. However, even a matrix that appears simplefrom the method developer’s point of view, i.e., maize kernels, may be challenging in a laboratory situation. For example, aseed sample may have been treated with chemicals such asfungicides, which were not present in the samples used formethod validation. These compounds may interfere with orinhibit the PCR, particularly if the DNA extraction procedureis not tailored for their effective removal. If the method doesnot include appropriate controls, this inhibition can lead tofalse-negative results. In addition, any 2 maize samples areunlikely to be exactly the same with regard to suchcharacteristics as moisture, fiber, starch, and residues ofchemicals, and at some point the assumption must be madethat they belong to the same matrix, although the boundariesof this category cannot be exactly defined.
A prudent approach to this challenge is not to rely solely on method validation for a particular matrix or to assume allsamples that are considered the same matrix will behave inexactly the same way. Controls that monitor performanceshould be developed as part of the method to detect potentialeffects originating from the individual unknown sample under study. The effectiveness of these controls should bedemonstrated during method development and, ideally, alsoduring validation.
(a) PCR inhibitors.—Various compounds in plantmaterial and food products can be co-extracted with genomicDNA and inhibit the PCR. This may lead to false-negativeresults because of failure of the PCR (10). Likewise, partialinhibition is very likely to bias results from a relativequantitative PCR assay using 2 PCR systems in parallel,because the 2 PCR systems will rarely be affected to exactlythe same extent.
PCR inhibitors from plants and processed foods includepolysaccharides, proteins, phenolic compounds, and otheruncharacterized plant secondary metabolites (11–13).Moreover, covalent cross-linking of proteins to DNA throughcarbohydrates can render the DNA unsuitable as a PCRtemplate (14, 15). The inhibitors may vary in the extent towhich they affect individual PCRs using different primer pairs in separate or multiplex PCRs (16, 17).
Although it is necessary to use or develop a DNAextraction method that sufficiently removes PCR inhibitorsfrom the matrixes that fall within the scope of the method, it isnot practical to identify and characterize all potential
inhibitors. A more feasible approach is to test DNA extractsfor the presence of inhibitors and then modify the DNAisolation protocol or the PCR conditions to reduce the effectsof PCR inhibitors, if necessary (16–19). Generally, a positivecontrol DNA (spike) is added to the PCR. Specificamplification of the control DNA is tested in the presence andabsence of DNA extracts to see if the extract inhibitsamplification. This should preferably be done with DNAextracts from known negative samples so that the spike DNAis the only source of a constant amount of target DNA in thePCR. There are several examples of DNA extraction methodsthat target removal of specific inhibitors (12, 13, 18, 20, 21).
An inhibition control in the method is a requisite to monitor potential inhibition arising from an individual sample inroutine application of the method. Such a control willconsiderably lower the risk of false-negative results caused by PCR inhibition. During method development and validation,the fitness of an inhibition control can be assessed byanalyzing samples with small amounts of analyte close to theanticipated or intended detection limit. In PCRs that containpurposely added inhibitory compounds or crude DNAextracts that are known to contain inhibitors, the failure of thePCR (false negative) should be indicated by the malfunctionof the inhibition control. Holden et al. (10) have shown thatthe amplification of an endogenous sequence does not alwaysfulfill this requirement. The sensitivity of this type of reactionas an inhibition control is restricted, probably because thepresence of the endogenous target is greater than the presenceof the GM target; therefore, it still can be amplifiedsuccessfully in partially inhibited reactions whereamplification of the GM target fails. Ideally, accept/rejectcriteria for negative results for an individual sample considerthe outcome of the corresponding inhibition control and aredescribed under the appropriate sections of method validation.
(b) DNA degradation, fragmentation, andextractability.—Processing of raw agricultural commoditiesto food ingredients and finished food products usuallycomprises steps that extract, fragment, or otherwisecompromise the DNA molecules. Complex sample matrixesmay also require multiple consecutive DNA extraction andpurification steps that lower the DNA yield of the overallprocedure. Reduced size of the DNA molecules that can beextracted from a processed matrix is of concern if aconsiderable portion of the fragments cannot function as PCRtemplates because their insufficient size does not span theentire target sequence. Also, certain types of DNA damageduring food processing may interfere with the DNA’s abilityto serve as a PCR template. Whereas it may not be required orfeasible to address the exact nature of these limitations,validation studies will reasonably show their impact on theapplicability of a method to a processed matrix.
These effects imply that a detection or quantification limitestablished for a given method is restricted to the matrix usedduring validation (most commonly, raw material, i.e, groundseeds) and cannot be projected to any other matrix outside thescope of the method. Decreasing the amount or otherwisecompromising the integrity of DNA that can be extracted from
LIPP ET AL.: JOURNAL OF AOAC INTERNATIONAL VOL. 88, NO. 1, 2005 139
the sample and amplified in PCR reciprocally increases thedetection and quantification limits expressed in terms ofpercent GM DNA relative to plant species DNA. In extremecases, only minute amounts of DNA can be extracted fromcertain matrixes (e.g., refined oil, modified starch, andsoybean lecithin). If the DNA yield is extremely low, or onlyan insignificant portion of the extracted DNA is present inamplifiable fragments larger than the PCR target sequence,attempts to establish the LOD of a PCR method by validationlikely will fail. With significant lack of extractable andamplifiable DNA, relative quantification will fail as well, with poor reproducibility and very high or entirely unknownquantification limits. Modifications to DNA extractionprocedures may compensate for extremely low DNA yieldfrom such matrixes to some extent and may result in animprovement of the detection limit, but are still not likely toresult in methods that are practicable in the real world.
In contrast to the decrease of DNA content by most foodprocessing, it is possible that some procedures such asfreeze-drying may concentrate the DNA in the matrix and,thereby, decrease the lower limits of the method’sapplicability. The detection limit will remain unknown for theprocessed matrix unless established by appropriate validation.
Because the concept of relative quantitative PCR involvesthe measurement of 2 analytes in parallel, removal,degradation/fragmentation, or restricted extractability ofDNA have the potential to shift the ratio between these2 analytes if they are not equally subject to the adverse effects.Variation in nuclease susceptibility of different regions of thegenome is a well-established phenomenon particularly withrespect to Dnase I sensitivity of actively transcribed chromatin regions (22–25). Differences in nuclease susceptibility mayarise as a result of a number of factors. Some of these factorsmay be relatively global in scope, such as higher-orderchromatin structure, whereas others may be quite local, suchas methylation state of specific sequences, nucleosomeplacement, or level of transcriptional activity. Whatever theroot cause, differential nuclease susceptibility between theendogenous control gene and the target sequence can result inbiased results particularly when dealing with processedmaterials. For example, processing that preferentiallyeliminates the DNA sequence used to measure the amount ofplant species DNA would increase the result given in percentGM DNA relative to plant species DNA in the processedmatrix. Although results that are expressed in terms of GMDNA relative to plant species DNA are, strictly speaking, stillcorrect, the restriction that may arise to their interpretation isevident. They do not necessarily reflect the relativecomposition of the original material.
(c) Mixed products with DNA from multiplesources.—The specificity of a PCR assay for its intendedtarget analyte is determined by the likelihood that sequencesthat are similar to, but not the same as the target sequence arenot amplified and therefore do not lead to false-positiveresults. Besides the ability of the primers and PCR conditionsto discriminate between the intended and unintendeddetection of closely related sequences, the composition of the
DNA in the sample matrix plays a major role. The minimumrequirement for the specificity of a PCR assay for GMdetection is that it does not cross-react with any of the DNAsequences that are present in the non-GM plant genome.Furthermore, it is critical that sequences from other GMevents in the same species do not interfere with the assay in amanner that could lead to positive signals that do not originatefrom the intended GM analyte. However, PCR analyses thatare targeted to a sequence present in many different events(e.g., the 35S promoter) will react with those multiple events.
Compliance with the minimum specificity requirementscan be established during development and validation of amethod. However, the scope of such method would be fairlylimited and not necessarily suitable for routine application indaily laboratory practice. For example, a method for detectionof a GM maize event may show a satisfactory specificity onmaize samples prepared for a validation study; however, thisdoes not demonstrate the method’s suitability for analysis ofcommercial maize samples that contain foreign materials,such as soybean or wheat. Therefore, it is advisable to designand validate a method so that it is specific for the intended GM event, even in the presence of DNA from other plant speciesthat are likely to be present as adventitious material in routinegrain or processed samples.
The same argument applies to methods that are intendedfor use in more complex food matrixes that may have evenmore sources of DNA from different organisms than a grain or flour sample. Experimental assessment of the method’sspecificity on DNA from various sources will define the scope of the methods that must be considered during methodvalidation.
PCR methods that target artificial transitions betweenDNA sequences that naturally do not occur in juxtapositionare believed to be less problematic with regard to theirspecificity than PCR methods that target a sequence locatedwithin only 1 genetic element that has been used in geneticengineering of plants. For example, the detection ofcauliflower mosaic virus (CaMV) 35S promoter sequences isnot necessarily conclusive evidence that the DNA detectedoriginated from a GM plant. The virus itself may be present(the CaMV is a common plant virus affecting e.g., Brassicaspecies) and lead to a positive result, and the likelihood of itspresence could vary considerably with the sample matrix, i.e.,the ingredients of a finished food product. PCR assays thatdetect CaMV itself by targeting a viral nucleotide sequenceother than 35S promoter can be useful to investigate theprobability of 35S promoter positive results originating fromCaMV (26). In other words, the presence of the 35S promotercan be caused by a naturally occurring plant virus and itspresence per se cannot be linked to the presence of GM plantswithout further additional information. Similarly, thedetection of a gene derived from Bacillus thuringiensis maybe the consequence of traces of DNA from soil bacteriapresent in a grain sample. If possible, these limitations shouldbe considered in the scope of the method and instructionsgiven for interpretation of results.
140 LIPP ET AL.: JOURNAL OF AOAC INTERNATIONAL VOL. 88, NO. 1, 2005
The presence of CaMV in considerable amounts can alsoaffect results from quantitative PCR that measure the ratiobetween 35S promoter DNA and a species-specific DNAsequence. Although the result would probably still reflect theratio of the 2 types of DNA correctly, it may defy reasonableinterpretation because the contributions from CaMVsequences and GM DNA cannot be distinguished.
A further major restriction to the interpretation of 35Spromoter quantification in complex matrixes is GM DNAfrom different crop plants that could contribute to the valueobtained for the 35S promoter DNA; most commonly, only1 plant species at a time is targeted in the species-specific PCR in parallel. Multiple significant contributions to the numeratorof the percent GM calculation, without the contribution of allrespective plant species to the denominator, wouldconsequently yield an overestimate that does not reflectpercent GM.
Applications of PCR
PCR can be used in 2 primary ways in the detection of GMDNA in plants. These are termed quantitative PCR, whichyields an estimate of the amount of the specific analytepresent, and qualitative PCR, which yields a yes/no answer asto the presence of GM material.
Quantification of DNA
The analyst must be aware of the measurement uncertaintyin the determination of the amount or concentration of DNAused in an experiment. The following list contains a number of factors that contribute to this uncertainty (27). This list is notconsidered exhaustive:
The following factors are known to influence the accuracyand precision of DNA quantification by UV spectrometry:(1) presence of other components absorbing at 260 nm, e.g.,proteins, RNA; (2) ratio of single-stranded vs double-stranded DNA; their absorption coefficients differ; (3) size distributionof DNA in solution.
The following factors are known to influence the accuracyand precision of DNA quantification byfluorescence-spectrometry: (1) size distribution; (2) in casesof dyes that bind exclusively to double-stranded DNA,single-stranded DNA, if present, will not be determined at all.
Currently, all DNA concentration quantificationtechniques have limitations in their use and application.Spectrophotometric analyses (i.e., A260-A280) require arelatively large amount (2.5–5.0 mg) of DNA of almost purequality. DNA extracted from certain food matrixes is unlikelyto meet this requirement. Spectrophotometric assays are alsounable to differentiate between single- and double-strandedDNA or between DNA and RNA. Fluorometric assays require that a DNA standard of a comparable size, and in the case ofHoescht assays, adenine and cytosine content be used (28, 29).
Thus, all DNA quantification methods have their strengthsand weaknesses, although the spectroscopic determinationwith absorbance at 260 nm is commonly used. Regardless ofmethod choice, the analyst must recognize that the uncertainty
of the DNA determination will be an inherent part of the totaluncertainty of the method and, thus, be reflected in eachanalytical result. No method will be more precise and accurate than the estimates of the concentrations of its calibrators.
For some applications, DNA is diluted exhaustively(through sequential dilution the number of PCR targetmolecules is decreased) to determine the copy number of thelimit of a method, or to quantify the amount of DNA bymeasurement of an endogenous gene. For very low numbersof molecules, stochastic effects will predominate.
The best estimate of the absolute quantity of DNA in agiven reaction volume can be determined using one of thetechniques described above. This value is multiplied by thegenome size (8) as given in literature to express the quantity as copy number or genome equivalent. The uncertainty of thisvalue is determined by the uncertainty of the DNAmeasurement technique and the genome size, as well asdilution and any absorption by the apparatus. However, we are not aware if any good estimates of uncertainty for thebiological variation of the genome size as expressed inequivalent/mole or equivalent/g are available. Thus, theanalyst needs to be cautious about using copy numbercalculations in reporting results.
Qualitative PCR
In a qualitative analytical setup, the PCR components arecombined with DNA extracted from the unknown sample. Ifthe DNA sample contains the target DNA sequence inquestion, this sample DNA will function as the template DNAthat can be amplified successfully. Together with appropriatenegative controls, detection of the correct PCR productindicates the presence of the targeted DNA sequence in theoriginal sample. Absence of PCR product in conjunction withsuitable positive controls implies the DNA target was notpresent in detectable amounts.
Qualitative PCR products are commonly analyzed byagarose or polyacrylamide gel electrophoresis (30). Applyinga voltage will cause the negatively charged DNA to migrateand will separate DNA fragments according to their length.The very large numbers of identical DNA molecules that arethe product of the PCR form a distinct band that can bevisualized as UV fluorescence using the fluorophor ethidiumbromide or other means.
At the end of the PCR, the intensity of the signals may varybetween samples. However, the signal does not necessarilycorrelate in a linear way to the amount of target DNA that waspresent in the beginning of the reaction, primarily becausePCR of this type stall and enter a plateau phase after largeamounts of PCR product have been made, usually due toexhaustion of one or more substrate(s). Analyzing PCRproducts after the reaction is finished restricts the results tomerely detected or not detected (positive or negative).
Qualitative PCR assays are used in 2 main ways. The firstway is a simple test to determine whether the sequence inquestion is present in a bulk sample (usually flour or otherprocessed material). The second way is semiquantitative. Ifthe sample is made up of seeds or grain, or other discrete units,
LIPP ET AL.: JOURNAL OF AOAC INTERNATIONAL VOL. 88, NO. 1, 2005 141
a number of test samples can be used to estimate the number of particles (seeds or grains) that contain the target analyte. As an example, instead of testing a single bulk of 1000 seeds orgrains, the analyst can make 10 pools of 100 seeds or grains.The number of pools that test positive for the analyte gives anestimate of the number of positive seeds in the lot. Thismethod works only when the percentage of positive seeds inthe sample is low (typically below 5%). For example, if 5 outof 10 pools each containing 100 seeds test positive, then thecalculated level of the adventitious presence is 0.69% and the95% confidence limits are 0.21 to 1.66% (31). This is muchmore information than can be gained by testing a single pool,in which the answer would be “positive.”
Another advantage of the semiquantitative approach is that the method can be applied in a range that is well above theLOD; thus, the likelihood of false-positive or -negative results will be significantly lower. Nevertheless, care has to be takenthat contamination with fragments of seed, grain, or dust doesnot cause false-positive results.
Quantitative PCR
There are various approaches to quantification of GMmaterial in a sample using PCR. In all cases, quantification byPCR determines the amount of GM DNA vs a reference DNAtarget (e.g., maize or soy DNA). This is not a directweight-to-weight measurement. The following is a discussionof various real-time PCR chemistries, as well as differentapproaches for standard curve generation and data analysis.
Real-time PCR technology allows for the monitoring offluorescence associated with amplification productsthroughout the PCR process. This technology is availablewith different types of fluorescent chemistries. Examples arefluorogenic probes (i.e., TaqMan®, FRET), Scorpion™
primers, and SYBR® Green.
With TaqMan fluorogenic probes, an additionaloligonucleotide, located between the 2 primers required foramplification, is added. This probe is labeled with afluorescent reporter dye and a corresponding quencher dye.The quencher dye absorbs the fluorescence from the reporterdye, and when they are in close proximity, no fluorescentsignal is emitted. During the extension phase of the PCR, thepolymerase breaks down the probe, thus physically separating the quencher dye from the reporter dye. This results in thereporter dye emitting a fluorescent signal upon excitation. The amount of fluorescence can be measured in real-time and used for quantification purposes.
With Scorpion primers, no additional probe is added, but 1of the 2 PCR primers is specially configured and labeled witha fluorescent dye and a corresponding quencher, as with theaforementioned fluorescent probe. The primer is arranged toform a hairpin loop structure, enabling the quencher to be inclose proximity with the reporter dye. During the extensionphase, the Scorpion primer unfolds to hybridize with the newdaughter strand, and the hairpin loop within the Scorpionprimer disassociates, separating the fluorescent reporter dyefrom the quencher.
SYBR Green quantification is a completely differentapproach. It uses a dye (SYBR Green) that binds todouble-stranded DNA and quantifies the amount ofdouble-stranded DNA produced. SYBR Green will quantifyboth specific and nonspecific PCR products. In contrast,Scorpion primers and fluorogenic probes will only hybridizewith specific PCR products downstream in the PCR, resultingin higher specificity and lower background noise than SYBRGreen assays.
Using real-time PCR equipment, such as the ABI Prism®
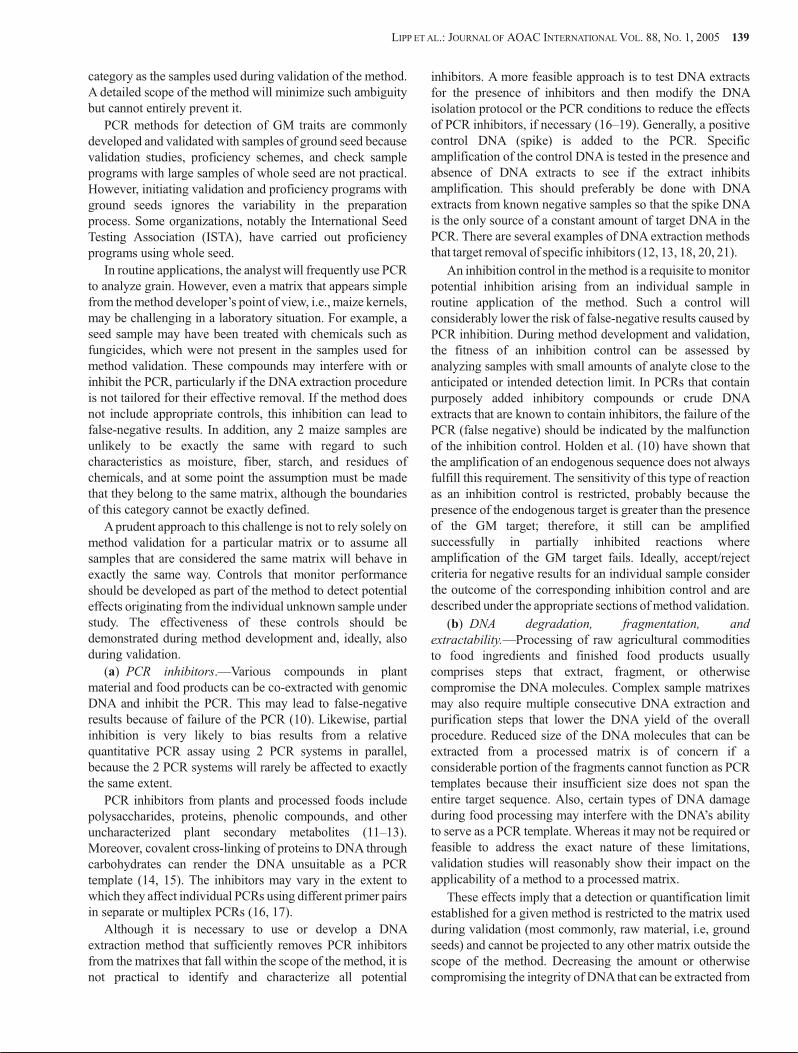
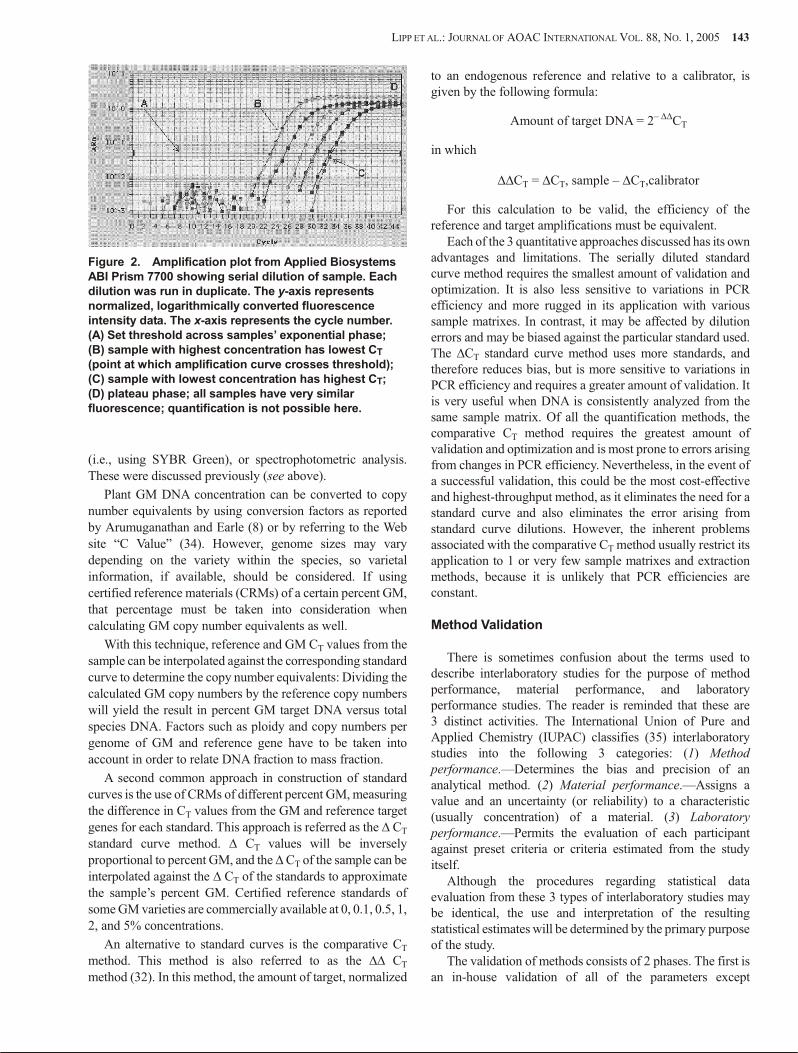
7700 or 7900 (Applied Biosystems, Foster City, CA),LightCycler® (Roche Diagnostics, Indianapolis, IN),I-Cycler® (Bio-Rad, Richmond, CA), or the Mx3000P™(Stratagene, La Jolla, CA), fluorescence can be monitored and analyzed through this process via computer interface. Aspreviously mentioned, fluorescent signals will eventuallyplateau after a number of PCR cycles; therefore, end pointfluorescence is not suitable for quantification. However, byplotting the fluorescence vs cycle number (Figure 2), andassigning a threshold within the exponential phase of thefluorescence amplification, the corresponding cycle numberat which fluorescence crosses this threshold will be inverselyproportional to the amount of DNA target in the sample.Therefore, this cycle number, referred to as cycle threshold(CT), can be used to quantify target DNA amounts.
With the resulting quantitative data, real-time PCRtechniques can be used to determine the percentage of a GMDNA sequence in a sample. Values can be determined for aGM target DNA and compared to total target species DNA,which is determined by use of a species-specific, preferablysingle-copy reference gene (an endogenous control gene).Quantification units will, therefore, be the amount of the GMsequence expressed as a percentage of the reference DNA(example, 1% RR soy DNA vs total soy DNA). PCR for GMand reference sequences can be performed either in separatetubes, or in the same reaction using reporter dyes thatfluoresce at different wavelengths (multiplex). With multiplex reactions, individual component concentrations (i.e., primers,probes, deoxynucleotides) have to be carefully titrated andvalidated to protect against competitive effects between the2 target amplifications. Multiplex PCR also introduces someerrors into the final results because of limitations influorescence multicomponent analysis (32).
Quantification can be achieved with 2 approaches: Oneapproach is to construct a standard curve and interpolatevalues into the standard curve to extract data. The secondapproach is the comparative CT method (32).
There are 2 common ways of constructing a standard curve for quantitative analysis. One common way is the use of aserial dilution of DNA of known concentration and GMcontent. GM DNA from certified reference materials,plasmids, or hybrid amplicons (33) can be used for thestandard curve. In any case, the target DNA copy number must be precisely quantified beforehand. Examples of DNAconcentration quantification techniques are fluorometry (i.e.,using Hoechst or Picogreen® dyes), melting curve analysis
142 LIPP ET AL.: JOURNAL OF AOAC INTERNATIONAL VOL. 88, NO. 1, 2005
(i.e., using SYBR Green), or spectrophotometric analysis.These were discussed previously (see above).
Plant GM DNA concentration can be converted to copynumber equivalents by using conversion factors as reportedby Arumuganathan and Earle (8) or by referring to the Website “C Value” (34). However, genome sizes may varydepending on the variety within the species, so varietalinformation, if available, should be considered. If usingcertified reference materials (CRMs) of a certain percent GM,that percentage must be taken into consideration whencalculating GM copy number equivalents as well.
With this technique, reference and GM CT values from thesample can be interpolated against the corresponding standard curve to determine the copy number equivalents: Dividing thecalculated GM copy numbers by the reference copy numberswill yield the result in percent GM target DNA versus totalspecies DNA. Factors such as ploidy and copy numbers pergenome of GM and reference gene have to be taken intoaccount in order to relate DNA fraction to mass fraction.
A second common approach in construction of standardcurves is the use of CRMs of different percent GM, measuring the difference in CT values from the GM and reference targetgenes for each standard. This approach is referred as the D CT
standard curve method. D CT values will be inverselyproportional to percent GM, and the D CT of the sample can be interpolated against the D CT of the standards to approximatethe sample’s percent GM. Certified reference standards ofsome GM varieties are commercially available at 0, 0.1, 0.5, 1, 2, and 5% concentrations.
An alternative to standard curves is the comparative CT
method. This method is also referred to as the DD CT
method (32). In this method, the amount of target, normalized
to an endogenous reference and relative to a calibrator, isgiven by the following formula:
Amount of target DNA = 2– DDCT
in which
DDCT = DCT, sample – DCT,calibrator
For this calculation to be valid, the efficiency of thereference and target amplifications must be equivalent.
Each of the 3 quantitative approaches discussed has its own advantages and limitations. The serially diluted standardcurve method requires the smallest amount of validation andoptimization. It is also less sensitive to variations in PCRefficiency and more rugged in its application with varioussample matrixes. In contrast, it may be affected by dilutionerrors and may be biased against the particular standard used.The DCT standard curve method uses more standards, andtherefore reduces bias, but is more sensitive to variations inPCR efficiency and requires a greater amount of validation. Itis very useful when DNA is consistently analyzed from thesame sample matrix. Of all the quantification methods, thecomparative CT method requires the greatest amount ofvalidation and optimization and is most prone to errors arisingfrom changes in PCR efficiency. Nevertheless, in the event ofa successful validation, this could be the most cost-effectiveand highest-throughput method, as it eliminates the need for astandard curve and also eliminates the error arising fromstandard curve dilutions. However, the inherent problemsassociated with the comparative CT method usually restrict itsapplication to 1 or very few sample matrixes and extractionmethods, because it is unlikely that PCR efficiencies areconstant.
Method Validation
There is sometimes confusion about the terms used todescribe interlaboratory studies for the purpose of methodperformance, material performance, and laboratoryperformance studies. The reader is reminded that these are3 distinct activities. The International Union of Pure andApplied Chemistry (IUPAC) classifies (35) interlaboratorystudies into the following 3 categories: (1) Methodperformance.—Determines the bias and precision of ananalytical method. (2) Material performance.—Assigns avalue and an uncertainty (or reliability) to a characteristic(usually concentration) of a material. (3) Laboratoryperformance.—Permits the evaluation of each participantagainst preset criteria or criteria estimated from the studyitself.
Although the procedures regarding statistical dataevaluation from these 3 types of interlaboratory studies maybe identical, the use and interpretation of the resultingstatistical estimates will be determined by the primary purpose of the study.
The validation of methods consists of 2 phases. The first isan in-house validation of all of the parameters except
LIPP ET AL.: JOURNAL OF AOAC INTERNATIONAL VOL. 88, NO. 1, 2005 143
Figure 2. Amplification plot from Applied BiosystemsABI Prism 7700 showing serial dilution of sample. Eachdilution was run in duplicate. The y-axis representsnormalized, logarithmically converted fluorescenceintensity data. The x-axis represents the cycle number.(A) Set threshold across samples’ exponential phase;(B) sample with highest concentration has lowest CT
(point at which amplification curve crosses threshold);(C) sample with lowest concentration has highest CT;(D) plateau phase; all samples have very similarfluorescence; quantification is not possible here.
reproducibility. The second is a collaborative trial, the mainoutcome of which is a measure of the repeatability andreproducibility in order to estimate the transferability ofmethods between laboratories. It is our experience that asmall-scale collaborative trial should be performed to test theruggedness of a particular method before the expense oforganizing a large-scale trial is incurred. In case anyimprovement of the method or the method description isneeded, only limited costs are incurred through the pretrial,whereas a failure of a full interlaboratory method validationbecause of an ambiguous method description is a very costlyfailure. Implementation of an already validated method in alaboratory needs to include the confirmation that theimplemented method performs as well under local conditionsas it did in the interlaboratory method validation.
A method must be validated by using the protocols andreaction conditions under which it will be performed. Forexample, the protocol should not be changed using higher orlower numbers of amplification cycles. These and otherchanges, as well as the application to a different matrix, arelikely to affect method characteristics such as the specificity or sensitivity. PCRs may have a tendency of unspecificbackground amplification at low rates, which can be toleratedif the specified conditions and number of cycles do not resultin analytical artifacts as demonstrated by validation. However, they can be expected to result in artifacts if operated with more cycles and/or under nonoptimal conditions.
This document deals primarily with the use ofinterlaboratory studies for the assessment of methodperformance. However, before use at a particular location, any method must be subjected to an in-house validationprocedure.
The results of a determination are often expressed in termsof percent of a sample that contains a particularbiotechnology-derived sequence. In a quantitative test, thismeasurement actually involves 2 PCR-based determinations:that of the primary analyte (e.g., an inserted gene sequence)and that of the endogenous or comparator sequence (e.g., anendogenous maize gene). Each of these determinations has itsown uncertainties, and the 2 are likely to have differentmeasurement characteristics. In most applications, theprimary analyte will be present at low concentrations and thecomparator will be present at concentrations 10–1000 timeshigher. Thus, it is important that both measurements areproperly validated. In cases in which the measurement isexpressed directly as a percentage (as in the use of DCT), thesefactors must be considered when validating the method.
Validation Parameters
The method performance study or method validationestablishes the performance characteristic for a specificmethod application, i.e., a specific analytical procedure for awell-defined scope. In the following text, the spirit of the most relevant terms has been captured by a simple definition for use in this document (Table 1). For a more detailed discussion andexplanation of the definitions, refer to the Procedural Manualof Codex Alimentarius (36).
The concepts of a LOD, limit of quantitation (LOQ), andROQ are not yet explicitly defined by Codex Alimentarius.These parameters can be considered to pertain to theapplicability of the method. However, as they are useful forsome applications, definitions are also given in Table 1.
The LOD is the amount of analyte at which the analyticalmethod detects the presence of the analyte at least 95% of thetime (<5% false-negative results). This and the false-positiverate are the only parameters required for a qualitative method,other than specificity.
Determination of an LOD is not necessarily needed toestablish the validity of a method for a given qualitativeapplication if it can be shown that the false-negative rate is<1% in the range of the application. For example, the precisedetermination of the LOD to be 1 ng/kg does not add muchvalue when the scope of the method validation extends onlyfor concentrations ranging in g/kg. Similar considerationsapply for the LOQ. However, the range over which a methodis applicable (ROQ) should always be established andincluded in the validation study.
Many quantitative methods are applied and have their most linear response near the LOQ. In such cases, it is important toknow the LOD and LOQ in order to determine whether anobserved result is, in fact, significantly different from thebackground, and can be satisfactorily quantified. In aquantitative method, it is common practice to assume thatLOD is the signal strength of a blank increased by 3 times thestandard deviation of the blank. However, this method gives at best an estimate, relies on normal Gaussian distribution of theblank measurements around zero, and may give a lower valuethan the actual LOD. Its use is not valid in methods such asquantitative PCR, in which the distribution of measurementvalues for blanks is typically truncated at zero and thus is notnormally distributed. Thus, the LOD needs to beexperimentally determined unless the targeted concentrationsare well above the LOD, and the LOD, therefore, becomesirrelevant.
For a quantitative method, it is also important to knowwhether the LOQ for a particular matrix is close to the valuesto be measured. Again using a traditional approach, the LOQhas to be expressed as the signal strength of a blank increasedby 6–10 times the standard deviation of the blank. These datamust be experimentally determined, as discussed previously,unless it is known from other sources that the measured values range so high above the LOQ that this information becomesirrelevant. However, this method to determine the LOQ leadsonly to an estimate of the LOQ that may be an artificially highor low approximation.
In practice, 2 procedures have been used to determine theLOQ. The first approach is to assay a number of negativesamples that have been supplemented (spiked) with knownamounts of analyte. The LOQ is then the level at which thevariability of the result and percent recovery of the analytemeet certain pre-set criteria. For small molecules, thesecriteria have typically been a coefficient of variation of 20 and70–110% recovery (37). DNA recovery, however, may bedifficult from some matrixes, e.g., starches or ketchup, and
144 LIPP ET AL.: JOURNAL OF AOAC INTERNATIONAL VOL. 88, NO. 1, 2005
lower recovery efficiencies may have to be accepted. Whenrecovery efficiencies are low, this must be stated in thevalidation data and in the analytical report. The second, morecomplete approach is to test the method using a number ofsamples that contain known amounts of the GM material. This is more complicated, as it requires access to significantquantities of reference materials that contain a known range of concentrations of the GM event of interest. Procedures forassessing LOD and LOQ during the validation of qualitativeand quantitative PCR methods are described in the followingtext.
Parameters Common to Qualitative and Quantitative Methods
A number of the parameters measured in a validation arecommon to both qualitative and quantitative methods; someare more applicable to the quantitative methods. Thosecommon to both types of methods will be discussed first.
(a) Specificity.—Specificity is the starting point for amethod and needs to be considered during primer design.Primers should be checked against the known sequence of theevent insert and pertinent databases for possible matches.Experimental confirmation of the specificity must beperformed. The following suggests a reasonable approach; the experiments should be performed during development or
in-house validation of an assay before a larger validation isconducted.
For event-specific assays: (1) analyze a total of at least10 sources, including nontarget GM events and any non-GMplants that may commonly be found as contaminants in thecommodity; (2) test 1 sample from each source (total of atleast 10 DNA samples); (3) analyze 2 replicates for each DNAsample.
Test results shall clearly indicate that no significantpositive signal is observed.
For assays on plant endogenous genes: (1) analyze a totalof at least 10 different plant samples that comprise differentvarieties of the same plant species as well as other plantspecies important for food production (such as wheat, rice,maize, potato, and soybean) and that may commonly be foundas contaminants in the commodity; (2) test 1 sample from each source (total of at least 10 DNA samples); (3) analyze2 replicates for each DNA sample.
Test results shall clearly indicate that no significantpositive signal is observed.
(b) Applicability.—It is not feasible to provide referencematerials for every one of the thousands of food matrixesavailable, so the use of a seed-derived or other such matrixreference will usually be necessary. The use of the method in a new matrix will need to be validated at a minimum via
LIPP ET AL.: JOURNAL OF AOAC INTERNATIONAL VOL. 88, NO. 1, 2005 145
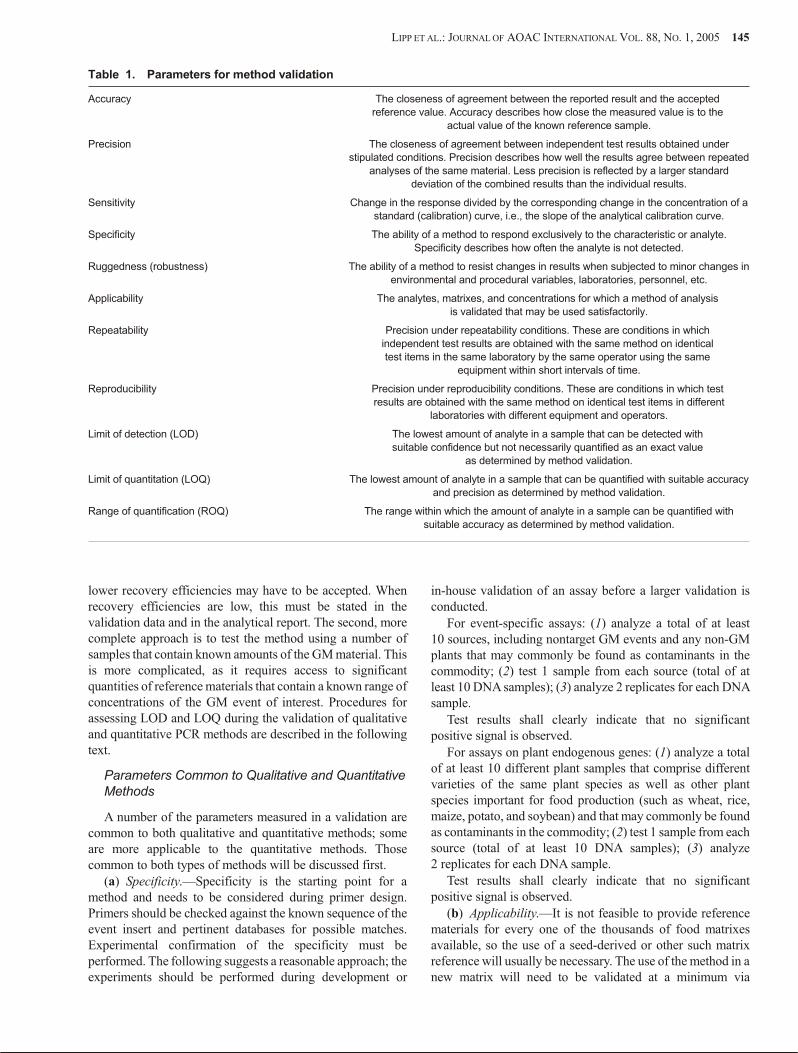
Table 1. Parameters for method validation
Accuracy The closeness of agreement between the reported result and the accepted
reference value. Accuracy describes how close the measured value is to the actual value of the known reference sample.
Precision The closeness of agreement between independent test results obtained understipulated conditions. Precision describes how well the results agree between repeated
analyses of the same material. Less precision is reflected by a larger standarddeviation of the combined results than the individual results.
Sensitivity Change in the response divided by the corresponding change in the concentration of astandard (calibration) curve, i.e., the slope of the analytical calibration curve.
Specificity The ability of a method to respond exclusively to the characteristic or analyte.
Specificity describes how often the analyte is not detected.
Ruggedness (robustness) The ability of a method to resist changes in results when subjected to minor changes in
environmental and procedural variables, laboratories, personnel, etc.
Applicability The analytes, matrixes, and concentrations for which a method of analysis
is validated that may be used satisfactorily.
Repeatability Precision under repeatability conditions. These are conditions in which independent test results are obtained with the same method on identical
test items in the same laboratory by the same operator using the same
equipment within short intervals of time.
Reproducibility Precision under reproducibility conditions. These are conditions in which test results are obtained with the same method on identical test items in different
laboratories with different equipment and operators.
Limit of detection (LOD) The lowest amount of analyte in a sample that can be detected with
suitable confidence but not necessarily quantified as an exact value as determined by method validation.
Limit of quantitation (LOQ) The lowest amount of analyte in a sample that can be quantified with suitable accuracy and precision as determined by method validation.
Range of quantification (ROQ) The range within which the amount of analyte in a sample can be quantified with
suitable accuracy as determined by method validation.
in-house validation, which may be done using spike andrecovery experiments, and the reference material used shouldbe described on the report to the customer.
Validation of a Qualitative PCR Method
The following section concentrates on issues surroundingvalidation of qualitative methods. However, many of theprinciples also apply to quantitative methods, especially when they are used in a qualitative way. The sensitivity of aqualitative method must be shown to be such that it canreliably detect 1 positive particle (e.g., seed) in a pool and does not give rise to a significant number of false positives. Aconcept of using false-positive and -negative rates to describethe accuracy and precision of a qualitative assay has beendeveloped for microbial assays (38). This concept can beapplied to qualitative PCR assays. A critical issue in thevalidation of this type of method is the availability of testmaterials that are known to be positive and negative. Theprovision of negative reference materials is particularlyimportant and critical in the case of a qualitative method. Anyimpurities present must be only at levels so low that theybecome negligible. Development of reference materials iscovered later in this article.
(a) False-positive and -negative results.—By their verynature, qualitative tests result only in yes/no answers. Themeasures of precision and accuracy are the frequencies offalse-negative and/or false-positive results. False-negativeresults indicate the absence of a given analyte when in fact theanalyte is present in the sample; false-positive results indicatethe presence of an analyte that is not present in the sample.Because of the inherent nature of the analytical technique, anincrease in false-negative results will be observed when theamount of analyte approaches the LOD of the method. Like theLOD for quantitative methods, the LOD for a qualitative methodcan be defined as the concentration at which a positive sampleyields a positive result at least 95% of the time. This results in arate of false-negative results of 5% or less. During validation of aqualitative PCR assay, it is also important to determine thefrequency of false-positive results (a positive result obtainedusing a sample that is known to be negative). Both false-positiveand -negative results are expressed as rates (38).
(1) False-positive rate.—This is the probability that aknown negative test sample has been classified as positive bythe method. The false-positive rate is the number ofmisclassified known negatives divided by the total number ofnegative test samples (misclassified positives plus the numberof correctly classified known negatives) obtained with themethod.
For convenience, this rate can be expressed as percentage:
% false - positive results = number of misclassified known negative samples
total number of negative test results [incl. misclassified]100´
(2) False-negative rate.—This is the probability that aknown positive test sample has been classified as negative bythe method. The false-negative rate is the number ofmisclassified known positives divided by the total number ofpositive test samples (misclassified positives plus the number
of correctly classified known positives) obtained with themethod.
For convenience this rate can be expressed as percentage:
false - negative results, % = number of misclassified known positive samples
total number of positive test results [incl. misclassified]´ 100
In order to demonstrate the false-negative rate for aqualitative assay, a series of samples (e.g., grain/seed pools)with a constant, known concentration of positive material in apool of negative material (e.g., 1 positive kernel in199 conventional maize kernels) has to be analyzed and theresults evaluated. The concept of confidence intervals andstatistical uncertainty needs to be applied to the risk offalse-positive and/or false-negative results as well. Thedesired level of confidence determines the size and number ofpools that need to be tested. For example, 100 positive testresults obtained from 100 independent measurements on trulypositive samples lead to the conclusion that the level offalse-negative results is below 4.5% at a confidence level of99% for the tested concentration of positive kernels(expressed as the number of positive kernels in a pool ofnegative kernels).
(b) Ruggedness.—As with any validated method,reasonable efforts must be made to demonstrate theruggedness of the assay. This involves careful optimizationand investigation of the impact of small modifications thatcould occur for technical reasons.
(c) Acceptance criteria and interpretation of results.—Avalidated method includes criteria from which an observedmeasurement result can be accepted as valid. It is important tofollow these criteria and to observe the rules for datainterpretation. It is, therefore, important to ensure that theresult of the positive DNA target control is positive. Similarly,the amplification reagent control (a control containing all thereagents, except extracted test sample template DNA, which is replaced by a corresponding volume of nucleic acid-freewater or buffer) must be negative.
In addition to these controls, it is desirable to conduct aparallel reaction on the same DNA sample using a primer setthat detects an endogenous single copy sequence. Thisreaction is performed on every DNA sample and can either bein the same reaction (multiplexed) or as a separate reaction. Inthe case of multiplexed reactions, it is important for theendogenous reaction not to out-compete the event-specificreaction for reagents, as the endogenous sequence is likely tobe present at a rate up to 1000-fold the amount of the targetsequence. The control reaction with the endogenous sequencecan give an indication of the quality of the DNA as a templatefor the PCR.
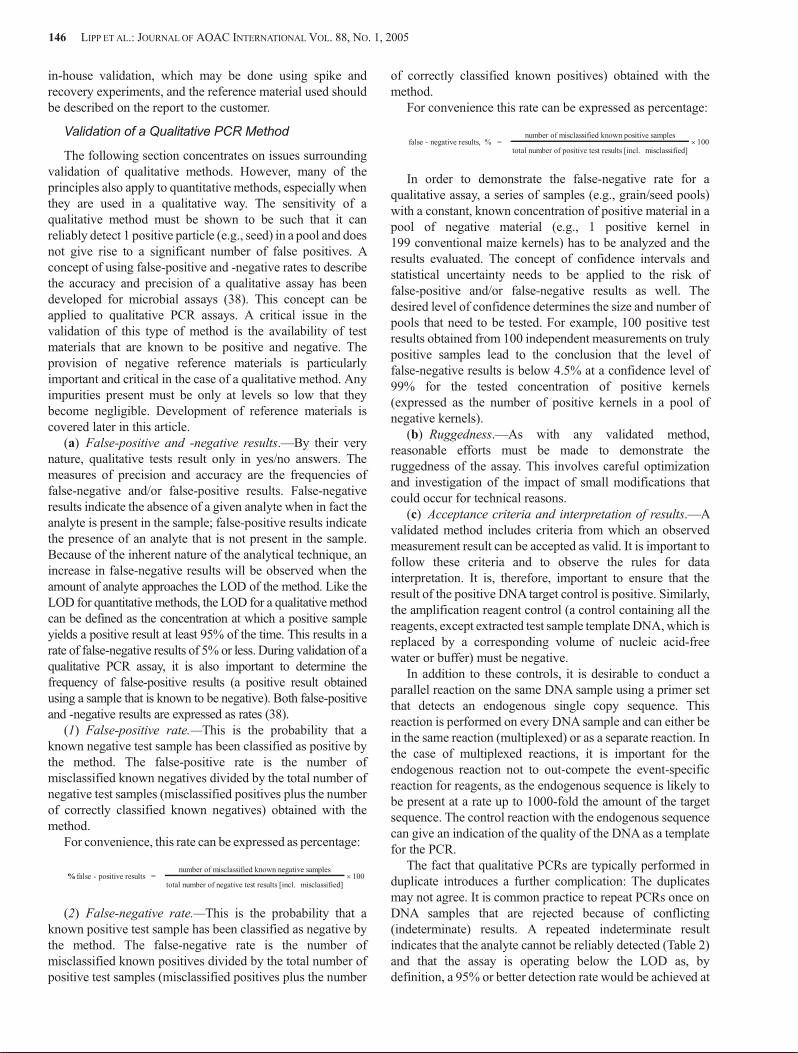
The fact that qualitative PCRs are typically performed induplicate introduces a further complication: The duplicatesmay not agree. It is common practice to repeat PCRs once onDNA samples that are rejected because of conflicting(indeterminate) results. A repeated indeterminate resultindicates that the analyte cannot be reliably detected (Table 2)and that the assay is operating below the LOD as, bydefinition, a 95% or better detection rate would be achieved at
146 LIPP ET AL.: JOURNAL OF AOAC INTERNATIONAL VOL. 88, NO. 1, 2005
the LOD. The sample is, therefore, scored negative. Similarcriteria apply if more replicates are performed on each DNAsample.
Validation of a Quantitative PCR Method
A harmonized ISO/IUPAC/AOAC protocol wasdeveloped for chemical analytical methods. This defines theprocedures necessary to validate a method (39). All theprinciples and rules of the harmonized protocol are applicableto quantitative PCR methods. The parameters involved invalidation of the performance of a quantitative PCR assayinclude LOD, LOQ, ROQ, accuracy, precision, sensitivity,and ruggedness. Other important factors are acceptancecriteria and interpretation of results, and the units in which theresults are expressed.
A quantitative PCR assay typically consists of 2 assays:one determines the amount of DNA specific for the GMproduct; the other is specific for the amount of plant-specificDNA. Each of these assays is considered separately, becausethey are independent analytical procedures. Thus, allparameters listed below, including specificity and sensitivity,have to be assessed individually for each of the assaysinvolved. A method validation for the whole assay cannot beappropriately performed unless both assays are validatedindividually.
(a) Limits of detection and quantitation (LOD andLOQ).—If validation of the quantitative PCR assay showsthat the assay can measure GM plant DNA at the requiredconcentration with acceptable trueness and precision, then it is often not necessary to determine the LOD and LOQ, as themethod is only being applied above the range where these arerelevant. However, if the method is being used atconcentrations close to the LOD and LOQ (typically0.1–0.5%), then the assessment of the LOD and LOQ willbecome part of the validation procedure.
(b) Range of quantification (ROQ).—The ROQ of themethod defines the concentration range over which theanalyte will be determined. Typically, the range for a GMproduct will run from a tenth of a percent up to a few percent;the endogenous control range will be close to 100%, unlessthe testing of complex mixtures is envisioned. This desiredconcentration range defines the standard curves, and asufficient number of standards must be used to adequatelydefine the relationship between concentration and response.The relationship between concentration and response shouldbe demonstrated to be continuous and reproducible andshould be linear after suitable transformation.
The quantitative method is designed to operate in the rangeof 0.1–100% (DNA %, w/w). However, it is common tovalidate a method for a range of concentrations that is relevantto the ROQ of the application. If a method is validated for agiven range of values, the range may not be extended withoutvalidation. For certain applications (e.g., seed or grainanalysis), the use of genomic DNA for the preparation of thestandard curve (see discussion on the use of plasmid DNAbelow) may be considered. Although it is easy to establish anominal 100% standard (limited only by the purity of the
materials used), it is difficult to reliably produce standardsolutions <0.1%. This is due to the uncertainties involved inmeasuring small volumes and the error propagation if serialdilution steps are applied. Additionally, the number of targetsites (DNA sequence to be amplified) becomes so small thatstochastic errors will begin to dominate and no reliableanalysis is possible (9, 40). If genomic DNA is chosen to beused as calibrator, it is important that this calibrator be tracedback (in its metrological meaning) to a reference of highestmetrological order, e.g., a CRM. The range will be established by confirming that the PCR procedure provides an acceptabledegree of linearity and accuracy when applied to samplescontaining amounts of analyte within or at the extremes of thespecified range of the procedure.
(c) Accuracy and precision.—The accuracy of a methodshould be compared to known values derived from referencematerials. This may be a challenge in this field because of thelimited availability of such materials. However, the accuracymust be compared to the best available reference material.Precision will be determined in the usual way fromsingle-laboratory (repeatability) and multilaboratory(reproducibility) studies.
(d) Sensitivity.—A linear relationship of the CT as afunction of the logarithm of the concentration of the targetshould be obtained across the range of the method. Thecorrelation coefficient, y-intercept, slope of the regressionline, and percent of residual should be reported. The percentof residual for each of the calibrators should preferably be£30%.
In order to obtain a standard curve for event-specificquantitative assays, standard DNA mixtures can be preparedby combining purified genomic DNA from GM and non-GMplant material such as seed or leaves. The content of GM plantDNA in the mixtures might be 100, 50, 10, 5, 1, 0.5, 0.1, and0% or as appropriate for a smaller concentration range. Threereplicates should be analyzed for each point on the standardcurve.
For quantitative assays on plant endogenous genes,standard DNA mixtures can be prepared by combiningpurified genomic DNA from the target plant species and thatof a nontarget plant species. For example, for validation of amaize ADH1 quantitative assay, the target plant species ismaize and the nontarget plant species could be soybean oranother species. The content of DNA of the target plantspecies in the mixtures is typically 100, 90, 80, etc., and 0% or
LIPP ET AL.: JOURNAL OF AOAC INTERNATIONAL VOL. 88, NO. 1, 2005 147
Table 2. Criteria for scoring duplicate qualitative PCRanalyses
Lane 1 Lane 2 Scoring of test
+ + Positive
– + Repeat/indeterminate
+ – Repeat/indeterminate
– – Negative
as appropriate. Three replicates should be analyzed for eachpoint on the standard curve. When the DCT method is used, itwill be the responsibility of the analyst to ensure that theoverall amount of DNA is within the range for which the assay was validated.
(e) Ruggedness.—The evaluation of ruggedness(robustness) demonstrates the reliability of a method withrespect to inadvertent variations in assay parameters.Variations that may be included are reaction volumes (e.g., 25vs 30 mL), annealing temperature (e.g., plus and minus 1°C),and/or other relevant variations. The experiments need to beperformed at least in triplicate, and the recovery needs to becalculated. The response of an assay with respect to thesesmall changes should not deviate more than ±30% from theresponse obtained under the original conditions.
(f) Acceptance criteria and interpretation of results.—Avalidated method also includes criteria on which the observedmeasurement result can be accepted as valid. It is important tofollow these criteria and to observe the rules for datainterpretation. If a case calls for the deviation from saidcriteria and rules, a new method validation study would beneeded to demonstrate the validity of the new rules andprocedures.
At a minimum, the following acceptance criteria arecommon to all quantitative PCR methods and applicable toeach PCR run: (1) the result of the positive DNA target control with, for example 1% GM DNA, the mean of the replicatesdeviates <3 standard deviations from the assigned value. Atarget DNA control is defined as reference DNA or DNAextracted from a certified reference material or knownpositive sample representative of the sequence or organismunder study. The control is intended to demonstrate the resultof analyses of test samples containing the target sequence.(2) The amplification reagent control is negative. Theamplification control is defined as a control containing all thereagents, except extracted test sample template DNA. Insteadof the template DNA, a corresponding volume of nucleicacid-free water is added to the reaction. (3) The percent ofresidual for each of the standards should be <30%.
To accept the result of an unknown sample, the relativestandard deviation of the sample replicates should be <30%.
Reference Materials
General Considerations
Reference materials play a number of roles indevelopment, validation, and troubleshooting of PCR-baseddiagnostics, as well as in the routine conduct of such assays. In the context of assay validation, positive reference materialsare used to establish the accuracy, precision, sensitivity, LOD,and false-negative rate in quantitative assays. Negativereference materials are very important in determiningfalse-positive rates and specificity.
Reference materials can be of several levels of metrologicquality: (1) A certified or standard reference material (CRMor SRM®) is accompanied by a specific certificate. Thiscertificate states that one or more of the property values of the
reference material is certified by a procedure that establishesthe value’s traceability to an accurate realization of the unit inwhich the property value is expressed; in addition, thecertificate states a level of confidence of uncertainty (41).Such reference materials are usually issued by NationalMetrology Institutes such as the Institute of ReferenceMaterials and Measurement (IRMM) of the Joint ResearchCenter of the European Union and the National Institute ofStandards and Technology (NIST) in the United States. (2) Areference material (RM) is a reference material or substanceone or more of whose properties are sufficientlyhomogeneous and well established to be used for thecalibration of an apparatus, the assessment of a measurementmethod, or for assigning values to materials (ISO definition).(3) A working standard (WS) is a secondary standard inregular use. This working standard is equivalent to RM if it isquantified/characterized by comparison with the CRM/SRM.
Quality Standards for Reference Materials
A certificate of analysis will accompany each referencematerial. The certificate will describe the characteristics of the material, both as to the presence of the target material and theabsence of other possibly interfering materials. In addition, areference material may even be restricted as to the method forwhich it can be used or is validated.
A certificate of analysis for a GM reference material willaddress the following factors: (1) target event or sequence;(2) adventitious presence of other events; (3) strength andpurity; (4) genetic background.
Target event or sequence.—The first consideration iswhether the material is a reference for a particular event. Inmost detection processes, this will be the case. However, it isforeseeable that many reference materials or workingstandards used in screening methods will be for a certainsequence, such as the 35S promoter. Event reference materials can be used for this purpose, providing it is known how manycopies of the sequence are present in the event.
Adventitious presence of other events.—An importantfactor that will influence the true concentration of the samplesprepared for the validation experiments is, of course, the levelof impurity in the reference materials. The starting materialused for the preparation of the reference materials needs to becharacterized for purity with respect to the desired analyte. Todo so, a representative subsample must be analyzed for theabsence or presence of the analyte in both negative andpositive pools. The sample size and measurement error willdetermine the confidence level of the results.
Positive reference materials are considered to be those thatcontain the event or sequence of interest (e.g., MON810, T25,35S, NOS). Negative reference materials are materials that donot contain the stated event or sequence, at least not at adetectable level. A negative reference material will not have avalue of 0% assigned. The known presence or absence ofother events that may interfere with the analysis should bestated. As with all analytical blanks or negative and positivereference materials, an uncertainty about the assigned valuesneeds to be expressed. Ideally, this uncertainty includes 0%
148 LIPP ET AL.: JOURNAL OF AOAC INTERNATIONAL VOL. 88, NO. 1, 2005
for the negative materials. For example, regarding RoundupReady® soybeans, currently available negative referencematerials (Joint Research Center, IRMM, Geel, Belgium) areassigned to contain <0.03% Roundup Ready soybeans (42).This value reflects the uncertainty of the methods andsampling procedures used for the certification exercise of thematerials. This is particularly the case for any materialprepared from grain, as it is not feasible to test every grainkernel before using it in a reference material. Thus, a reference material certificate will typically state that it contains less thana particular amount (e.g., <0.03%) of other events, whichshould be listed explicitly, with a known certainty (e.g., 99%).Similar restrictions or considerations are applicable for allreference materials used in analytical sciences.
Strength and purity.—Strength and purity are2 measurements that normally are determined for a referencematerial. However, how the strength and purity of a GMreference material is defined is not yet clear.
(1) Strength.—In some cases, it can be clearly stated that asample is of 100% strength. For example, if DNA is preparedfrom a single homozygous plant, this DNA sample can beconsidered to have a strength of 100%, if a procedure has been used that produces essentially uncontaminated material. If theDNA was produced from a heterozygous plant, then it can beargued that the strength is 50%. This, however, ignores theeffect of chloroplast DNA, which may dilute the sample tobelow 100 or 50%, depending on the definition. Specialconsiderations may apply for hemizygous maize grainmaterial in which the strength may depend on whether theapplicable gene was introduced via the male or female parent,resulting from variations in zygosity of the tissues in thekernel.
(2) Purity.—Classically, purity is the percentage of thesample that consists of the material. For example, if a samplecontains >99% DNA, then its purity would be >99%.
Strength and purity also may depend on loss of particulatematerial during any sieving process, unless such material isreground and added back to the sample. These factors may beexpressed in alternative terms, such as the mass fraction (w/w) of the stated material.
Genetic background.—Many reference materials areprepared by mixing GM with non-GM materials. Comparisonof the 2 sources as to whether they consist of near-isogeniclines may be included, if desired.
Choice of Reference Material
There are a number of matrixes that can be used to developreference materials or working standards for methods ofdetection of GM products. Each has its own advantages anddisadvantages for particular purposes. The 3 referencematerials discussed here include: (1) grain or seed orseed-derived powders; (2) GM DNA of plant origin;(3) plasmid DNA or amplicons containing the target sequence.
For purposes of this discussion, the term “seed” willindicate both grain and seed. Seed is the preferred referencematerial for testing of grain and oilseed commodities. Whendealing with hybrid crops, seed is preferred, as grain will be
segregating for the trait. Both hybrid and inbred seed may beacceptable, provided one is cognizant of potential bias that can be introduced by both approaches. In the case of hybrid seed,the presence of a triploid endosperm in maize and othercereals will make a variable contribution to the number ofPCR targets, depending on whether the GM parental line wasthe male or female parent. Use of inbred seed as a positivereference standard for a hybrid crop (e.g., maize) will result inunderestimation of GM content that is present as hemizygousmaterial if not corrected appropriately.
In addition to these reference materials, there may bereference materials produced that consist of other plantorgans, or refined and finished products. Examples of suchmaterials may be leaves, starch, and lecithin. It is beyond thescope of this paper to discuss these types of materials.
(a) Grain or seed or seed-derived powders.—Given thepresent commercial and trade situation and the present targetcrops for genetic modification, seed is the most commonlyused reference material. Unfortunately, seed may beheterogeneous and the uncertainty factor caused by samplingis significant at all levels. This is particularly true when thereference materials contain <1% of the event in question,unless very large samples are supplied. For example, testingfor the presence of any GM seed in a sample of maize orsoybeans at a level of 0.1% would require testing10 000 kernels (or roughly 3 kg) to achieve a 99% confidencein the analytical result. Even in this case, there will beuncertainty in the actual number of positive kernels in anysample. To use so much material for each reference point isnot practical, and thus, seed powders are used widely.
However, seed mixtures are particularly useful forvalidation of qualitative methods. These validations can bemade using pools of seeds. When preparing the pooledsamples for a validation study, the following errors must betaken into consideration: (1) the positive kernel(s) maycontain a small amount of negative kernels with respect to thedesired analyte; (2) the negative kernels may contain a smallamount of positive kernels.
Consequently, the pools that are prepared for use in thevalidation study could be impacted in the following ways:(1) the number of spiked kernels is smaller than calculated,i.e., 1 or more of the spiked positive kernels was actuallynegative; (2) the number of spiked kernels is larger thancalculated, i.e., the negative kernels contained 1 or morepositive kernels.
Table 3 summarizes the probability that a given negativeseed bulk contains at least 1 positive (GM trait) kernel. Table 3 shows that, for large seed pools and high impurity levels in the negative material, the chance of observing at least 1 positivekernel in the pool is essentially 100%. Consequently, whenoperating with large pools, the purity of the negative materialsneeds to be extremely high. In order to assess all variations ofthe true value for a spiked pool, the impurity of the positivematerial (the spike) must therefore be taken intoconsideration.
Table 4 gives examples of the effect of purity in thesituation in which seed pools are spiked with GM material to
LIPP ET AL.: JOURNAL OF AOAC INTERNATIONAL VOL. 88, NO. 1, 2005 149
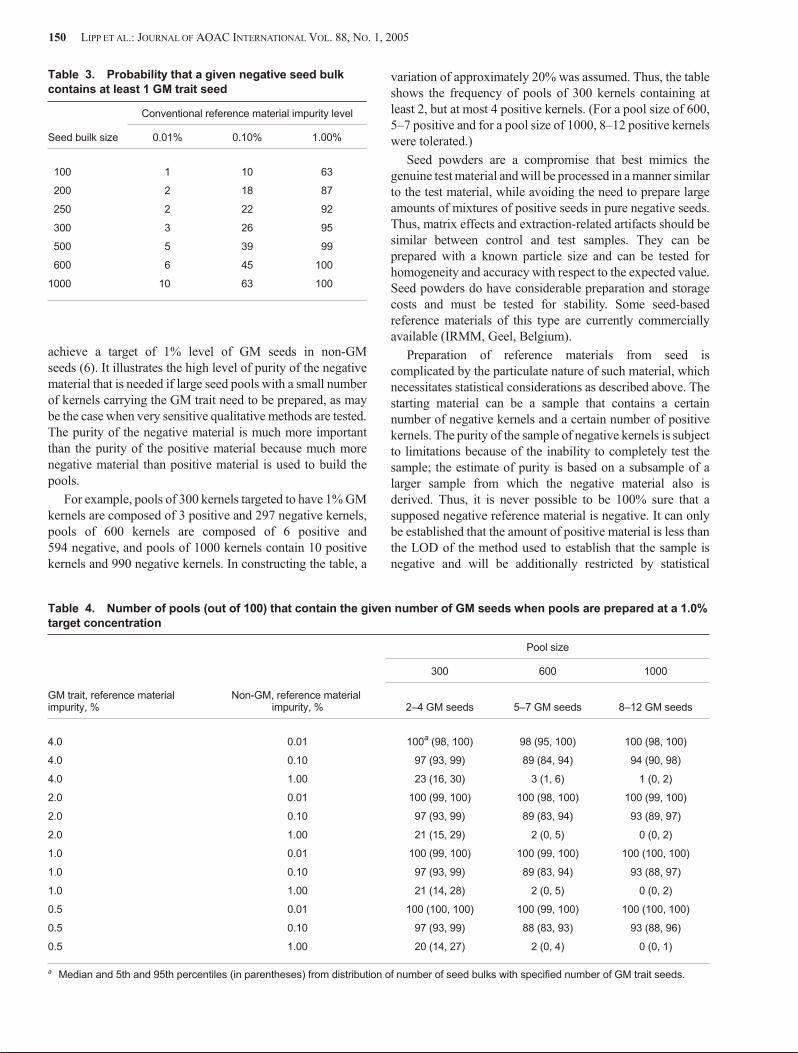
achieve a target of 1% level of GM seeds in non-GMseeds (6). It illustrates the high level of purity of the negativematerial that is needed if large seed pools with a small numberof kernels carrying the GM trait need to be prepared, as maybe the case when very sensitive qualitative methods are tested. The purity of the negative material is much more importantthan the purity of the positive material because much morenegative material than positive material is used to build thepools.
For example, pools of 300 kernels targeted to have 1% GM kernels are composed of 3 positive and 297 negative kernels,pools of 600 kernels are composed of 6 positive and594 negative, and pools of 1000 kernels contain 10 positivekernels and 990 negative kernels. In constructing the table, a
variation of approximately 20% was assumed. Thus, the tableshows the frequency of pools of 300 kernels containing atleast 2, but at most 4 positive kernels. (For a pool size of 600,5–7 positive and for a pool size of 1000, 8–12 positive kernelswere tolerated.)
Seed powders are a compromise that best mimics thegenuine test material and will be processed in a manner similar to the test material, while avoiding the need to prepare largeamounts of mixtures of positive seeds in pure negative seeds.Thus, matrix effects and extraction-related artifacts should besimilar between control and test samples. They can beprepared with a known particle size and can be tested forhomogeneity and accuracy with respect to the expected value.Seed powders do have considerable preparation and storagecosts and must be tested for stability. Some seed-basedreference materials of this type are currently commerciallyavailable (IRMM, Geel, Belgium).
Preparation of reference materials from seed iscomplicated by the particulate nature of such material, whichnecessitates statistical considerations as described above. Thestarting material can be a sample that contains a certainnumber of negative kernels and a certain number of positivekernels. The purity of the sample of negative kernels is subject to limitations because of the inability to completely test thesample; the estimate of purity is based on a subsample of alarger sample from which the negative material also isderived. Thus, it is never possible to be 100% sure that asupposed negative reference material is negative. It can onlybe established that the amount of positive material is less thanthe LOD of the method used to establish that the sample isnegative and will be additionally restricted by statistical
150 LIPP ET AL.: JOURNAL OF AOAC INTERNATIONAL VOL. 88, NO. 1, 2005
Table 3. Probability that a given negative seed bulkcontains at least 1 GM trait seed
Conventional reference material impurity level
Seed builk size 0.01% 0.10% 1.00%
100 1 10 63
200 2 18 87
250 2 22 92
300 3 26 95
500 5 39 99
600 6 45 100
1000 10 63 100
Table 4. Number of pools (out of 100) that contain the given number of GM seeds when pools are prepared at a 1.0% target concentration
Pool size
300 600 1000
GM trait, reference materialimpurity, %
Non-GM, reference material impurity, % 2–4 GM seeds 5–7 GM seeds 8–12 GM seeds
4.0 0.01 100a (98, 100) 98 (95, 100) 100 (98, 100)
4.0 0.10 97 (93, 99) 89 (84, 94) 94 (90, 98)
4.0 1.00 23 (16, 30) 3 (1, 6) 1 (0, 2)
2.0 0.01 100 (99, 100) 100 (98, 100) 100 (99, 100)
2.0 0.10 97 (93, 99) 89 (83, 94) 93 (89, 97)
2.0 1.00 21 (15, 29) 2 (0, 5) 0 (0, 2)
1.0 0.01 100 (99, 100) 100 (99, 100) 100 (100, 100)
1.0 0.10 97 (93, 99) 89 (83, 94) 93 (88, 97)
1.0 1.00 21 (14, 28) 2 (0, 5) 0 (0, 2)
0.5 0.01 100 (100, 100) 100 (99, 100) 100 (100, 100)
0.5 0.10 97 (93, 99) 88 (83, 93) 93 (88, 96)
0.5 1.00 20 (14, 27) 2 (0, 4) 0 (0, 1)
a Median and 5th and 95th percentiles (in parentheses) from distribution of number of seed bulks with specified number of GM trait seeds.
sampling considerations, most notably by the size ofsubsample(s) analyzed.
A further complication in comparing a sample to areference material is present when material is analyzed for thepresence of maize or other monocotyledonous material. Thevarious tissues of the maize kernel are of maternal origin, orreceive different contributions from the male and femaleparent. This will give rise to a different result when theproportion of GM DNA is measured in a sample, dependingon whether the GM component came from the male or femaleparent. This is particularly relevant when testing foradventitious presence of small amounts of GM material, inwhich the adventitious material may have arisen by incomingpollen, or by seed mixing. The analyst should be aware thatthese 2 sources would give rise to different results, eventhough the analyst can do little or nothing to solve theproblem. In addition, processed samples arising from starchyendosperm, the germ, or the pericarp can be subject to similarissues. The issue of parental contribution to the DNA contentof different tissue must be addressed when preparingreference material, and ideally, the type of material (inbred,hybrid material with description of the cross direction) shouldbe included on the certificate of analysis.
Preparing reference material often involves the preparation of materials containing a small percentage of GM in abackground of non-GM material. Some authorities prefer touse mixtures of the GM seed with what they define asnear-isogenic seed. Near-isogenic lines are ideally lines thatdiffer only in the gene of interest, although this is impossibleto achieve in practice because of the nature of plant breedingand the seed multiplication steps that are necessary to produceenough material for reference seed production. This approachcould lead to obtaining seed that is alike in size andcomposition. However, seed for use in the preparation ofreference material must also be of very high purity, andtherefore the GM and non-GM plants must be grown inisolation from each other, either physically, or in time. To doso is particularly important for an outcrossing crop such asmaize. Thus, environmental effects will likely overshadowmost possible benefits that could be obtained by using anear-isogenic line. In a real-life situation, however, thepresence of any GM-seed in a conventional seed lot can be theresult of mechanical mixing or cross-pollination. Both effectswill invariably lead to GM kernels that are not isogenic to thebulk of the material with which they are commingled.
(b) GM DNA of plant origin.—Using GM DNA derivedfrom plant materials other than seed provides somewhat moreflexibility than using seed or powders as a reference material.The storage of DNA solutions may also be easier.
One approach to using GM DNA is to use spiked mixturesof seed as a starting point for a positive control. Seed that hasbeen tested and shown to contain below a threshold of theaccepted level of adventitious material is used as a startingpoint for the negative control. This approach has some of thesame sampling issues that are associated with using seed, atleast concerning the initial material. However, the actual
reference material can be tested for homogeneity, andrelatively small amounts are required.
Another approach to using GM DNA is to use fresh plant(leaf) tissue as the source of the DNA. Negative controls canbe derived from a known non-GM plant; positive controls arederived from mixtures of positive and negative GM DNA tosimulate various percentages of GM presence in grain. In thiscase, it is possible to establish that a particular plant is in factnegative, so that a true negative control can be obtained by use of plant DNA.
The disadvantage of directly using DNA as referencematerial is that it cannot be used to control for extraction andmatrix-related artifacts. Additional biological factors mayalso play a role; as discussed elsewhere in this article, different tissues may exhibit differences in their genetic makeup. Formost agriculturally relevant crops, leaves would not be arelevant commodity, as typically grain is used for food (e.g.,maize, soy, canola, wheat, barley). And, as with any referencematerial, stability may be an issue; the stability of aDNA-based reference material should be tested anddocumented in the certificate of analysis.
Plasmid DNA or Amplicons Containing the TargetSequence
Using a plasmid or amplicon (or cloned fragment)containing the cloned target sequences may be attractive forcertain purposes, such as protocol optimization andtroubleshooting, as well as for an additional positive control.Those using plasmid or amplicon DNA as reference materialusually validate the assay using the matrix of interest and onlythen use the plasmid as reference. As with GM DNA, use ofplasmid or amplicon DNA ignores matrix effects compared tothe test material. The reference DNA is compared to thereference material and is therefore traceable back to thephysical standard. However, this type of DNA has somespecial characteristics.
It is possible that plasmid DNA may behave differently in a reaction if presented as a closed circular, relaxed, or linearform. In addition, measuring the actual copy number ofplasmid or amplicon DNA added to a reaction poses specialchallenges. There is no accurate method to measure suchsmall amounts of DNA, so the amount added must be inferredfrom a dilution series, which may have to take into account the absorption of low concentrations of DNA onto surfaces. Inaddition, the presence of concentrated plasmid solutions inlaboratories poses a potent contamination hazard.
Summary of Reference Material Considerations
In summary, the analyst conducting PCR to detect thepresence of a GM material in seed or processed materials must make a number of decisions. A key decision is the type ofreference material to use. This decision will be influenced bythe availability of reference materials and any consideration of matrix effects. In any case, each method should be validated in the laboratory using a reference material of the highestmetrological standard available (SRM or CRM if possible).
LIPP ET AL.: JOURNAL OF AOAC INTERNATIONAL VOL. 88, NO. 1, 2005 151
The laboratory may then use a reference material or workingstandard that has been calibrated back to the CRM/SRM.
Sources of Errors
Biological Sources of Errors
In determining the percent GM value for an unknownsample, the laboratory must convert the analytical result(copies of the GM gene/copies of the endogenous gene) into apercent GM value (weight to weight). This conversionassumes there is a direct 1:1 relationship between theendogenous control gene and the GM gene. However, thereare many biological factors that can affect this 1:1 relationship and, as such, this basic assumption is not valid in manycircumstances. Of most significance is the effect of biologicalfactors on the 1:1 relationship. This effect is most pronouncedin maize and wheat grains and grain products, but soybeansand cotton are not exempt from the basic physiological issuesdiscussed below. In this discussion, we will focus on the major factors that impact the 1:1 ratio assumptions. A number ofthese impacts appear easy to account for or to develop anadjustment factor for. However, it is important to rememberthe test portion used for testing likely contains a mixture ofGM events, and there is no understanding of the relativecontributions of these events in the test portion. As such, theuse of conversion factors to account for differences in copynumbers is not readily possible. In addition, there are anumber of issues that arise from plant breeding andphysiology that can impact the conversion factors. In thisdiscussion, maize and maize products will be used as the basisfor discussion.
(a) Hybrid status.—A large proportion of maize grown inthe world is produced by using hybrid seed. However, thegrain produced for this seed and used for the production offood and feed does not maintain the homogeneous genotypeand segregates the traits based on simple Mendelianinheritance patterns. The relationship between the GM geneand the endogenous gene can be significantly affected,depending on whether the GM gene comes from the maternalor paternal parent, or both. The most significant effects ofhybrid status appear in the endosperm fraction of maizeproducts, based on its triploid condition, and are discussedunder tissue type effects below.
(b) GM gene copy number.—Several laboratories use the35S and NOS screen to quantify the presence of GM in grainand grain products. With this approach, the testing laboratoryassumes that the endogenous gene and the GM gene arepresent in a 1:1 relationship in the GM grains present in thesample. This relationship is correct in some of the GM eventscurrently on the market. However, it does not hold true for allof the GM events that could be present in a grain or grainproducts. For example, the maize event Bt11 contains 2 copies of the 35S promoter for every 1 copy of the maize(endogenous) gene in the DNA extract. In this specific case,the percent GM level in this sample could be overestimated by a factor of 2´. In general, the assumption that there is a 1:1
ratio generally leads to the overestimation of the amount ofGM present in the sample (43).
(c) DNA degradation.—There is an assumption in thetesting of grain and grain products that the DNA present in thegrain is of good quality and present in all cells. The goal of theanalytical laboratory is to remove DNA in as intact a form aspossible and subject it to the PCR analysis. All DNA testinglaboratories acknowledge that DNA quality is a criticalelement in performing a rugged analytical test. The presenceof high-quality DNA in mature grain, however, may not be anaccurate assumption. There is evidence that the cells of theendosperm undergo apoptosis, or programmed cell death,during the development of the maize kernel (44, 45). Onehallmark of apoptosis is the degradation of the nuclear DNAinto small fragments. These studies show that most of theDNA in mature kernels is degraded to some degree.
(d) DNA endoreduplication.—Endoreduplication resultswhen replication is not coordinated to the cell cycle.Endosperm development in maize is characterized by a period of intense mitotic activity followed by a period in whichmitosis is essentially eliminated and the cell cycle becomesone of alternating S and G phases, leading toendoreduplication of the nuclear DNA. This leads to thepolyploidization, in which a single cell can contain severalcopies of the genome. This process is initiated with the onsetof starch and storage protein synthesis and results inpolyploidy values ranging from 6C to 96C. (The DNA amount in the unreplicated gametic nucleus of an organism is referredto as its C-value, irrespective of the ploidy level of thetaxon; 46, 47). This biological process combined withapoptosis challenges the assumption that maize kernels are agood source of genetic material for quantification of percentGM, as it impacts the relative contribution of germ andendosperm representation in ground maize kernels. Thiscomplexity in genetic contribution and copyrepresentativeness must be taken into account whenquantitative PCR is used.
(e) Outcrossing vs inbreeding.—In the production ofmaize grain in the field, there are 2 sources of pollination.Within any field, a majority of the kernels will be fertilizedwith pollen by plants within the same field. In this case, theplant population will maintain the same average geneticconstitution as original seed materials. In the production ofnon-GM maize, external pollination from neighboring fieldsof GM maize contributes to the production of maize withadventitious GM material. In this case, the resulting maizegrain does not contain the same ratio of GM copies to theendogenous control.
(f) Variability in the genome.—One major assumptionduring the development of the PCR testing metrics for GM isthe calculation of the number of copies in the PCR. This valueis calculated to determine the lowest GM concentration thatcan be estimated from the test portion subjected to PCRanalysis. Generally, the size of a genome is estimated for eachspecies and this value is used to calculate such terms as thetheoretical LOD. The assumption that maize varieties areconsistent in genome size (pg/2C) is not supported by the
152 LIPP ET AL.: JOURNAL OF AOAC INTERNATIONAL VOL. 88, NO. 1, 2005
published literature. For example, the maize genome size isshown to vary by up to 40% (8, 48). This is not restricted towidely disparate maize accessions, and significant variationcan exist within a single seed company’s breeding program(49). A high degree of variability is not restricted to maize, and similar variability can be found in soybeans (50, 51).
(g) Effects of grain processing.—One of the first steps inprocessing maize into a food ingredient involves theseparation of embryo (germ) and endosperm. The germ isfurther processed for the extraction of maize oil andproduction of maize gluten feed. The endosperm is processedto produce starches, syrups, and maltodextrins.
The embryo and endosperm are significantly different atthe genetic level. During the development of a seed, one of the 2 pollen nuclei fuses with the egg cell. This diploid cell typecontinues to develop into the embryo. The second pollennucleus fuses with 2 polar bodies, producing a triploid celltype; this forms the endosperm of the developing seed. Assuch, the embryo maintains a diploid status (1:1 relationship),but the endosperm does not, and the proportion of endogenous gene to GM gene can be either 2:1 or 1:2, depending on hybrid status. Based on this fact, it may be inappropriate to assume a1:1 ratio of the GM gene:endogenous gene when testing foodingredients or food products for the percent GM level.
Analytical/Instrumental Sources of Errors
Total analytical error (or measurement error) refers toassay errors from all sources derived from a data collectionexperiment. The accuracy and precision of a PCR method forGM detection or quantification are subject to influences oftotal analytical error. Total analytical error is of paramountimportance in judging the acceptability of PCR-based GMdetection or quantification methods. Errors in PCR assays canbe classified as follows: (1) random (indeterminate);(2) systematic (determinate).
(a) Random error.—Because the intrinsically uncertainnature of the measurement technique is the source of randomerror, this kind of error occurs in every analysis and is notpredictable. The amount of random error can be greatlyincreased or decreased by a variety of factors in PCR-basedGM detection or quantification methods. Such factors includethe number and complexity of steps in the method, the number of replicates, the skill of the analysts who perform the assay,and the laboratory conditions. For example, 2 analysts withdifferent skills in PCR technique in the same laboratory or2 analysts with similar skill in 2 different laboratories couldproduce different results using the same sample and sameassay procedure. Therefore, a rugged PCR assay is a veryimportant factor in reducing random errors. Random errorscan be reduced by increasing the number of data points andcalculating the mean of these data. The average of a largenumber of data points that are affected only by random error is always accurate.
In a single qualitative PCR, a proper number of replicatesper sample is essential to reduce random errors. In thequantitative PCR method, 3 repeats per sample are theminimum acceptable for the collection of each data point.
Repeatability and reproducibility standard deviations areusually used to estimate random errors. Good statisticalpractices, such as the measurement of coefficient of variation(%CV) or the repeatability standard deviation (RSDr), need tobe implemented in a quantitative PCR method and will aid theanalyst in the evaluation of detection methods and theperformance of such a method under local conditions.Generally, a CV value of replicates should not exceed 30%.
(b) Systematic error.—Systematic errors cause results todeviate from the expected or true values in a constant manner.Sources include improper instrument calibration procedures,insufficient purity of reagents, and improper operation of themeasurement instrument. Generally, systematic errors cannotbe reduced by the application of statistical methods, such astaking the average of replicate measurements. This kind oferror may often be identified by careful validation and dataanalysis and subsequently minimized by modifying theanalytical procedure.
The quality of reagents used in DNA extraction, PCRamplification, and labeled probes in a quantitative PCR assaycan affect the test results. DNA quantification is one of the key steps in a PCR-based assay. Instrument errors caused by amalfunctioning UV-visible spectrophotometer orfluorescence spectrophotometer (for instance, an expired bulb for emission/excitation light sources), or improper operationof the instruments will affect the accuracy of DNAmeasurements, resulting in errors in downstream applications. Routine use of pipet devices in PCR-based assays is anothersource of instrumental errors. All pipet devices requirecalibration on a regular basis.
The most critical instrument in PCR-based methods is athermal cycler. Because temperature change, especially in theannealing step, can alter PCR amplification efficiencies,temperature verification of a thermal cycler is recommended.Temperature changes in the heat and cooling block of athermal cycler can be checked by using a verification system,and many manufacturers will offer this as a service.
Real-time PCR technology has been extensively developed in recent years. Several different types of instrument arecommercially available. They differ in design and manyspecifications, including the heating and cooling system,source of excitation/emission light, detection range offluorescence, and calculation algorithm (software). For thisreason, a quantitative method using real-time PCR technology should be specific to certain types of instruments (e.g., blockcycler). Application of an assay across instruments ofdifferent platforms without calibration or validation will result in errors.
(c) Quality control.—In order to reduce the total analytical error, quality control steps such as training of analysts,standard operation protocols (SOP), and regular instrumentmaintenance should be implemented throughout the assayprocess. Good laboratory practice (GLP), quality assurancesystems according to ISO17025 (52), or other equivalentquality assurance management systems are highlyrecommended. Quality assurance schemes may be required inlaboratories or facilities where PCR-based methods are used
LIPP ET AL.: JOURNAL OF AOAC INTERNATIONAL VOL. 88, NO. 1, 2005 153
for GM detection and quantification in order for the results tobe accepted in some countries. Tools from statistical processcontrol (SPC) can be used to objectively evaluate the nature(random error vs systematic error) and amount ofmeasurement uncertainty.
Conclusions
PCR technology is often used for the detection of productsof agricultural biotechnology. It is critical that such methodsare reliable and give the same results in laboratories across theworld. This can be achieved by proper validation of themethods. The choice of the appropriate reference material will impact the reliability and accuracy of the analytical results. Itis important that analysts pay proper attention to the effect ofspecific matrixes on the methods. In addition, numerousbiological and analytical factors need to be taken into accountwhen reporting results. This is particularly important wheninterpreting quantitative data.
Acknowledgments
We thank Croplife International and AnalyticalEnvironmental Immunochemical Consortium for the financial support to prepare this manuscript. We also thank Pat Feeneyfor her invaluable help in preparing the manuscript.
References
(1) Lipton, C.R., Dautlick, J.X., Grothaus, C.D., Hunst, P.L.,Magin, K.M., Mihaliak, C.A., Rubio, F.M., & Stave, J.W.(2000) Food Agric. Immunol. 12, 153–164
(2) Ingham, D.J., Beer, S., Money, S., & Hansen, G. (2001)Biotechniques 31, 132–134
(3) Schmidt, M.A., & Parrott, W.A. (2001) Plant Cell Rep. 20,422–428
(4) Song, P., Cai, C.Q., Skokut, M., Kosegi, B.D., & Petolino,J.F. (2002) Plant Cell Rep. 20, 948–954
(5) Chien, A., Edgar, D.B., & Trela J.M. (1976) J. Bacteriol.127, 1550–1557
(6) Remund, K., Dixon, D.A., Wright, D.L., & Holden, L.R.(2001) Seed Sci. Res. 11, 101–119
(7) Whitaker, T.B., Freese, L., Giesbrecht, F.G., & Slate, A.(2000) Paper 2000-10, Journal Series of the Department ofBiological and Agricultural Engineering, North CarolinaState University, Raleigh, NC
(8) Arumuganathan, K., & Earle, E.D. (1991) Plant Mol. Biol.Rep. 9, 208–218
(9) Kay, S., & Van den Eede, G. (2001) Nature Biotech., 19, 405
(10) Holden, M.J., Blasic, J.R., Bussjaeger, L., Kao, C., Shokere,L.A., Kendal, D.C., Freese, L., & Jenkins, G.R. (2003) J.Agric. Food Chem. 51, 2468–2474
(11) Rossen, L., Norskov, P., Holmstrom, K., & Rasmussen, O.F.(1992) Int. J. Food Microb. 17, 37–45
(12) Séjalon-Delmas, N., Roux, C., Martins, M., Kulifaj, M.,Becard, G., & Dargent, R. (2000) J. Agric. Food Chem. 48,2608–2613
(13) Tengel, C., Schussler, P., Setzke, E., Balles, J., &Sprenger-Haussels, M. (2001) Biotechniques 31, 426–429
(14) Laws, G.M., Skopek, T.R., Reddy, M.V., Storer, R.D., &Glaab, W.E. (2001) Mutat. Res. 484, 3–18; Erratum in:Mutat. Res (2002) 505, 93
(15) Tichopad, A., Didier, A., & Pfaffl, M.W. (2004) Mol. Cell.Probes 18, 45–50
(16) Weissensteiner, T., & Lanchbury, E. (1996) Biotechniques21, 1102–1108
(17) Permingeat, H.R., Reggiardo, M.I., & Vallejos, R.H. (2002)J. Agric. Food Chem. 50, 4431–4436
(18) Koonjul, P.K., Brandt, W.F., Farrant, J.M., & Lindsey, G.G.(1999) Nucleic Acids Res. 27, 915–916
(19) Reiss, R.A., & Rutz, B. (1999) Biotechniques 27, 920–922,924–926
(20) Seeger, C., Batz, H.G., & Orum, H. (1997) Biotechniques 23,512–517
(21) Lipp, M., Anklam, E., Brodmann, P., Pietsch, K., & Pauwels, J. (1999) Food Control 10, 379–383
(22) Tikoo, K., Gupta, S., Hamid, Q.A., Shah, V., Chatterjee, B.,& Ali, Z. (1997) Biochem. J. 322, 273–279
(23) Watson, J.D., Hopkins, N.H., Roberts, J.W., Steitz, J.A., &Weiner, A.M. (1987) Molecular Biology of the Gene, 4th Ed., Benjamin Cummings Publishing Co. Inc., San Francisco,CA, pp 690–696
(24) Goldmit, M., Schlissel, M., Cedar, H., & Bergman, Y. (2002)EMBO J. 21, 5255–5261
(25) Xiao, L., & Casero, R.A. (1996) Biochem. J. 313, 691–696
(26) Wolf, C., Scherzinger, M., Wurz, A., Pauli, U., Hubner, P., &Luthy, J. (2000) Eur. Food Res. Technol. 210, 367–372
(27) Ausubel, F.M., Brent, R., Kinsdton, R.E., Moore, D.D., &Siedman, J.G. (1999) in Short Protocols in MolecularBiology, John Wiley & Sons, Inc., New York, NY, ppA3–10, 11
(28) Labarca, C., & Paigen, K. (1980) Anal. Biochem. 102,344–352
(29) Singer, V.L, Jones, L.J., Yue, S.T., & Haugland, R.P. (1997)Anal. Biochem. 249, 228–238
(30) Permingeat, H.R., Reggiardo, M.I., & Vallejos, R.H. (2002)J. Agric. Food Chem. 50, 4431–4436
(31) Seedcalc 6, ISTA Web site, http://www.seedtest.org/en/content—1—1143.html, to download directly,http://www.seedtest.org/upload/cms/user/seedcalc6.zip
(32) Applied Biosystems (1997) User Bulletin #2: ABI Prism7700 Sequence Detection System, Applied Biosystems,Foster City, CA
(33) Pardigol, A., Guillet, S., & Popping, B. (2003) Eur. FoodRes. Technol. 216, 412–420
(34) C-Value Web site: http://www.rbgkew.org.uk/cval/introduction.html
(35) Horwitz, W., Britton, P., & Chirtel, S. (1998) J. AOAC Int.81, 1257–1265
(36) Codex Alimentarius Commission (2001) Procedural Manual,12th Ed., FAO, Rome, Italy, p. 64
(37) EPA Pesticide Regulation (PR) Notice 96-1 (1996) Notice toManufacturers, Formulators, Producers and Registrants ofPesticides Products, http://www.epa.gov/PR_Notices/pr96-1.html
(38) AOAC Official Methods Program Manual (2002) AOACINTERNATIONAL, Gaithersburg, MD, Appendix X, pp14–15
154 LIPP ET AL.: JOURNAL OF AOAC INTERNATIONAL VOL. 88, NO. 1, 2005
(39) Horwitz, W. (1995) Pure Appl. Chem. 67, 331–343
(40) Huebner, P., Waiblinger, H.U., Pietsch, K., & Bordmann, P.(2001) J. AOAC Int. 84, 1855–1864
(41) ISO Guide 30:1992, ISO Guide 31:2000, ISO Guide32:1997, ISO Guide 33:2000, ISO Guide 34:2000, ISO Guide 35:1989, International Standardization Organization, Geneva, Switzerland
(42) Institute of Reference Material and Measurement of the JointResearch Center of the European Union (2004) Geel,Belgium, http://www.irmm.jrc.be/rm/food.pdf
(43) AgBios (2004) Transgene Copy Number, http://www.agbios.com
(44) Young, T.E., Gallie, D.R., & DeMason, D. (1997) PlantPhysiol. 115, 737–751
(45) Gallie, D.R., & Young, T. (2000) Plant Mol. Biol. 42,397–414
(46) Dilkes, B.P., Dante, R.A., Coelho, C., & Larkins, B.A. (2002) Genetics 160, 1163–1177
(47) Schweizer, L., Yerk-Davis, G.L., Phillips, R.L., Srienc, F., &Jones, R.J. (1995) Proc. Natl. Acad. Sci. USA 92, 7070–7074
(48) Poggio, L., Rosato, M., Chiavarino, A.M., & Naranjo, C.A.(1998) Ann. Bot. 82, 107–115
(49) McMurphy, L.M., & Rayburn, A.L. (1991) Crop Sci. 31,63–67
(50) Grielhuber, J., & Obermayer, R. (1997) Heredity 78,547–551
(51) Graham, M.J., Nickell, C.D., & Rayburn, A.L. (1994) Theor.Appl. Genet. 88, 429–432
(52) ISO 17025 (1999) International StandardizationOrganization, Geneva, Switzerland
LIPP ET AL.: JOURNAL OF AOAC INTERNATIONAL VOL. 88, NO. 1, 2005 155