Embed Size (px)
Citation preview
PBF Energy Inc. (NYSE: PBF) January 2017 Investor Presentation
2
This presentation contains forward-looking statements made by PBF Energy Inc. (“PBF Energy”), the indirect parent of PBF Logistics LP
(“PBFX”, or “Partnership”, and together with PBF Energy, the “Companies”, or “PBF”), and their management teams. Such statements
are based on current expectations, forecasts and projections, including, but not limited to, anticipated financial and operating
results, plans, objectives, expectations and intentions that are not historical in nature. Forward-looking statements should not be read
as a guarantee of future performance or results, and may not necessarily be accurate indications of the times at, or by which, such
performance or results will be achieved. Forward-looking statements are based on information available at the time, and are subject
to various risks and uncertainties that could cause the Companies’ actual performance or results to differ materially from those
expressed in such statements. Factors that could impact such differences include, but are not limited to, changes in general economic
conditions; volatility of crude oil and other feedstock prices; fluctuations in the prices of refined products; the impact of disruptions
to crude or feedstock supply to any of our refineries, including disruptions due to problems with third party logistics infrastructure;
effects of litigation and government investigations; the timing and announcement of any potential acquisitions and subsequent impact
of any future acquisitions on our capital structure, financial condition or results of operations; changes or proposed changes in laws or
regulations or differing interpretations or enforcement thereof affecting our business or industry, including any lifting by the federal
government of the restrictions on exporting U.S. crude oil; actions taken or non-performance by third parties, including suppliers,
contractors, operators, transporters and customers; adequacy, availability and cost of capital; work stoppages or other labor
interruptions; operating hazards, natural disasters, weather-related delays, casualty losses and other matters beyond our control;
inability to complete capital expenditures, or construction projects that exceed anticipated or budgeted amounts; ability to
consummate potential acquisitions, the timing for the closing of any such acquisition and our plans for financing any acquisition;
unforeseen liabilities associated with any potential acquisition; inability to successfully integrate acquired refineries or other acquired
businesses or operations; effects of existing and future laws and governmental regulations, including environmental, health and safety
regulations; and, various other factors.
Forward-looking statements reflect information, facts and circumstances only as of the date they are made. The Companies assume no
responsibility or obligation to update forward-looking statements to reflect actual results, changes in assumptions or changes in other
factors affecting forward-looking information after such date.
Safe Harbor Statements
3
Fourth largest and second most complex independent refiner with regionally-
advantaged asset base
Significantly advantaged crude and feedstock optionality provides access to
lowest-cost feedstocks
Strategic relationship with PBF Logistics (NYSE:PBFX) provides growth partnership
Long and successful history of executing accretive acquisitions and driving growth
Proven track record of investing in organic, margin-improvement projects
Targeting self-help projects to enhance margin capture and increase commercial
flexibility
Focused internal investment to drive growth and enhance margins
Maintain conservative balance sheet and strong liquidity
Continue to reward shareholders with attractive dividend yield and opportunistic
share repurchases
Refining and Logistics segments provide dual growth platforms
Optimize refining profitability
Diversify logistics footprint through third-party transactions
Attractive
Asset Base
PBF – A Compelling Investment
Proven
Track Record
Disciplined
Allocation
of Capital
Future
Growth
Opportunities
4
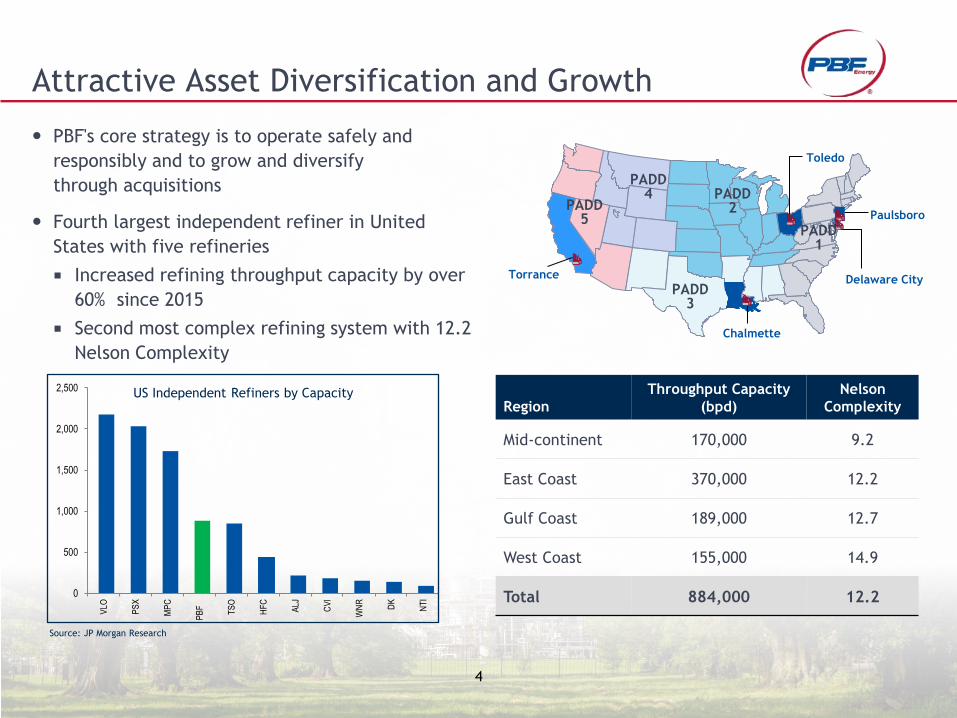
Attractive Asset Diversification and Growth
PBF's core strategy is to operate safely and
responsibly and to grow and diversify
through acquisitions
Fourth largest independent refiner in United
States with five refineries
Increased refining throughput capacity by over
60% since 2015
Second most complex refining system with 12.2
Nelson Complexity
Region
Throughput Capacity
(bpd)
Nelson
Complexity
Mid-continent 170,000 9.2
East Coast 370,000 12.2
Gulf Coast 189,000 12.7
West Coast 155,000 14.9
Total 884,000 12.2
Paulsboro
Toledo
Chalmette
Torrance
PADD 2
PADD 3
PADD 5
Delaware City
PADD 4
PADD 1
Source: JP Morgan Research
0
500
1,000
1,500
2,000
2,500
VLO
PS
X
MP
C
PB
F
TS
O
HF
C
ALJ
CV
I
WN
R
DK
NT
I
US Independent Refiners by Capacity
5
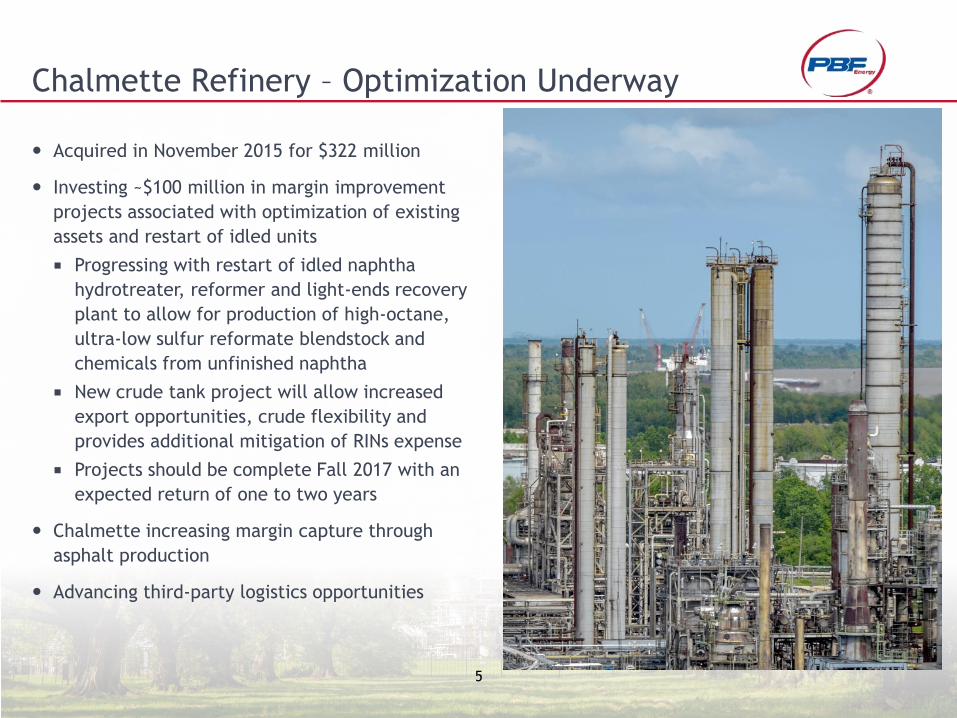
Acquired in November 2015 for $322 million
Investing ~$100 million in margin improvement
projects associated with optimization of existing
assets and restart of idled units
Progressing with restart of idled naphtha
hydrotreater, reformer and light-ends recovery
plant to allow for production of high-octane,
ultra-low sulfur reformate blendstock and
chemicals from unfinished naphtha
New crude tank project will allow increased
export opportunities, crude flexibility and
provides additional mitigation of RINs expense
Projects should be complete Fall 2017 with an
expected return of one to two years
Chalmette increasing margin capture through
asphalt production
Advancing third-party logistics opportunities
Chalmette Refinery – Optimization Underway
6
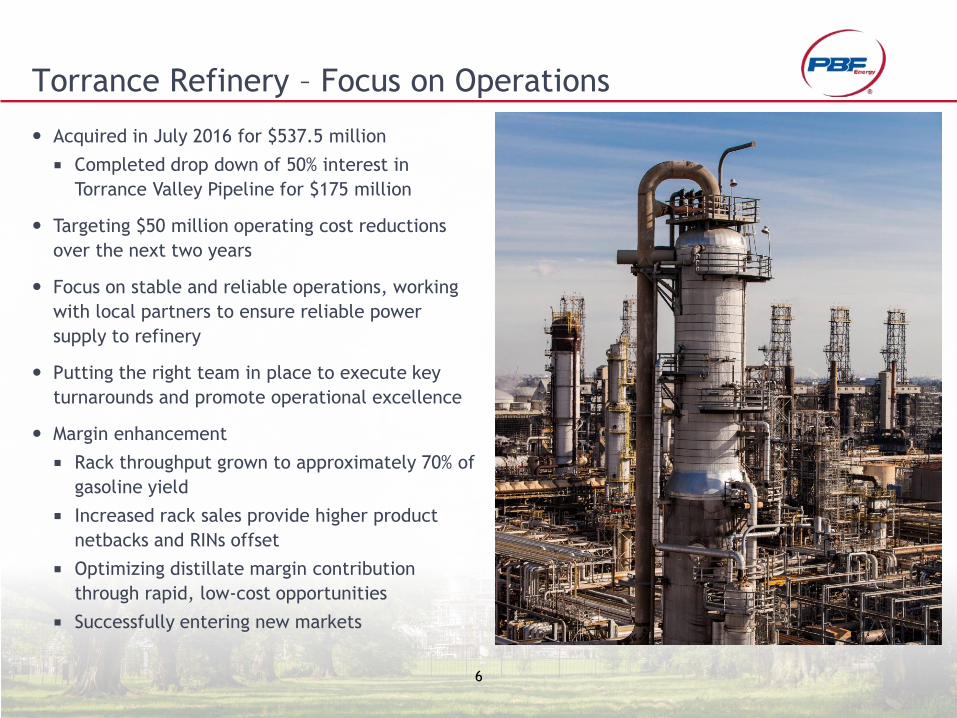
Torrance Refinery – Focus on Operations
Acquired in July 2016 for $537.5 million
Completed drop down of 50% interest in
Torrance Valley Pipeline for $175 million
Targeting $50 million operating cost reductions
over the next two years
Focus on stable and reliable operations, working
with local partners to ensure reliable power
supply to refinery
Putting the right team in place to execute key
turnarounds and promote operational excellence
Margin enhancement
Rack throughput grown to approximately 70% of
gasoline yield
Increased rack sales provide higher product
netbacks and RINs offset
Optimizing distillate margin contribution
through rapid, low-cost opportunities
Successfully entering new markets
7
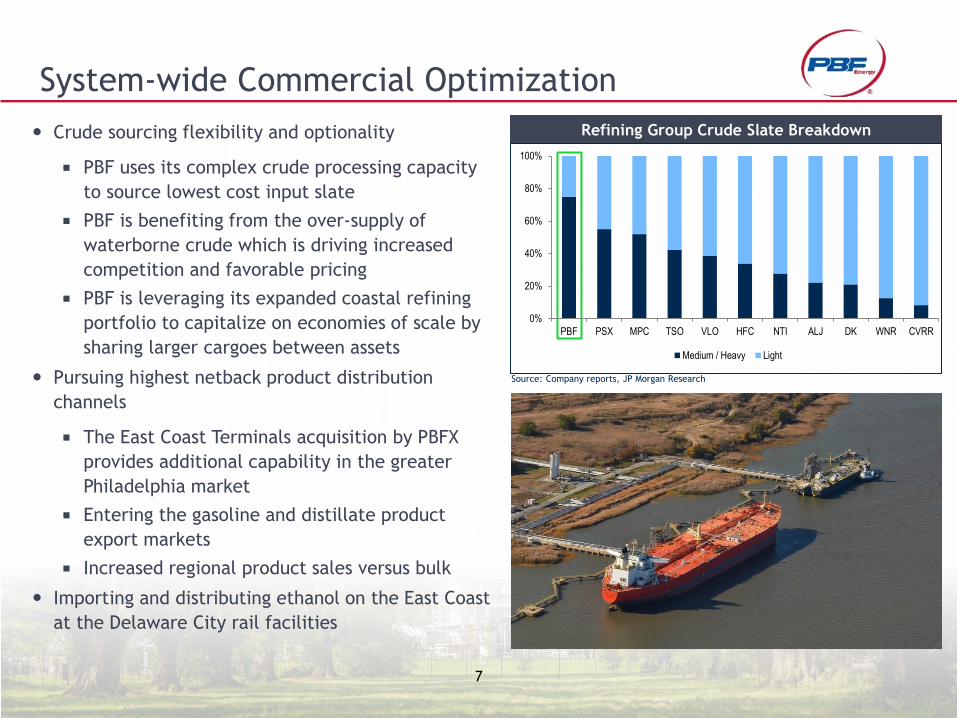
System-wide Commercial Optimization
Crude sourcing flexibility and optionality
PBF uses its complex crude processing capacity
to source lowest cost input slate
PBF is benefiting from the over-supply of
waterborne crude which is driving increased
competition and favorable pricing
PBF is leveraging its expanded coastal refining
portfolio to capitalize on economies of scale by
sharing larger cargoes between assets
Pursuing highest netback product distribution
channels
The East Coast Terminals acquisition by PBFX
provides additional capability in the greater
Philadelphia market
Entering the gasoline and distillate product
export markets
Increased regional product sales versus bulk
Importing and distributing ethanol on the East Coast
at the Delaware City rail facilities
Refining Group Crude Slate Breakdown
Source: Company reports, JP Morgan Research
0%
20%
40%
60%
80%
100%
PBF PSX MPC TSO VLO HFC NTI ALJ DK WNR CVRR
Medium / Heavy Light
8
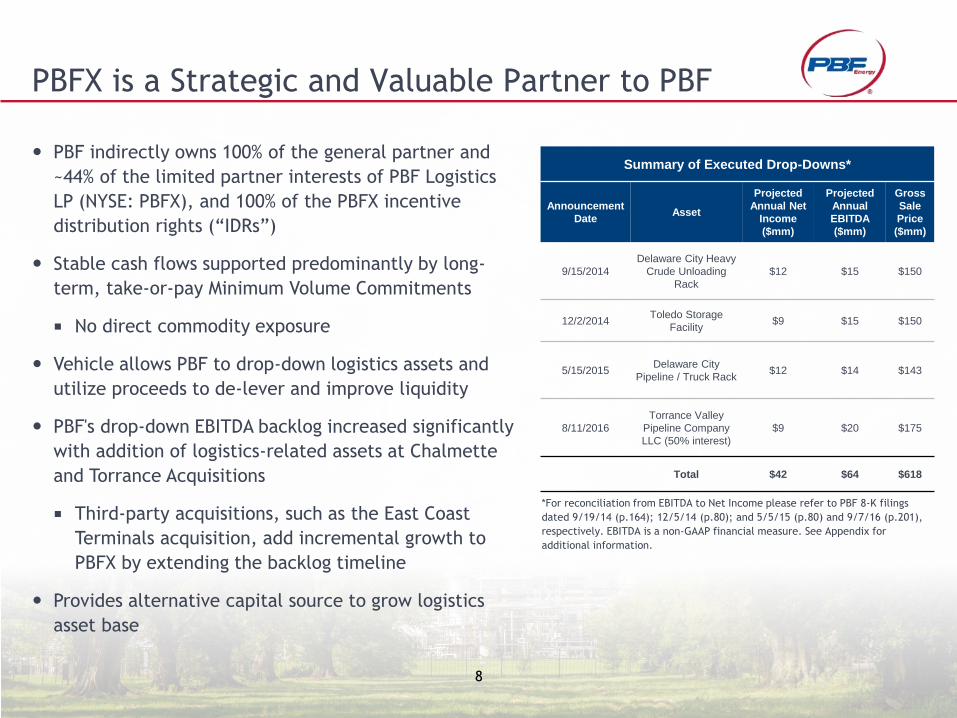
PBFX is a Strategic and Valuable Partner to PBF
PBF indirectly owns 100% of the general partner and
~44% of the limited partner interests of PBF Logistics
LP (NYSE: PBFX), and 100% of the PBFX incentive
distribution rights (“IDRs”)
Stable cash flows supported predominantly by long-
term, take-or-pay Minimum Volume Commitments
No direct commodity exposure
Vehicle allows PBF to drop-down logistics assets and
utilize proceeds to de-lever and improve liquidity
PBF's drop-down EBITDA backlog increased significantly
with addition of logistics-related assets at Chalmette
and Torrance Acquisitions
Third-party acquisitions, such as the East Coast
Terminals acquisition, add incremental growth to
PBFX by extending the backlog timeline
Provides alternative capital source to grow logistics
asset base
Summary of Executed Drop-Downs*
Announcement
Date Asset
Projected
Annual Net
Income
($mm)
Projected
Annual
EBITDA
($mm)
Gross
Sale
Price
($mm)
9/15/2014
Delaware City Heavy
Crude Unloading
Rack
$12 $15 $150
12/2/2014 Toledo Storage
Facility $9 $15 $150
5/15/2015 Delaware City
Pipeline / Truck Rack $12 $14 $143
8/11/2016
Torrance Valley
Pipeline Company
LLC (50% interest)
$9 $20 $175
Total $42 $64 $618
*For reconciliation from EBITDA to Net Income please refer to PBF 8-K filings
dated 9/19/14 (p.164); 12/5/14 (p.80); and 5/5/15 (p.80) and 9/7/16 (p.201),
respectively. EBITDA is a non-GAAP financial measure. See Appendix for
additional information.

9
PBFX Growing Asset Base is Ideally Situated
PBF Logistics Mid-Continent Assets Toledo Storage Facility Toledo LPG Truck Rack Toledo Truck Terminal
PBF Logistics East Coast Assets East Coast Terminals DC Products Pipeline DC Truck Rack (Products) DC Truck Rack (LPG) DC Rail Terminal DC West Rack
PBF Logistics assets directly support the operations
of the Toledo, Delaware City, Paulsboro and
Torrance refineries
Approximately 255 million barrels of annual
refining capacity
Strategic third-party acquisitions such as the East
Coast Terminals allow PBF Logistics to
independently grow its revenue base and leverage
its existing relationship with PBF Energy
PBFX continues to target logistics assets for
feedstock movement and product distribution that
complement its existing operations and provide
synergies due to proximity to PBF Energy
operations
Developing organic growth opportunities to
enhance asset base and diversify revenue streams
Drop-downs from PBF Energy, as it grows, remain a
valuable source of future growth
Paulsboro
Toledo
Chalmette
Torrance
PADD 2
PADD 3
PADD 5
Delaware City
PADD 4
PADD 1
PBF Logistics West Coast Assets
Torrance Valley Pipeline
Appendix
11
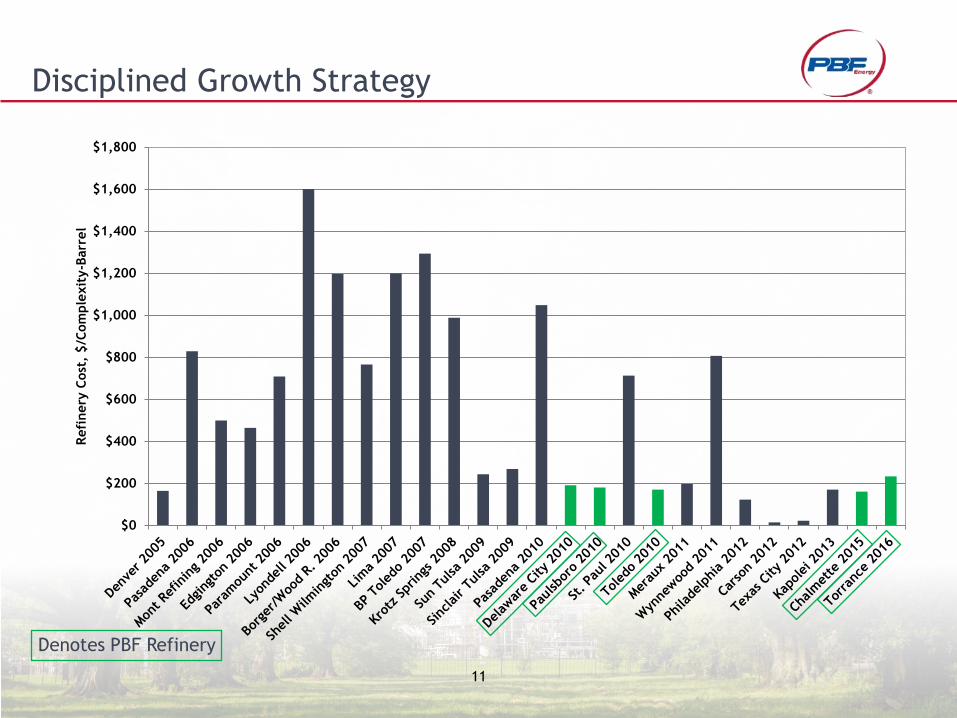
Disciplined Growth Strategy
$0
$200
$400
$600
$800
$1,000
$1,200
$1,400
$1,600
$1,800
Refi
nery
Cost
, $/C
om
ple
xit
y-B
arr
el
Denotes PBF Refinery
12
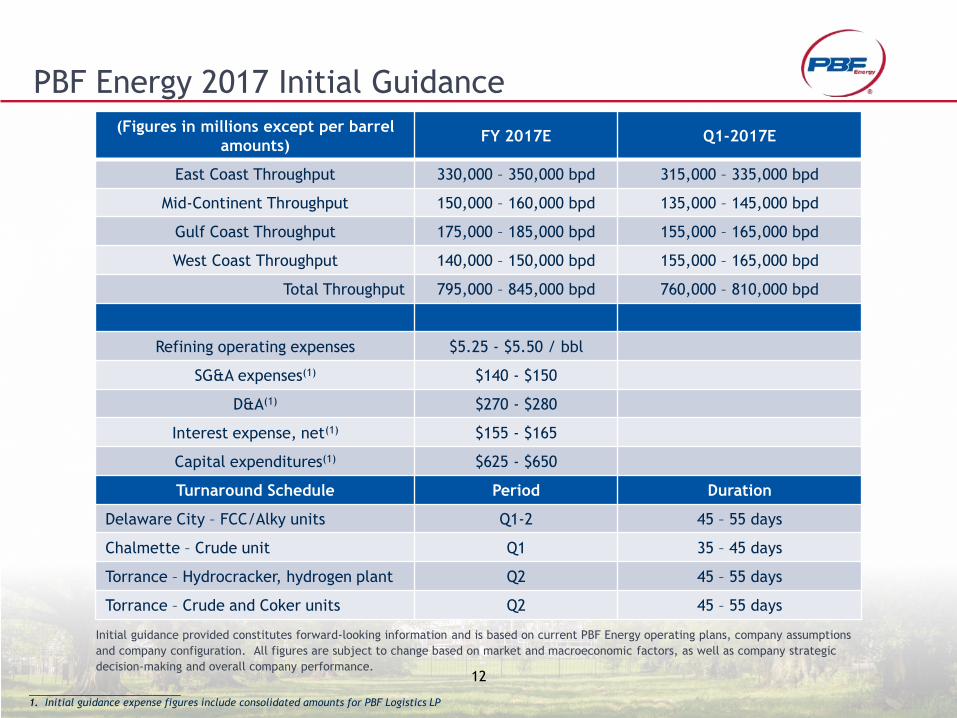
PBF Energy 2017 Initial Guidance
Initial guidance provided constitutes forward-looking information and is based on current PBF Energy operating plans, company assumptions
and company configuration. All figures are subject to change based on market and macroeconomic factors, as well as company strategic
decision-making and overall company performance.
(Figures in millions except per barrel
amounts) FY 2017E Q1-2017E
East Coast Throughput 330,000 – 350,000 bpd 315,000 – 335,000 bpd
Mid-Continent Throughput 150,000 – 160,000 bpd 135,000 – 145,000 bpd
Gulf Coast Throughput 175,000 – 185,000 bpd 155,000 – 165,000 bpd
West Coast Throughput 140,000 – 150,000 bpd 155,000 – 165,000 bpd
Total Throughput 795,000 – 845,000 bpd 760,000 – 810,000 bpd
Refining operating expenses $5.25 - $5.50 / bbl
SG&A expenses(1) $140 - $150
D&A(1) $270 - $280
Interest expense, net(1) $155 - $165
Capital expenditures(1) $625 - $650
Turnaround Schedule Period Duration
Delaware City – FCC/Alky units Q1-2 45 – 55 days
Chalmette – Crude unit Q1 35 – 45 days
Torrance – Hydrocracker, hydrogen plant Q2 45 – 55 days
Torrance – Crude and Coker units Q2 45 – 55 days
___________________________ 1. Initial guidance expense figures include consolidated amounts for PBF Logistics LP
13
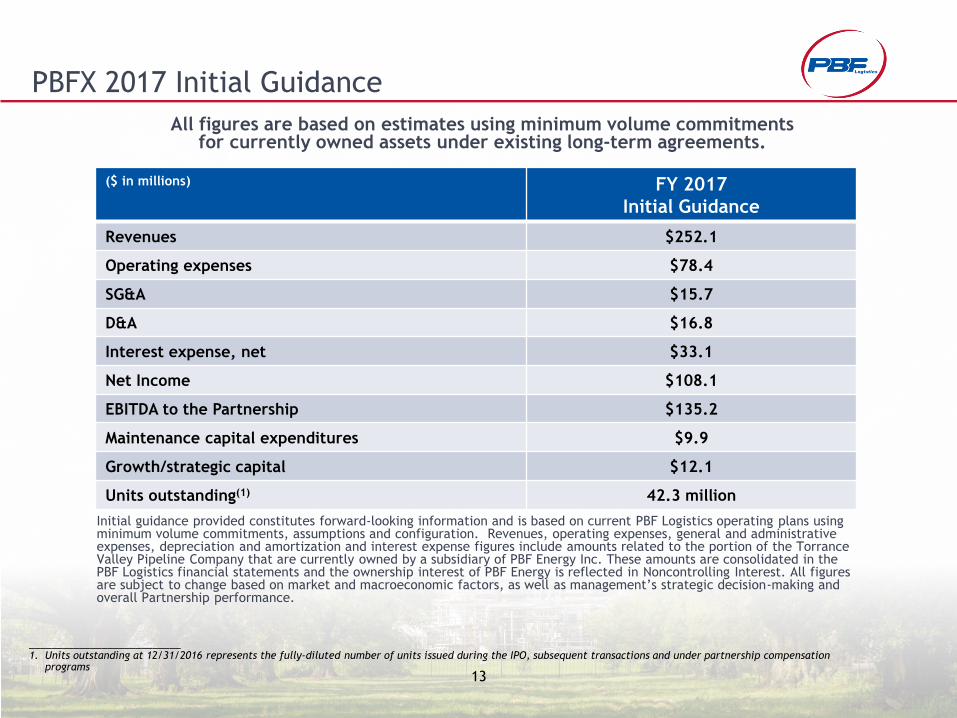
PBFX 2017 Initial Guidance
Initial guidance provided constitutes forward-looking information and is based on current PBF Logistics operating plans using minimum volume commitments, assumptions and configuration. Revenues, operating expenses, general and administrative expenses, depreciation and amortization and interest expense figures include amounts related to the portion of the Torrance Valley Pipeline Company that are currently owned by a subsidiary of PBF Energy Inc. These amounts are consolidated in the PBF Logistics financial statements and the ownership interest of PBF Energy is reflected in Noncontrolling Interest. All figures are subject to change based on market and macroeconomic factors, as well as management’s strategic decision-making and overall Partnership performance.
($ in millions) FY 2017
Initial Guidance
Revenues $252.1
Operating expenses $78.4
SG&A $15.7
D&A $16.8
Interest expense, net $33.1
Net Income $108.1
EBITDA to the Partnership $135.2
Maintenance capital expenditures $9.9
Growth/strategic capital $12.1
Units outstanding(1) 42.3 million
All figures are based on estimates using minimum volume commitments for currently owned assets under existing long-term agreements.
___________________________ 1. Units outstanding at 12/31/2016 represents the fully-diluted number of units issued during the IPO, subsequent transactions and under partnership compensation
programs
14
Our management uses EBITDA (earnings before interest, income taxes, depreciation and amortization) as
a measure of operating performance to assist in comparing performance from period to period on a
consistent basis and to readily view operating trends, as a measure for planning and forecasting overall
expectations and for evaluating actual results against such expectations, and in communications with our
board of directors, creditors, analysts and investors concerning our financial performance.
EBITDA is not a presentation made in accordance with GAAP and our computation of EBITDA may vary
from others in our industry. EBITDA should not be considered as an alternative to operating income (loss)
or net income (loss) as measures of operating performance. In addition, EBITDA is not presented as, and
should not be considered, an alternative to cash flows from operations as a measure of liquidity.
This presentation includes references to EBITDA and EBITDA attributable to PBFX, which is a non-GAAP
financial measure that is reconciled to its most directly comparable GAAP measure in the quarterly and
annual reports on Forms 10-Q and 10-K for PBFX. We define EBITDA attributable to PBFX as net income
(loss) attributable to PBFX before net interest expense, income tax expense, depreciation and
amortization expense attributable to PBFX, which excludes the results attributable to noncontrolling
interests and acquisitions from affiliate companies under common control prior to the effective dates of
such transactions. With respect to projected MLP-qualifying EBITDA, we are unable to prepare a
quantitative reconciliation to the most directly comparable GAAP measure without unreasonable effort,
as, among other things, certain items that impact these measures, such as the provision for income taxes,
depreciation of fixed assets, amortization of intangibles and financing costs have not yet occurred, are
subject to market conditions and other factors that are out of our control and cannot be accurately
predicted.
Non-GAAP Financial Measures
15
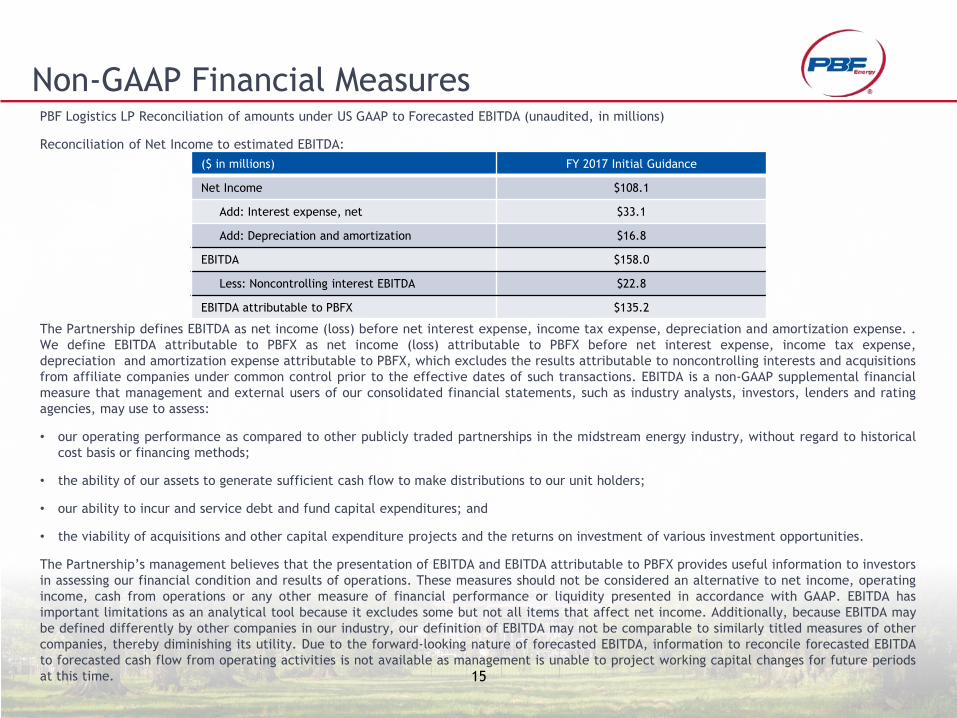
Non-GAAP Financial Measures PBF Logistics LP Reconciliation of amounts under US GAAP to Forecasted EBITDA (unaudited, in millions)
Reconciliation of Net Income to estimated EBITDA:
The Partnership defines EBITDA as net income (loss) before net interest expense, income tax expense, depreciation and amortization expense. .
We define EBITDA attributable to PBFX as net income (loss) attributable to PBFX before net interest expense, income tax expense,
depreciation and amortization expense attributable to PBFX, which excludes the results attributable to noncontrolling interests and acquisitions
from affiliate companies under common control prior to the effective dates of such transactions. EBITDA is a non-GAAP supplemental financial
measure that management and external users of our consolidated financial statements, such as industry analysts, investors, lenders and rating
agencies, may use to assess:
• our operating performance as compared to other publicly traded partnerships in the midstream energy industry, without regard to historical
cost basis or financing methods;
• the ability of our assets to generate sufficient cash flow to make distributions to our unit holders;
• our ability to incur and service debt and fund capital expenditures; and
• the viability of acquisitions and other capital expenditure projects and the returns on investment of various investment opportunities.
The Partnership’s management believes that the presentation of EBITDA and EBITDA attributable to PBFX provides useful information to investors
in assessing our financial condition and results of operations. These measures should not be considered an alternative to net income, operating
income, cash from operations or any other measure of financial performance or liquidity presented in accordance with GAAP. EBITDA has
important limitations as an analytical tool because it excludes some but not all items that affect net income. Additionally, because EBITDA may
be defined differently by other companies in our industry, our definition of EBITDA may not be comparable to similarly titled measures of other
companies, thereby diminishing its utility. Due to the forward-looking nature of forecasted EBITDA, information to reconcile forecasted EBITDA
to forecasted cash flow from operating activities is not available as management is unable to project working capital changes for future periods
at this time.
($ in millions) FY 2017 Initial Guidance
Net Income $108.1
Add: Interest expense, net $33.1
Add: Depreciation and amortization $16.8
EBITDA $158.0
Less: Noncontrolling interest EBITDA $22.8
EBITDA attributable to PBFX $135.2


![g]kfn ;/sf/ pBf]u dGqfno pBf]u ljefu](https://img.dokumen.tips/doc/110x75/61b4af4c99949b10312c9ada/gkfn-sf-pbfu-dgqfno-pbfu-ljefu.jpg)