Embed Size (px)
Citation preview

Pay Forum 2016
May 2016

© 2016 Korn Ferry. All rights reserved 2
IS WHERE EVERY BUSINESS
WANTS TO BE.
BUT HOW DO YOU GET THERE?
UP.
© 2016 Korn Ferry. All rights reserved 2
© 2016 Korn Ferry. All rights reserved 3
IT ISN’T ROCKET SCIENCE,
BUT IT IS SCIENCE.
Korn Ferry knows more about human
performance in the workplace than any
other organization.
One candidate
placed every
3.5 minutes
100,000
peopledeveloped in our
leadership
programs
each month
Assessment
data on
3M
professionals
Roots dating
back to
1943
Reward data
on
20Mprofessionals
Management
data on
114countries
50+ books
published
Partner to
93% of
FORTUNE 100
Engagement
data on
6M
professionals
7,000 colleagues
© 2016 Korn Ferry. All rights reserved 3
© 2016 Korn Ferry. All rights reserved 4
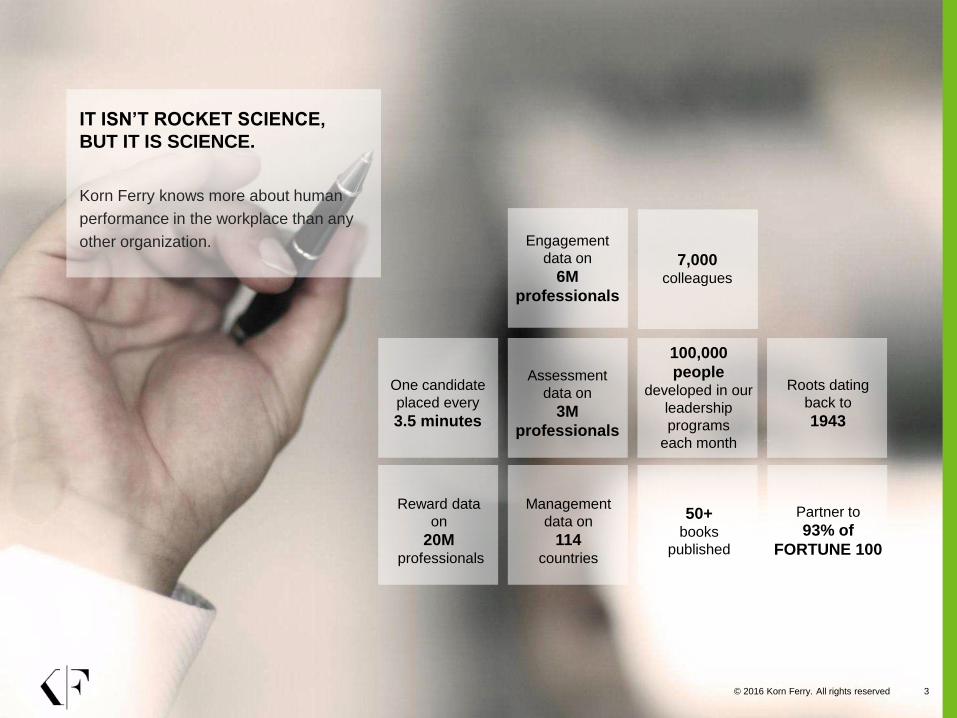
Our solutions are aligned to this framework
ORGANIZATION
STRATEGY EXECUTION AND
ORGANIZATIONAL DESIGN
REWARDS AND BENEFITS
TALENT STRATEGY AND WORK DESIGN
PEOPLE
ASSESSMENT AND SUCCESSION
LEADERSHIP DEVELOPMENT
EXECUTIVE SEARCH AND RECRUITMENT
© 2016 Korn Ferry. All rights reserved 5
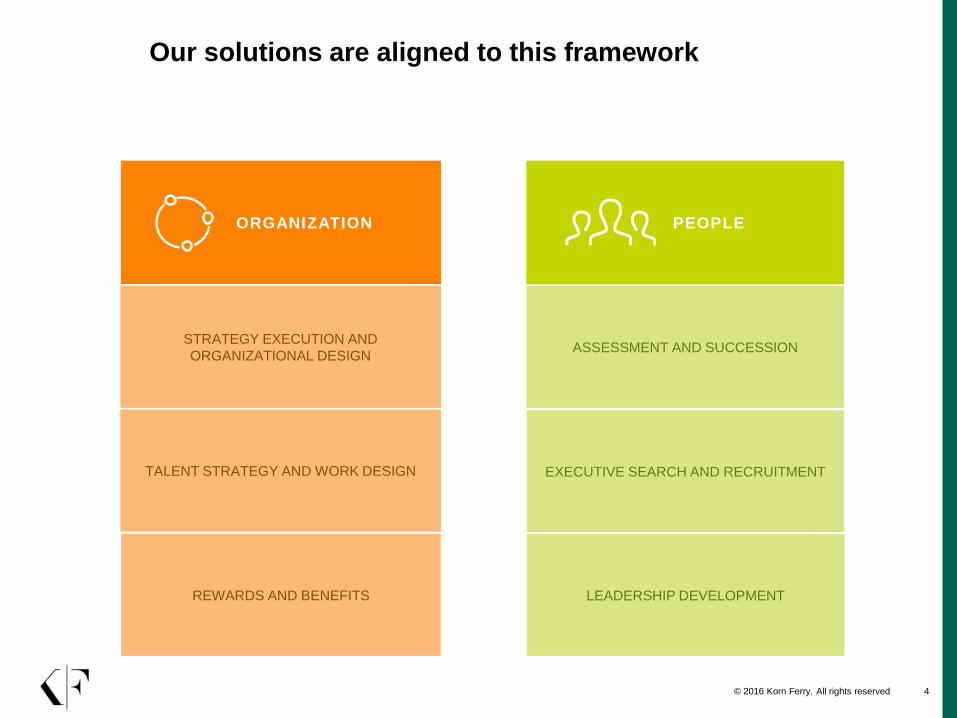
A total approach to talent
Korn Ferry Hay Group
helps you align your
organization to your people
– developing, engaging,
and rewarding them to
reach new heights.
Korn Ferry Executive
Search helps you attract
the best executive talent
for moving your company
in the right direction.
Korn Ferry Futurestep
delivers professional
talent that builds up
leadership.
© 2016 Korn Ferry. All rights reserved 6
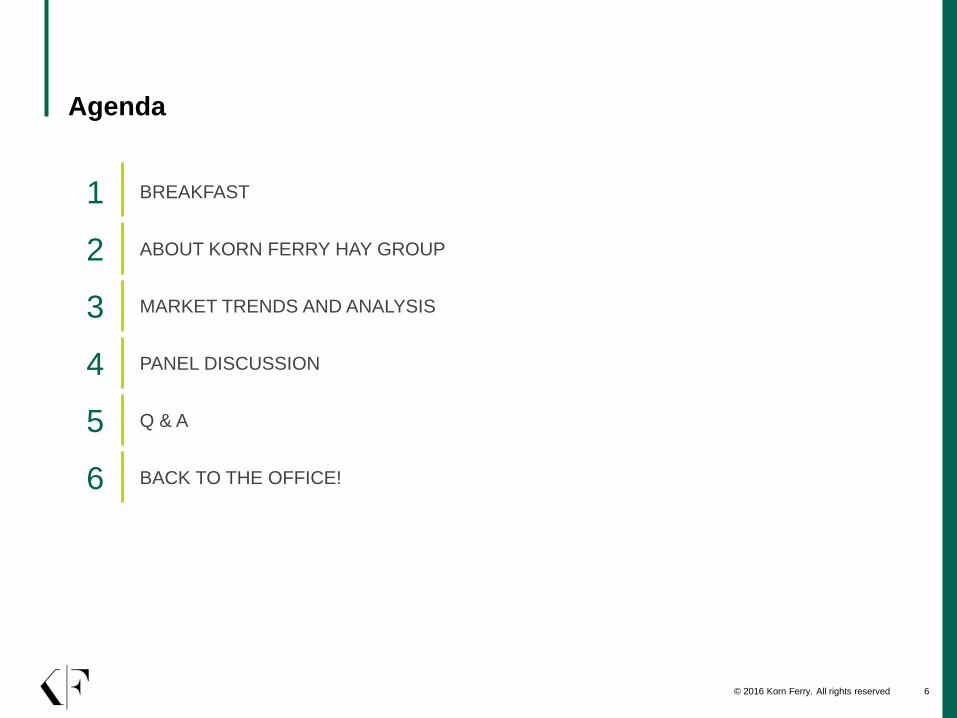
Agenda
1 BREAKFAST
2 ABOUT KORN FERRY HAY GROUP
3 MARKET TRENDS AND ANALYSIS
4 PANEL DISCUSSION
5 Q & A
6 BACK TO THE OFFICE!

© 2016 Korn Ferry. All rights reserved 7
Market Trends 2016

© 2016 Korn Ferry. All rights reserved 8
PayNet in 2016

© 2016 Korn Ferry. All rights reserved 9
Economic Overview
© 2016 Korn Ferry. All rights reserved 10
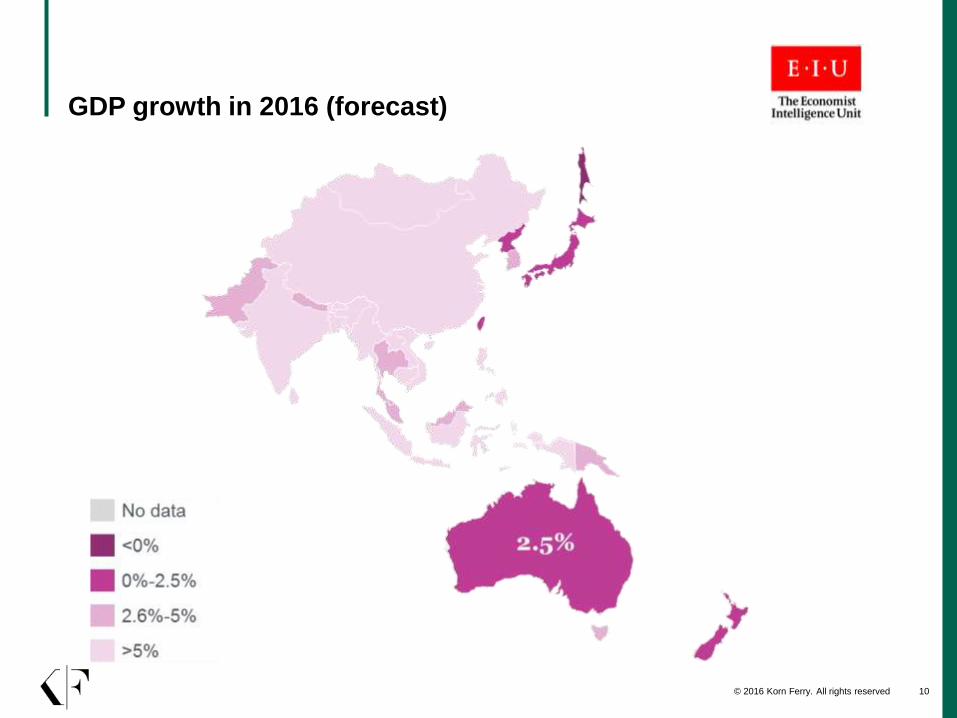
GDP growth in 2016 (forecast)
© 2016 Korn Ferry. All rights reserved 11
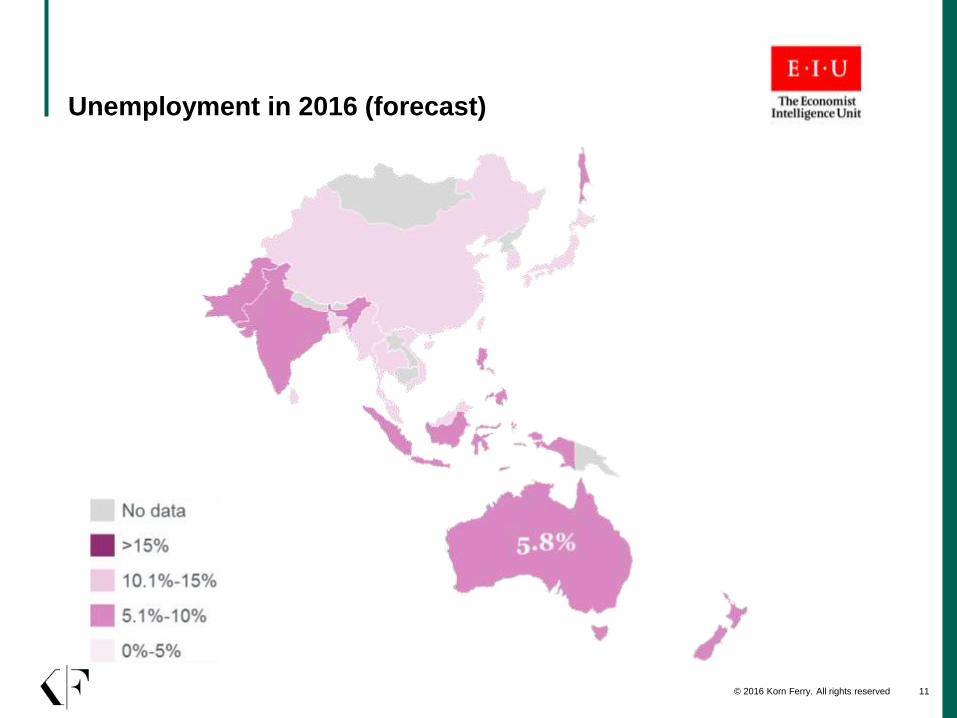
Unemployment in 2016 (forecast)
© 2016 Korn Ferry. All rights reserved 12
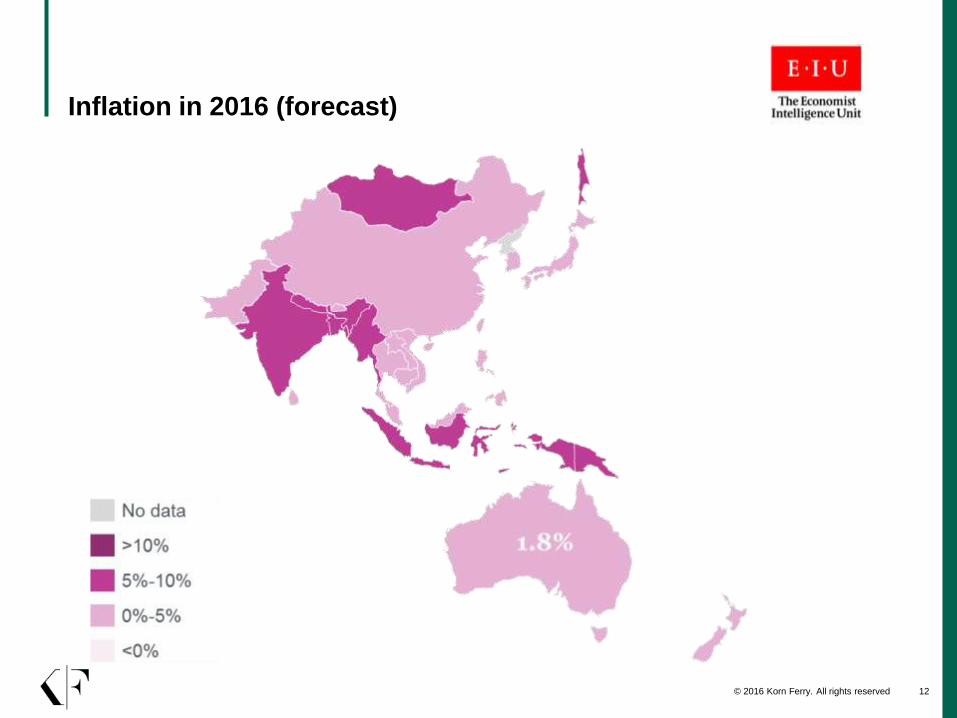
Inflation in 2016 (forecast)

© 2016 Korn Ferry. All rights reserved 13
Salary Movements and Forecasts
© 2016 Korn Ferry. All rights reserved 14
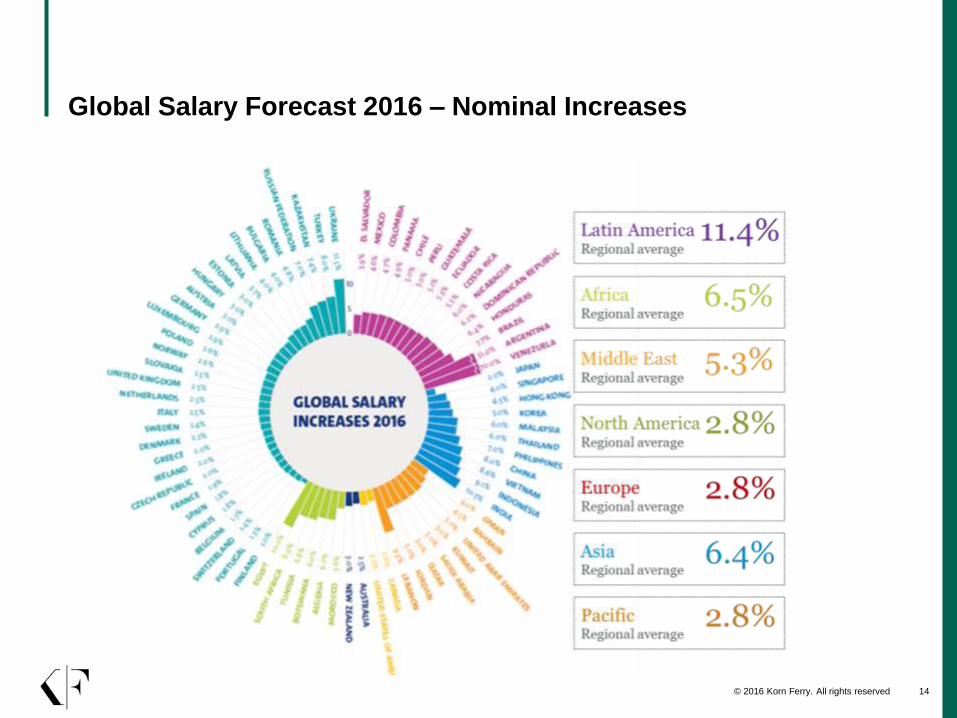
Global Salary Forecast 2016 – Nominal Increases

© 2016 Korn Ferry. All rights reserved 15
Global Salary Forecast 2016 – Real Increases
Middle EastRegional average
North AmericaRegional average
Europe Regional average
AsiaRegional average
PacificRegional average
Latin AmericaRegional average
Africa Regional average
-1.4%
1.6%
3.8%
2.0%
2.3%
4.2%
1.5%
© 2016 Korn Ferry. All rights reserved 16
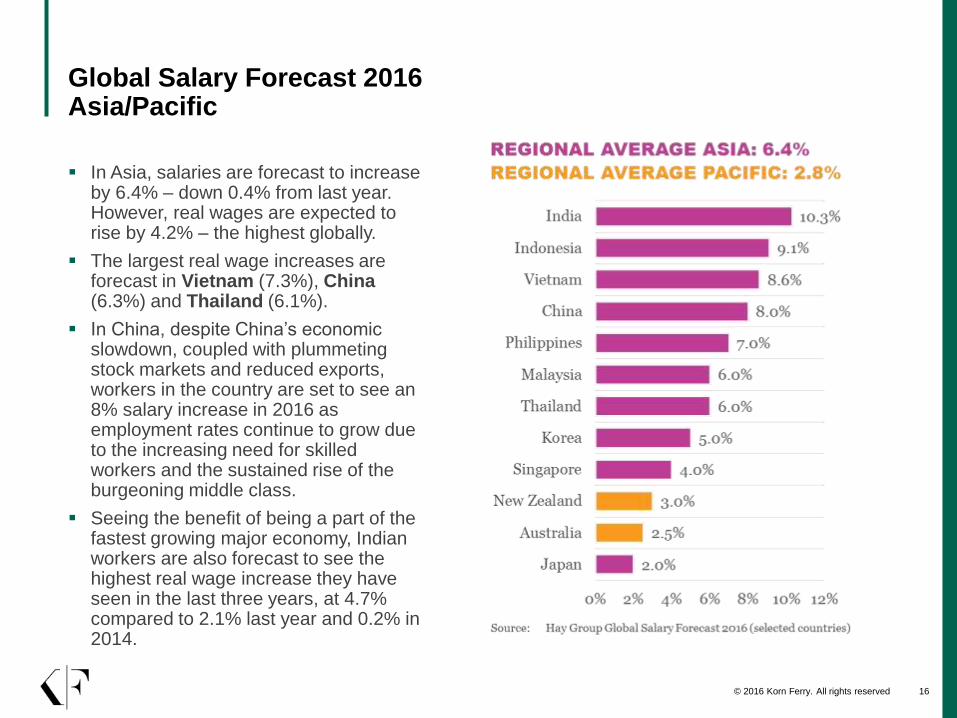
Global Salary Forecast 2016 Asia/Pacific
In Asia, salaries are forecast to increase by 6.4% – down 0.4% from last year. However, real wages are expected to rise by 4.2% – the highest globally.
The largest real wage increases are forecast in Vietnam (7.3%), China(6.3%) and Thailand (6.1%).
In China, despite China’s economic slowdown, coupled with plummeting stock markets and reduced exports, workers in the country are set to see an 8% salary increase in 2016 as employment rates continue to grow due to the increasing need for skilled workers and the sustained rise of the burgeoning middle class.
Seeing the benefit of being a part of the fastest growing major economy, Indian workers are also forecast to see the highest real wage increase they have seen in the last three years, at 4.7% compared to 2.1% last year and 0.2% in 2014.
© 2016 Korn Ferry. All rights reserved 17
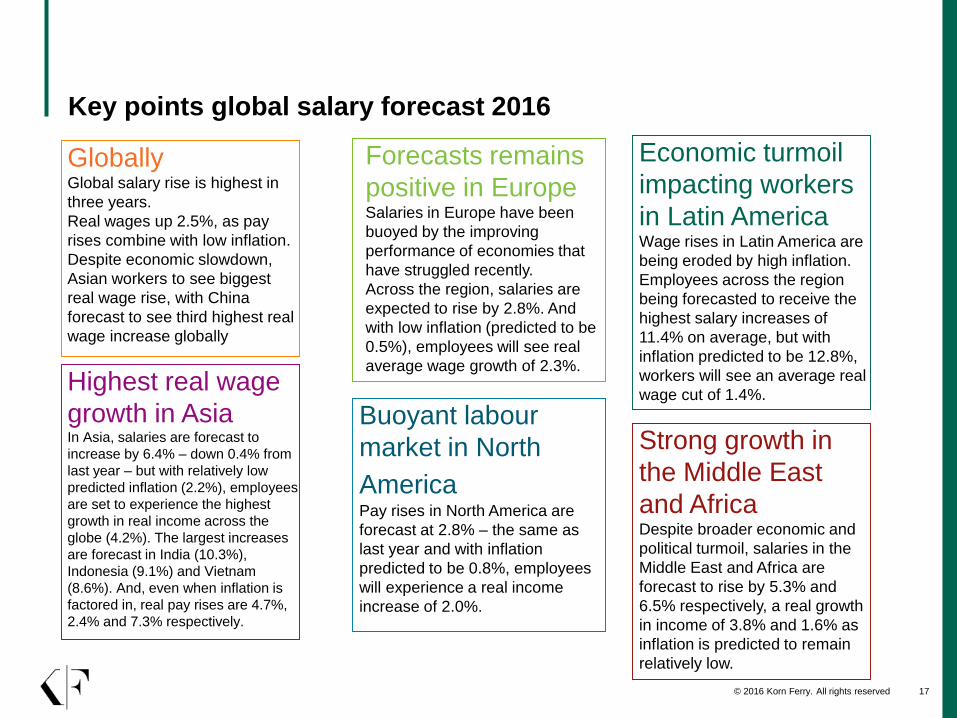
Key points global salary forecast 2016
GloballyGlobal salary rise is highest in
three years.
Real wages up 2.5%, as pay
rises combine with low inflation.
Despite economic slowdown,
Asian workers to see biggest
real wage rise, with China
forecast to see third highest real
wage increase globally
Forecasts remains
positive in EuropeSalaries in Europe have been
buoyed by the improving
performance of economies that
have struggled recently.
Across the region, salaries are
expected to rise by 2.8%. And
with low inflation (predicted to be
0.5%), employees will see real
average wage growth of 2.3%.
Economic turmoil
impacting workers
in Latin AmericaWage rises in Latin America are
being eroded by high inflation.
Employees across the region
being forecasted to receive the
highest salary increases of
11.4% on average, but with
inflation predicted to be 12.8%,
workers will see an average real
wage cut of 1.4%.Highest real wage
growth in AsiaIn Asia, salaries are forecast to
increase by 6.4% – down 0.4% from
last year – but with relatively low
predicted inflation (2.2%), employees
are set to experience the highest
growth in real income across the
globe (4.2%). The largest increases
are forecast in India (10.3%),
Indonesia (9.1%) and Vietnam
(8.6%). And, even when inflation is
factored in, real pay rises are 4.7%,
2.4% and 7.3% respectively.
Buoyant labour
market in North
AmericaPay rises in North America are
forecast at 2.8% – the same as
last year and with inflation
predicted to be 0.8%, employees
will experience a real income
increase of 2.0%.
Strong growth in
the Middle East
and AfricaDespite broader economic and
political turmoil, salaries in the
Middle East and Africa are
forecast to rise by 5.3% and
6.5% respectively, a real growth
in income of 3.8% and 1.6% as
inflation is predicted to remain
relatively low.

© 2016 Korn Ferry. All rights reserved 18
Average Annual Movements – Fixed Annual Reward
© 2016 Korn Ferry. All rights reserved 19
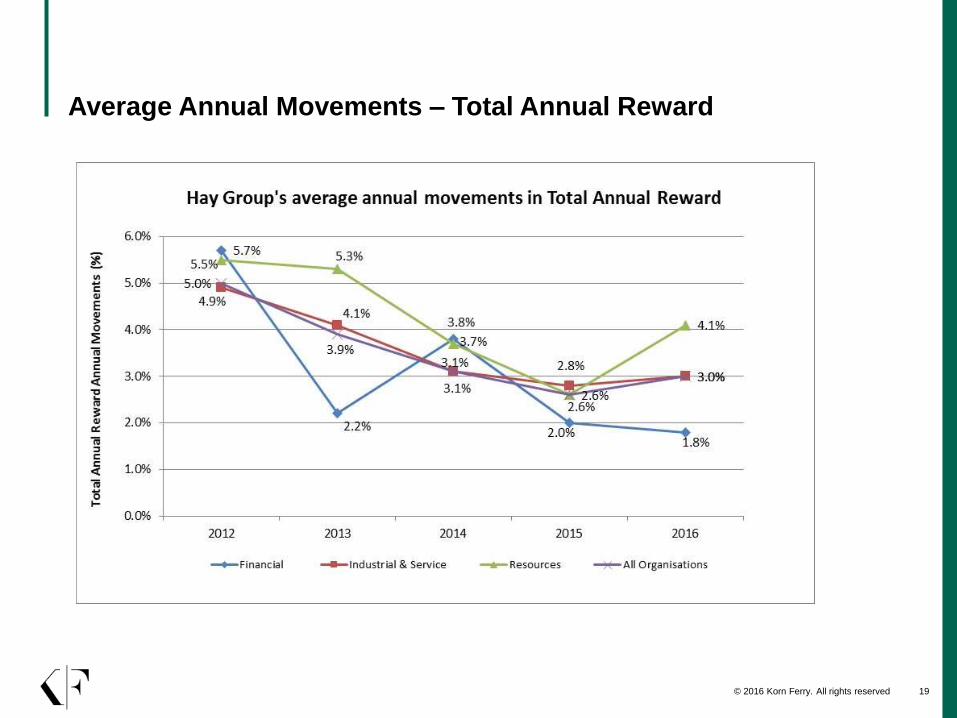
Average Annual Movements – Total Annual Reward

© 2016 Korn Ferry. All rights reserved 20
Client Forecast and Movements – Fixed Annual reward
3.8%
3.4%
3.0%
3.9%
3.5%
3.0%
2.9%
4.0%
3.5%
3.0%
2.7%
2.5%
2.0%
2.5%
3.0%
3.5%
4.0%
4.5%
5.0%
2012 2013 2014 2015 2016
Fix
ed
An
nu
al
Rew
ard
An
nu
al
Mo
vem
en
ts (%
)
Client Forecast Client Movements Hay Group Forecast
© 2016 Korn Ferry. All rights reserved 21
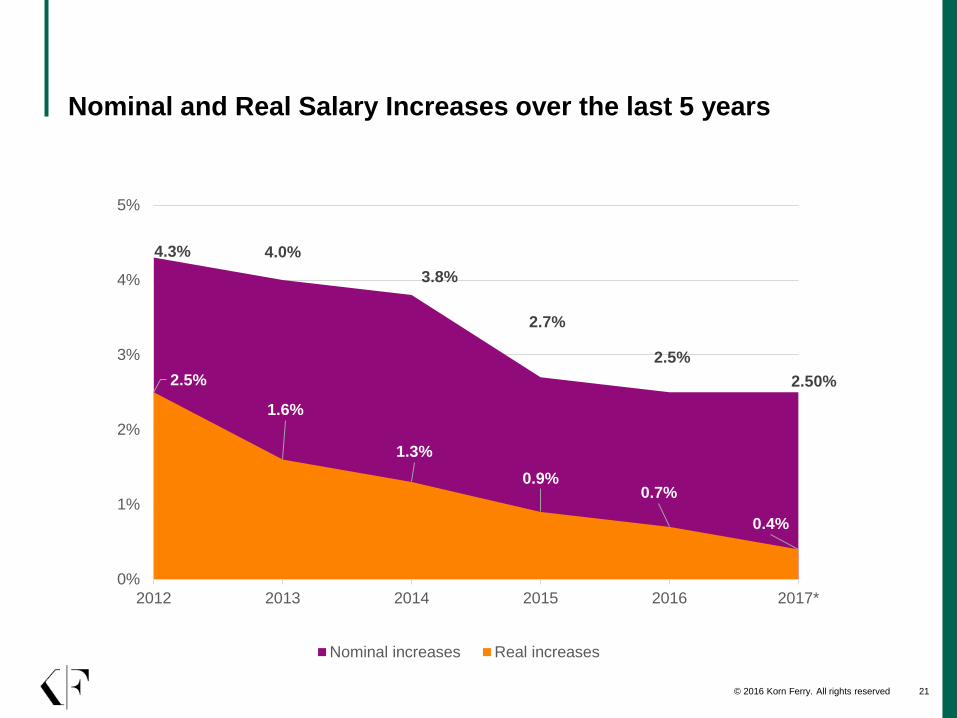
Nominal and Real Salary Increases over the last 5 years
4.3% 4.0%
3.8%
2.7%
2.5%
2.50%2.5%
1.6%
1.3%
0.9%0.7%
0.4%
0%
1%
2%
3%
4%
5%
2012 2013 2014 2015 2016 2017*
Nominal increases Real increases
© 2016 Korn Ferry. All rights reserved 22
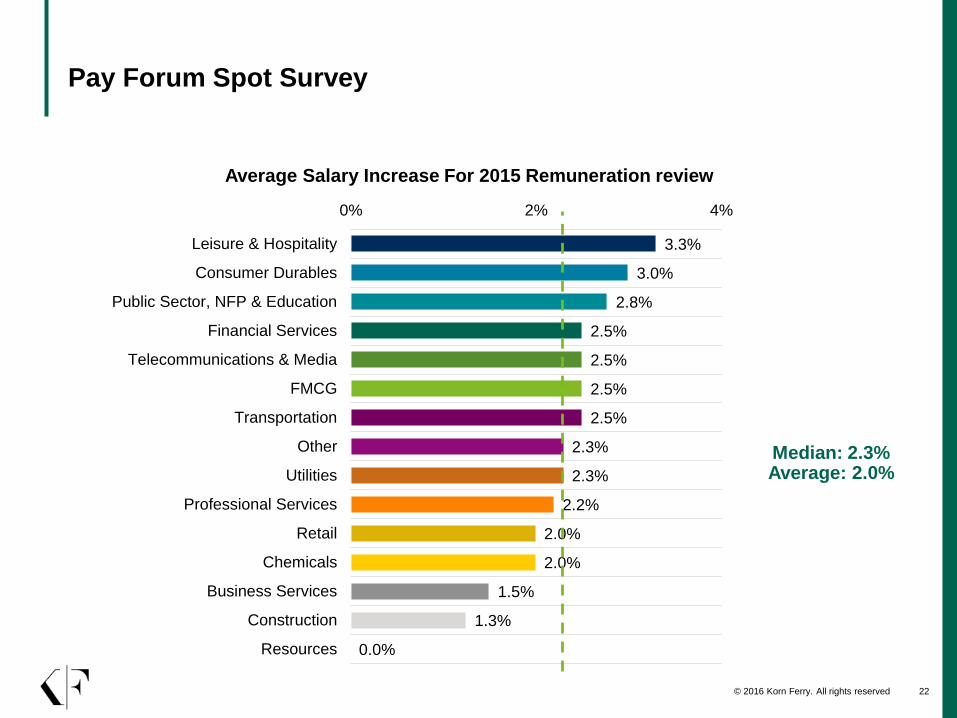
Pay Forum Spot Survey
Median: 2.3% Average: 2.0%
3.3%
3.0%
2.8%
2.5%
2.5%
2.5%
2.5%
2.3%
2.3%
2.2%
2.0%
2.0%
1.5%
1.3%
0.0%
0% 2% 4%
Leisure & Hospitality
Consumer Durables
Public Sector, NFP & Education
Financial Services
Telecommunications & Media
FMCG
Transportation
Other
Utilities
Professional Services
Retail
Chemicals
Business Services
Construction
Resources
Average Salary Increase For 2015 Remuneration review
© 2016 Korn Ferry. All rights reserved 23
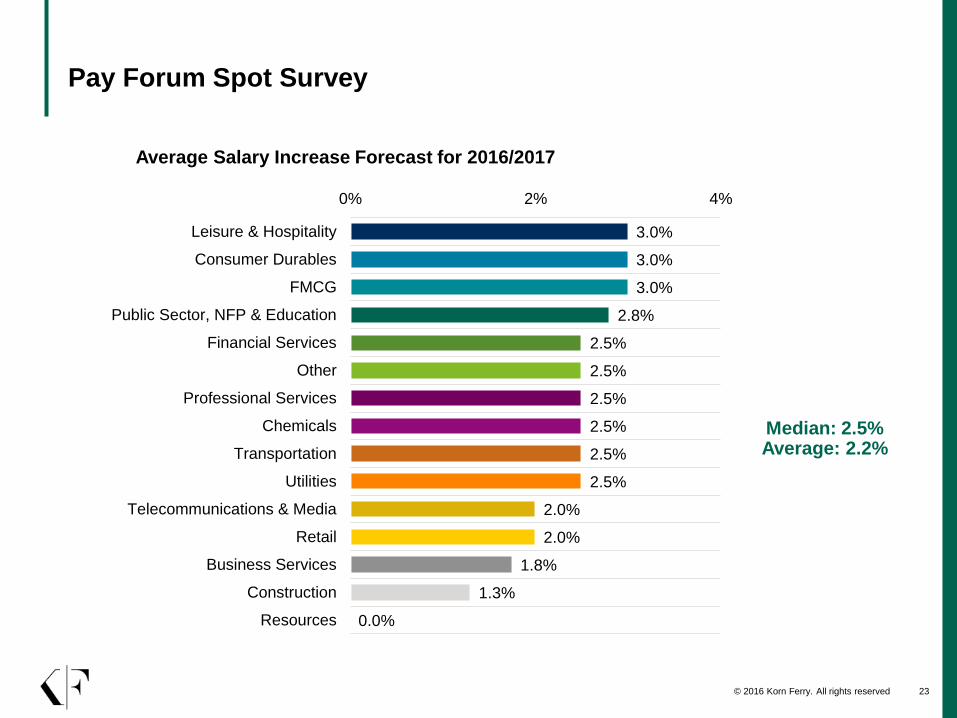
Average Salary Increase Forecast for 2016/2017
Median: 2.5% Average: 2.2%
3.0%
3.0%
3.0%
2.8%
2.5%
2.5%
2.5%
2.5%
2.5%
2.5%
2.0%
2.0%
1.8%
1.3%
0.0%
0% 2% 4%
Leisure & Hospitality
Consumer Durables
FMCG
Public Sector, NFP & Education
Financial Services
Other
Professional Services
Chemicals
Transportation
Utilities
Telecommunications & Media
Retail
Business Services
Construction
Resources
Pay Forum Spot Survey

© 2016 Korn Ferry. All rights reserved 24
Salary Differentials
© 2016 Korn Ferry. All rights reserved 25
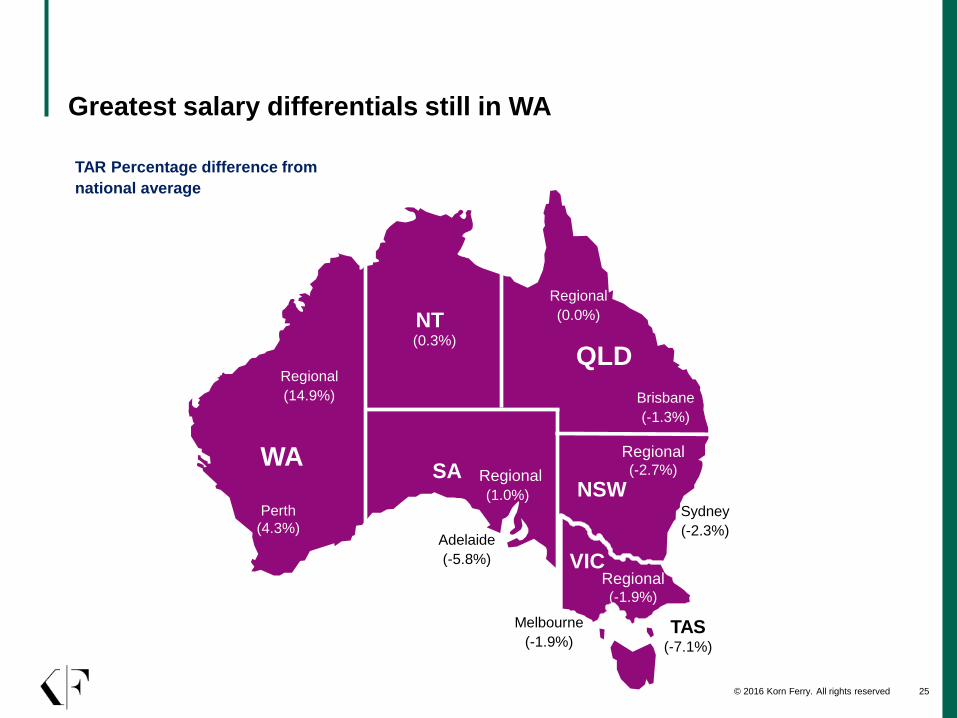
Greatest salary differentials still in WA
TAR Percentage difference from
national average
WA
Regional
(14.9%)
Perth
(4.3%)
NT
SA Regional
(1.0%)
Adelaide
(-5.8%)
QLD
Regional
(0.0%)
Brisbane
(-1.3%)
NSW
Regional(-2.7%)
VICRegional(-1.9%)
Sydney
(-2.3%)
TAS(-7.1%)
Melbourne
(-1.9%)
(0.3%)
© 2016 Korn Ferry. All rights reserved 26
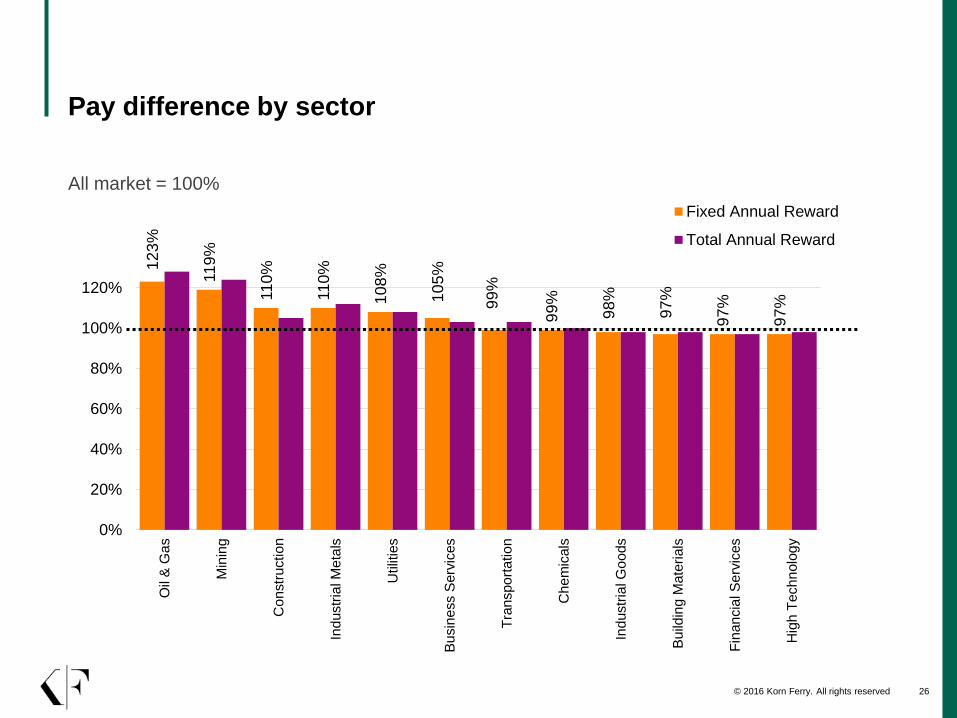
Pay difference by sector
All market = 100%
12
3%
11
9%
11
0%
11
0%
10
8%
10
5%
99
%
99
%
98
%
97
%
97
%
97
%
0%
20%
40%
60%
80%
100%
120%
Oil
& G
as
Min
ing
Co
nstr
uctio
n
Ind
ustr
ial M
eta
ls
Utilit
ies
Bu
sin
ess S
erv
ices
Tra
nspo
rta
tio
n
Ch
em
icals
Ind
ustr
ial G
oo
ds
Bu
ildin
g M
ate
rials
Fin
ancia
l S
erv
ices
Hig
h T
echnolo
gy
Fixed Annual Reward
Total Annual Reward
© 2016 Korn Ferry. All rights reserved 27
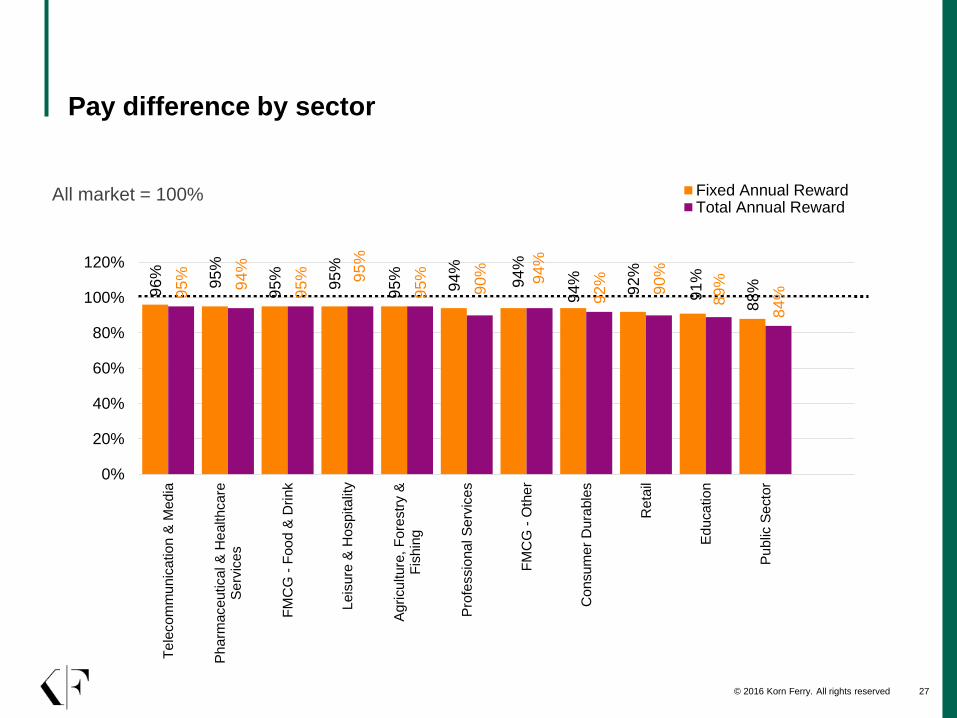
Pay difference by sector
96
%
95
%
95
%
95
%
95
%
94
%
94
%
94
%
92
%
91
%
88
%95
%
94
%
95
% 95
%
95
%
90
% 94
%
92
%
90
%
89
%
84
%
0%
20%
40%
60%
80%
100%
120%
Te
leco
mm
un
ica
tio
n &
Med
ia
Ph
arm
ace
utica
l &
He
alth
care
Se
rvic
es
FM
CG
- F
oo
d &
Dri
nk
Leis
ure
& H
ospita
lity
Ag
ricu
lture
, F
ore
str
y &
Fis
hin
g
Pro
fessio
na
l S
erv
ice
s
FM
CG
- O
the
r
Co
nsu
me
r D
ura
ble
s
Re
tail
Ed
uca
tio
n
Pu
blic
Se
cto
r
Fixed Annual RewardTotal Annual Reward
All market = 100%
© 2016 Korn Ferry. All rights reserved 28
Pay differences by job families
13
0%
10
7%
10
6%
10
5%
10
1%
10
1%
10
0%
99
%
99
%
97
%
96
%
94
%
93
%
90
%
88
%
13
5%
10
8%
10
5%
10
5%
10
1%
10
1%
10
0%
10
0%
99
%
98
%
96
%
96
%
95
%
91
%
88
%
0%
20%
40%
60%
80%
100%
120%
140%
Min
ing
Ope
ration
s (
MO
)
En
gin
eeri
ng (
EG
)
Pro
du
ctio
n (
PR
)
Pro
ject M
an
ag
em
en
t (P
M)
Info
rmation
Te
ch
no
logy (
IT)
Log
istics/S
up
ply
Ch
ain
(LS
)
Ad
min
istr
ation
/Su
pp
ort
/Serv
ice
(A
S)
Fin
an
ce
an
d A
ccou
ntin
g (
FA
)
Hum
an
Reso
urc
es (
HR
)
Sa
les (
SL
)
Ma
rketin
g (
MK
)
Bra
nch
Fin
an
cia
l S
erv
ice
s /
Ban
kin
g(B
B)
Custo
me
r S
erv
ice
(C
S)
Call
Ce
nte
r (C
C)
Reta
il O
pera
tion
s (
RL
)
Fixed Annual RewardTotal Annual Reward

© 2016 Korn Ferry. All rights reserved 29
Hot Jobs
AVAILABILITY OF CANDIDATES IN THE MARKETPLACE
In our data submission survey, 41% of organisation report a scarcity of candidates in the market
ROLES IN DEMAND
Premium No Premium
IT Marketing – Digital & E-commerce
Engineering – All Types Sales
Health/Safety/Environment Finance & Accounting
Energy Trading Risk Management
Premium No Premium
IT Marketing – Digital & E-commerce
Engineering – All Types Sales
Health/Safety/Environment Finance & Accounting
Energy Trading Risk Management

© 2016 Korn Ferry. All rights reserved 30
Hot Jobs
HOW DO ORGANISATIONS DEAL WITH CANDIDATE SCARCITY
Majority of organisation maintain their current pay policy (i.e. do nothing)
If organisations do attempt to address candidate scarcity through remuneration, we commonly see:
• Higher STI
• Higher Fixed Pay
• Recognition/Sign-on Bonuses
• Additional Benefits
© 2016 Korn Ferry. All rights reserved 31
Performance Measurement
© 2016 Korn Ferry. All rights reserved 32
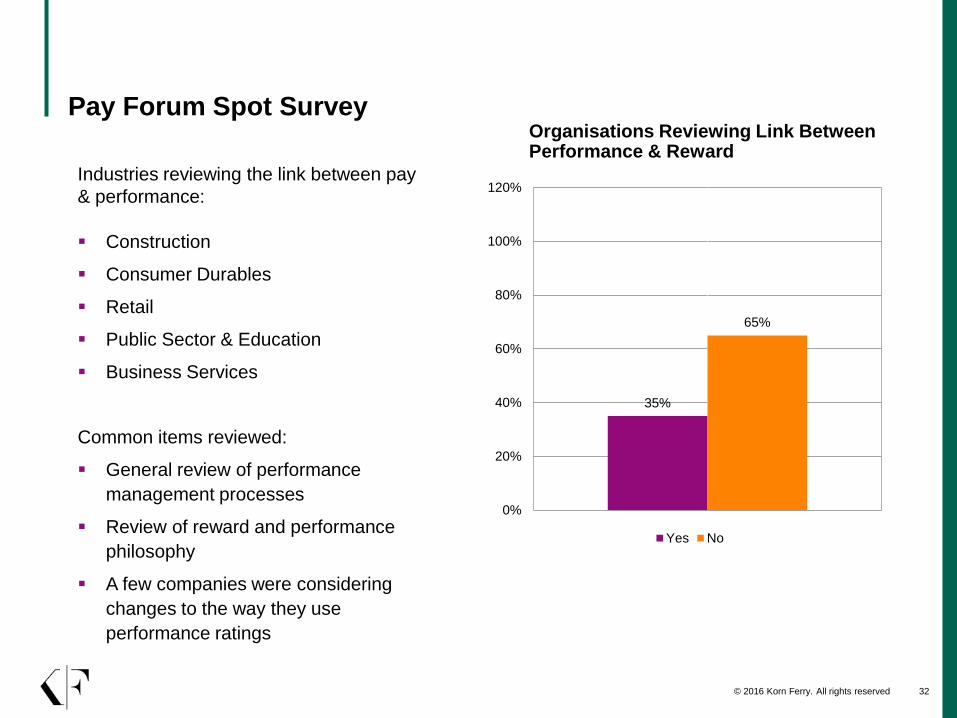
Pay Forum Spot Survey
35%
65%
0%
20%
40%
60%
80%
100%
120%
Yes No
Industries reviewing the link between pay
& performance:
Construction
Consumer Durables
Retail
Public Sector & Education
Business Services
Common items reviewed:
General review of performance
management processes
Review of reward and performance
philosophy
A few companies were considering
changes to the way they use
performance ratings
Organisations Reviewing Link Between Performance & Reward
© 2016 Korn Ferry. All rights reserved 33
Australia –incentive pay

© 2016 Korn Ferry. All rights reserved 34
Trends of STVP Plans – Last 3 Years
86.0%
85.0%
83.0%
94.0%
87.0%
92.0%
76%
78%
80%
82%
84%
86%
88%
90%
92%
94%
96%
2014 2015 2016
%Orgs with STVP %STVP plans that paid
© 2016 Korn Ferry. All rights reserved 35
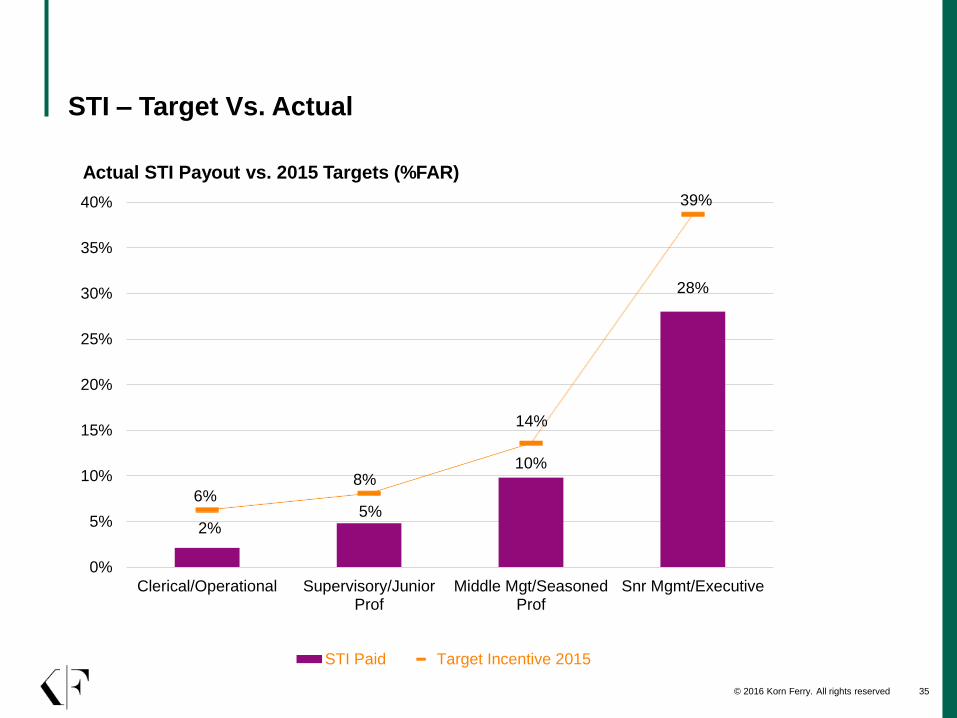
STI – Target Vs. Actual
2%5%
10%
28%
6%8%
14%
39%
0%
5%
10%
15%
20%
25%
30%
35%
40%
Clerical/Operational Supervisory/JuniorProf
Middle Mgt/SeasonedProf
Snr Mgmt/Executive
STI Paid Target Incentive 2015
Actual STI Payout vs. 2015 Targets (%FAR)

© 2016 Korn Ferry. All rights reserved 36
Pay Forum Spot Survey
82%
18%
0%
10%
20%
30%
40%
50%
60%
70%
80%
90%
Yes No
25% 23%
52%
0%
10%
20%
30%
40%
50%
60%
70%
80%
90%
Lower Higher Undecided
Organisations intending to Pay a Bonus This Year

© 2016 Korn Ferry. All rights reserved 37
Benefits
© 2016 Korn Ferry. All rights reserved 38
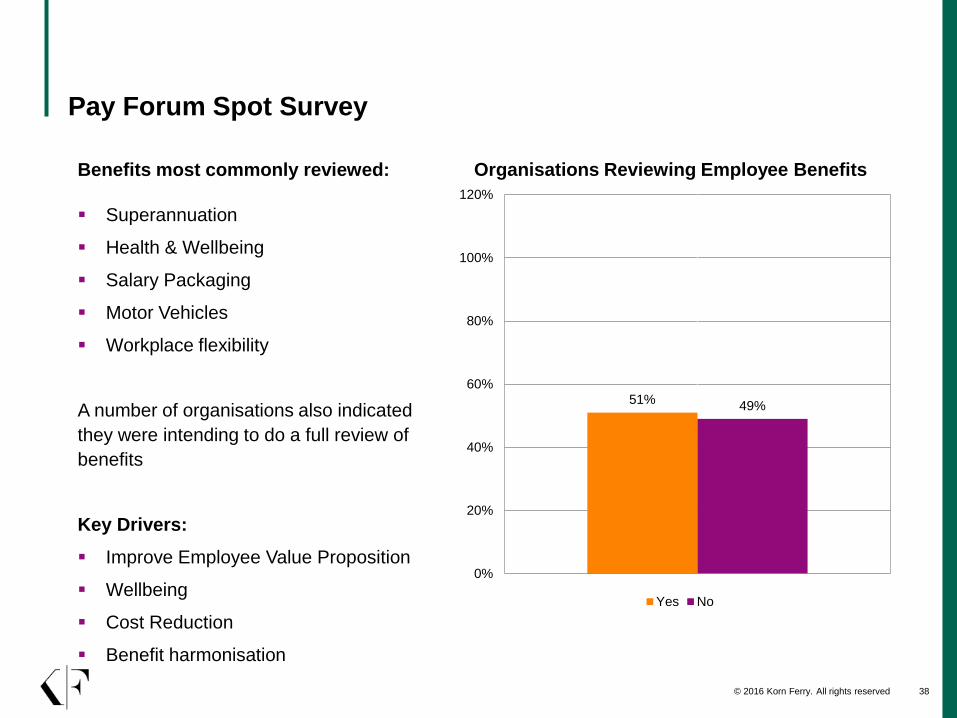
Pay Forum Spot Survey
51%49%
0%
20%
40%
60%
80%
100%
120%
Yes No
Benefits most commonly reviewed:
Superannuation
Health & Wellbeing
Salary Packaging
Motor Vehicles
Workplace flexibility
A number of organisations also indicated
they were intending to do a full review of
benefits
Key Drivers:
Improve Employee Value Proposition
Wellbeing
Cost Reduction
Benefit harmonisation
Organisations Reviewing Employee Benefits

© 2016 Korn Ferry. All rights reserved 39
Gender Equity

© 2016 Korn Ferry. All rights reserved 40
Gender Headline

© 2016 Korn Ferry. All rights reserved 41
Gender distribution on each reference level
0%
10%
20%
30%
40%
50%
60%
70%
80%
90%
6 7 8 9 10 11 12 13 14 15 16 17 18 19 20 21 22 23
Males Females
© 2016 Korn Ferry. All rights reserved 42
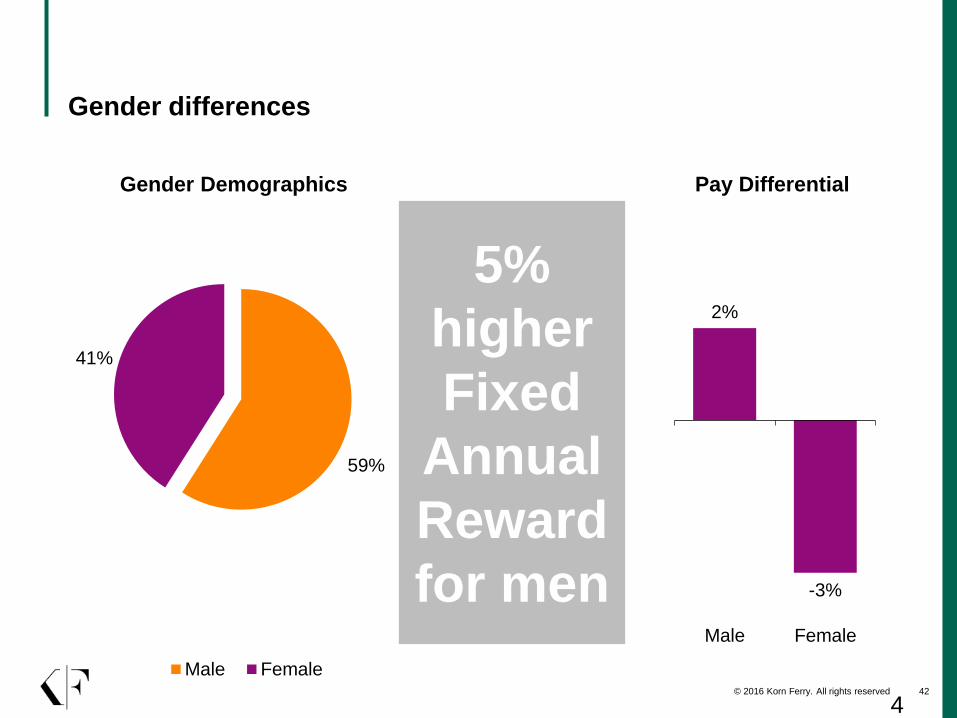
Gender differences
4
2
59%
41%
Male Female
Gender Demographics
5%
higher
Fixed
Annual
Reward
for men
2%
-3%
Male Female
Pay Differential
© 2016 Korn Ferry. All rights reserved 43
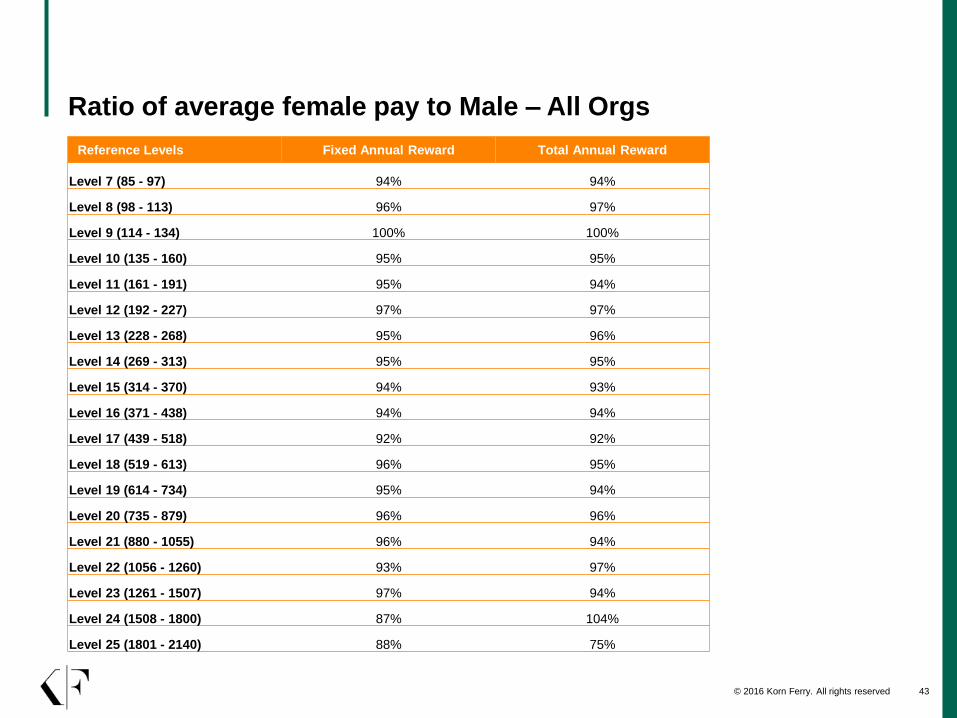
Ratio of average female pay to Male – All Orgs
Reference Levels Fixed Annual Reward Total Annual Reward
Level 7 (85 - 97) 94% 94%
Level 8 (98 - 113) 96% 97%
Level 9 (114 - 134) 100% 100%
Level 10 (135 - 160) 95% 95%
Level 11 (161 - 191) 95% 94%
Level 12 (192 - 227) 97% 97%
Level 13 (228 - 268) 95% 96%
Level 14 (269 - 313) 95% 95%
Level 15 (314 - 370) 94% 93%
Level 16 (371 - 438) 94% 94%
Level 17 (439 - 518) 92% 92%
Level 18 (519 - 613) 96% 95%
Level 19 (614 - 734) 95% 94%
Level 20 (735 - 879) 96% 96%
Level 21 (880 - 1055) 96% 94%
Level 22 (1056 - 1260) 93% 97%
Level 23 (1261 - 1507) 97% 94%
Level 24 (1508 - 1800) 87% 104%
Level 25 (1801 - 2140) 88% 75%
© 2016 Korn Ferry. All rights reserved 44
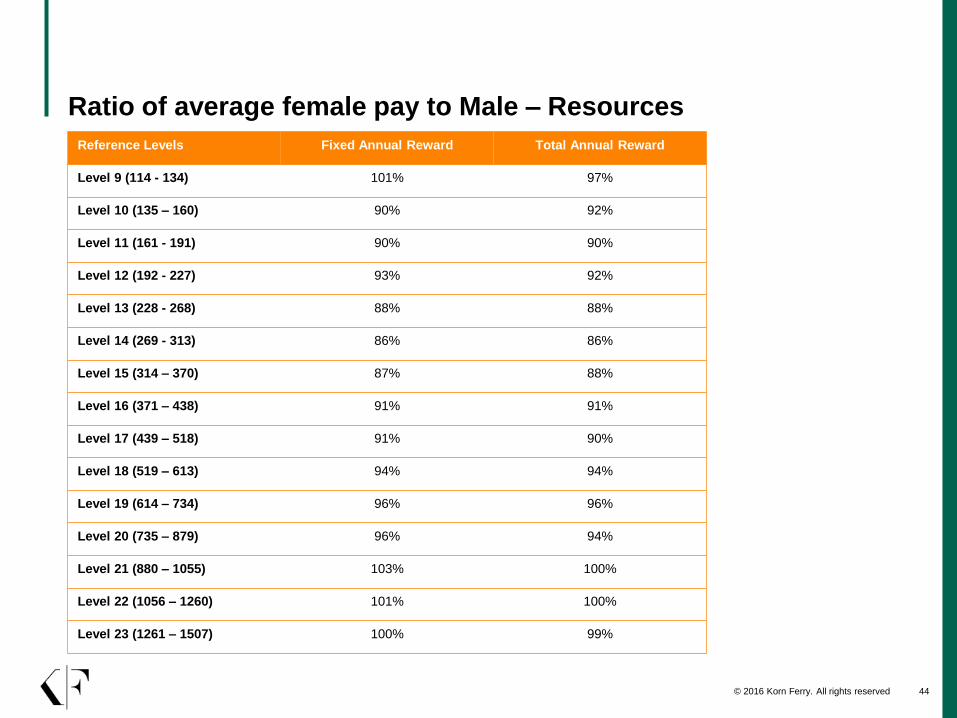
Ratio of average female pay to Male – Resources
Reference Levels Fixed Annual Reward Total Annual Reward
Level 9 (114 - 134) 101% 97%
Level 10 (135 – 160) 90% 92%
Level 11 (161 - 191) 90% 90%
Level 12 (192 - 227) 93% 92%
Level 13 (228 - 268) 88% 88%
Level 14 (269 - 313) 86% 86%
Level 15 (314 – 370) 87% 88%
Level 16 (371 – 438) 91% 91%
Level 17 (439 – 518) 91% 90%
Level 18 (519 – 613) 94% 94%
Level 19 (614 – 734) 96% 96%
Level 20 (735 – 879) 96% 94%
Level 21 (880 – 1055) 103% 100%
Level 22 (1056 – 1260) 101% 100%
Level 23 (1261 – 1507) 100% 99%
© 2016 Korn Ferry. All rights reserved 45
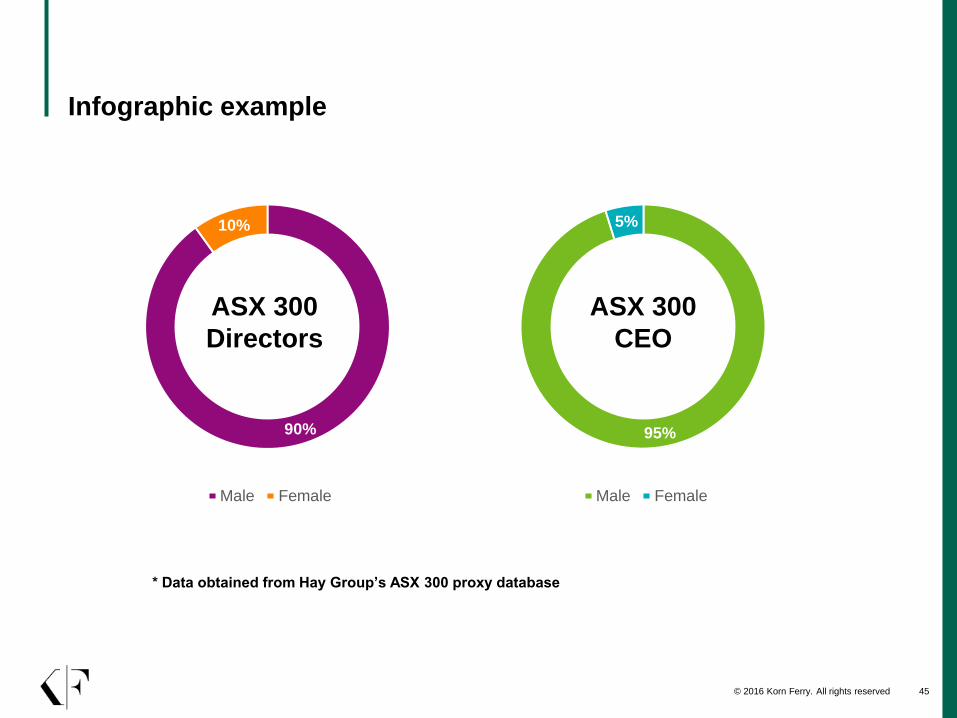
Infographic example
90%
10%
Male Female
ASX 300
Directors
95%
5%
Male Female
ASX 300
CEO
* Data obtained from Hay Group’s ASX 300 proxy database
© 2016 Korn Ferry. All rights reserved 46
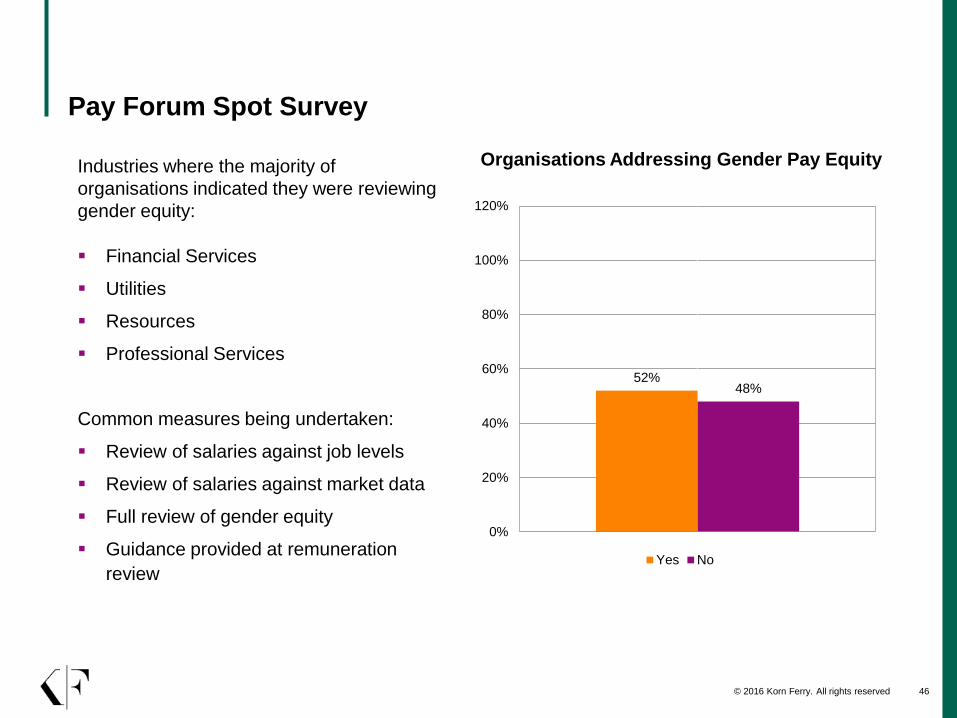
Pay Forum Spot Survey
52%48%
0%
20%
40%
60%
80%
100%
120%
Yes No
Industries where the majority of
organisations indicated they were reviewing
gender equity:
Financial Services
Utilities
Resources
Professional Services
Common measures being undertaken:
Review of salaries against job levels
Review of salaries against market data
Full review of gender equity
Guidance provided at remuneration
review
Organisations Addressing Gender Pay Equity

© 2016 Korn Ferry. All rights reserved 47
Panel Discussion
© 2016 Korn Ferry. All rights reserved 48
Gender Equity
PREVALENCE OF FEMALE VS MALE
From our database, the year on year improvement on overall female prevalence is only 2%
We continue to see lower prevalence of female in roles from RL14 and above from our PayNet
database
When looking at director roles, the female prevalence on the ASX300 were only 10%.
CLOSE TO 50% SURVEYED* NOT DOING ANYTHING ON PAY EQUITY
*Survey results obtained from the Pay Forum Spot Survey conducted by Korn Ferry Hay Group conducted.

© 2016 Korn Ferry. All rights reserved 49
Performance Management
SMALLER PAY INCREASES AND CONSISTENT BONUS PAYOUT TREND
Potentially indicates more focus on bonuses as reward tool.
FROM OUR SURVEY, JUST UNDER 40% OF COMPANIES ARE REVIEWING LINK
BETWEEN PAY AND PERFORMANCE
Common items reviewed are the performance management process and the reward and
performance philosophy.
Only 1 company indicated removing performance ratings.
*Survey results obtained from the Pay Forum Spot Survey conducted by Korn Ferry Hay Group conducted.
© 2016 Korn Ferry. All rights reserved 50
Hot Jobs
JOB FAMILY PREMIUMS
Based on the trends we have presented on premium of various job families, majority of the %
differentials are within the +/-10% range.
POPULAR BELIEF THAT HOT JOB = PREMIUM; BUT NOT SO
WHAT APPROACH SHOULD AN ORGANISATION TAKE WHEN VALUING HOT JOBS
© 2016 Korn Ferry. All rights reserved 51

Thank you