Embed Size (px)
Citation preview

Wir schaffen Wissen – heute für morgen
Paul Scherrer Institut
“Overview of Transverse Profile Monitors in SwissFEL”
Gian Luca Orlandi
G.L. Orlandi, Paul Scherrer Institut
6th Microbunching Workshop, Trieste 6-8 October 2014
6th Microbunching Workshop, Trieste 6-8 October 2014
G.L. Orlandi, Paul Scherrer Institut Seite 2
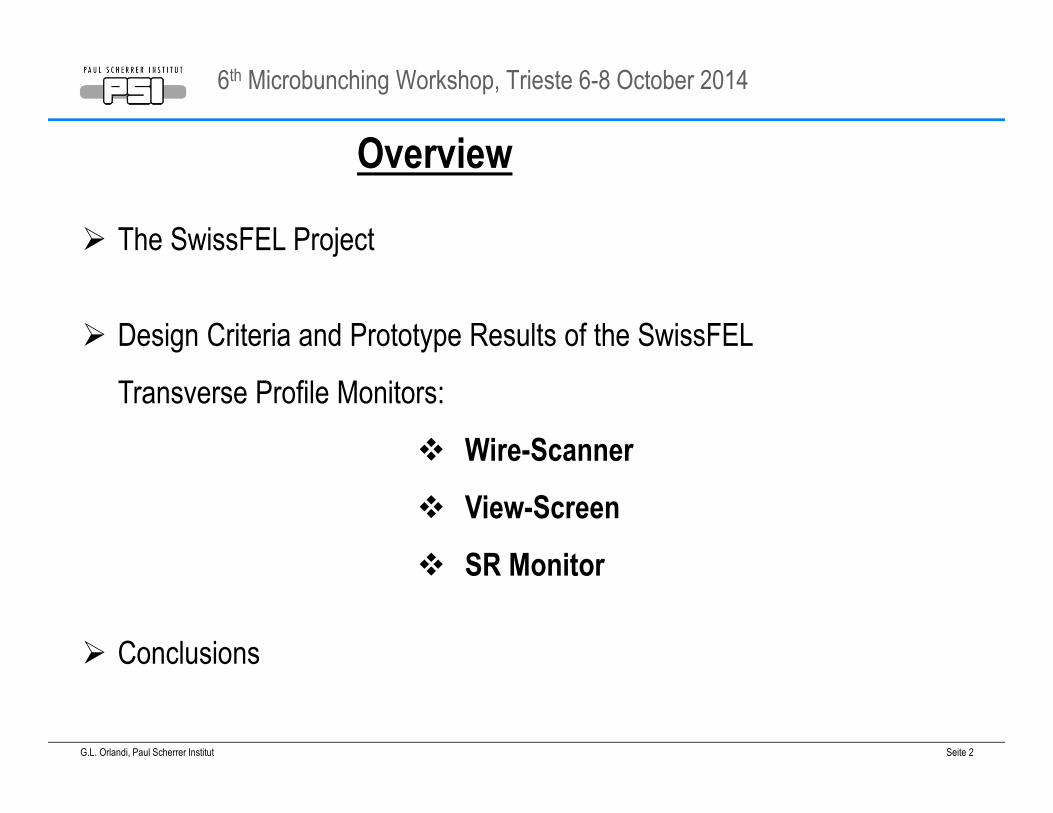
Overview
� The SwissFEL Project
� Design Criteria and Prototype Results of the SwissFEL
Transverse Profile Monitors:
� Wire-Scanner
� View-Screen
� SR Monitor
� Conclusions
6th Microbunching Workshop, Trieste 6-8 October 2014
G.L. Orlandi, Paul Scherrer Institut Seite 3
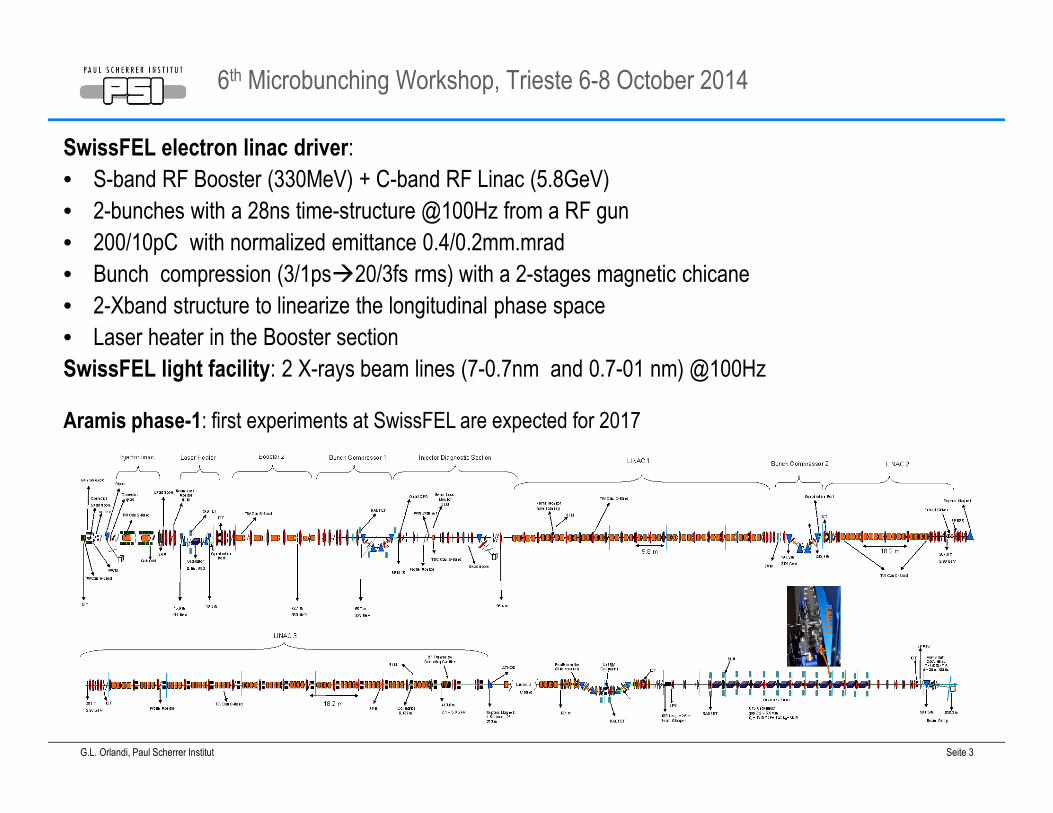
SwissFEL electron linac driver:
• S-band RF Booster (330MeV) + C-band RF Linac (5.8GeV)
• 2-bunches with a 28ns time-structure @100Hz from a RF gun
• 200/10pC with normalized emittance 0.4/0.2mm.mrad
• Bunch compression (3/1ps�20/3fs rms) with a 2-stages magnetic chicane
• 2-Xband structure to linearize the longitudinal phase space
• Laser heater in the Booster section
SwissFEL light facility: 2 X-rays beam lines (7-0.7nm and 0.7-01 nm) @100Hz
Aramis phase-1: first experiments at SwissFEL are expected for 2017
6th Microbunching Workshop, Trieste 6-8 October 2014
G.L. Orlandi, Paul Scherrer Institut Seite 4
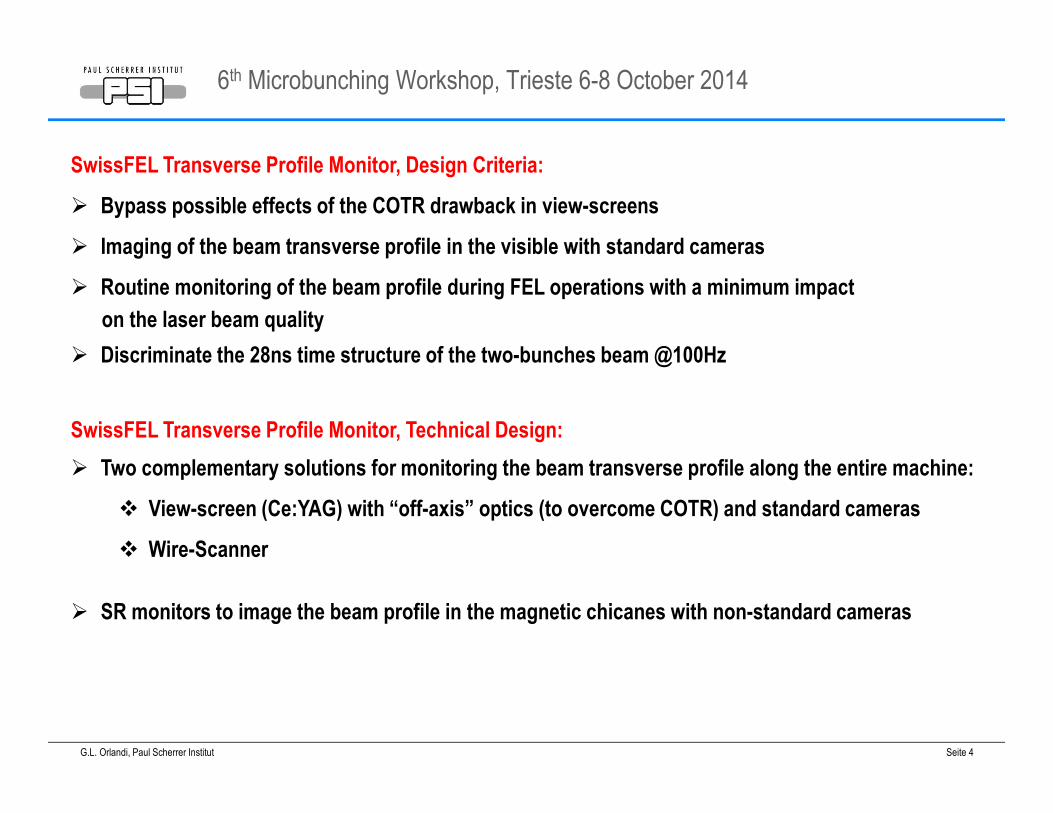
SwissFEL Transverse Profile Monitor, Design Criteria:
� Bypass possible effects of the COTR drawback in view-screens
� Imaging of the beam transverse profile in the visible with standard cameras
� Routine monitoring of the beam profile during FEL operations with a minimum impact
on the laser beam quality
� Discriminate the 28ns time structure of the two-bunches beam @100Hz
SwissFEL Transverse Profile Monitor, Technical Design:
� Two complementary solutions for monitoring the beam transverse profile along the entire machine:
� View-screen (Ce:YAG) with “off-axis” optics (to overcome COTR) and standard cameras
� Wire-Scanner
� SR monitors to image the beam profile in the magnetic chicanes with non-standard cameras
6th Microbunching Workshop, Trieste 6-8 October 2014
G.L. Orlandi, Paul Scherrer Institut Seite 5
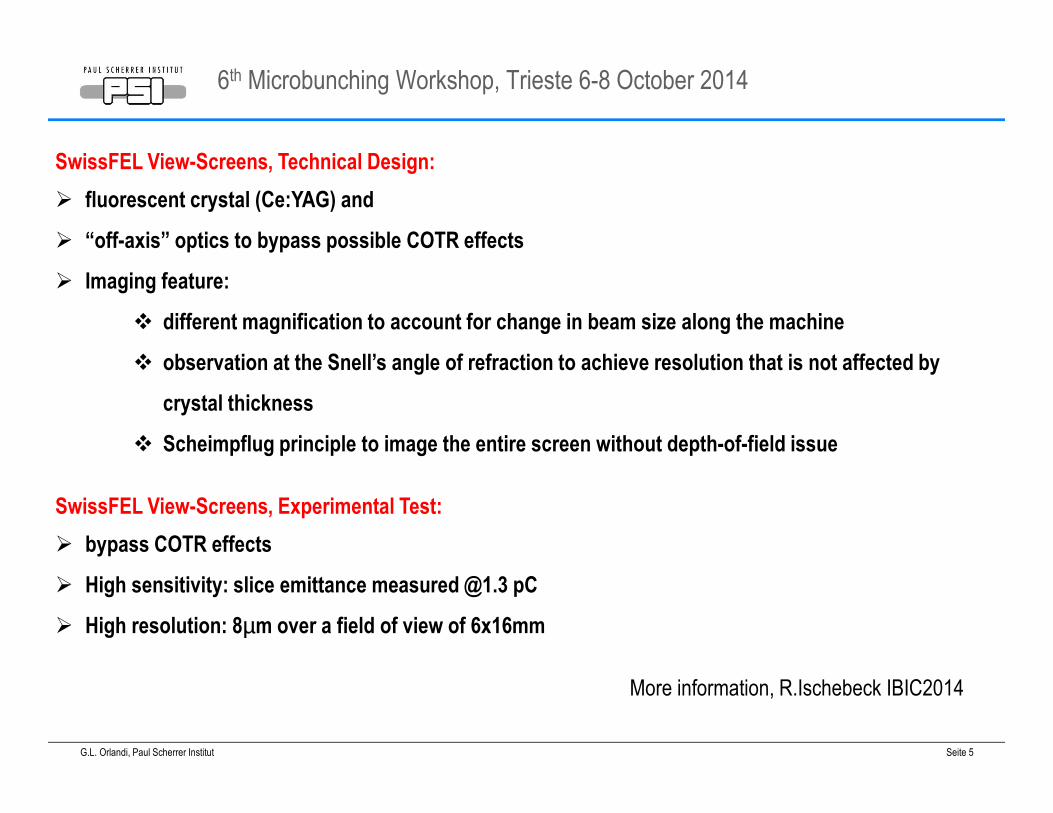
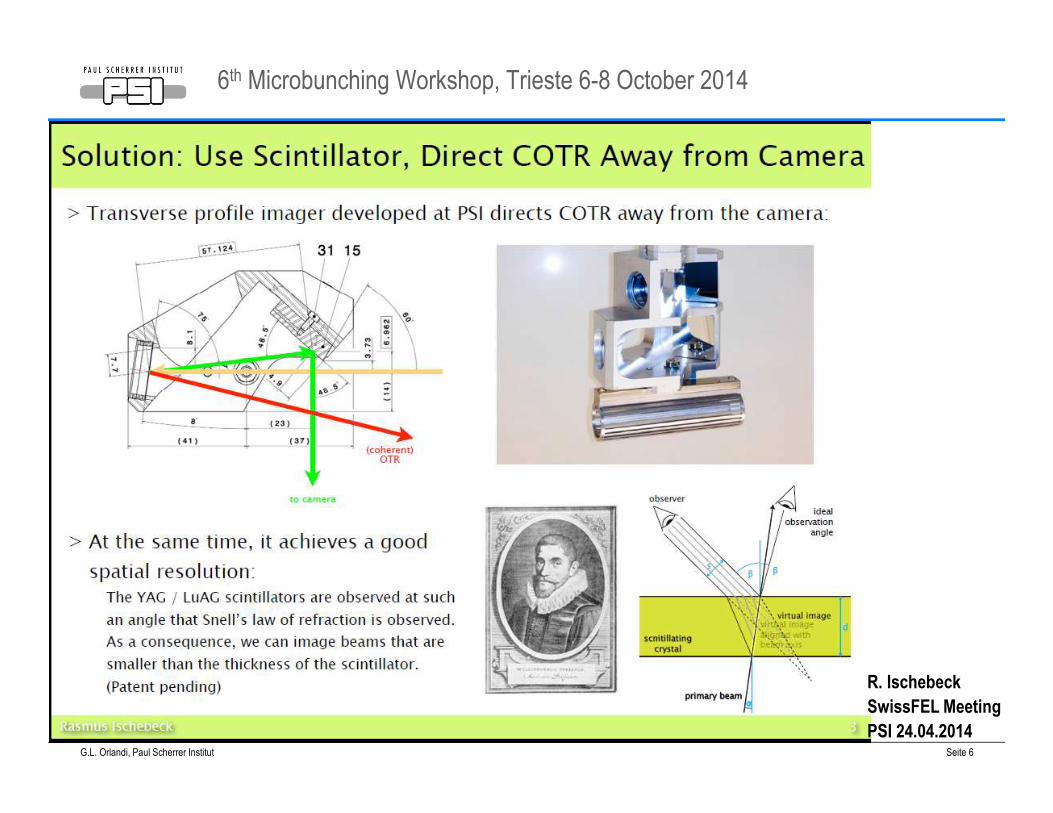
SwissFEL View-Screens, Technical Design:
� fluorescent crystal (Ce:YAG) and
� “off-axis” optics to bypass possible COTR effects
� Imaging feature:
� different magnification to account for change in beam size along the machine
� observation at the Snell’s angle of refraction to achieve resolution that is not affected by
crystal thickness
� Scheimpflug principle to image the entire screen without depth-of-field issue
SwissFEL View-Screens, Experimental Test:
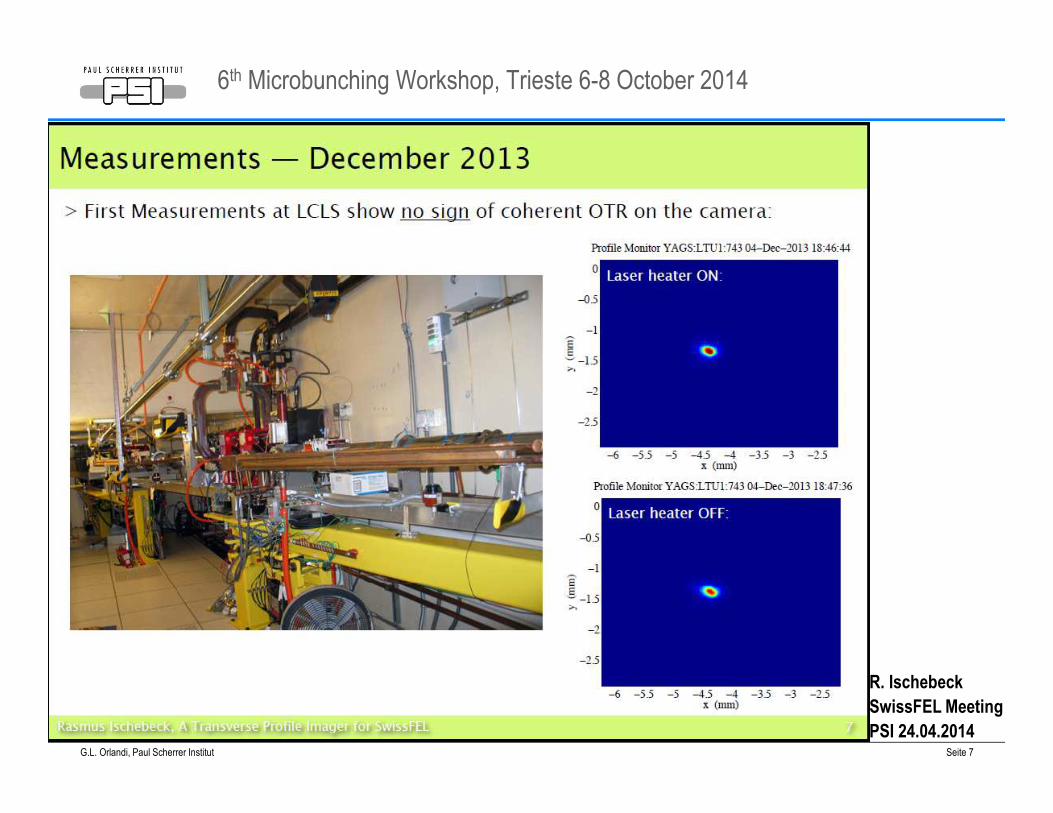
� bypass COTR effects
� High sensitivity: slice emittance measured @1.3 pC
� High resolution: 8µm over a field of view of 6x16mm
More information, R.Ischebeck IBIC2014
6th Microbunching Workshop, Trieste 6-8 October 2014
G.L. Orlandi, Paul Scherrer Institut Seite 6
R. Ischebeck
SwissFEL Meeting
PSI 24.04.2014
6th Microbunching Workshop, Trieste 6-8 October 2014
G.L. Orlandi, Paul Scherrer Institut Seite 7
R. Ischebeck
SwissFEL Meeting
PSI 24.04.2014
6th Microbunching Workshop, Trieste 6-8 October 2014
G.L. Orlandi, Paul Scherrer Institut Seite 8
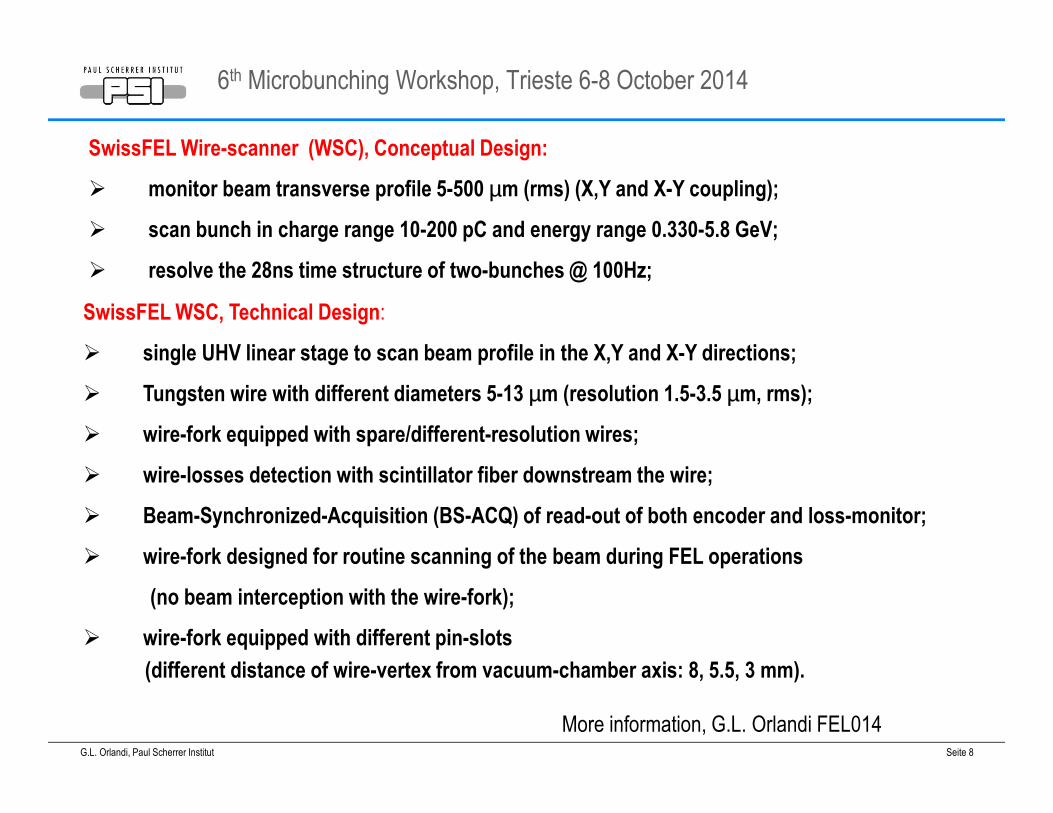
SwissFEL Wire-scanner (WSC), Conceptual Design:
� monitor beam transverse profile 5-500 µm (rms) (X,Y and X-Y coupling);
� scan bunch in charge range 10-200 pC and energy range 0.330-5.8 GeV;
� resolve the 28ns time structure of two-bunches @ 100Hz;
SwissFEL WSC, Technical Design:
� single UHV linear stage to scan beam profile in the X,Y and X-Y directions;
� Tungsten wire with different diameters 5-13 µm (resolution 1.5-3.5 µm, rms);
� wire-fork equipped with spare/different-resolution wires;
� wire-losses detection with scintillator fiber downstream the wire;
� Beam-Synchronized-Acquisition (BS-ACQ) of read-out of both encoder and loss-monitor;
� wire-fork designed for routine scanning of the beam during FEL operations
(no beam interception with the wire-fork);
� wire-fork equipped with different pin-slots
(different distance of wire-vertex from vacuum-chamber axis: 8, 5.5, 3 mm).
More information, G.L. Orlandi FEL014
6th Microbunching Workshop, Trieste 6-8 October 2014
G.L. Orlandi, Paul Scherrer Institut Seite 9
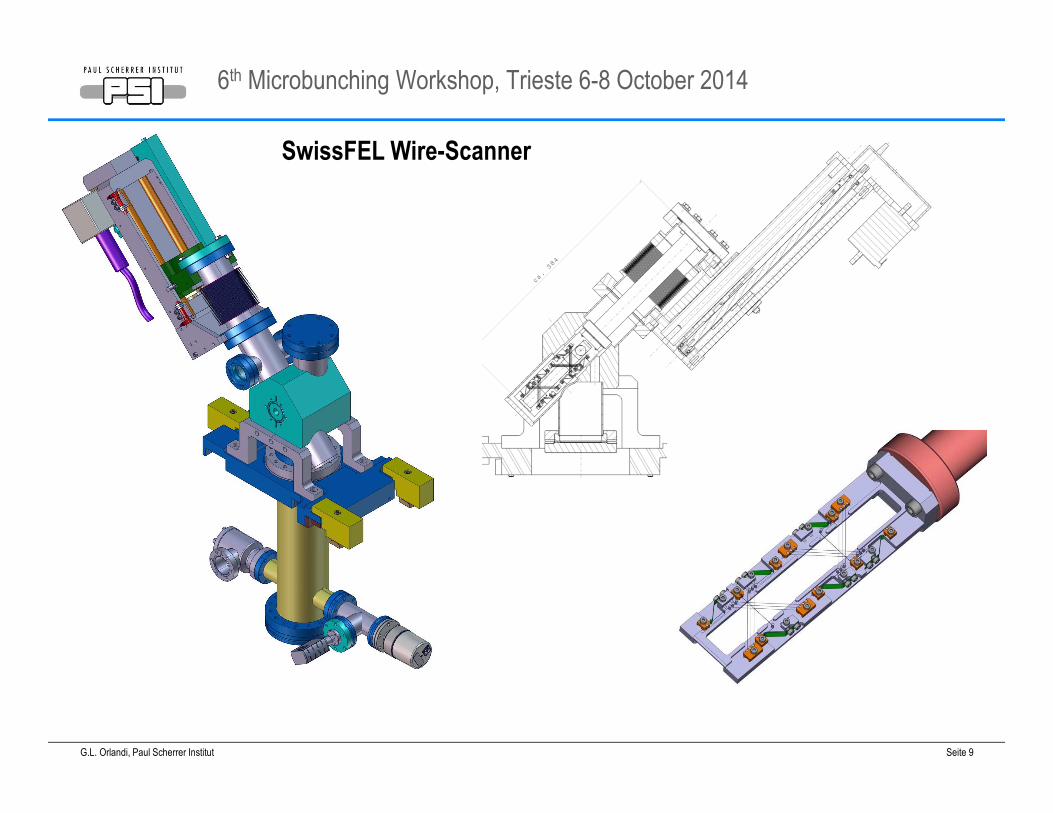
SwissFEL Wire-Scanner
6th Microbunching Workshop, Trieste 6-8 October 2014
G.L. Orlandi, Paul Scherrer Institut Seite 10
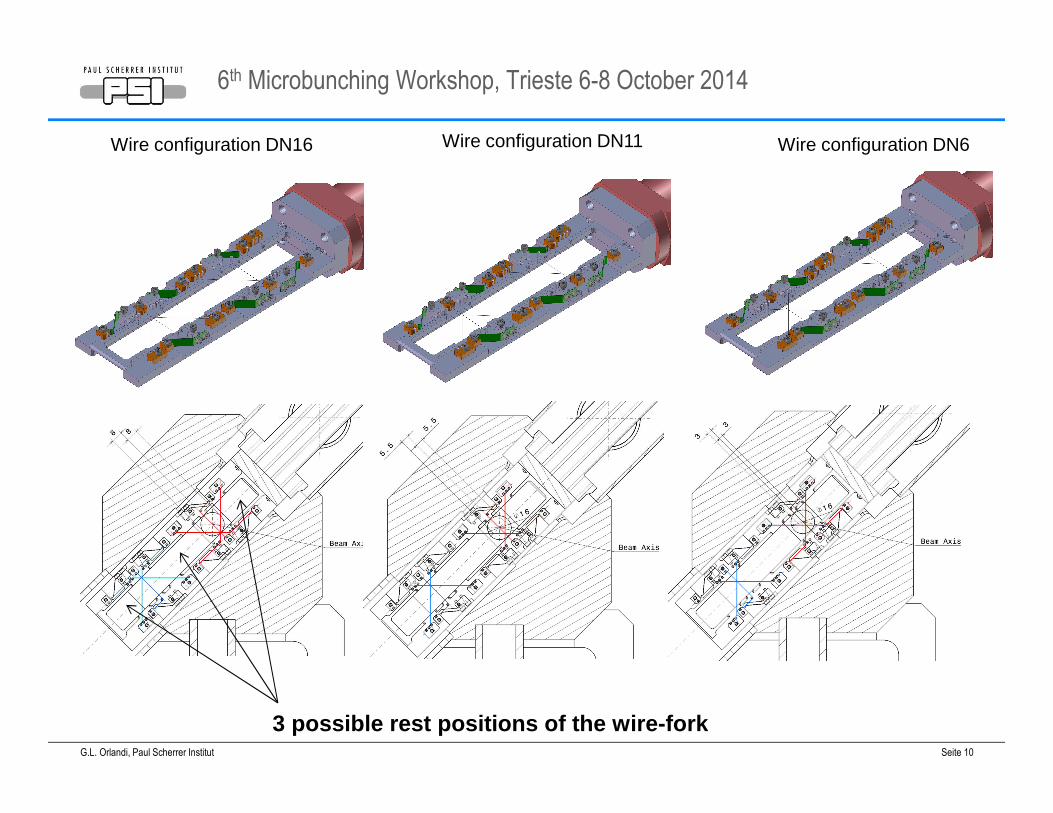
3 possible rest positions of the wire-fork
Wire configuration DN16 Wire configuration DN11 Wire configuration DN6
6th Microbunching Workshop, Trieste 6-8 October 2014
G.L. Orlandi, Paul Scherrer Institut Seite 11
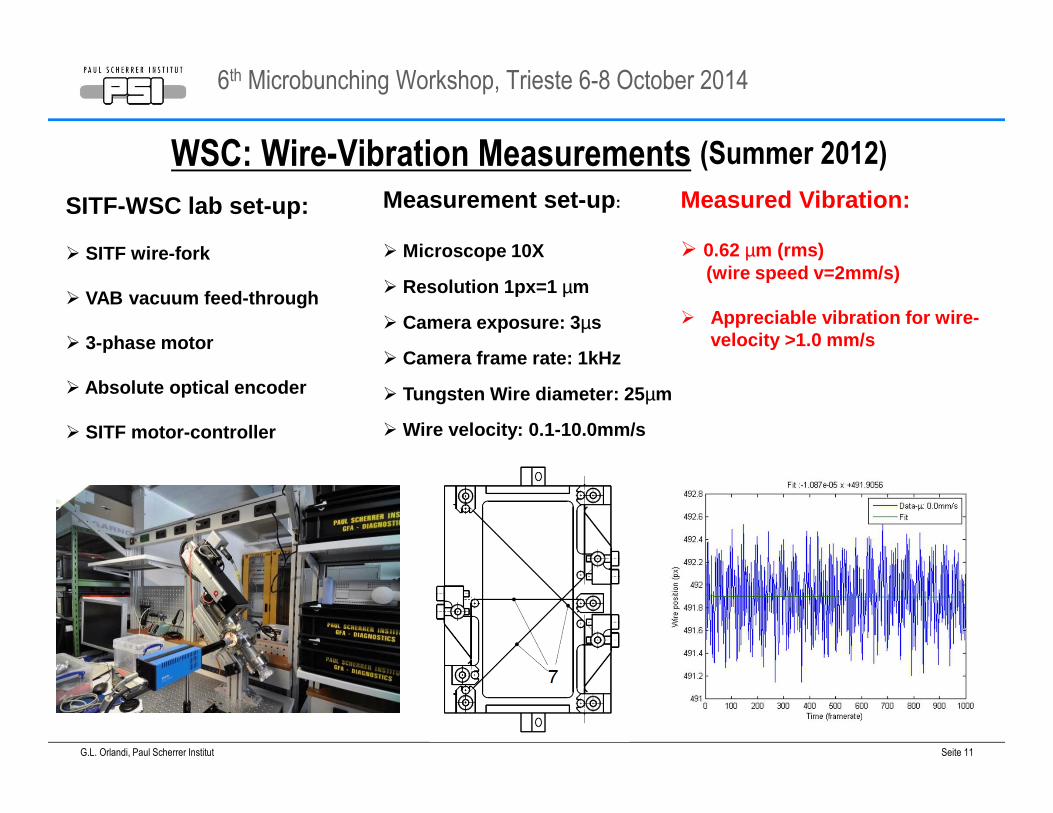
WSC: Wire-Vibration Measurements (Summer 2012)
Measurement set-up :
� Microscope 10X
� Resolution 1px=1 µm
� Camera exposure: 3 µs
� Camera frame rate: 1kHz
� Tungsten Wire diameter: 25 µm
� Wire velocity: 0.1-10.0mm/s
Measured Vibration:
� 0.62 µm (rms) (wire speed v=2mm/s)
� Appreciable vibration for wire-velocity >1.0 mm/s
SITF-WSC lab set-up:
� SITF wire-fork
� VAB vacuum feed-through
� 3-phase motor
� Absolute optical encoder
� SITF motor-controller
6th Microbunching Workshop, Trieste 6-8 October 2014
G.L. Orlandi, Paul Scherrer Institut Seite 12
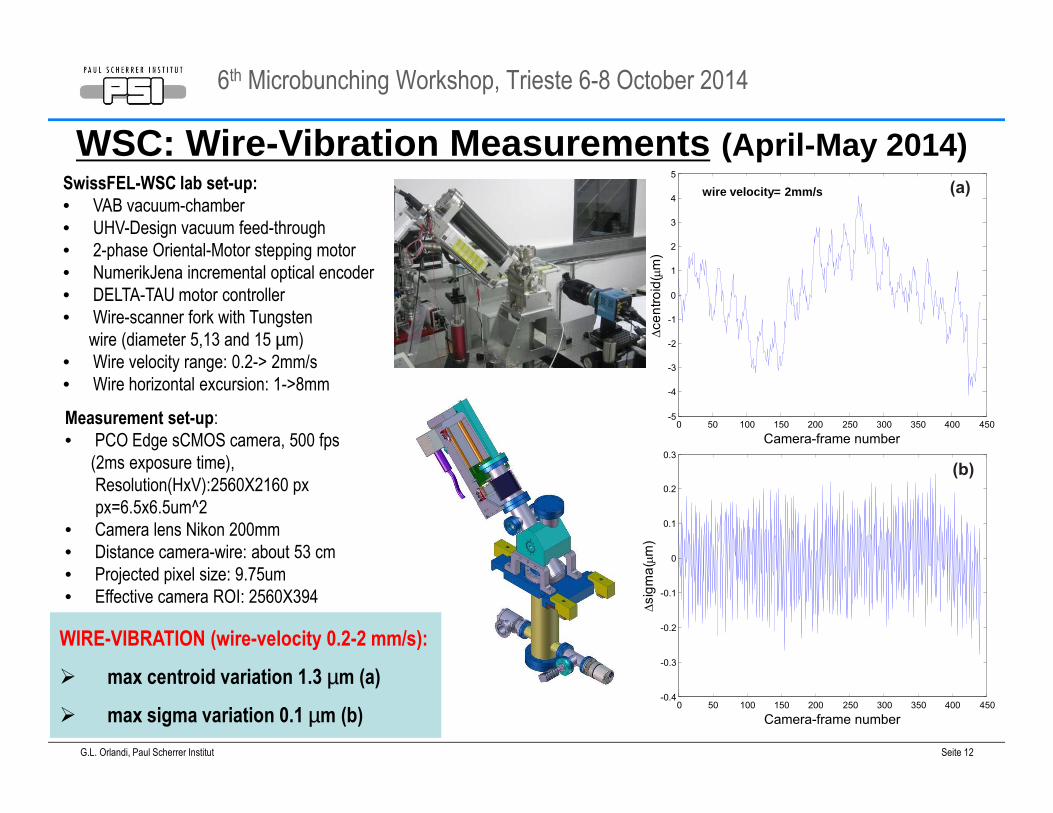
WSC: Wire-Vibration Measurements (April-May 2014)SwissFEL-WSC lab set-up:
• VAB vacuum-chamber
• UHV-Design vacuum feed-through
• 2-phase Oriental-Motor stepping motor
• NumerikJena incremental optical encoder
• DELTA-TAU motor controller
• Wire-scanner fork with Tungsten
wire (diameter 5,13 and 15 µm)
• Wire velocity range: 0.2-> 2mm/s
• Wire horizontal excursion: 1->8mm
Measurement set-up:
• PCO Edge sCMOS camera, 500 fps
(2ms exposure time),
Resolution(HxV):2560X2160 px
px=6.5x6.5um^2
• Camera lens Nikon 200mm
• Distance camera-wire: about 53 cm
• Projected pixel size: 9.75um
• Effective camera ROI: 2560X394
0 50 100 150 200 250 300 350 400 450-5
-4
-3
-2
-1
0
1
2
3
4
5
Camera-frame number
Dce
ntr
oid
(mm
)
0 50 100 150 200 250 300 350 400 450-0.4
-0.3
-0.2
-0.1
0
0.1
0.2
0.3
Camera-frame number
Dsig
ma
(mm
)
(a)
(b)
wire velocity= 2mm/s
WIRE-VIBRATION (wire-velocity 0.2-2 mm/s):
� max centroid variation 1.3 µm (a)
� max sigma variation 0.1 µm (b)
6th Microbunching Workshop, Trieste 6-8 October 2014
G.L. Orlandi, Paul Scherrer Institut Seite 13
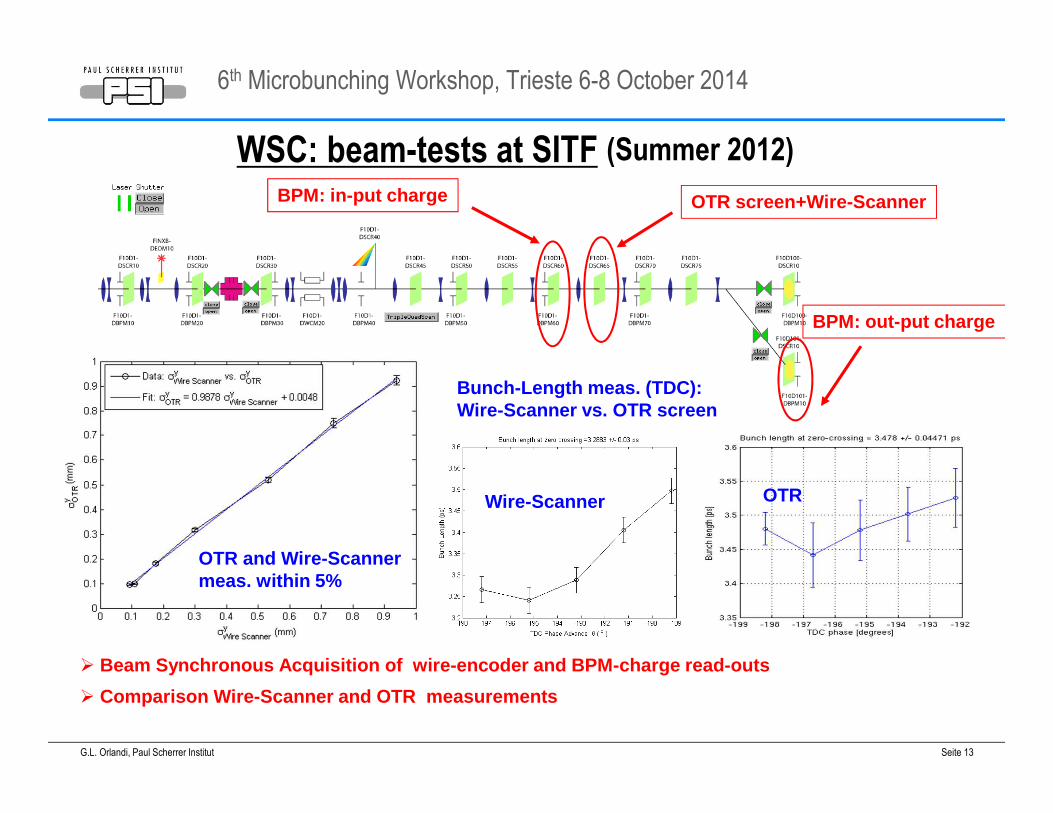
WSC: beam-tests at SITF (Summer 2012)
BPM: in-put charge
BPM: out-put charge
OTR screen+Wire-Scanner
� Beam Synchronous Acquisition of wire-encoder and B PM-charge read-outs
� Comparison Wire-Scanner and OTR measurements
OTR and Wire-Scannermeas. within 5%
Bunch-Length meas. (TDC):Wire-Scanner vs. OTR screen
Wire-Scanner OTR
6th Microbunching Workshop, Trieste 6-8 October 2014
G.L. Orlandi, Paul Scherrer Institut Seite 14
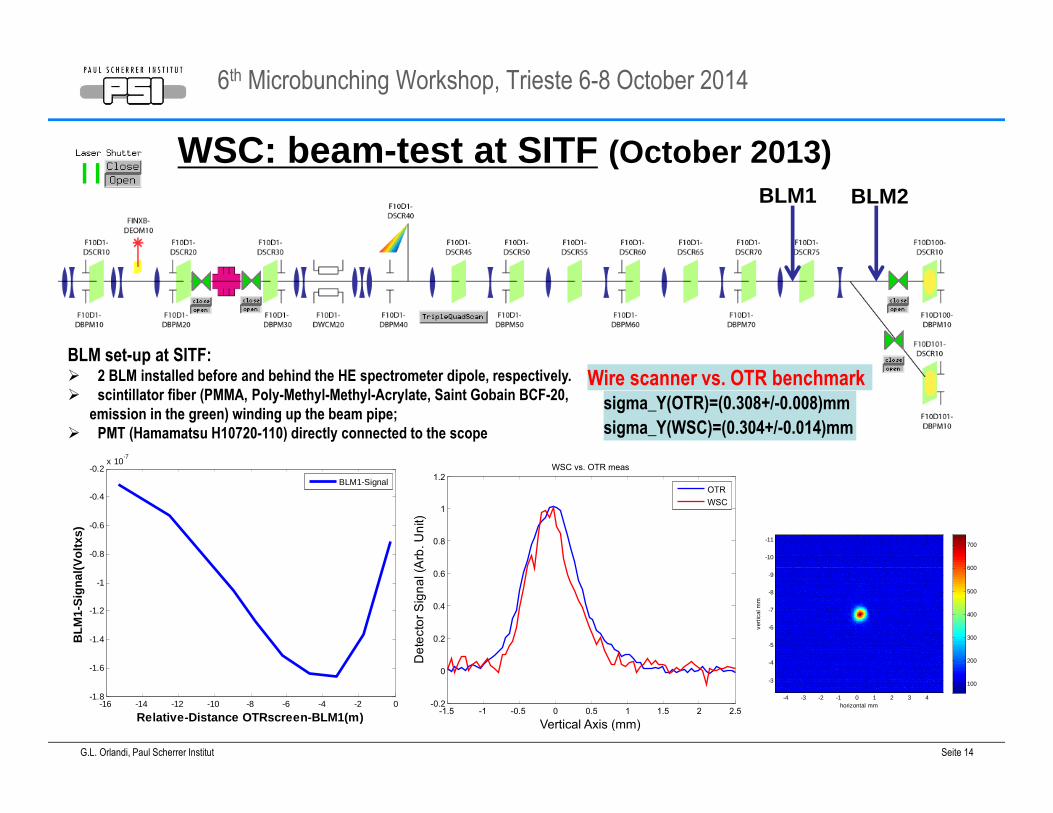
WSC: beam -test at SITF (October 2013)BLM1 BLM2
BLM set-up at SITF: � 2 BLM installed before and behind the HE spectrometer dipole, respectively.
� scintillator fiber (PMMA, Poly-Methyl-Methyl-Acrylate, Saint Gobain BCF-20,
emission in the green) winding up the beam pipe;
� PMT (Hamamatsu H10720-110) directly connected to the scope
-16 -14 -12 -10 -8 -6 -4 -2 0-1.8
-1.6
-1.4
-1.2
-1
-0.8
-0.6
-0.4
-0.2x 10
-7
Relative-Distance OTRscreen-BLM1(m)
BLM
1-S
igna
l(Vol
txs)
BLM1-Signal
horizontal mm
vert
ical
mm
-4 -3 -2 -1 0 1 2 3 4
-11
-10
-9
-8
-7
-6
-5
-4
-3 100
200
300
400
500
600
700
Wire scanner vs. OTR benchmark
-1.5 -1 -0.5 0 0.5 1 1.5 2 2.5-0.2
0
0.2
0.4
0.6
0.8
1
1.2
Vertical Axis (mm)
De
tecto
rS
ign
al(A
rb.U
nit)
WSC vs. OTR meas
OTR
WSC
sigma_Y(OTR)=(0.308+/-0.008)mm
sigma_Y(WSC)=(0.304+/-0.014)mm
6th Microbunching Workshop, Trieste 6-8 October 2014
G.L. Orlandi, Paul Scherrer Institut Seite 15
1e-05
0.0001
0.001
0.01
0.1
1
10
100
0.001 0.01 0.1 1
# pa
rtic
les
per
prim
ary
unit
E(GeV)
all particleselectronsphotons
1e-08
1e-07
1e-06
1e-05
0.0001
0.001
0.01
0.1
1
10
100
0.001 0.01 0.1 1 10#
part
icle
s pe
r pr
imar
y un
itE(GeV)
all particleselectronsphotons
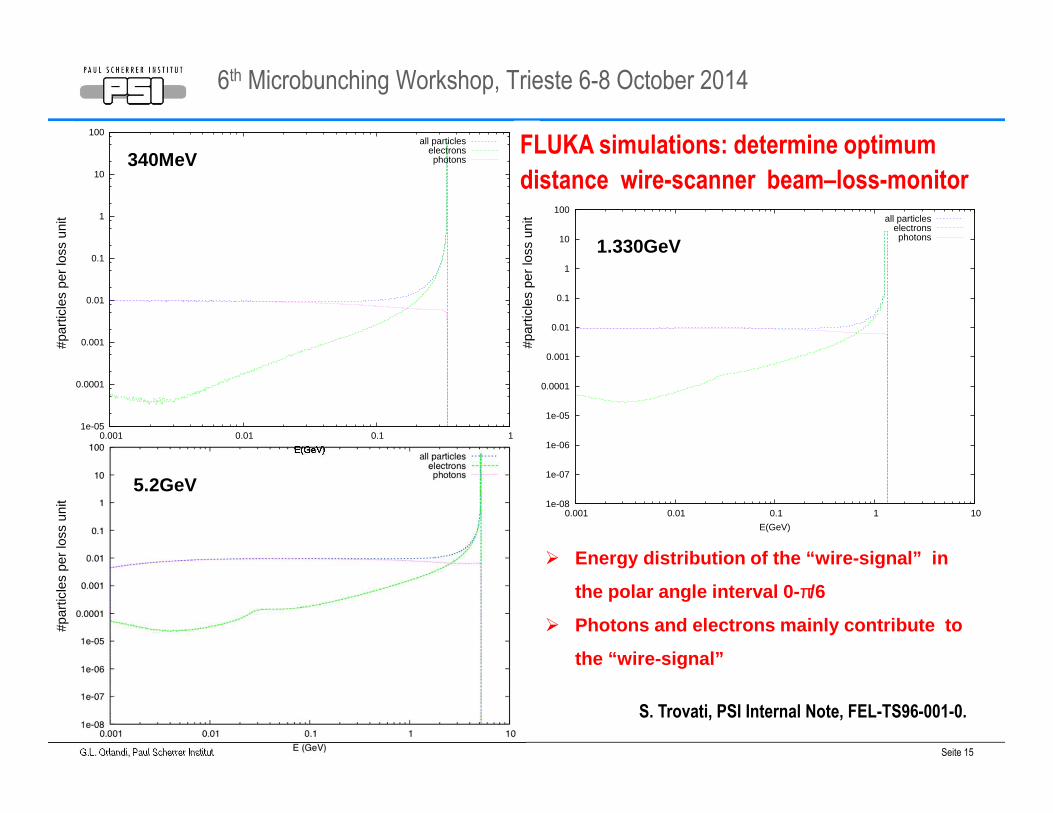
1.330GeV
5.2GeV
� Energy distribution of the “wire-signal” in
the polar angle interval 0- π/6
� Photons and electrons mainly contribute to
the “wire-signal”
#par
ticle
s pe
r lo
ss u
nit
#par
ticle
s pe
r lo
ss u
nit
#par
ticle
s pe
r lo
ss u
nit
340MeV
S. Trovati, PSI Internal Note, FEL-TS96-001-0.
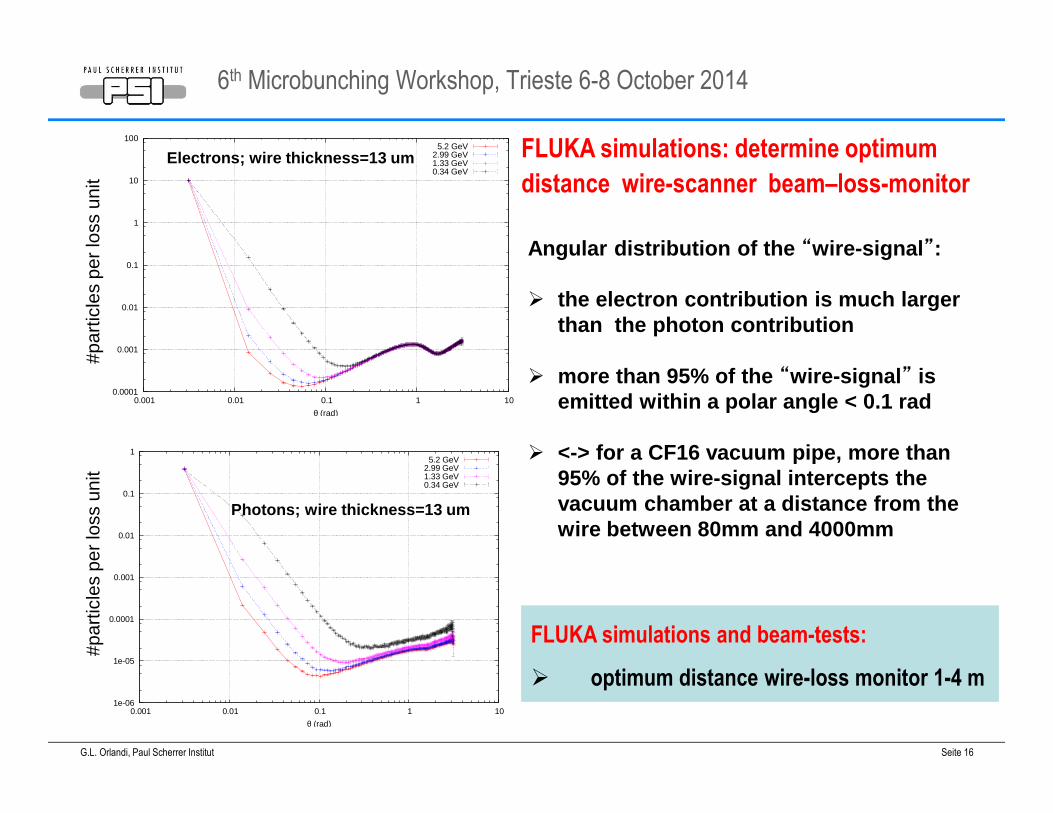
FLUKA simulations: determine optimum
distance wire-scanner beam–loss-monitor
6th Microbunching Workshop, Trieste 6-8 October 2014
G.L. Orlandi, Paul Scherrer Institut Seite 16
0.0001
0.001
0.01
0.1
1
10
100
0.001 0.01 0.1 1 10
# pa
rtic
les
per
unit
prim
ary
θ (rad)
5.2 GeV2.99 GeV1.33 GeV0.34 GeV
Electrons; wire thickness=13 um
1e-06
1e-05
0.0001
0.001
0.01
0.1
1
0.001 0.01 0.1 1 10
# pa
rtic
les
per
unit
prim
ary
θ (rad)
5.2 GeV2.99 GeV1.33 GeV0.34 GeV
Photons; wire thickness=13 um
Angular distribution of the “wire-signal ”:
� the electron contribution is much larger than the photon contribution
� more than 95% of the “wire-signal ” is emitted within a polar angle < 0.1 rad
� <-> for a CF16 vacuum pipe, more than 95% of the wire-signal intercepts the vacuum chamber at a distance from the wire between 80mm and 4000mm
#par
ticle
s pe
r lo
ss u
nit
#par
ticle
s pe
r lo
ss u
nit
FLUKA simulations and beam-tests:
� optimum distance wire-loss monitor 1-4 m
FLUKA simulations: determine optimum
distance wire-scanner beam–loss-monitor
6th Microbunching Workshop, Trieste 6-8 October 2014
G.L. Orlandi, Paul Scherrer Institut Seite 17
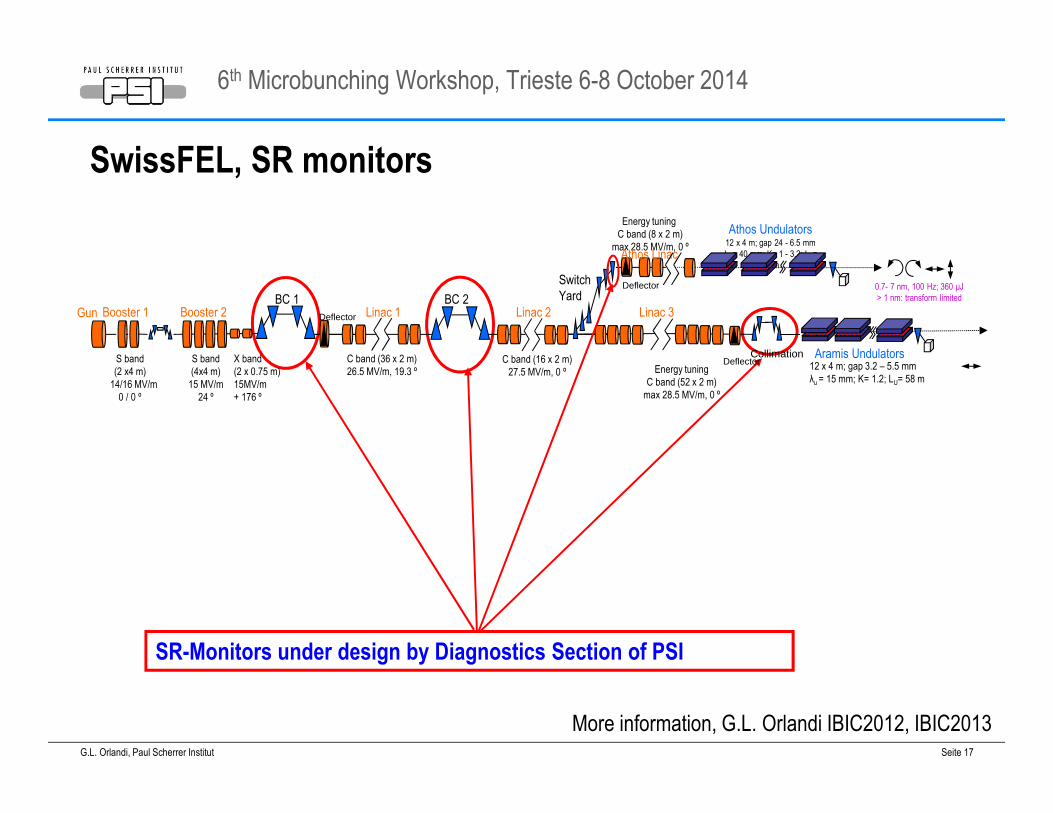
SwissFEL, SR monitors
SR-Monitors under design by Diagnostics Section of PSI
0.7- 7 nm, 100 Hz; 360 µJ
> 1 nm: transform limited
Athos Undulators 12 x 4 m; gap 24 - 6.5 mm
λu = 40 mm; K= 1 - 3.2; LU=
58 m
BC 2Linac 1 Linac 2 Linac 3
Aramis Undulators
Switch
Yard
C band (36 x 2 m)
26.5 MV/m, 19.3 ºC band (16 x 2 m)
27.5 MV/m, 0 º Energy tuning
C band (52 x 2 m)
max 28.5 MV/m, 0 º
12 x 4 m; gap 3.2 – 5.5 mm
λu = 15 mm; K= 1.2; LU= 58 m
S band
(2 x4 m)
14/16 MV/m
0 / 0 º
Gun Booster 1 Booster 2BC 1
S band
(4x4 m)
15 MV/m
24 º
X band
(2 x 0.75 m)
15MV/m
+ 176 º
Energy tuning
C band (8 x 2 m)
max 28.5 MV/m, 0 º
Deflector
Deflector
Collimation
Athos Linac
Deflector
More information, G.L. Orlandi IBIC2012, IBIC2013
6th Microbunching Workshop, Trieste 6-8 October 2014
G.L. Orlandi, Paul Scherrer Institut Seite 18
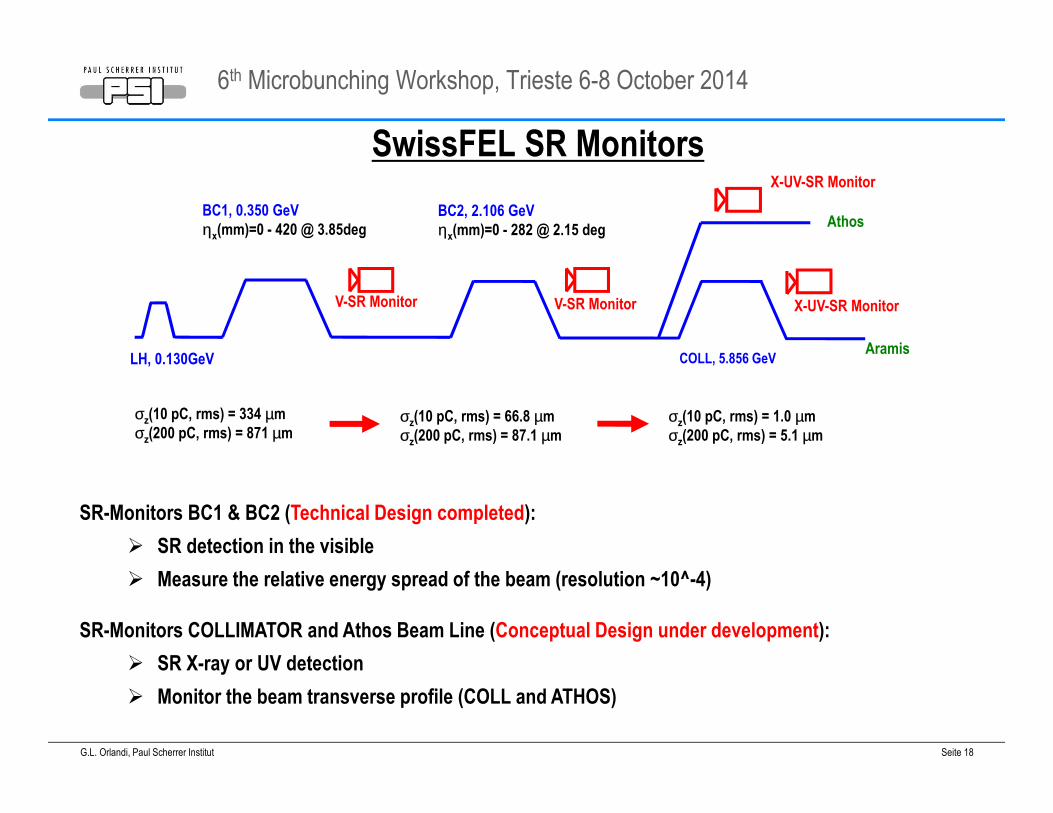
COLL, 5.856 GeV
V-SR Monitor
LH, 0.130GeV
X-UV-SR Monitor
V-SR Monitor
BC1, 0.350 GeV
ηx(mm)=0 - 420 @ 3.85deg
BC2, 2.106 GeV
ηx(mm)=0 - 282 @ 2.15 deg
σz(10 pC, rms) = 334 µm
σz(200 pC, rms) = 871 µmσz(10 pC, rms) = 66.8 µm
σz(200 pC, rms) = 87.1 µm
σz(10 pC, rms) = 1.0 µm
σz(200 pC, rms) = 5.1 µm
X-UV-SR Monitor
Aramis
Athos
SwissFEL SR Monitors
SR-Monitors BC1 & BC2 (Technical Design completed):
� SR detection in the visible
� Measure the relative energy spread of the beam (resolution ~10^-4)
SR-Monitors COLLIMATOR and Athos Beam Line (Conceptual Design under development):
� SR X-ray or UV detection
� Monitor the beam transverse profile (COLL and ATHOS)
6th Microbunching Workshop, Trieste 6-8 October 2014
G.L. Orlandi, Paul Scherrer Institut Seite 19
SwissFEL Bunch-Compressor SR Monitor, Conceptual Design:
� Monitor the beam transverse profile over the entire range of the bunch-compressor bending angle to
determine the beam energy and relative energy spread
� Charge sensitivity range 10-200pC
� Monitor interface with feed-back system (real-time 100Hz) under routine FEL operations to account
for variations of beam energy/relative-energy-spread
� Aramis-phase-1: operation mode @100Hz
� Athos-phase: resolve the 28ns time structure of the two-bunches beam @100HZ.
Two-cameras system under development (beam splitter, internal optics and fast switchable
MCP intensifier).
More information, G.L. Orlandi IBIC2012, IBIC2013
6th Microbunching Workshop, Trieste 6-8 October 2014
G.L. Orlandi, Paul Scherrer Institut Seite 20
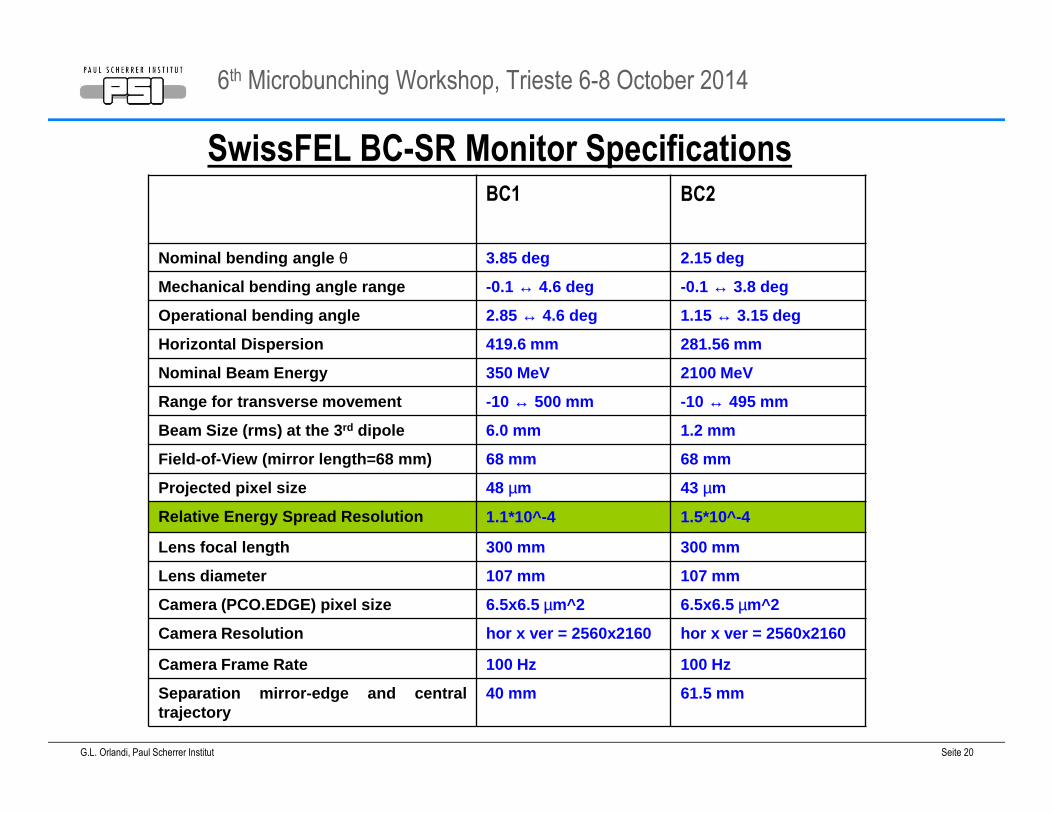
BC1 BC2
Nominal bending angle θ 3.85 deg 2.15 deg
Mechanical bending angle range -0.1 ↔ 4.6 deg -0.1 ↔ 3.8 deg
Operational bending angle 2.85 ↔ 4.6 deg 1.15 ↔ 3.15 deg
Horizontal Dispersion 419.6 mm 281.56 mm
Nominal Beam Energy 350 MeV 2100 MeV
Range for transverse movement -10 ↔ 500 mm -10 ↔ 495 mm
Beam Size (rms) at the 3 rd dipole 6.0 mm 1.2 mm
Field-of-View (mirror length=68 mm) 68 mm 68 mm
Projected pixel size 48 µm 43 µm
Relative Energy Spread Resolution 1.1*10^-4 1.5*10^-4
Lens focal length 300 mm 300 mm
Lens diameter 107 mm 107 mm
Camera (PCO.EDGE) pixel size 6.5x6.5 µm^2 6.5x6.5 µm^2
Camera Resolution hor x ver = 2560x2160 hor x ver = 2560x2160
Camera Frame Rate 100 Hz 100 Hz
Separation mirror-edge and centraltrajectory
40 mm 61.5 mm
SwissFEL BC-SR Monitor Specifications
6th Microbunching Workshop, Trieste 6-8 October 2014
G.L. Orlandi, Paul Scherrer Institut Seite 21
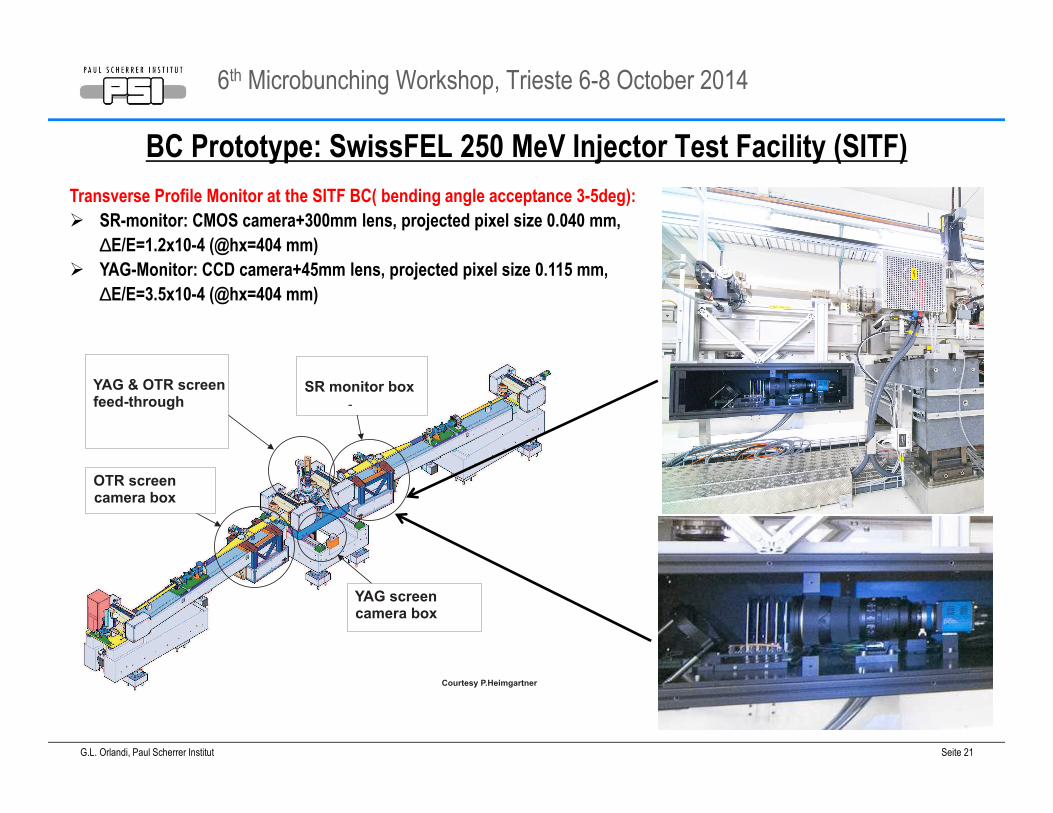
YAG screencamera box
OTR screencamera box
YAG & OTR screenfeed-through
SR monitor box-
Courtesy P.Heimgartner
BC Prototype: SwissFEL 250 MeV Injector Test Facility (SITF)
Transverse Profile Monitor at the SITF BC( bending angle acceptance 3-5deg):
� SR-monitor: CMOS camera+300mm lens, projected pixel size 0.040 mm,
∆E/E=1.2x10-4 (@hx=404 mm)
� YAG-Monitor: CCD camera+45mm lens, projected pixel size 0.115 mm,
∆E/E=3.5x10-4 (@hx=404 mm)
6th Microbunching Workshop, Trieste 6-8 October 2014
G.L. Orlandi, Paul Scherrer Institut Seite 22
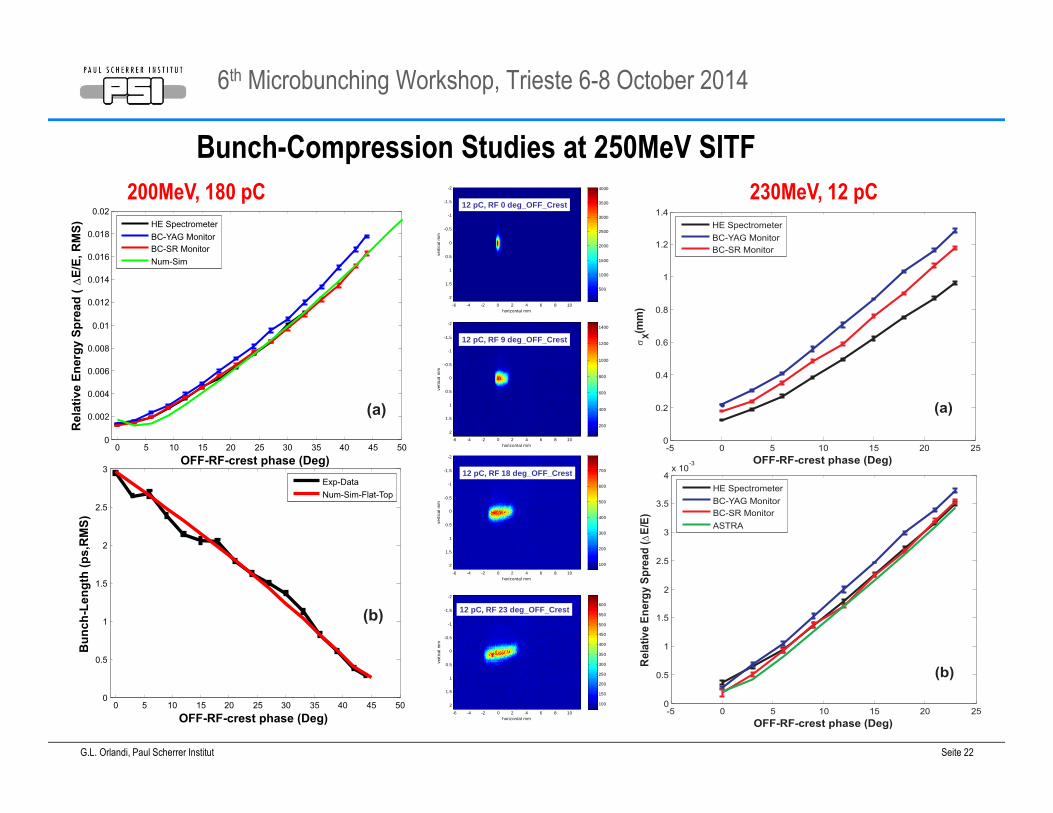
0 5 10 15 20 25 30 35 40 45 500
0.002
0.004
0.006
0.008
0.01
0.012
0.014
0.016
0.018
0.02
OFF-RF-crest phase (Deg)
Rela
tive
En
erg
yS
pre
ad
(D
E/E
,R
MS
) HE Spectrometer
BC-YAG Monitor
BC-SR Monitor
Num-Sim
0 5 10 15 20 25 30 35 40 45 500
0.5
1
1.5
2
2.5
3
OFF-RF-crest phase (Deg)
Bu
nch
-Len
gth
(ps,R
MS
)
Exp-Data
Num-Sim-Flat-Top
(a)
(b)
-5 0 5 10 15 20 250
0.2
0.4
0.6
0.8
1
1.2
1.4
OFF-RF-crest phase (Deg)
sX(m
m)
HE Spectrometer
BC-YAG Monitor
BC-SR Monitor
-5 0 5 10 15 20 250
0.5
1
1.5
2
2.5
3
3.5
4x 10
-3
OFF-RF-crest phase (Deg)
Re
lati
ve
En
erg
yS
pre
ad
(DE
/E)
HE Spectrometer
BC-YAG Monitor
BC-SR Monitor
ASTRA
(a)
(b)
230MeV, 12 pC200MeV, 180 pC
Bunch-Compression Studies at 250MeV SITF
horizontal mm
vert
ical
mm
-6 -4 -2 0 2 4 6 8 10
-2
-1.5
-1
-0.5
0
0.5
1
1.5
2
500
1000
1500
2000
2500
3000
3500
4000
12 pC, RF 0 deg_OFF_Crest
horizontal mm
vert
ical
mm
-6 -4 -2 0 2 4 6 8 10
-2
-1.5
-1
-0.5
0
0.5
1
1.5
2
200
400
600
800
1000
1200
1400
12 pC, RF 9 deg_OFF_Crest
horizontal mm
vert
ical
mm
-6 -4 -2 0 2 4 6 8 10
-2
-1.5
-1
-0.5
0
0.5
1
1.5
2 100
200
300
400
500
600
70012 pC, RF 18 deg_OFF_Crest
horizontal mm
vert
ical
mm
-6 -4 -2 0 2 4 6 8 10
-2
-1.5
-1
-0.5
0
0.5
1
1.5
2 100
150
200
250
300
350
400
450
500
550
60012 pC, RF 23 deg_OFF_Crest
6th Microbunching Workshop, Trieste 6-8 October 2014
G.L. Orlandi, Paul Scherrer Institut Seite 23
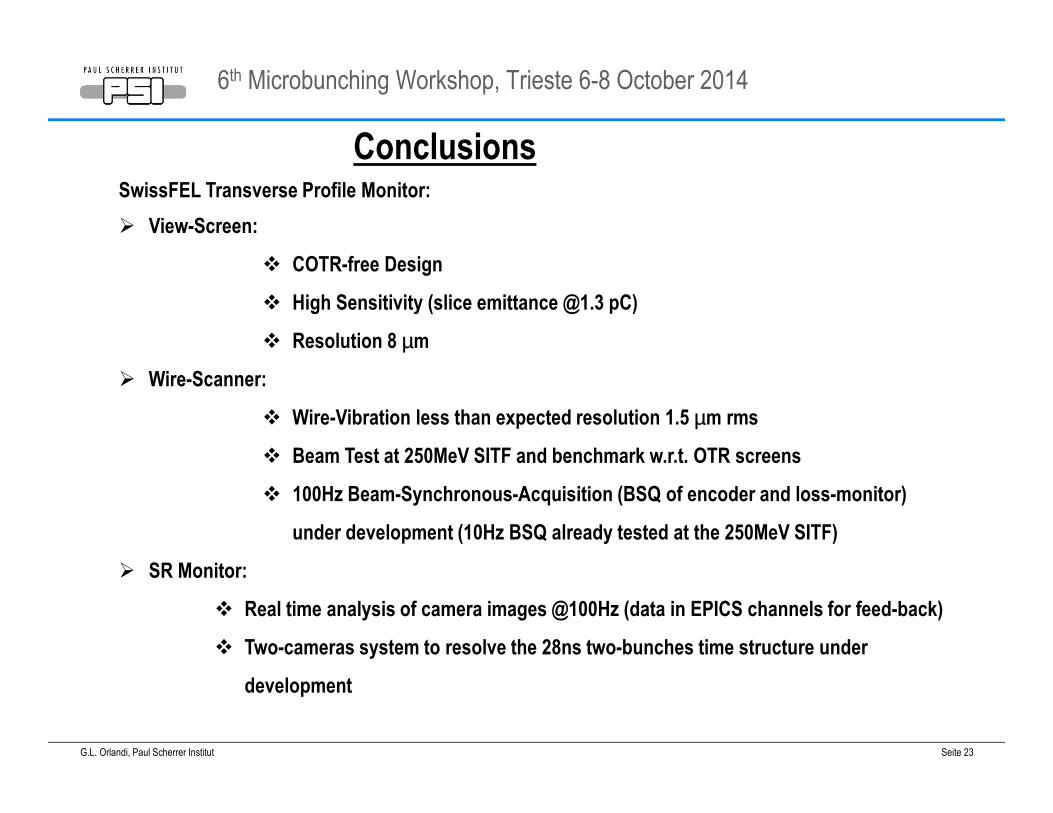
ConclusionsSwissFEL Transverse Profile Monitor:
� View-Screen:
� COTR-free Design
� High Sensitivity (slice emittance @1.3 pC)
� Resolution 8 µm
� Wire-Scanner:
� Wire-Vibration less than expected resolution 1.5 µm rms
� Beam Test at 250MeV SITF and benchmark w.r.t. OTR screens
� 100Hz Beam-Synchronous-Acquisition (BSQ of encoder and loss-monitor)
under development (10Hz BSQ already tested at the 250MeV SITF)
� SR Monitor:
� Real time analysis of camera images @100Hz (data in EPICS channels for feed-back)
� Two-cameras system to resolve the 28ns two-bunches time structure under
development

6th Microbunching Workshop, Trieste 6-8 October 2014
G.L. Orlandi, Paul Scherrer Institut Seite 24
Thanks to
M. Baldinger
H. Brands
P. Heimgartner
M. Heiniger
R. Ischebeck
C. Ozkan
V. Schlott
L. Schulz
S. Trovati
P. Valitutti
…and thank you for your attention...