Embed Size (px)
DESCRIPTION
Site-Specific Modeling in the Context of the OSWER Guidance?. OSWER Guidance. Paul Johnson, Ph.D. Lilian Abreu Ph.D. Candidate Department of Civil and Environmental Engineering Ira A. Fulton School of Engineering. OSWER Guidance (11/29/02). Tier 3: Site-Specific Pathway Assessment - PowerPoint PPT Presentation
Citation preview
The Ira A. Fulton School of Engineering Arizona State University
Paul Johnson, Ph.D. Lilian Abreu Ph.D. CandidateDepartment of Civil and Environmental EngineeringIra A. Fulton School of Engineering
Site-Specific Modeling in the Context of the OSWER Guidance?
OSWER Guidance
The Ira A. Fulton School of Engineering Arizona State University
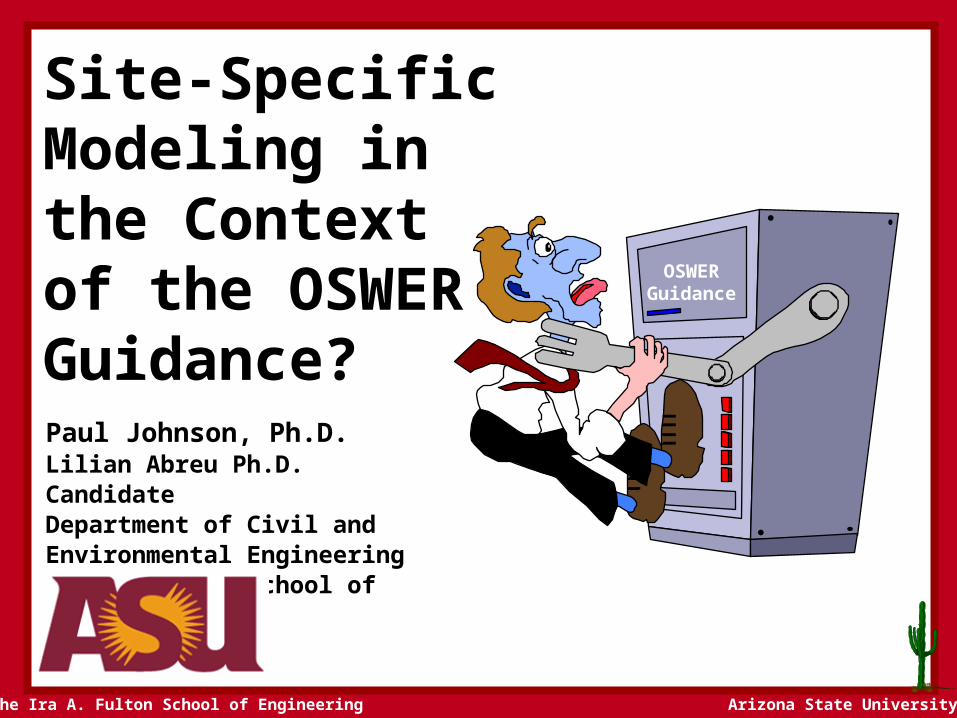
Tier 3: Site-Specific Pathway Assessment“Modeling is considered to be useful for determining which combination of complex factors (e.g., soil type, depth to groundwater, building characteristics, etc.) lead to the greatest impact and, consequently, aid in the selection of buildings to be sampled. It is recommended that sampling of sub-slab or crawlspace vapor concentrations and/or sampling of indoor air concentrations be conducted before a regulator makes a final decision…”
OSWER Guidance (11/29/02)
The Ira A. Fulton School of Engineering Arizona State University
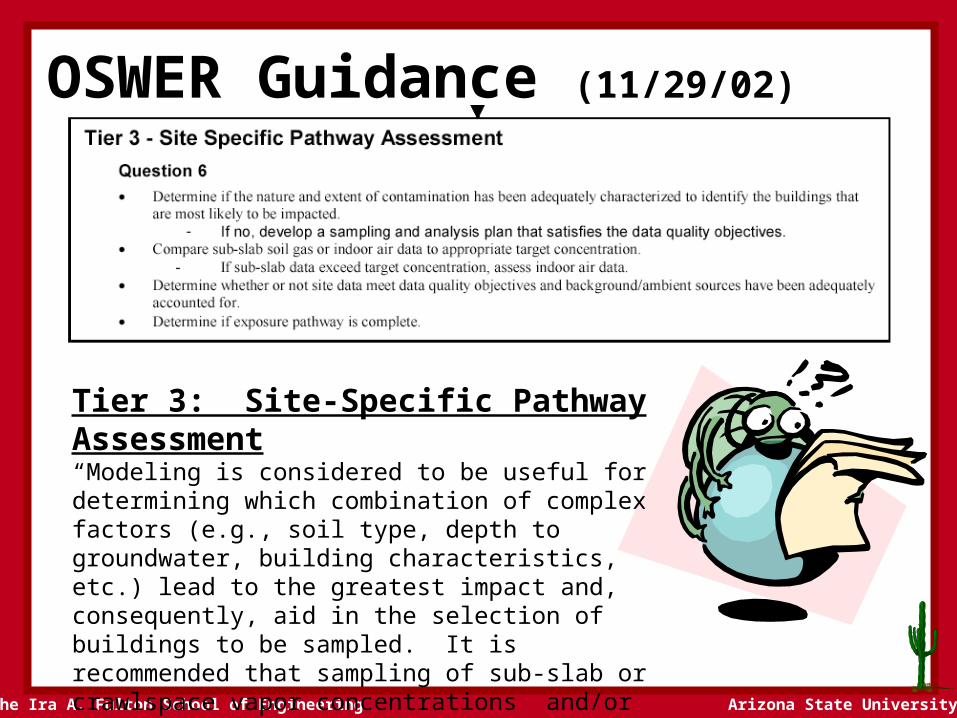
Tier 3: Site-Specific Pathway Assessment - Issues• Why are you limited to near-foundation (e.g., sub-slab) soil gas
data in Tier 3, when you can use soil gas data at any depth or groundwater data in Tier 2?
• Why is semi-site-specific J&E modeling used in Tier 2 to assess impacts, but site-specific J&E modeling is not allowed in Tier 3?
• If you allow site-specific modeling to decide on a subset of buildings does not need to be monitored - aren’t you using it to screen out sites?
• If you could do site-specific modeling in Tier 3 - who is qualified to perform it and who is qualified to review the output?
• Future use scenarios/no building currently present?
OSWER Guidance (11/29/02)
The Ira A. Fulton School of Engineering Arizona State University
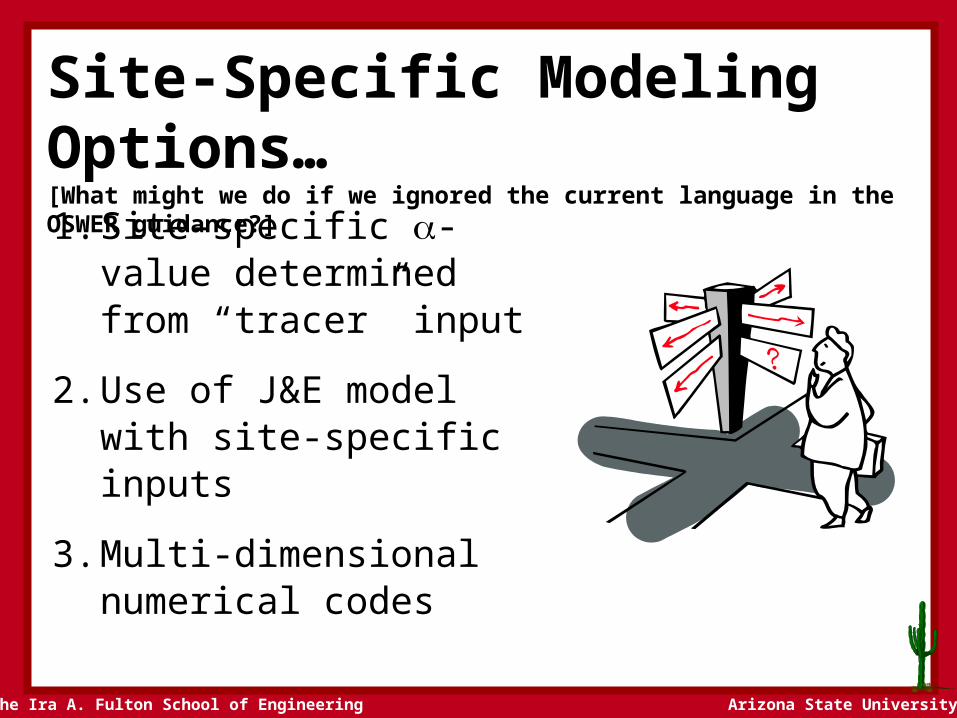
Site-Specific Modeling Options…[What might we do if we ignored the current language in the OSWER guidance?]
1. Site-specific -value determined from “tracer” input
2. Use of J&E model with site-specific inputs
3. Multi-dimensional numerical codes

The Ira A. Fulton School of Engineering Arizona State University
Determination of, and use of, a site-specific -value
• measure soil gas and indoor concentration of tracer (a conservative chemical not expected to be confounded by ambient or indoor air background sources; radon, 1,1 DCE, etc.)
• Derive site-specific -value • Estimation indoor air
concentrations for chemicals of concern using that site-specific -value
Option #1
The Ira A. Fulton School of Engineering Arizona State University
enclosed space
vapor migration
Diffusion [pseudo-
steady state]
Well-Mixed
Source[steady or transient]
Vapor Source
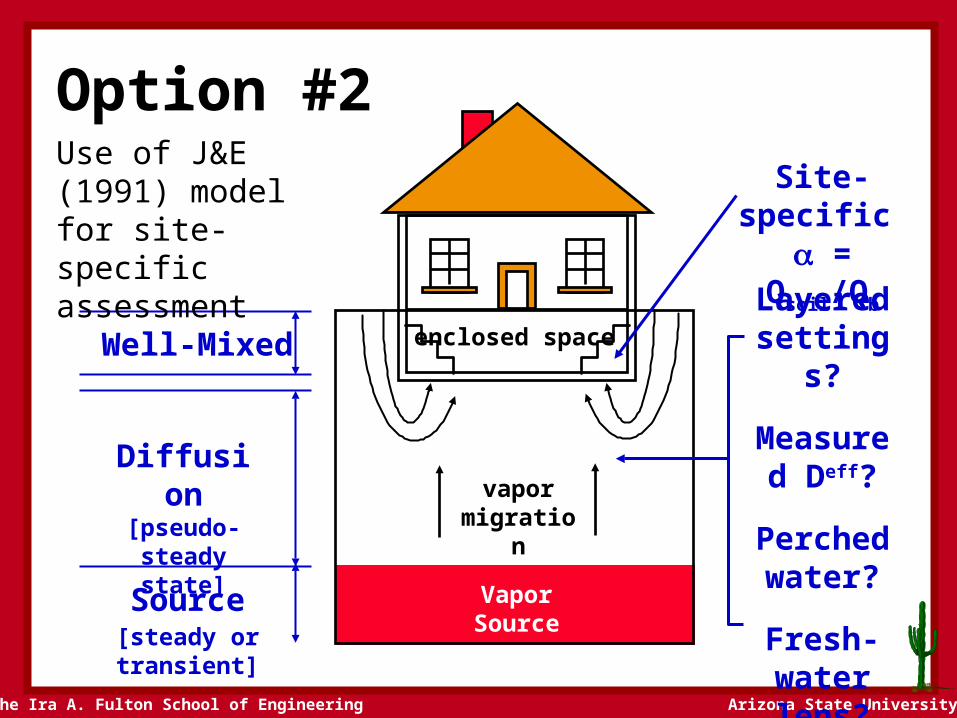
Use of J&E (1991) model for site-specific assessment
Option #2
Layered settings?
Measured Deff?
Perched water?
Fresh-water lens?
Site-specific =
Qsoil/Qb
The Ira A. Fulton School of Engineering Arizona State University
A exp B
exp B A AC
exp B 1
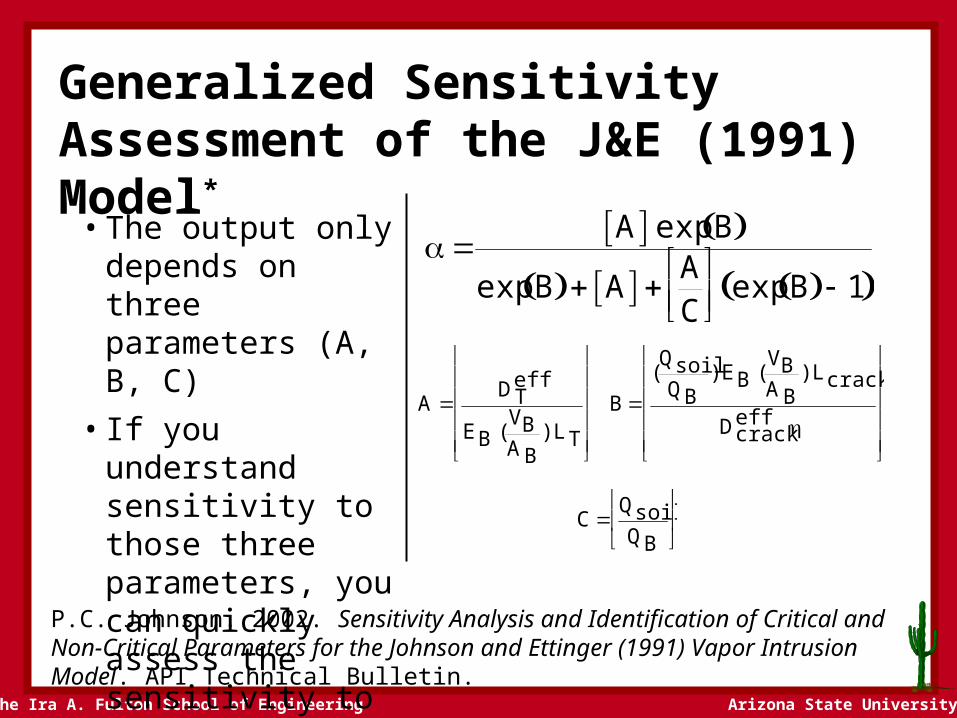
Generalized Sensitivity Assessment of the J&E (1991) Model*
• The output only depends on three parameters (A, B, C)
• If you understand sensitivity to those three parameters, you can quickly assess the sensitivity to any specific input.
P.C. Johnson. 2002. Sensitivity Analysis and Identification of Critical and Non-Critical Parameters for the Johnson and Ettinger (1991) Vapor Intrusion Model. API Technical Bulletin.
A DT
eff
EB (VBAB
) LT
B (QsoilQB
) EB (VBAB
) Lcrack
Dcrackeff
C QsoilQB
The Ira A. Fulton School of Engineering Arizona State University
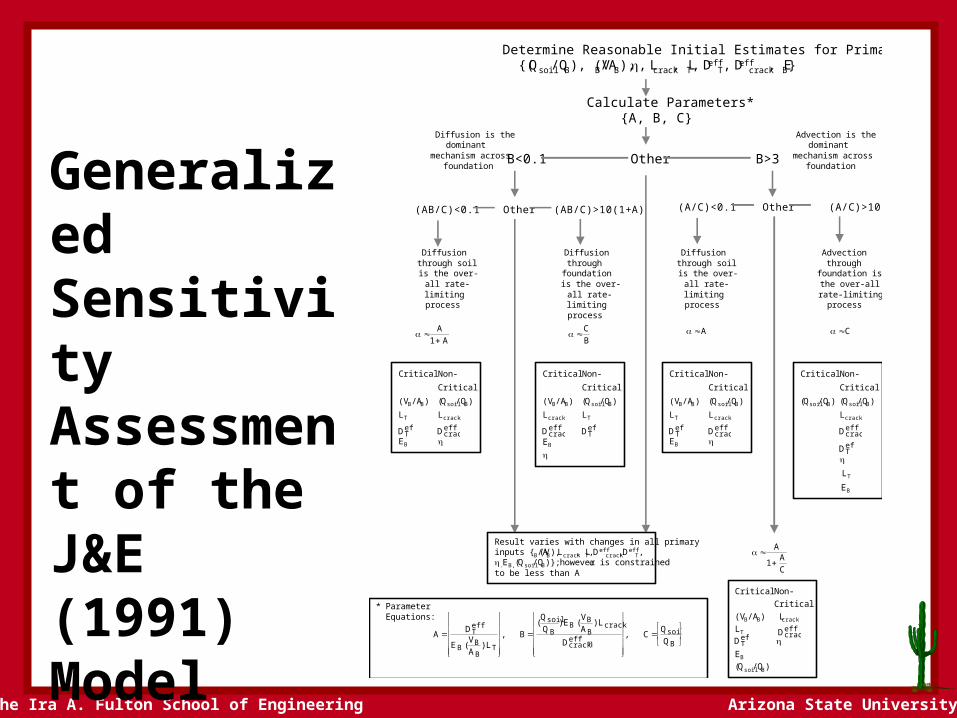
Determine Reasonable Initial Estimates for Primary Inputs{(Qsoil/QB), (VB/AB), , Lcrack, LT, Deff
T, Deffcrack, EB}
Calculate Parameters* {A, B, C}
B<0.1 Other B>3
(AB/C)<0.1
Diffusion is thedominant
mechanism acrossfoundation
Advection is thedominant
mechanism acrossfoundation
Diffusionthrough soilis the over-
all rate-limitingprocess
(AB/C)>10(1+A)Other
Diffusionthrough
foundationis the over-
all rate-limitingprocess
(A/C)<0.1
Diffusionthrough soilis the over-
all rate-limitingprocess
(A/C)>10Other
Advectionthrough
foundation isthe over-allrate-limiting
process
Critical Non-Critical
(VB/AB) (Qsoil/QB)LT Lcrack
EB
Critical Non-Critical
(VB/AB) (Qsoil/QB)Lcrack LT
EB
Critical Non-Critical
(VB/AB) (Qsoil/QB)LT Lcrack
EB
Critical Non-Critical
(Qsoil/QB) (Qsoil/QB)Lcrack
LT
EB
Critical Non-Critical
(VB/AB) Lcrack
LT
EB
(Qsoil/QB)
Result varies with changes in all primaryinputs { (VB/AB), Lcrack, LT, Deff
crack, DeffT,
. EB, (Qsoil/QB)}; however is constrainedto be less than A
A
1 A
DTeff
Dcrackeff
DTeff
Dcrackeff
DTeff
Dcrackeff
Dcrackeff
DTeff
Dcrackeff
DTeff
CB
C
A
1 AC
A
A DTeff
E B ( VBAB
) LT
, B (Qsoil
QB) EB ( VB
AB) L crack
Dcrackeff
, C QsoilQB
* ParameterEquations:
Generalized Sensitivity Assessment of the J&E (1991) Model
The Ira A. Fulton School of Engineering Arizona State University
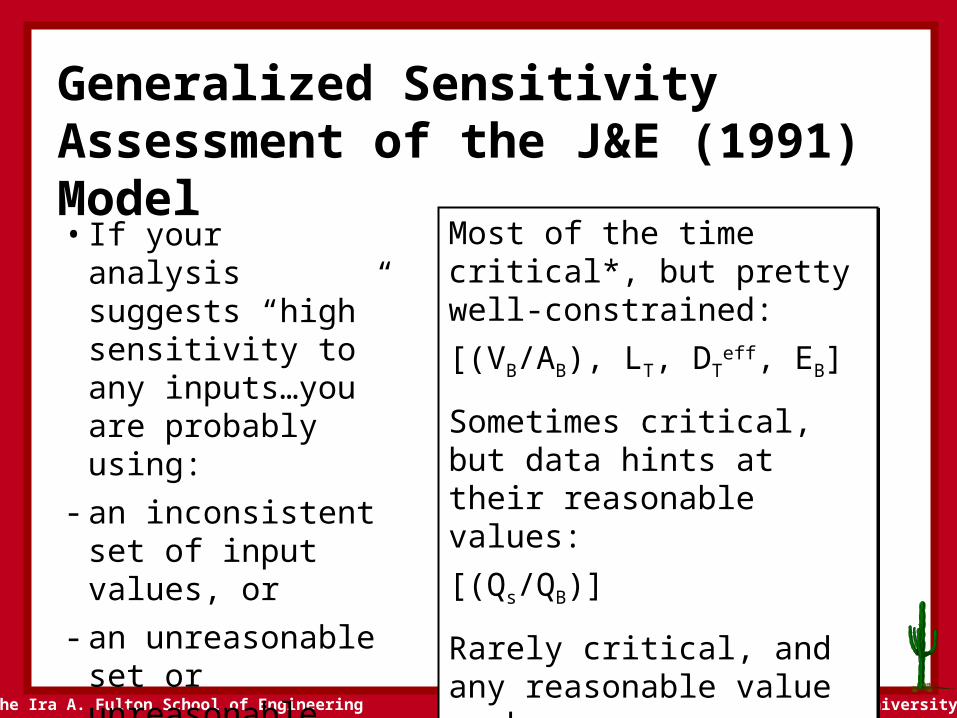
Generalized Sensitivity Assessment of the J&E (1991) Model
• If your analysis suggests “high” sensitivity to any inputs…you are probably using:
- an inconsistent set of input values, or
- an unreasonable set or unreasonable range of input values
Most of the time critical*, but pretty well-constrained:[(VB/AB), LT, DT
eff, EB]
Sometimes critical, but data hints at their reasonable values:[(Qs/QB)]
Rarely critical, and any reasonable value works:[, Lcrack, Dcrack
eff]
The Ira A. Fulton School of Engineering Arizona State University
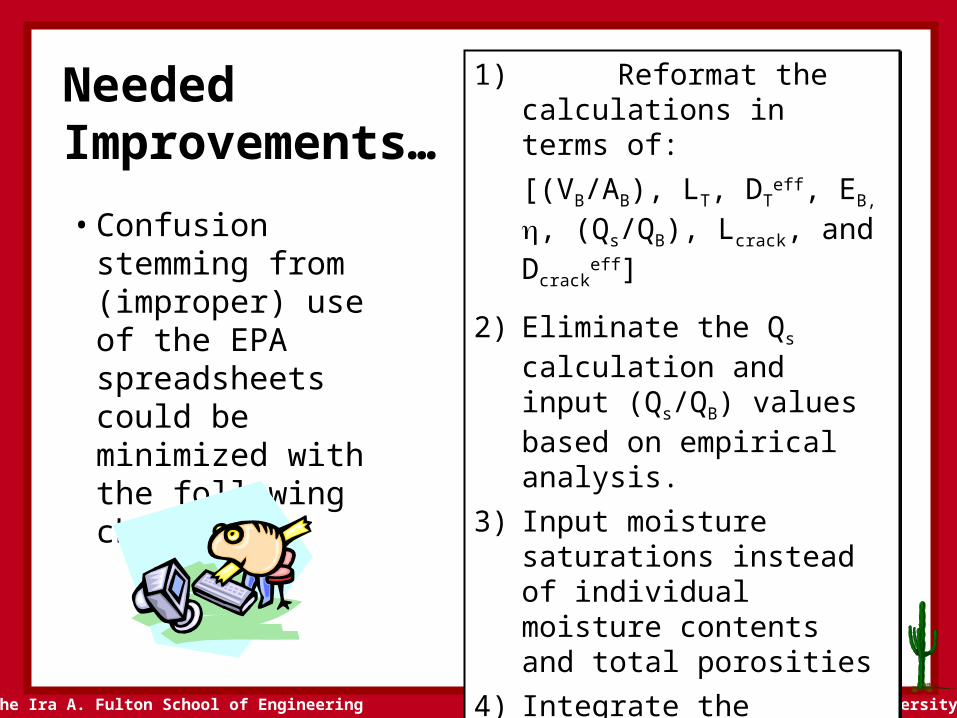
Needed Improvements…• Confusion stemming
from (improper) use of the EPA spreadsheets could be minimized with the following changes:
1) Reformat the calculations in terms of:[(VB/AB), LT, DT
eff, EB, , (Qs/QB), Lcrack, and Dcrack
eff]
2) Eliminate the Qs calculation and input (Qs/QB) values based on empirical analysis.
3) Input moisture saturations instead of individual moisture contents and total porosities
4) Integrate the spreadsheet with the graphical flowchart for identifying critical parameters
5) Constrain users to reasonable ranges and combinations of inputs…
The Ira A. Fulton School of Engineering Arizona State University
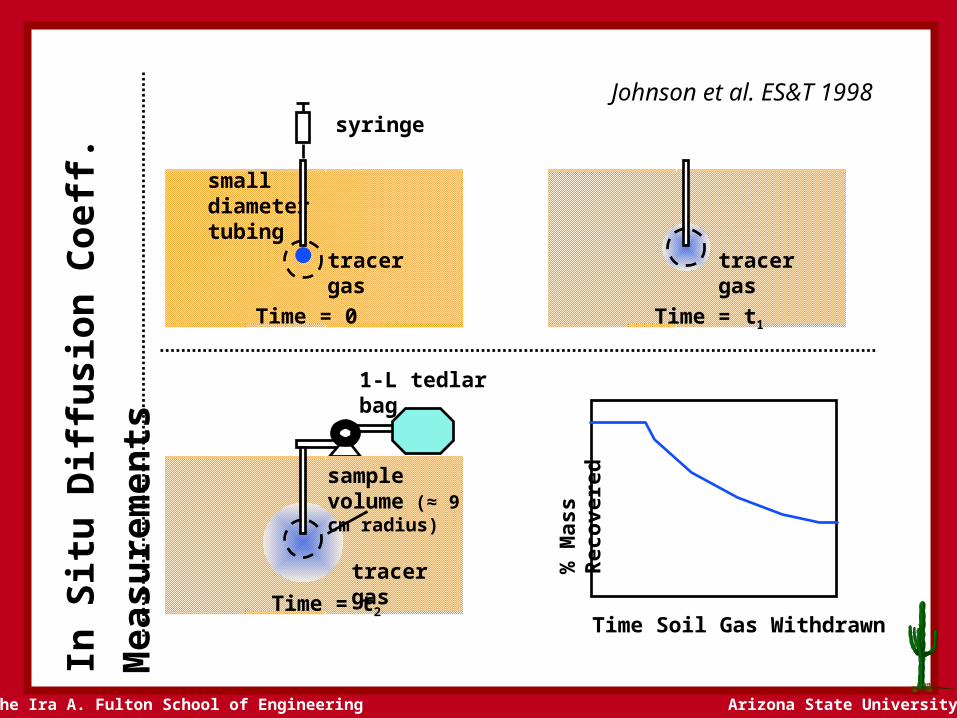
small diameter tubing
In S
itu D
iffus
ion
Coe
ff. M
easu
rem
ents
syringe
tracer gas tracer gas
tracer gas
sample volume (≈ 9 cm radius)
1-L tedlar bag
Time = 0 Time = t1
Time = t2Time Soil Gas Withdrawn
% M
ass R
ecov
ered
Johnson et al. ES&T 1998
The Ira A. Fulton School of Engineering Arizona State University
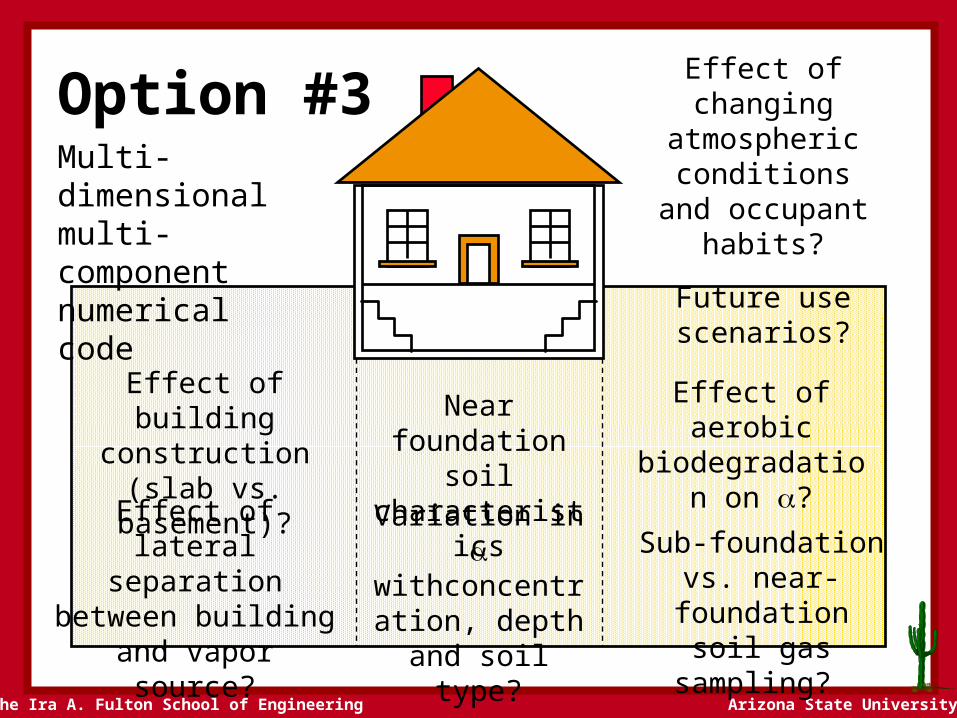
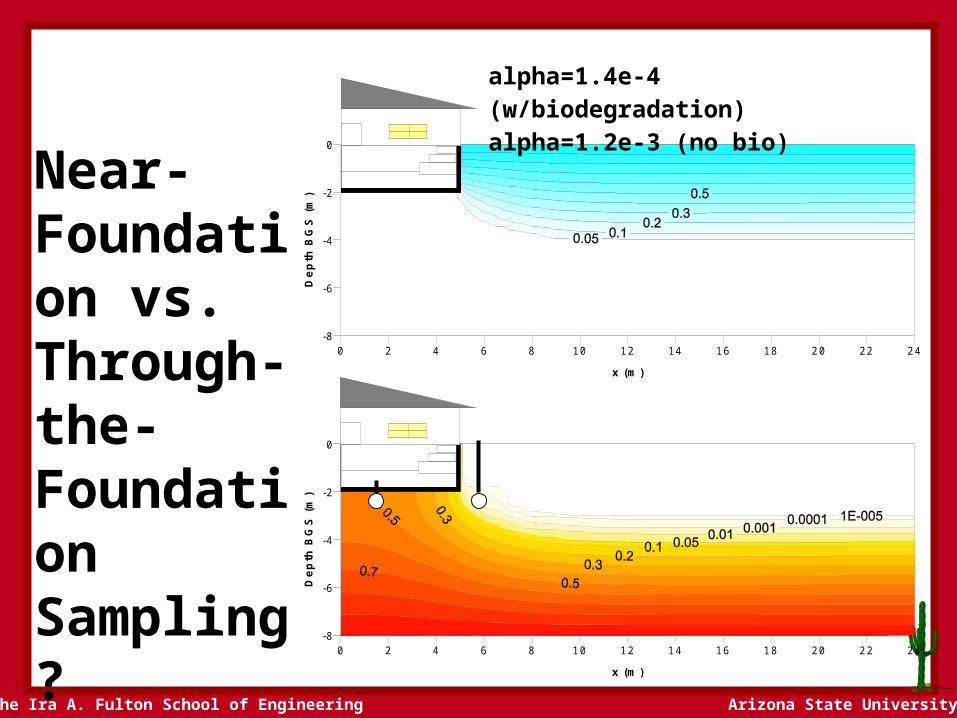
Effect of lateral separation between building and vapor
source?
Effect of building construction (slab vs.
basement)?
Sub-foundation vs. near-foundation soil
gas sampling?
Effect of aerobic biodegradation on
?
Near foundation soil characteristics
Variation in withconcentration,
depth and soil type?
Multi-dimensional multi-component numerical code
Option #3 Effect of changing atmospheric
conditions and occupant habits?
Future use scenarios?
The Ira A. Fulton School of Engineering Arizona State University
0 10 20 30 40 50 60 70 80 90 100x (m)
-8
-6
-4
-2
0
Dept
h BG
S (m
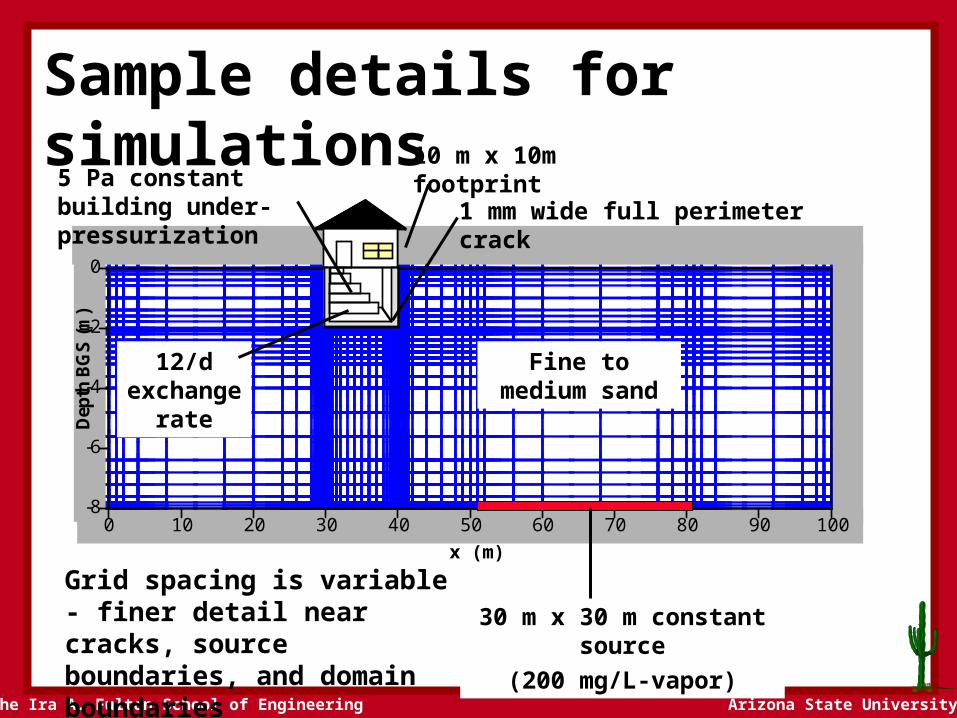
)Sample details for simulations
Grid spacing is variable - finer detail near cracks, source boundaries, and domain boundaries
10 m x 10m footprint
30 m x 30 m constant source(200 mg/L-vapor)
Fine to medium sand
5 Pa constant building under-pressurization 1 mm wide full perimeter crack
12/d exchange
rate

The Ira A. Fulton School of Engineering Arizona State University
A Sample Pressure Field…
Symmetrical Simulation - cross-section through plane of symmetry
The Ira A. Fulton School of Engineering Arizona State University
0 10 20 30 40 50 60 70 80 90 100
x (m )
-8
-6
-4
-2
0
Dep
th B
GS
(m)
0.0001
0 10 20 30 40 50 60 70 80 90 100
x (m )
0
10
20
30
40
50
60
70
y (m
)
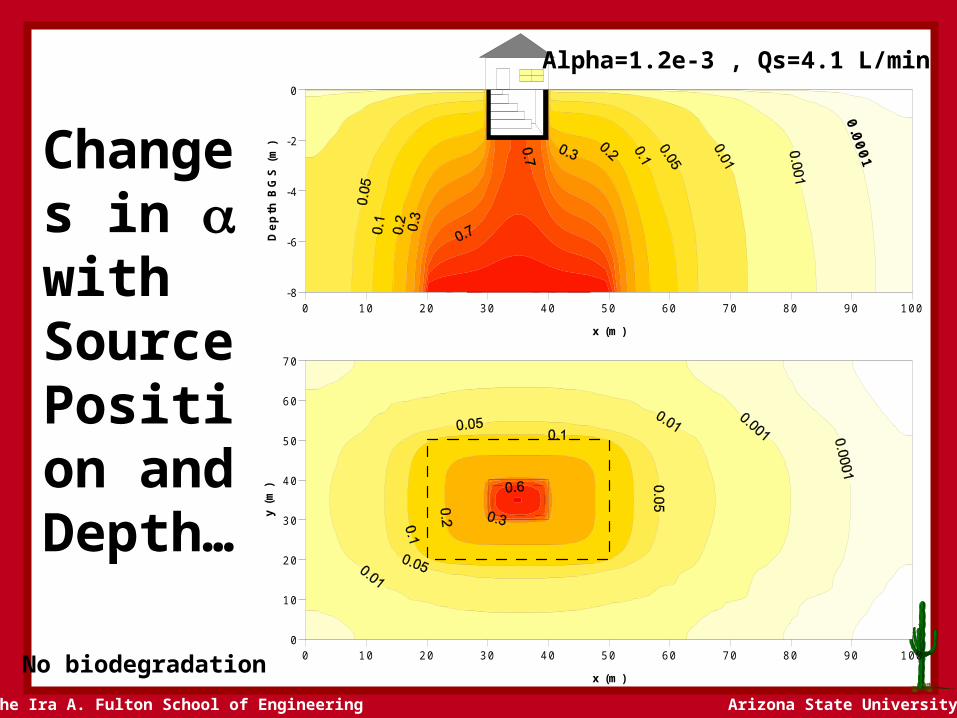
Changes in with Source Position and Depth…
No biodegradation
Alpha=1.2e-3 , Qs=4.1 L/min

The Ira A. Fulton School of Engineering Arizona State University
0 10 20 30 40 50 60 70 80 90 100
x (m )
-8
-6
-4
-2
0
Dep
th B
GS
(m)
0 10 20 30 40 50 60 70 80 90 100
x (m )
0
10
20
30
40
50
60
70
y (m
)
Changes in with Source Position and Depth…
No biodegradation
Alpha=9.3e-6 , Qs=4.1 L/min
The Ira A. Fulton School of Engineering Arizona State University
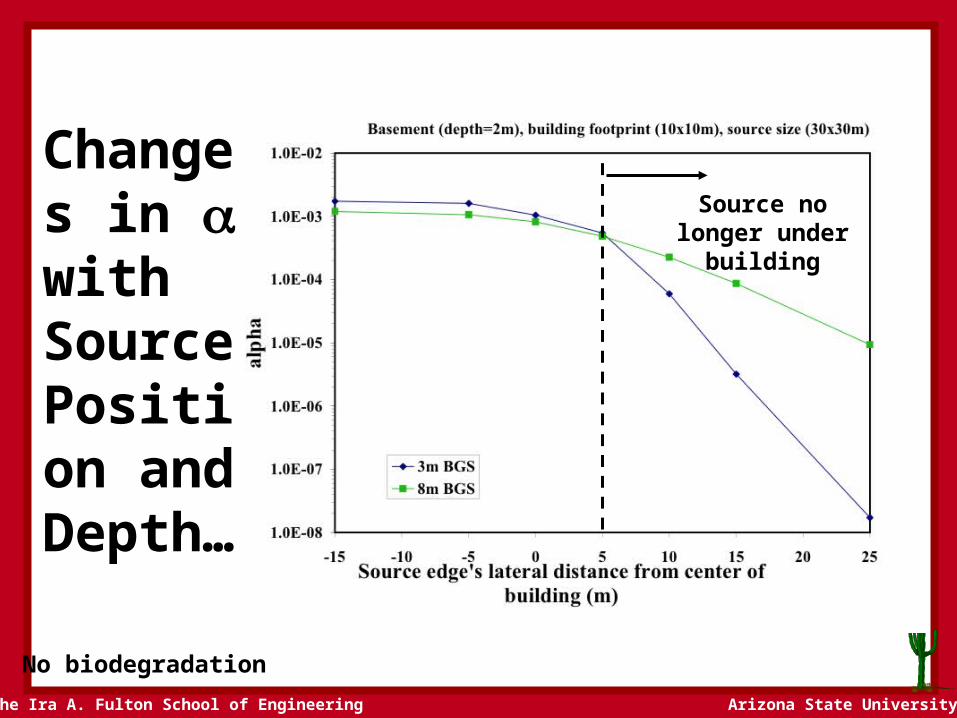
No biodegradation
Changes in with Source Position and Depth…
Source no longer under building
The Ira A. Fulton School of Engineering Arizona State University
0 2 4 6 8 10 12 14 16 18 20 22 24
x (m )
-8
-6
-4
-2
0
Dep
th B
GS
(m)
0 . 1
0 . 9
0 2 4 6 8 10 12 14 16 18 20 22 24
x (m )
-8
-6
-4
-2
0
Dep
th B
GS
(m)
0 . 1
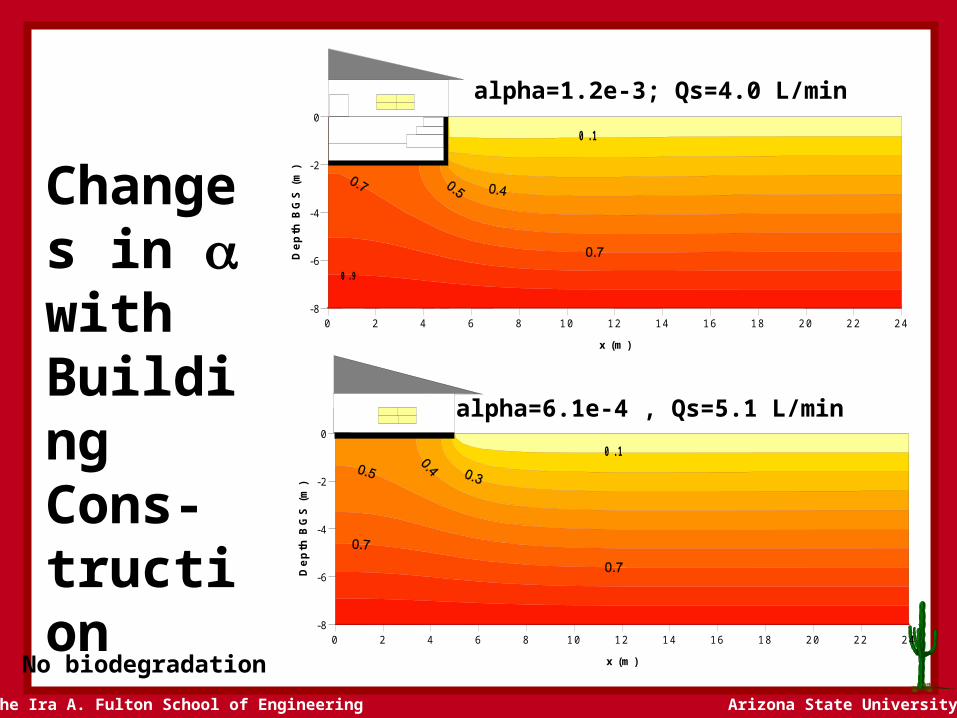
alpha=1.2e-3; Qs=4.0 L/min
alpha=6.1e-4 , Qs=5.1 L/min
Changes in with Building Cons-truction
No biodegradation
The Ira A. Fulton School of Engineering Arizona State University
0 2 4 6 8 10 12 14 16 18 20 22 24
x (m )
-8
-6
-4
-2
0
Dep
th B
GS
(m)
0 2 4 6 8 10 12 14 16 18 20 22 24
x (m )
-8
-6
-4
-2
0
Dep
th B
GS
(m)Near-
Foundation vs. Through-the-Foundation Sampling?
alpha=1.4e-4 (w/biodegradation)alpha=1.2e-3 (no bio)

The Ira A. Fulton School of Engineering Arizona State University
0 2 4 6 8 10 12 14 16 18 20 22 24
x (m)
-18
-16
-14
-12
-10
-8
-6
-4
-2
0
Dep
th B
GS
(m)
0 2 4 6 8 10 12 14 16 18 20 22 24
x (m)
-18
-16
-14
-12
-10
-8
-6
-4
-2
0
Dep
th B
GS
(m)0.001
1E-05
Changes in with Depth with Bio-decay
alpha=1.3e-18 (w/biodegradation)alpha=5.7e-4 (no bio)

The Ira A. Fulton School of Engineering Arizona State University
In Progress…1. Manuscript #1 – Model development and application to
study of lateral distance and depths vs. impacts.2. Manuscript #2 – Effects of aerobic biodegradation on
impacts (source strength, depth, distance)3. Study of role of sub-slab characteristics, pressure
fluctuations, wind effects, etc.4. Use of model to develop nomograph identifying sites where
impacts may not be significant, based on• Building footprint• Depth to vapor source• Vapor source strength
The Ira A. Fulton School of Engineering Arizona State University
Final Thoughts…1. Draft OSWER Guidance is inconsistent with respect
to the role of modeling for site-specific pathway assessment (and the role of modeling in general..)
2. If the role of site-specific modeling is expanded, then we need to be prepared to address:
• What options are allowed?
• What data is required?
• How to ensure that the use of site-specific modeling is technically credible?

The Ira A. Fulton School of Engineering Arizona State University
Discussion
The Ira A. Fulton School of Engineering Arizona State University
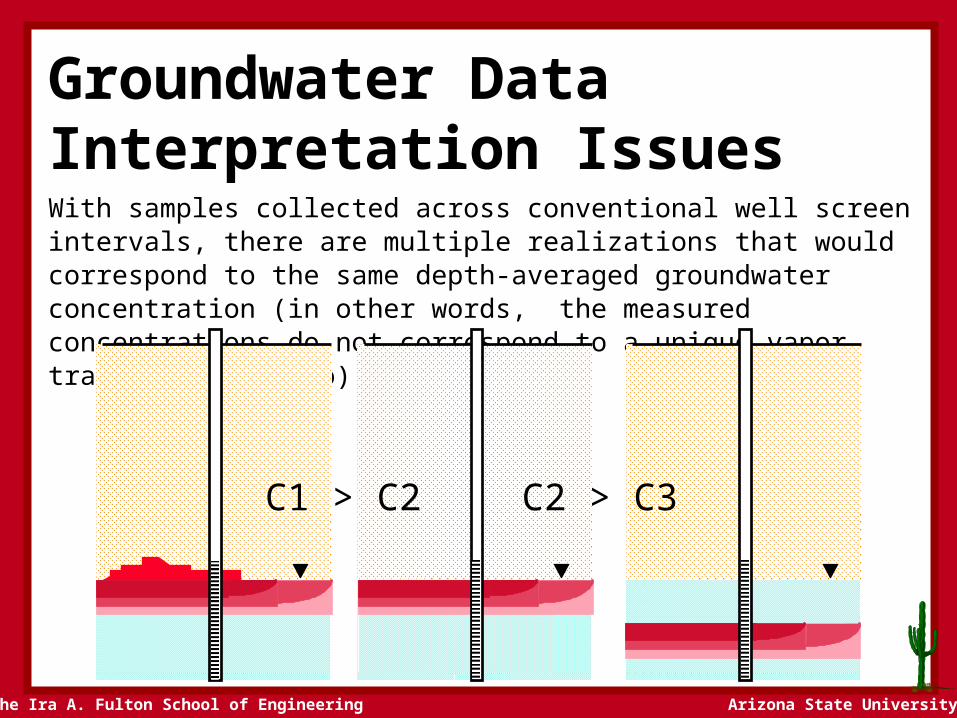
Groundwater Data Interpretation IssuesWith samples collected across conventional well screen intervals, there are multiple realizations that would correspond to the same depth-averaged groundwater concentration (in other words, the measured concentrations do not correspond to a unique vapor transport scenario)
C1 > C2 C2 > C3
The Ira A. Fulton School of Engineering Arizona State University
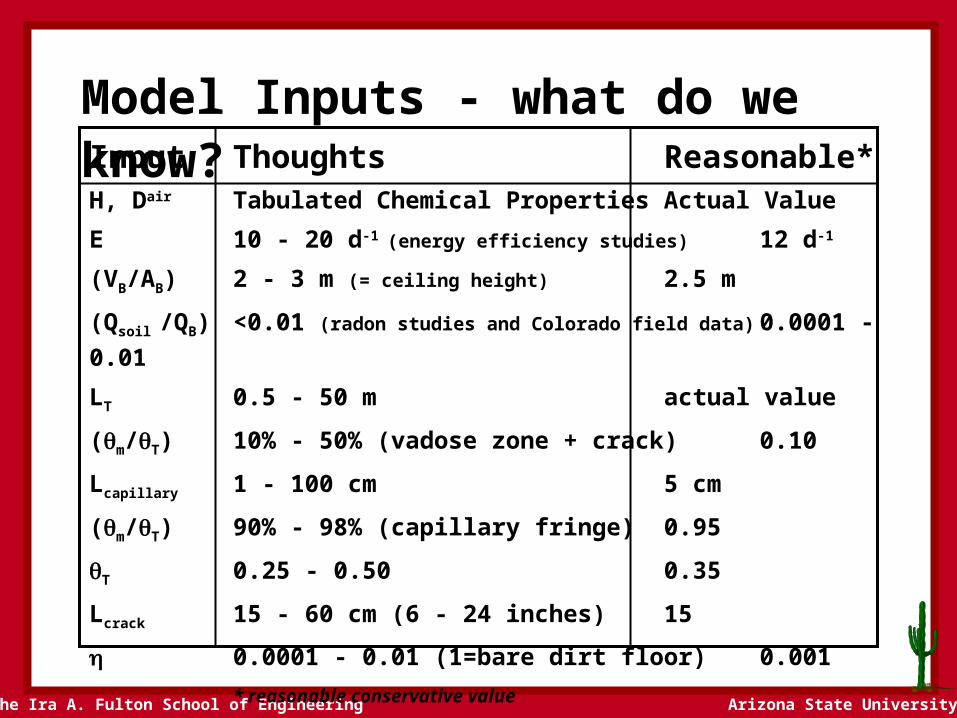
Input Thoughts Reasonable*H, Dair Tabulated Chemical Properties Actual ValueE 10 - 20 d-1 (energy efficiency studies) 12 d-1
(VB/AB) 2 - 3 m (= ceiling height) 2.5 m
(Qsoil /QB) <0.01 (radon studies and Colorado field data) 0.0001 - 0.01
LT 0.5 - 50 m actual value
(m/T) 10% - 50% (vadose zone + crack) 0.10
Lcapillary 1 - 100 cm 5 cm
(m/T) 90% - 98% (capillary fringe) 0.95
T 0.25 - 0.50 0.35
Lcrack 15 - 60 cm (6 - 24 inches) 15
0.0001 - 0.01 (1=bare dirt floor) 0.001* reasonable conservative value
Model Inputs - what do we know?
The Ira A. Fulton School of Engineering Arizona State University
1.E-04
1.E-03
1.E-02
1.E-01
1.E+00
0 0.2 0.4 0.6 0.8 1M /T
T = 0.50
T = 0.35Vadose zone soils
DTeff / Dair
Dw
Dair H i
T 1.33
T 1.33
capi
llary
zone
Sands/ Gravels
Silts/Clays
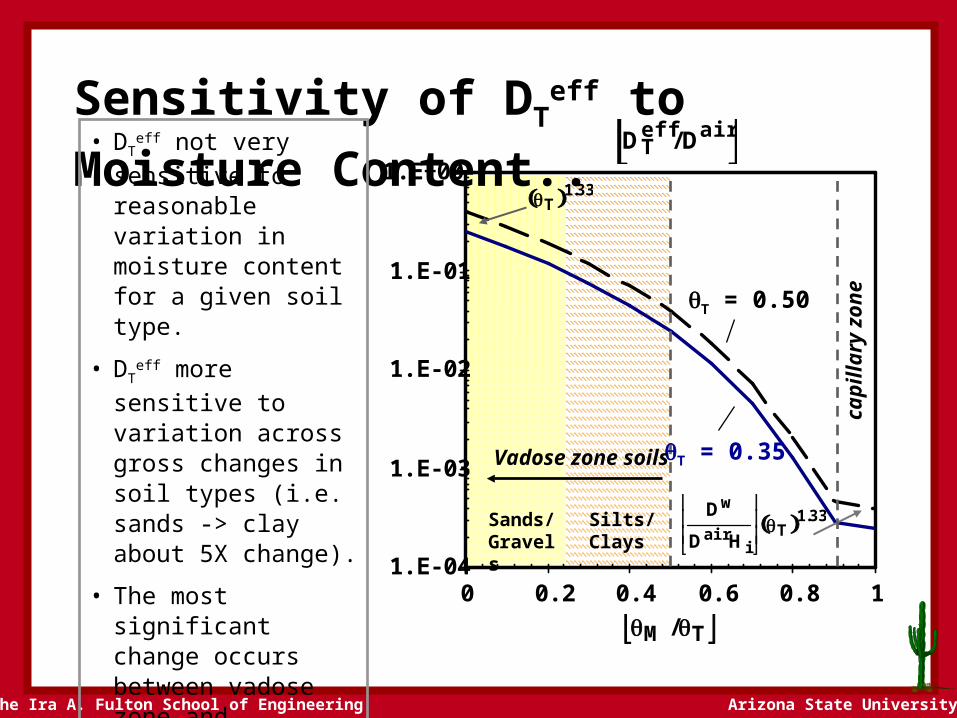
Sensitivity of DTeff to Moisture Content..
• DTeff not very sensitive to
reasonable variation in moisture content for a given soil type.
• DTeff more sensitive to
variation across gross changes in soil types (i.e. sands -> clay about 5X change).
• The most significant change occurs between vadose zone and capillary fringe soils **however** the magnitude depends on H (beware at small H!)