Embed Size (px)
Citation preview
lable at ScienceDirect
Plant Physiology and Biochemistry 49 (2011) 1126e1137
Contents lists avai
Plant Physiology and Biochemistry
journal homepage: www.elsevier .com/locate/plaphy
Research article
Pattern of solutes accumulated during leaf osmotic adjustment as relatedto duration of water deficit for wheat at the reproductive stage
S.A. Nio a,1, G.R. Cawthray a, L.J. Wade b, T.D. Colmer a,*a School of Plant Biology and The UWA Institute of Agriculture, Faculty of Natural and Agricultural Sciences, The University of Western Australia, 35 Stirling Highway,Crawley, WA 6009, AustraliabCharles Sturt University, E.H. Graham Centre for Agricultural Innovation, Locked Bag 588, Wagga Wagga, NSW 2678, Australia
a r t i c l e i n f o
Article history:Received 3 April 2011Accepted 26 May 2011Available online 13 June 2011
Keywords:GlycinebetaineGlucoseKþ
ProlineSoil water extractionDrought stress
Abbreviations: d, day; FEW, fraction of extractaadjustment; OP, osmotic potential; RWC, relative watereflectometry; VWC, volumetric soil water content; Wdeficit; WP, water potential; WW, well-watered; YFleaf; [ ], concentration.* Corresponding author. Tel.: þ61 8 6488 1993; fax
E-mail address: [email protected] (T.D.1 Department of Biology, Faculty of Mathematics
Ratulangi University, Manado, North Sulawesi 95119,
0981-9428/$ e see front matter � 2011 Elsevier Masdoi:10.1016/j.plaphy.2011.05.011
a b s t r a c t
This study examined expression of osmotic adjustment (OA) and accumulation of solutes in wheat(Triticum aestivum L.) leaves in response to water deficit (WD) imposed at the reproductive stage. Twocontrasting cultivars, Hartog and Sunco (putatively high and low in OA capacity, respectively), weregrown in deep (viz. 80 cm) pots in a controlled environment. In a sandy substrate, leaf OA was 5-timesgreater in Hartog compared with Sunco. At 21 d of WD treatment, Kþ only accounted for 12% of OA inHartog and 48% in Sunco with less OA (i.e. tissue Kþ led to different proportions owing to differentmagnitudes of OA). Glycinebetaine and proline also increased under WD, but these were not significantosmotica on a whole tissue basis. Hartog accumulated dry matter faster than Sunco under WD, and thiswas consistent with greater water extraction by Hartog than by Sunco. In a second experiment on Hartog,with loam added to the sand to increase water-holding capacity and thus enable a longer draw-downperiod, leaf OA increased to 0.37 MPa at 37 d of withholding water. Kþ increased up to 16 d of dryingand then decreased towards 37 d. Glycinebetaine, proline, glucose and fructose all increased during thedraw-down period, although with different dynamics; e.g. glycinebetaine increased linearly whereasglucose showed an exponential increase. By contrast, sucrose declined. Kþ was the major contributor toOA (viz. 54%) up to 30 d of drying, whereas glycinebetaine, proline and glucose were major contributorslater (at d 37 these organic solutes each accounted for 19, 21 and 21% of OA). Thus, the various solutesthat contributed to leaf OA in wheat cv. Hartog accumulated at different times as WD developed.
� 2011 Elsevier Masson SAS. All rights reserved.
1. Introduction
Water deficit (WD) is a major abiotic factor limiting cropproductivity world-wide. Plants exposed to WD may have threetypes of responses, namely escape, avoidance and/or tolerance. WDtolerance involves biochemical, physiological and morphologicalmechanisms that enable plants to function during times withdecreased water availability. Osmotic adjustment (OA) is oneimportant mechanism of WD tolerance [1].
ble soil water; OA, osmoticr content; TDR, time domainC, water content; WD, waterEL, youngest fully-expanded
: þ61 8 6488 1108.Colmer).and Natural Sciences, SamIndonesia.
son SAS. All rights reserved.
The degree of OA in plants under WD is influenced by severalfactors, such as rate and duration of WD development [2], level ofWD [3], species and cultivar [e.g. 4], age of tissue and stage of plantdevelopment [5,6]. OA requires time, so that fast reductions in plantwater status, as occur in sandy soil, may not allow full expression ofOA [7]; nevertheless, it is important to elucidate further theresponses of some crops (e.g. wheat) to WD in sandy substrates,since in many regions it is grown on sandy soils prone to waterdepletion [8].
Inwheat, the solutes shown to contribute to OA duringWDweresugars (sucrose, glucose and fructose), proline, and potassium [5,9].Few studies, however, have evaluated the accumulation of glyci-nebetaine in wheat during WD. Glycinebetaine increased by up to1.9-fold in leaves of two spring wheat cultivars in response to WDat heading and grain filling in a field experiment, but the contri-bution to OAwas not assessed [10]. Glycinebetaine also increased inwheat subjected to polyethylene glycol-imposed WD [11,12], butunexpectedly, glycinebetaine was higher in WD-susceptible geno-types, whereas WD-tolerant wheat genotypes contained more
S.A. Nio et al. / Plant Physiology and Biochemistry 49 (2011) 1126e1137 1127
proline [12]. The contribution of glycinebetaine to OA in soil-grownwheat during WD requires evaluation.
The growth response and OA in wheat lines with high and lowOA capacities, when subjected toWD, have been studied byMorgan[4,9,13,14]. These studies were largely conducted at the reproduc-tive stage; the stage reported to be most sensitive to WD in wheat[15]. The present study evaluated the expression of OA in leaves andthe contributing solutes, at the reproductive stage for two wheatcultivars (cv. Hartog and Sunco) previously reported [16] to differ inOA capacity when grown in a clay-loam as stored soil water wasdepleted. As different solutes can contribute to OA over time, thepresent study of Hartog and Sunco adds to earlier work (citedabove) by assessing dynamics of solute accumulations, and withWD imposed in a sandy and sandy-loam substrate. A first experi-ment compared responses of Hartog and Sunco, and a secondexperiment with Hartog, quantified the patterns of commence-ment, accumulation, and cessation for the expected range of inor-ganic (Kþ, Naþ and Cl�) and organic (glycinebetaine, proline,sugars) solutes related to leaf OA in wheat. The patterns of solutesaccumulated, and their relative contributions to OA, were assessedagainst the fraction of extractable soil water (FEW) remainingduring development of WD.
2. Materials and methods
To evaluate OA and to identify the solutes involved, in leaves ofwheat at the reproductive stage, two experiments were conductedin a controlled environment. The first experiment compared theresponses of wheat (Triticum aestivum L.) cultivars Hartog (high OA)and Sunco (low OA). The second experiment evaluated OA andsolutes in greater detail in Hartog.
2.1. Experimental design and treatments
2.1.1. Experiment 1: growth response and osmotic adjustment in theyoungest fully-expanded leaves of two contrasting wheat cultivarssubjected to WD at the reproductive stage
The experiment consisted of 2 cultivars grown in 2 waterregimes, with 5 sampling times and 3 replicates (with 1 plant percontainer or experimental unit), in a randomized block design. Thetwo water regimes were well-watered (WW) and WD obtained bywithholding water at the reproductive stage (treatment period of31 d). Reproductive stage was defined as between ear initiation atthe 6 fully-expanded leaf stage (37 d after sowing) and anthesis.The cultivars were chosen based on Morgan [16]. Water waswithheld when the leaf stage was 6.8 in Hartog and Sunco. After14 d of drying the main stem leaf stages of WW-Hartog, WD-Har-tog, WW-Sunco and WD-Sunco were 8.4, 9.0, 8.0 and 8.1 respec-tively; at 18 d of treatment main stem leaf stages were 9.0, 9.0, 8.2and 8.3 respectively; and after 21 d of treatment all were at leafstage 9.0. Measurements of water content (WC), water potential(WP), relative water content (RWC), osmotic potential of expressedsap (OP), and solutes, were taken after 14, 18 and 21 d of treatment.When the WD treatment commenced total dry matter wasmeasured and then again after 14 (when leaves first showed somerolling), 18, 21 and 31 d of treatment.
2.1.2. Experiment 2: pattern of solutes accumulated during leafosmotic adjustment of cv. Hartog with development of WD at thereproductive stage
The experiment consisted of 1 cultivar grown in 2 waterregimes, with 6 sampling times and 4 replicates, in a randomizedblock design, with 1 plant per container or experimental unit.Hartog was used. Tissue samples for each replicate were collectedfrom 2 plants (2 containers). The two water regimes were WW
(watered every 2 d) and WD obtained by withholding water fromWD containers at the reproductive stage (treatment period of 37 d).The first sampling of the WD treatment was taken at d 0 and thenafter 9 (when leaves started to roll), 16, 23, 30 and 37 d of treat-ment. Samples of WW (control) were collected at 0, 16 and 37 d oftreatment.
2.2. Cultural practices
2.2.1. Experiment 1: growth response and osmotic adjustment inthe youngest fully-expanded leaves of two contrasting wheatcultivars subjected to WD at the reproductive stage
The experiment was conducted in free draining containers(25 L; 15 cm diameter, 80 cm height) in a controlled-environmentroom with 10 h light and 14 h dark at 19/14 �C and relativehumidity of 70%. The average photsynthetically-active irradiancewas 463 mmol quanta m�2 s�1 at plant height (measured usinga Licor spot-sensor).
Air-dried white sand (Rocla Quarry Product number 32) mixedwith 10% coarse river sand (Hazelmere Garden Supplies) was used,because soil types in the wheatbelt of Western Australia are domi-natedby sandyandduplex (sandover clay) soils [17]. The 23kgof soilin each container was supplied, prior to planting, with a basal fer-tiliser comprising 33.1 g superphosphate, 40 g ammonium nitrate,5.5 g Richgro� complete micronutrients, 22 g calcium sulphate(gypsum), and 9 g potash (K2SO4); all together providing 0.4 g N,0.06 g P and 0.07 g K for each kg soil. The drained upper limit (fieldcapacity) and lower limit (wilting point) of plant available water forthis soil were, respectively, 9% and 2% on a volumetric basis.
Pre-germinated seeds were sown at 15 mm depth. After sowing,the top of the container was covered with plastic cling wrap toprevent evaporation and the covers were removed 3 d after sowing.At 7 d, the emerged seedlings were thinned to one per container,and 350 g of basalt gravel (10e18mm)was added to the soil surfaceto minimise soil evaporation.
Containers were watered to field capacity by weight everysecond day before imposing treatments. The nutrient solutioncontained 0.1% Phostrogen� (8% N as KNO3, 2% N as NH4H2PO4, 1.5%N as (NH4)2SO4, 2.5% N as urea, 4.4% P as NH4H2PO4, 22.4% K asKNO3,1.5%Mg asMgSO4,1.43% Ca as CaSO4, 0.04% Fe as EDTA, 0.02%Mn as EDTA, 0.012% B as H3BO3, 0.0055% Cu as EDTA, 0.0055% Zn asEDTA, 0.0016% Mo as Na2MoO4 and 6.0% S as sulphate; all as %concentration in the solid Phostrogen�) to ensure nutrients wereadequate. When treatments commenced, water was withheld fromWD containers, whereas WW containers were watered to ‘fieldcapacity’ every second day with tap water (no additional nutrientswere supplied).
2.2.2. Experiment 2: pattern of solutes accumulated during leafosmotic adjustment of cv. Hartog with development of WD at thereproductive stage
Practices were similar to those used in experiment 1 except thatgrowth medium was Richgro� potting mix (50% GinGin loam, 10%jarrah sawdust, 40% river sand, with also limestone, gypsum, NPK,Mg, and Fe). This substrate held more water than that used inexperiment 1, allowing a longer period of WD for more completeexpression of OA. The drained upper limit (field capacity) was 11%and lower limit (wilting point) of plant available water was 3% ona volumetric basis.
2.3. Measurements
2.3.1. Water useWater use was measured in both experiments by weighing
the containers every second day. Cumulative transpiration was
S.A. Nio et al. / Plant Physiology and Biochemistry 49 (2011) 1126e11371128
calculated by the sum of these two-daily measurements. Evapora-tive demand was recorded every second day using 3 pan evap-orimeters, the same diameter as the containers, randomly placed atcontainer height inside the controlled-environment room. Thefraction of extractable soil water (FEW) remainingwas calculated asFEW¼ 1 � (STa/STtotal), where STa is the amount of total water lossfrom the start of treatment up to each sampling occasion during thedrying cycle and STtotal is the total plant available water that wasextracted.
2.3.2. Soil volumetric water contentIn experiment 1, volumetric soil water content (VWC) was
monitored every second day using Time Domain Reflectometry(TDR) 100 (Campbell Scientific, Inc., Logan, Utah USA). TDR probeswere inserted horizontally into the soil through holes drilled in thesides of each container at depths of 30, 50 and 70 cm below the soilsurface. In experiment 2, VWC was measured volumetrically atdepths of 15, 30, 45, 60 and 80 cm.
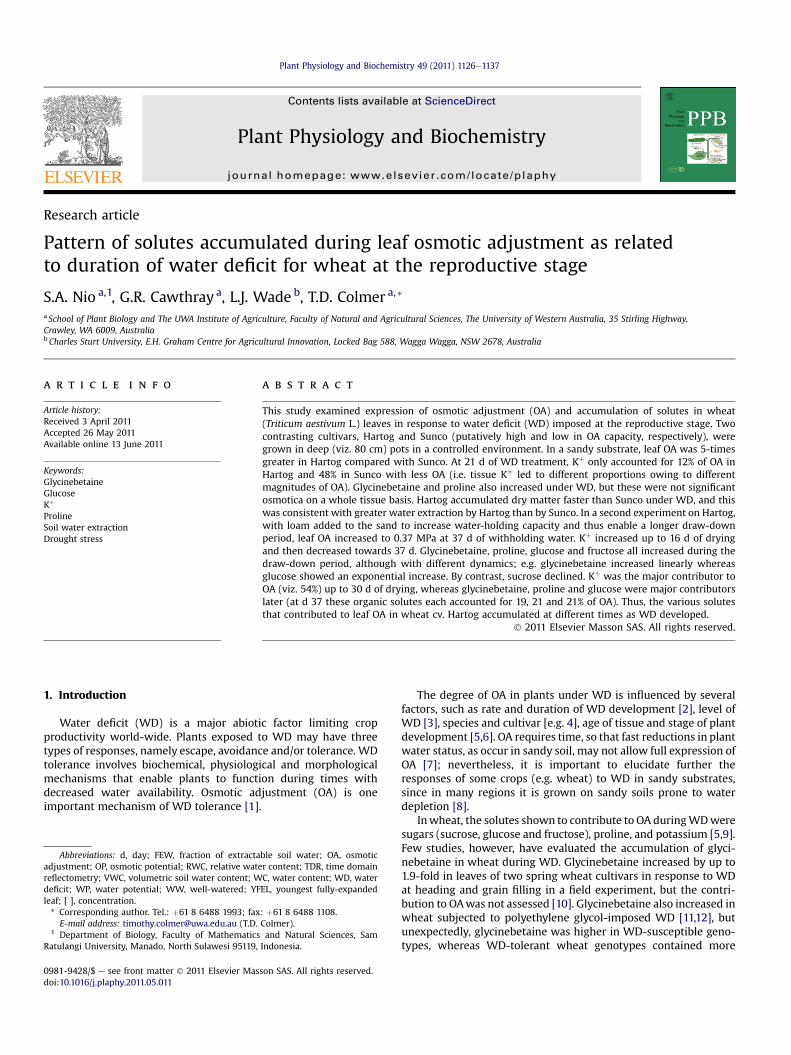
Fig. 1. Total above-ground dry mass (DM) (a), total root dry mass (b) and root:shoot ratio (drtotal above-ground dry mass (d), total root dry mass (e) and deep root:total root ratio (dry(mean � SE; n ¼ 4) (experiment 2) during well-watered (WW) and water deficit (WD) condasterisk indicates a significant difference between cultivars and water regimes (P < 0.05experiment 2.
2.3.3. Plant physiological parametersThe samemeasurementswere taken in experiments 1 and 2. The
youngest fully-expanded leaf (YFEL)was collected atmidday at eachsampling time for measuring WC, WP, RWC, OP, and the concen-tration of inorganic and organic solutes. For each replicate, YFEL ofmain stem and tiller 1 (4 cm from themiddle area of these leaves) of2 plants were collected for OP and solute measurements. YFELof tiller 2 of 2 plantswere collected forWC and RWCmeasurements.YFEL of tiller 3 of 1 plant was used for WP measurement.
Leaf WP was measured at midday using a pressure chamber. ForOPmeasurement, the leaf tissues were frozen in liquid N2, and keptin the freezer at �20 �C until analysis. Sap from samples (thawedwhile still in sealed vials) was squeezed using a simple press and10 mL was analyzed using a Fiske one-ten osmometer (Fiske Asso-ciates, Massachusetts USA). For measuring the concentration ofinorganic and organic solutes, the leaf tissues were wrapped inaluminium foil, frozen in liquid N2, freeze-dried and then processed(described below).
y mass basis) (c) in wheat cv. Hartog and Sunco (mean � SE; n ¼ 3) (experiment 1); andmass basis; deep roots were those at 45e80 cm depth.) (f) in wheat cv. Hartog only
itions. WW-Hartog ,d,, WD-Hartog -d-, WW-Sunco 6–6, WD-Sunco :–:. An) on that d of treatment in experiment 1 and between water regimes (P < 0.05) in
S.A. Nio et al. / Plant Physiology and Biochemistry 49 (2011) 1126e1137 1129
LeafWC and RWCweremeasured by weighing the freshmass ofexcised leaf segments, floating the samples on 0.5 mM CaSO4 for24 h in darkness, gently blotting off any surface liquid using anabsorbent paper towel, weighing turgid mass, drying in an oven for48 h at 70 �C, and re-weighing the dried sample. CaSO4 of 0.5 mMwas used during the floating period to obtain turgid weight, as itcan maintain membrane integrity andminimise solute leakage intothe apoplast. The WC (ml g�1 dry mass) was calculated as (freshmass� dry mass)/dry mass. RWC (%) was calculated as 100� (freshmass � dry mass)/(turgid mass � dry mass).
OAwas calculated as the difference between themeasured OP inleaves of the WD plants and the estimated OP as a result ofconcentration-effect of any decreased tissue WC in WD plants. WCwas used in this calculation rather than RWC, because using RWChas a problem, in that the amount of water entering the apoplast/intercellular spaces of floating leaf tissues is uncertain [6,18].
To calculate the contribution of an individual solute to OA, thedifference in concentration of individual solutes between WD andWW (extra individual solute) was expressed on a molar basis of theamount of water present in leaf samples and then calculated as OP
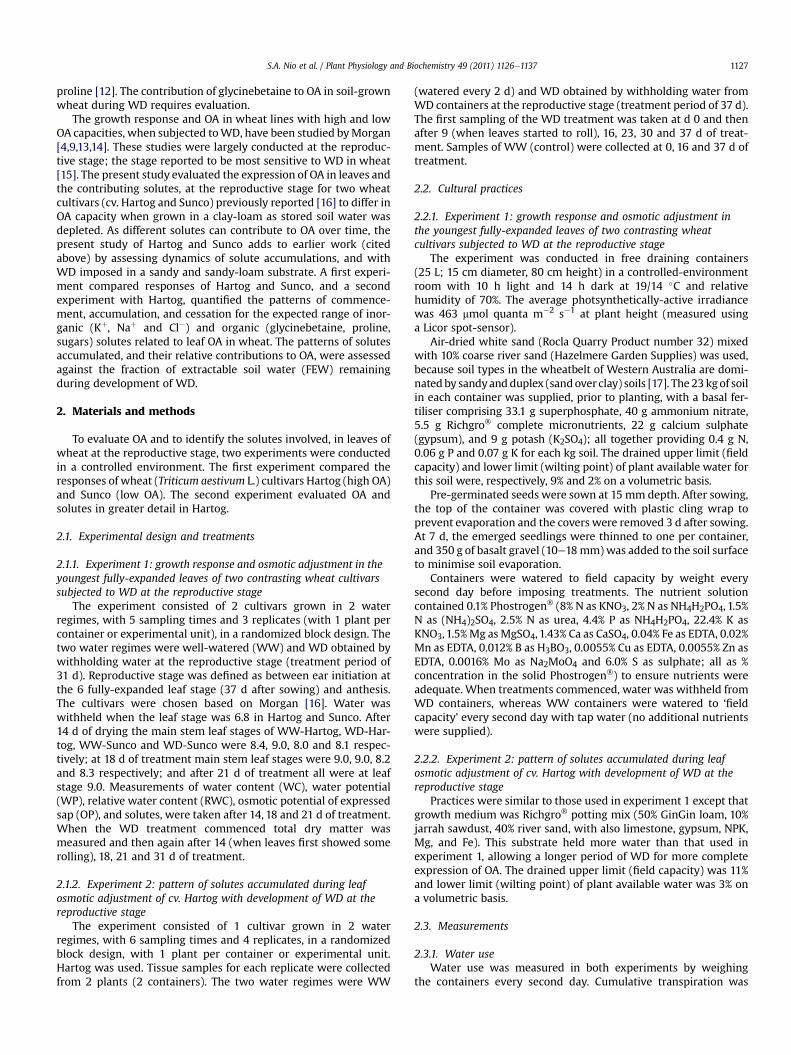
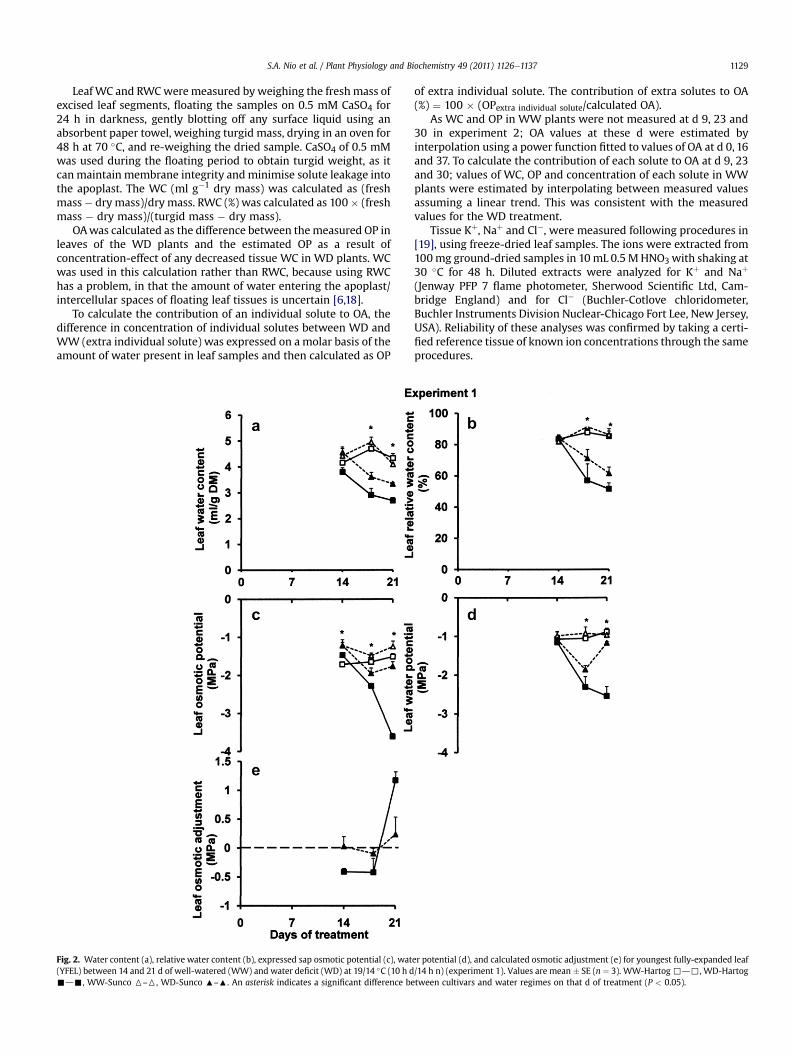
Fig. 2. Water content (a), relative water content (b), expressed sap osmotic potential (c), wat(YFEL) between 14 and 21 d of well-watered (WW) and water deficit (WD) at 19/14 �C (10 h d-d-, WW-Sunco 6–6, WD-Sunco :–:. An asterisk indicates a significant difference be
of extra individual solute. The contribution of extra solutes to OA(%) ¼ 100 � (OPextra individual solute/calculated OA).
As WC and OP in WW plants were not measured at d 9, 23 and30 in experiment 2; OA values at these d were estimated byinterpolation using a power function fitted to values of OA at d 0, 16and 37. To calculate the contribution of each solute to OA at d 9, 23and 30; values of WC, OP and concentration of each solute in WWplants were estimated by interpolating between measured valuesassuming a linear trend. This was consistent with the measuredvalues for the WD treatment.
Tissue Kþ, Naþ and Cl�, were measured following procedures in[19], using freeze-dried leaf samples. The ions were extracted from100mg ground-dried samples in 10mL 0.5 MHNO3with shaking at30 �C for 48 h. Diluted extracts were analyzed for Kþ and Naþ
(Jenway PFP 7 flame photometer, Sherwood Scientific Ltd, Cam-bridge England) and for Cl� (Buchler-Cotlove chloridometer,Buchler Instruments Division Nuclear-Chicago Fort Lee, New Jersey,USA). Reliability of these analyses was confirmed by taking a certi-fied reference tissue of known ion concentrations through the sameprocedures.
er potential (d), and calculated osmotic adjustment (e) for youngest fully-expanded leaf/14 h n) (experiment 1). Values are mean � SE (n ¼ 3). WW-Hartog,d,, WD-Hartogtween cultivars and water regimes on that d of treatment (P < 0.05).
S.A. Nio et al. / Plant Physiology and Biochemistry 49 (2011) 1126e11371130
Glycinebetaine, proline, fructose, glucose and sucrose weremeasured in extracts of freeze-dried leaf tissues. The extractionwascarried out based on the procedure of Fan et al. [20]. The extractwas filtered (0.22 mm) before injection into an HPLC (600 E pumpand 717 plus autoinjector and 996 photodiode-array [PDA] detector,Waters Milford MA, USA) equipped with a Sugar-Pak column asdescribed by Naidu [21]. The same extract was used to measure thetotal sugars using anthrone reagent [22]. Reliability of these anal-yses was confirmed by spikes into a selection of tissue samplestaken through the same procedures.
Plant height, rooting depth and green leaf area [23], total above-ground dry mass, dry mass of total roots, and of deep roots(45e80 cm depth) were measured, and root:shoot ratio, and deeproot:total root ratio were calculated. Plant samples were dried at70 �C for 48 h and the dry mass recorded.
2.3.4. Statistical analysesData were analyzed using Genstat for Windows 10th Edition
(Genstat software, VSN International, Hemel Hempstead, UK).Analysis of variance (ANOVA) and least significant difference (lsd)
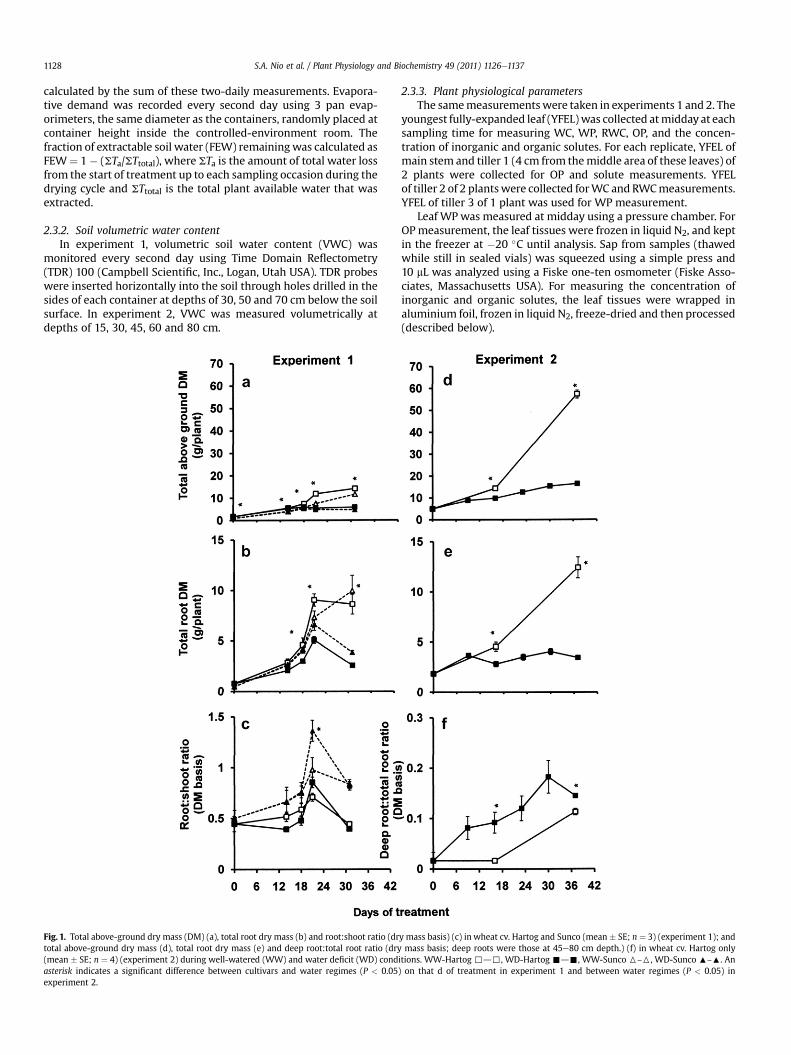
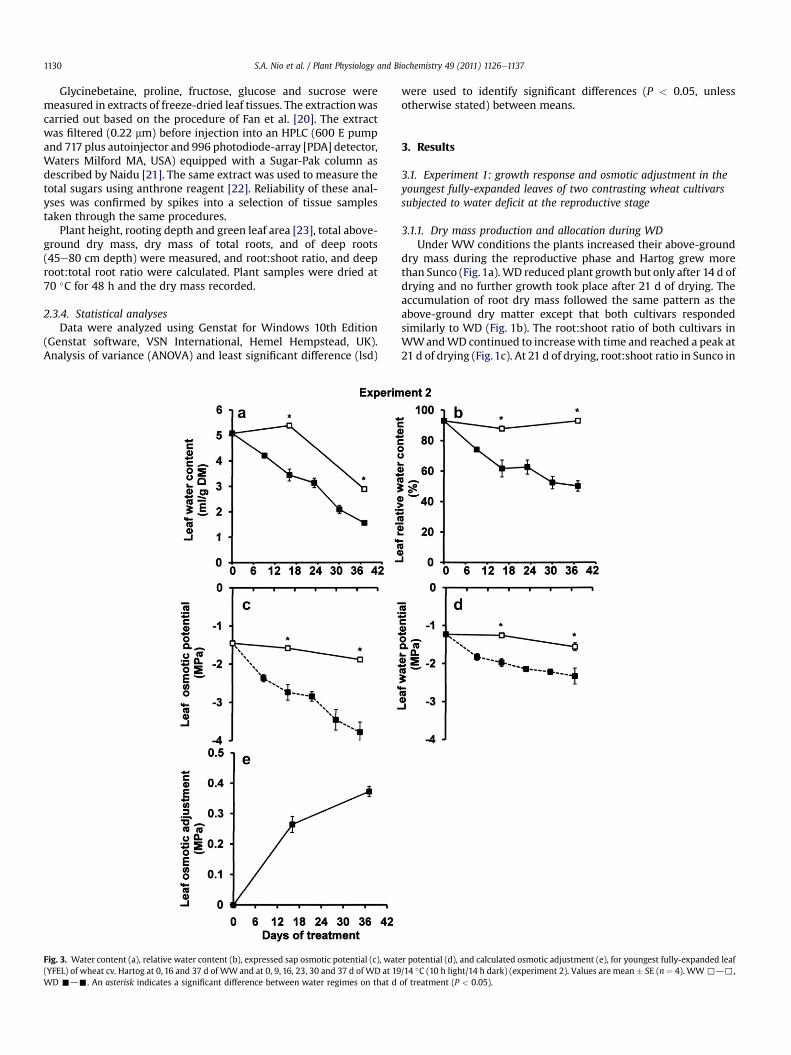
Fig. 3. Water content (a), relative water content (b), expressed sap osmotic potential (c), wat(YFEL) of wheat cv. Hartog at 0, 16 and 37 d of WWand at 0, 9, 16, 23, 30 and 37 d of WD at 19WD -d-. An asterisk indicates a significant difference between water regimes on that d
were used to identify significant differences (P < 0.05, unlessotherwise stated) between means.
3. Results
3.1. Experiment 1: growth response and osmotic adjustment in theyoungest fully-expanded leaves of two contrasting wheat cultivarssubjected to water deficit at the reproductive stage
3.1.1. Dry mass production and allocation during WDUnder WW conditions the plants increased their above-ground
dry mass during the reproductive phase and Hartog grew morethan Sunco (Fig.1a).WD reduced plant growth but only after 14 d ofdrying and no further growth took place after 21 d of drying. Theaccumulation of root dry mass followed the same pattern as theabove-ground dry matter except that both cultivars respondedsimilarly to WD (Fig. 1b). The root:shoot ratio of both cultivars inWWandWD continued to increasewith time and reached a peak at21 d of drying (Fig.1c). At 21 d of drying, root:shoot ratio in Sunco in
er potential (d), and calculated osmotic adjustment (e), for youngest fully-expanded leaf/14 �C (10 h light/14 h dark) (experiment 2). Values are mean � SE (n ¼ 4). WW,d,,of treatment (P < 0.05).
S.A. Nio et al. / Plant Physiology and Biochemistry 49 (2011) 1126e1137 1131
WD was 40% larger than in WW, and root:shoot ratio in WD inSunco was 60% larger than in Hartog.
3.1.2. Leaf OA capacity during WDIn the WW plants, leaf WC and RWC of Hartog and Sunco were
similar (Fig. 2a and b). WD decreased leaf WC and RWC in bothcultivars and Hartog tended to have lower values than Sunco(Fig. 2a and b).
Plants inWW treatment did not show significant changes in leafOP (Fig. 2c).Water deficit reduced leaf OP, but the declinewasmuchgreater in Hartog than in Sunco. OP of Sunco stabilizedatw�2.0 MPa asWD intensified from 14 to 21 d of drying, whereasin Hartog, OP declined to �3.6 MPa (Fig. 2c).
WD reduced leaf WP compared with WW, after 18 and 21 d(Fig. 2d). Leaf WP of Sunco in WD unexpectedly increased at 21 d.This might have happened because different plants grown indifferent containers were sampled at each time point.
Hartog showed higher OA capacity than Sunco under WD(Fig. 2e). The OA in Hartog (1.2 MPa) was 5-times larger than in
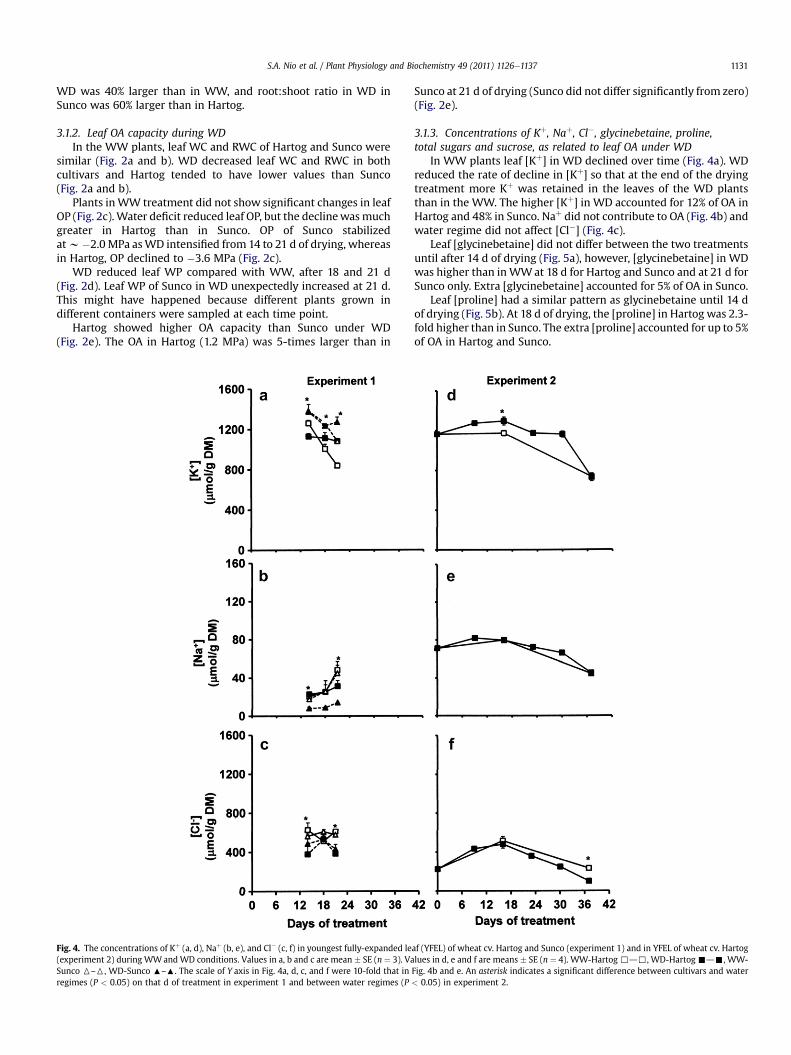
Fig. 4. The concentrations of Kþ (a, d), Naþ (b, e), and Cl� (c, f) in youngest fully-expanded le(experiment 2) during WWandWD conditions. Values in a, b and c are mean � SE (n ¼ 3). VaSunco 6–6, WD-Sunco :–:. The scale of Y axis in Fig. 4a, d, c, and f were 10-fold that inregimes (P < 0.05) on that d of treatment in experiment 1 and between water regimes (P
Sunco at 21 d of drying (Sunco did not differ significantly from zero)(Fig. 2e).
3.1.3. Concentrations of Kþ, Naþ, Cl�, glycinebetaine, proline,total sugars and sucrose, as related to leaf OA under WD
In WW plants leaf [Kþ] in WD declined over time (Fig. 4a). WDreduced the rate of decline in [Kþ] so that at the end of the dryingtreatment more Kþ was retained in the leaves of the WD plantsthan in the WW. The higher [Kþ] in WD accounted for 12% of OA inHartog and 48% in Sunco. Naþ did not contribute to OA (Fig. 4b) andwater regime did not affect [Cl�] (Fig. 4c).
Leaf [glycinebetaine] did not differ between the two treatmentsuntil after 14 d of drying (Fig. 5a), however, [glycinebetaine] in WDwas higher than inWWat 18 d for Hartog and Sunco and at 21 d forSunco only. Extra [glycinebetaine] accounted for 5% of OA in Sunco.
Leaf [proline] had a similar pattern as glycinebetaine until 14 dof drying (Fig. 5b). At 18 d of drying, the [proline] in Hartog was 2.3-fold higher than in Sunco. The extra [proline] accounted for up to 5%of OA in Hartog and Sunco.
af (YFEL) of wheat cv. Hartog and Sunco (experiment 1) and in YFEL of wheat cv. Hartoglues in d, e and f are means � SE (n ¼ 4). WW-Hartog,d,, WD-Hartog-d-, WW-Fig. 4b and e. An asterisk indicates a significant difference between cultivars and water< 0.05) in experiment 2.
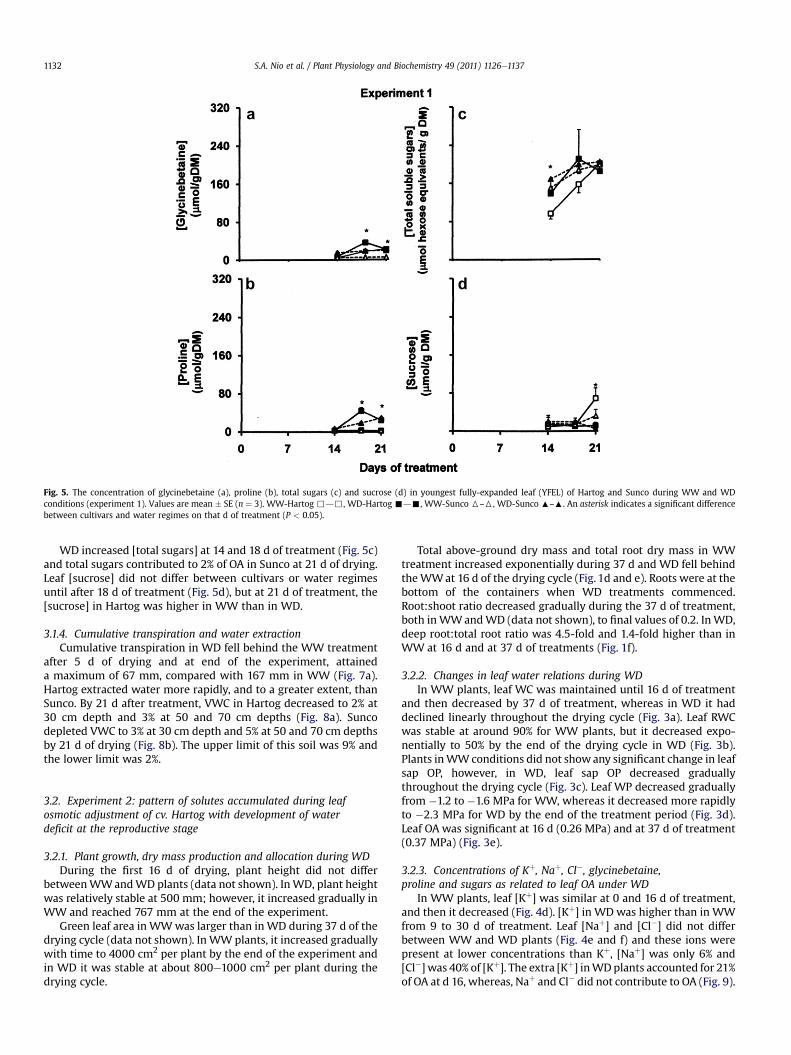
Fig. 5. The concentration of glycinebetaine (a), proline (b), total sugars (c) and sucrose (d) in youngest fully-expanded leaf (YFEL) of Hartog and Sunco during WW and WDconditions (experiment 1). Values are mean � SE (n ¼ 3). WW-Hartog ,d,, WD-Hartog -d-, WW-Sunco 6–6, WD-Sunco :–:. An asterisk indicates a significant differencebetween cultivars and water regimes on that d of treatment (P < 0.05).
S.A. Nio et al. / Plant Physiology and Biochemistry 49 (2011) 1126e11371132
WD increased [total sugars] at 14 and 18 d of treatment (Fig. 5c)and total sugars contributed to 2% of OA in Sunco at 21 d of drying.Leaf [sucrose] did not differ between cultivars or water regimesuntil after 18 d of treatment (Fig. 5d), but at 21 d of treatment, the[sucrose] in Hartog was higher in WW than in WD.
3.1.4. Cumulative transpiration and water extractionCumulative transpiration in WD fell behind the WW treatment
after 5 d of drying and at end of the experiment, attaineda maximum of 67 mm, compared with 167 mm in WW (Fig. 7a).Hartog extracted water more rapidly, and to a greater extent, thanSunco. By 21 d after treatment, VWC in Hartog decreased to 2% at30 cm depth and 3% at 50 and 70 cm depths (Fig. 8a). Suncodepleted VWC to 3% at 30 cm depth and 5% at 50 and 70 cm depthsby 21 d of drying (Fig. 8b). The upper limit of this soil was 9% andthe lower limit was 2%.
3.2. Experiment 2: pattern of solutes accumulated during leafosmotic adjustment of cv. Hartog with development of waterdeficit at the reproductive stage
3.2.1. Plant growth, dry mass production and allocation during WDDuring the first 16 d of drying, plant height did not differ
betweenWWandWD plants (data not shown). InWD, plant heightwas relatively stable at 500 mm; however, it increased gradually inWW and reached 767 mm at the end of the experiment.
Green leaf area in WWwas larger than inWD during 37 d of thedrying cycle (data not shown). In WWplants, it increased graduallywith time to 4000 cm2 per plant by the end of the experiment andin WD it was stable at about 800e1000 cm2 per plant during thedrying cycle.
Total above-ground dry mass and total root dry mass in WWtreatment increased exponentially during 37 d and WD fell behindtheWWat 16 d of the drying cycle (Fig. 1d and e). Roots were at thebottom of the containers when WD treatments commenced.Root:shoot ratio decreased gradually during the 37 d of treatment,both inWWandWD (data not shown), to final values of 0.2. InWD,deep root:total root ratio was 4.5-fold and 1.4-fold higher than inWW at 16 d and at 37 d of treatments (Fig. 1f).
3.2.2. Changes in leaf water relations during WDIn WW plants, leaf WC was maintained until 16 d of treatment
and then decreased by 37 d of treatment, whereas in WD it haddeclined linearly throughout the drying cycle (Fig. 3a). Leaf RWCwas stable at around 90% for WW plants, but it decreased expo-nentially to 50% by the end of the drying cycle in WD (Fig. 3b).Plants inWWconditions did not showany significant change in leafsap OP, however, in WD, leaf sap OP decreased graduallythroughout the drying cycle (Fig. 3c). Leaf WP decreased graduallyfrom �1.2 to �1.6 MPa for WW, whereas it decreased more rapidlyto �2.3 MPa for WD by the end of the treatment period (Fig. 3d).Leaf OA was significant at 16 d (0.26 MPa) and at 37 d of treatment(0.37 MPa) (Fig. 3e).
3.2.3. Concentrations of Kþ, Naþ, Cl�, glycinebetaine,proline and sugars as related to leaf OA under WD
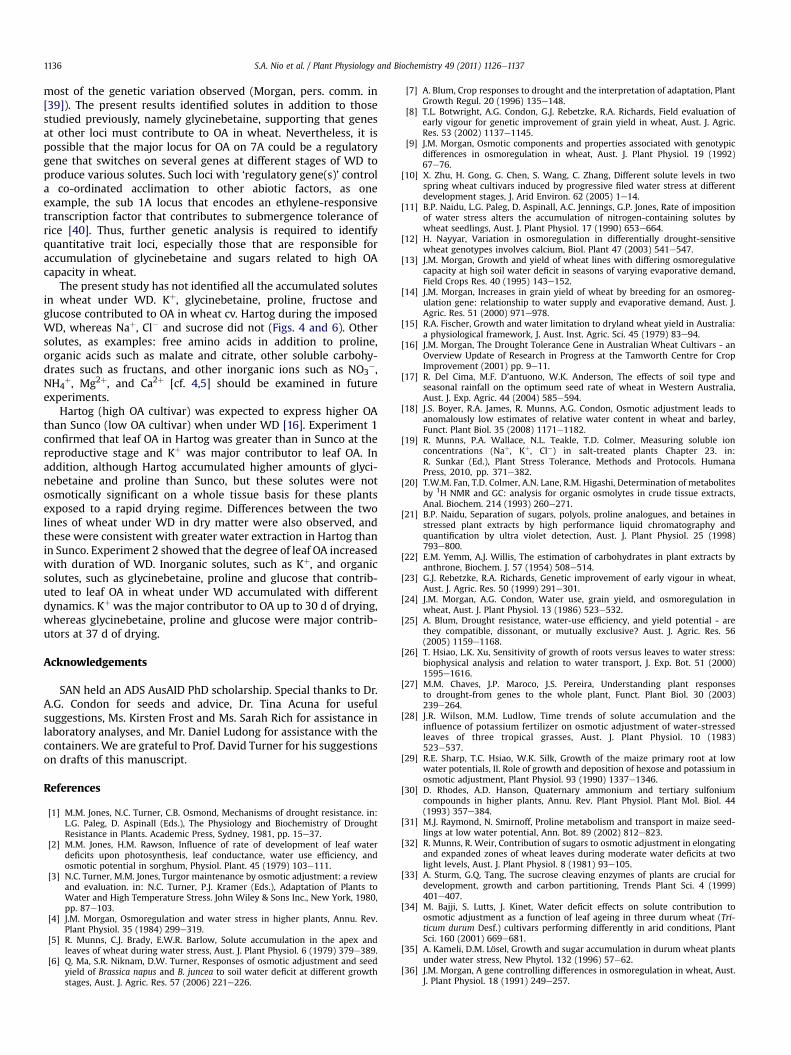
In WW plants, leaf [Kþ] was similar at 0 and 16 d of treatment,and then it decreased (Fig. 4d). [Kþ] in WD was higher than in WWfrom 9 to 30 d of treatment. Leaf [Naþ] and [Cl�] did not differbetween WW and WD plants (Fig. 4e and f) and these ions werepresent at lower concentrations than Kþ, [Naþ] was only 6% and[Cl�] was 40% of [Kþ]. The extra [Kþ] inWDplants accounted for 21%of OA at d 16, whereas, Naþ and Cl� did not contribute to OA (Fig. 9).
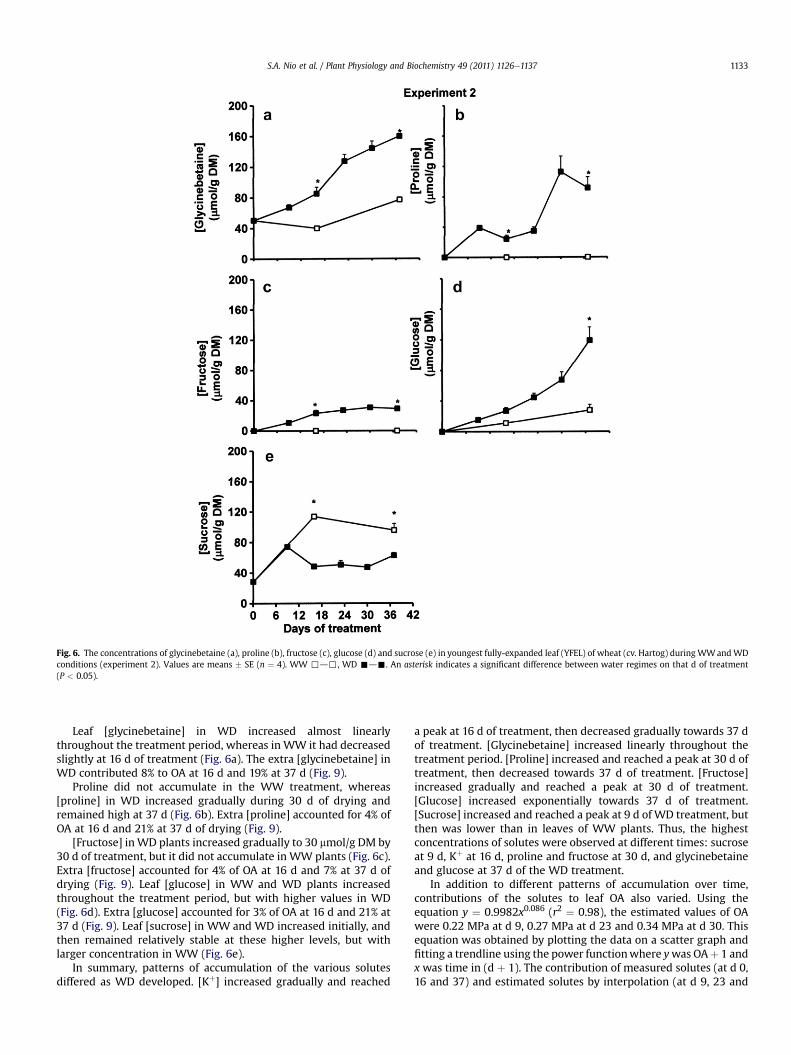
Fig. 6. The concentrations of glycinebetaine (a), proline (b), fructose (c), glucose (d) and sucrose (e) in youngest fully-expanded leaf (YFEL) of wheat (cv. Hartog) during WWandWDconditions (experiment 2). Values are means � SE (n ¼ 4). WW ,d,, WD -d-. An asterisk indicates a significant difference between water regimes on that d of treatment(P < 0.05).
S.A. Nio et al. / Plant Physiology and Biochemistry 49 (2011) 1126e1137 1133
Leaf [glycinebetaine] in WD increased almost linearlythroughout the treatment period, whereas in WW it had decreasedslightly at 16 d of treatment (Fig. 6a). The extra [glycinebetaine] inWD contributed 8% to OA at 16 d and 19% at 37 d (Fig. 9).
Proline did not accumulate in the WW treatment, whereas[proline] in WD increased gradually during 30 d of drying andremained high at 37 d (Fig. 6b). Extra [proline] accounted for 4% ofOA at 16 d and 21% at 37 d of drying (Fig. 9).
[Fructose] inWD plants increased gradually to 30 mmol/g DM by30 d of treatment, but it did not accumulate in WW plants (Fig. 6c).Extra [fructose] accounted for 4% of OA at 16 d and 7% at 37 d ofdrying (Fig. 9). Leaf [glucose] in WW and WD plants increasedthroughout the treatment period, but with higher values in WD(Fig. 6d). Extra [glucose] accounted for 3% of OA at 16 d and 21% at37 d (Fig. 9). Leaf [sucrose] in WW and WD increased initially, andthen remained relatively stable at these higher levels, but withlarger concentration in WW (Fig. 6e).
In summary, patterns of accumulation of the various solutesdiffered as WD developed. [Kþ] increased gradually and reached
a peak at 16 d of treatment, then decreased gradually towards 37 dof treatment. [Glycinebetaine] increased linearly throughout thetreatment period. [Proline] increased and reached a peak at 30 d oftreatment, then decreased towards 37 d of treatment. [Fructose]increased gradually and reached a peak at 30 d of treatment.[Glucose] increased exponentially towards 37 d of treatment.[Sucrose] increased and reached a peak at 9 d of WD treatment, butthen was lower than in leaves of WW plants. Thus, the highestconcentrations of solutes were observed at different times: sucroseat 9 d, Kþ at 16 d, proline and fructose at 30 d, and glycinebetaineand glucose at 37 d of the WD treatment.
In addition to different patterns of accumulation over time,contributions of the solutes to leaf OA also varied. Using theequation y ¼ 0.9982x0.086 (r2 ¼ 0.98), the estimated values of OAwere 0.22 MPa at d 9, 0.27 MPa at d 23 and 0.34 MPa at d 30. Thisequation was obtained by plotting the data on a scatter graph andfitting a trendline using the power functionwhere ywas OAþ 1 andx was time in (d þ 1). The contribution of measured solutes (at d 0,16 and 37) and estimated solutes by interpolation (at d 9, 23 and
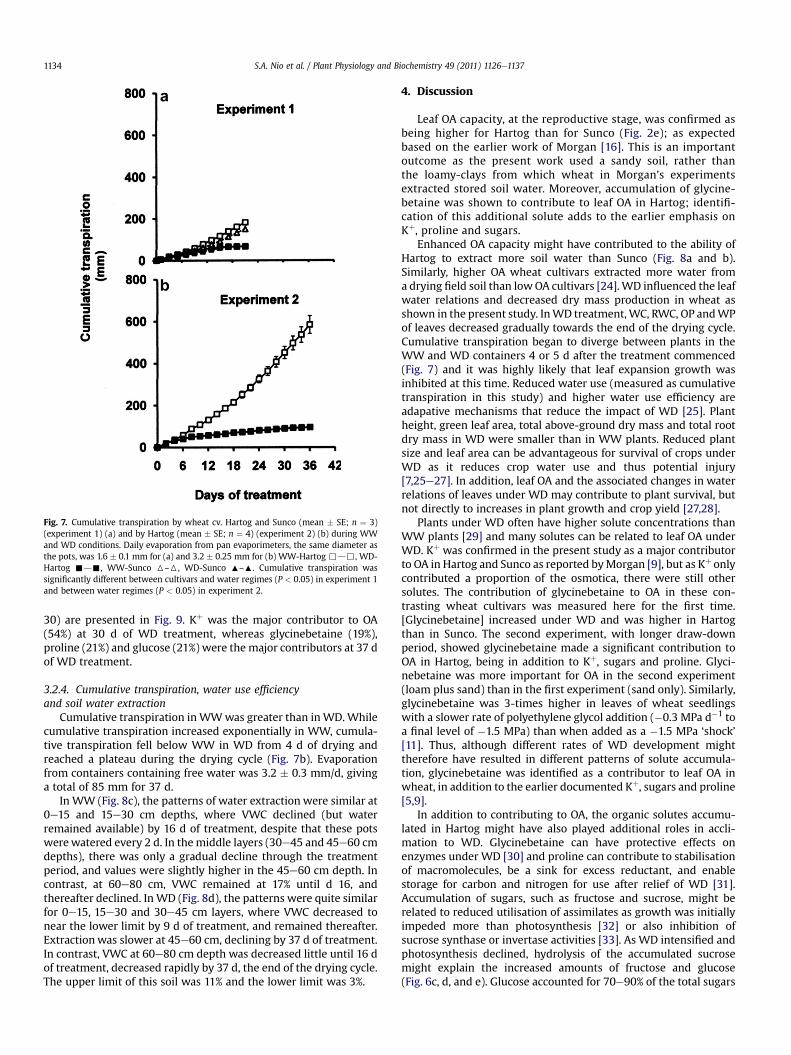
Fig. 7. Cumulative transpiration by wheat cv. Hartog and Sunco (mean � SE; n ¼ 3)(experiment 1) (a) and by Hartog (mean � SE; n ¼ 4) (experiment 2) (b) during WWand WD conditions. Daily evaporation from pan evaporimeters, the same diameter asthe pots, was 1.6 � 0.1 mm for (a) and 3.2 � 0.25 mm for (b) WW-Hartog ,d,, WD-Hartog -d-, WW-Sunco 6–6, WD-Sunco :–:. Cumulative transpiration wassignificantly different between cultivars and water regimes (P < 0.05) in experiment 1and between water regimes (P < 0.05) in experiment 2.
S.A. Nio et al. / Plant Physiology and Biochemistry 49 (2011) 1126e11371134
30) are presented in Fig. 9. Kþ was the major contributor to OA(54%) at 30 d of WD treatment, whereas glycinebetaine (19%),proline (21%) and glucose (21%) were the major contributors at 37 dof WD treatment.
3.2.4. Cumulative transpiration, water use efficiencyand soil water extraction
Cumulative transpiration inWWwas greater than inWD.Whilecumulative transpiration increased exponentially in WW, cumula-tive transpiration fell below WW in WD from 4 d of drying andreached a plateau during the drying cycle (Fig. 7b). Evaporationfrom containers containing free water was 3.2 � 0.3 mm/d, givinga total of 85 mm for 37 d.
In WW (Fig. 8c), the patterns of water extraction were similar at0e15 and 15e30 cm depths, where VWC declined (but waterremained available) by 16 d of treatment, despite that these potswerewatered every 2 d. In the middle layers (30e45 and 45e60 cmdepths), there was only a gradual decline through the treatmentperiod, and values were slightly higher in the 45e60 cm depth. Incontrast, at 60e80 cm, VWC remained at 17% until d 16, andthereafter declined. In WD (Fig. 8d), the patterns were quite similarfor 0e15, 15e30 and 30e45 cm layers, where VWC decreased tonear the lower limit by 9 d of treatment, and remained thereafter.Extractionwas slower at 45e60 cm, declining by 37 d of treatment.In contrast, VWC at 60e80 cm depth was decreased little until 16 dof treatment, decreased rapidly by 37 d, the end of the drying cycle.The upper limit of this soil was 11% and the lower limit was 3%.
4. Discussion
Leaf OA capacity, at the reproductive stage, was confirmed asbeing higher for Hartog than for Sunco (Fig. 2e); as expectedbased on the earlier work of Morgan [16]. This is an importantoutcome as the present work used a sandy soil, rather thanthe loamy-clays from which wheat in Morgan’s experimentsextracted stored soil water. Moreover, accumulation of glycine-betaine was shown to contribute to leaf OA in Hartog; identifi-cation of this additional solute adds to the earlier emphasis onKþ, proline and sugars.
Enhanced OA capacity might have contributed to the ability ofHartog to extract more soil water than Sunco (Fig. 8a and b).Similarly, higher OA wheat cultivars extracted more water froma drying field soil than lowOA cultivars [24].WD influenced the leafwater relations and decreased dry mass production in wheat asshown in the present study. InWD treatment,WC, RWC, OP andWPof leaves decreased gradually towards the end of the drying cycle.Cumulative transpiration began to diverge between plants in theWW and WD containers 4 or 5 d after the treatment commenced(Fig. 7) and it was highly likely that leaf expansion growth wasinhibited at this time. Reduced water use (measured as cumulativetranspiration in this study) and higher water use efficiency areadapative mechanisms that reduce the impact of WD [25]. Plantheight, green leaf area, total above-ground dry mass and total rootdry mass in WD were smaller than in WW plants. Reduced plantsize and leaf area can be advantageous for survival of crops underWD as it reduces crop water use and thus potential injury[7,25e27]. In addition, leaf OA and the associated changes in waterrelations of leaves under WD may contribute to plant survival, butnot directly to increases in plant growth and crop yield [27,28].
Plants under WD often have higher solute concentrations thanWW plants [29] and many solutes can be related to leaf OA underWD. Kþ was confirmed in the present study as a major contributorto OA in Hartog and Sunco as reported byMorgan [9], but as Kþ onlycontributed a proportion of the osmotica, there were still othersolutes. The contribution of glycinebetaine to OA in these con-trasting wheat cultivars was measured here for the first time.[Glycinebetaine] increased under WD and was higher in Hartogthan in Sunco. The second experiment, with longer draw-downperiod, showed glycinebetaine made a significant contribution toOA in Hartog, being in addition to Kþ, sugars and proline. Glyci-nebetaine was more important for OA in the second experiment(loam plus sand) than in the first experiment (sand only). Similarly,glycinebetaine was 3-times higher in leaves of wheat seedlingswith a slower rate of polyethylene glycol addition (�0.3 MPa d�1 toa final level of �1.5 MPa) than when added as a �1.5 MPa ‘shock’[11]. Thus, although different rates of WD development mighttherefore have resulted in different patterns of solute accumula-tion, glycinebetaine was identified as a contributor to leaf OA inwheat, in addition to the earlier documented Kþ, sugars and proline[5,9].
In addition to contributing to OA, the organic solutes accumu-lated in Hartog might have also played additional roles in accli-mation to WD. Glycinebetaine can have protective effects onenzymes under WD [30] and proline can contribute to stabilisationof macromolecules, be a sink for excess reductant, and enablestorage for carbon and nitrogen for use after relief of WD [31].Accumulation of sugars, such as fructose and sucrose, might berelated to reduced utilisation of assimilates as growth was initiallyimpeded more than photosynthesis [32] or also inhibition ofsucrose synthase or invertase activities [33]. As WD intensified andphotosynthesis declined, hydrolysis of the accumulated sucrosemight explain the increased amounts of fructose and glucose(Fig. 6c, d, and e). Glucose accounted for 70e90% of the total sugars
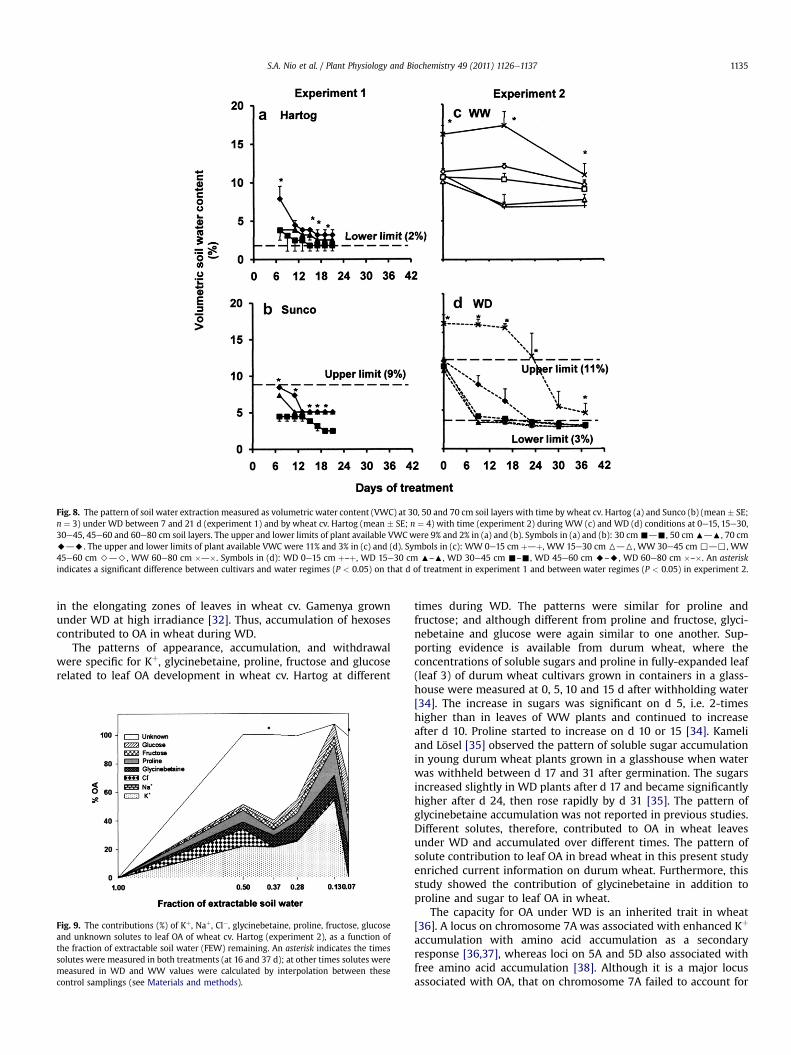
Fig. 8. The pattern of soil water extraction measured as volumetric water content (VWC) at 30, 50 and 70 cm soil layers with time by wheat cv. Hartog (a) and Sunco (b) (mean � SE;n ¼ 3) under WD between 7 and 21 d (experiment 1) and by wheat cv. Hartog (mean � SE; n ¼ 4) with time (experiment 2) during WW (c) and WD (d) conditions at 0e15, 15e30,30e45, 45e60 and 60e80 cm soil layers. The upper and lower limits of plant available VWCwere 9% and 2% in (a) and (b). Symbols in (a) and (b): 30 cm-d-, 50 cm:d:, 70 cmAdA. The upper and lower limits of plant available VWC were 11% and 3% in (c) and (d). Symbols in (c): WW 0e15 cm þdþ, WW 15e30 cm 6d6, WW 30e45 cm ,d,, WW45e60 cm >d>, WW 60e80 cm �d�. Symbols in (d): WD 0e15 cm þ–þ, WD 15e30 cm :–:, WD 30e45 cm -–-, WD 45e60 cm A–A, WD 60e80 cm �–�. An asteriskindicates a significant difference between cultivars and water regimes (P < 0.05) on that d of treatment in experiment 1 and between water regimes (P < 0.05) in experiment 2.
S.A. Nio et al. / Plant Physiology and Biochemistry 49 (2011) 1126e1137 1135
in the elongating zones of leaves in wheat cv. Gamenya grownunder WD at high irradiance [32]. Thus, accumulation of hexosescontributed to OA in wheat during WD.
The patterns of appearance, accumulation, and withdrawalwere specific for Kþ, glycinebetaine, proline, fructose and glucoserelated to leaf OA development in wheat cv. Hartog at different
Fig. 9. The contributions (%) of Kþ, Naþ, Cl�, glycinebetaine, proline, fructose, glucoseand unknown solutes to leaf OA of wheat cv. Hartog (experiment 2), as a function ofthe fraction of extractable soil water (FEW) remaining. An asterisk indicates the timessolutes were measured in both treatments (at 16 and 37 d); at other times solutes weremeasured in WD and WW values were calculated by interpolation between thesecontrol samplings (see Materials and methods).
times during WD. The patterns were similar for proline andfructose; and although different from proline and fructose, glyci-nebetaine and glucose were again similar to one another. Sup-porting evidence is available from durum wheat, where theconcentrations of soluble sugars and proline in fully-expanded leaf(leaf 3) of durum wheat cultivars grown in containers in a glass-house were measured at 0, 5, 10 and 15 d after withholding water[34]. The increase in sugars was significant on d 5, i.e. 2-timeshigher than in leaves of WW plants and continued to increaseafter d 10. Proline started to increase on d 10 or 15 [34]. Kameliand Lösel [35] observed the pattern of soluble sugar accumulationin young durum wheat plants grown in a glasshouse when waterwas withheld between d 17 and 31 after germination. The sugarsincreased slightly in WD plants after d 17 and became significantlyhigher after d 24, then rose rapidly by d 31 [35]. The pattern ofglycinebetaine accumulation was not reported in previous studies.Different solutes, therefore, contributed to OA in wheat leavesunder WD and accumulated over different times. The pattern ofsolute contribution to leaf OA in bread wheat in this present studyenriched current information on durum wheat. Furthermore, thisstudy showed the contribution of glycinebetaine in addition toproline and sugar to leaf OA in wheat.
The capacity for OA under WD is an inherited trait in wheat[36]. A locus on chromosome 7A was associated with enhanced Kþ
accumulation with amino acid accumulation as a secondaryresponse [36,37], whereas loci on 5A and 5D also associated withfree amino acid accumulation [38]. Although it is a major locusassociated with OA, that on chromosome 7A failed to account for
S.A. Nio et al. / Plant Physiology and Biochemistry 49 (2011) 1126e11371136
most of the genetic variation observed (Morgan, pers. comm. in[39]). The present results identified solutes in addition to thosestudied previously, namely glycinebetaine, supporting that genesat other loci must contribute to OA in wheat. Nevertheless, it ispossible that the major locus for OA on 7A could be a regulatorygene that switches on several genes at different stages of WD toproduce various solutes. Such loci with ‘regulatory gene(s)’ controla co-ordinated acclimation to other abiotic factors, as oneexample, the sub 1A locus that encodes an ethylene-responsivetranscription factor that contributes to submergence tolerance ofrice [40]. Thus, further genetic analysis is required to identifyquantitative trait loci, especially those that are responsible foraccumulation of glycinebetaine and sugars related to high OAcapacity in wheat.
The present study has not identified all the accumulated solutesin wheat under WD. Kþ, glycinebetaine, proline, fructose andglucose contributed to OA in wheat cv. Hartog during the imposedWD, whereas Naþ, Cl� and sucrose did not (Figs. 4 and 6). Othersolutes, as examples: free amino acids in addition to proline,organic acids such as malate and citrate, other soluble carbohy-drates such as fructans, and other inorganic ions such as NO3
�,NH4
þ, Mg2þ, and Ca2þ [cf. 4,5] should be examined in futureexperiments.
Hartog (high OA cultivar) was expected to express higher OAthan Sunco (low OA cultivar) when under WD [16]. Experiment 1confirmed that leaf OA in Hartog was greater than in Sunco at thereproductive stage and Kþ was major contributor to leaf OA. Inaddition, although Hartog accumulated higher amounts of glyci-nebetaine and proline than Sunco, but these solutes were notosmotically significant on a whole tissue basis for these plantsexposed to a rapid drying regime. Differences between the twolines of wheat under WD in dry matter were also observed, andthese were consistent with greater water extraction in Hartog thanin Sunco. Experiment 2 showed that the degree of leaf OA increasedwith duration of WD. Inorganic solutes, such as Kþ, and organicsolutes, such as glycinebetaine, proline and glucose that contrib-uted to leaf OA in wheat under WD accumulated with differentdynamics. Kþ was the major contributor to OA up to 30 d of drying,whereas glycinebetaine, proline and glucose were major contrib-utors at 37 d of drying.
Acknowledgements
SAN held an ADS AusAID PhD scholarship. Special thanks to Dr.A.G. Condon for seeds and advice, Dr. Tina Acuna for usefulsuggestions, Ms. Kirsten Frost and Ms. Sarah Rich for assistance inlaboratory analyses, and Mr. Daniel Ludong for assistance with thecontainers. We are grateful to Prof. David Turner for his suggestionson drafts of this manuscript.
References
[1] M.M. Jones, N.C. Turner, C.B. Osmond, Mechanisms of drought resistance. in:L.G. Paleg, D. Aspinall (Eds.), The Physiology and Biochemistry of DroughtResistance in Plants. Academic Press, Sydney, 1981, pp. 15e37.
[2] M.M. Jones, H.M. Rawson, Influence of rate of development of leaf waterdeficits upon photosynthesis, leaf conductance, water use efficiency, andosmotic potential in sorghum, Physiol. Plant. 45 (1979) 103e111.
[3] N.C. Turner, M.M. Jones, Turgor maintenance by osmotic adjustment: a reviewand evaluation. in: N.C. Turner, P.J. Kramer (Eds.), Adaptation of Plants toWater and High Temperature Stress. John Wiley & Sons Inc., New York, 1980,pp. 87e103.
[4] J.M. Morgan, Osmoregulation and water stress in higher plants, Annu. Rev.Plant Physiol. 35 (1984) 299e319.
[5] R. Munns, C.J. Brady, E.W.R. Barlow, Solute accumulation in the apex andleaves of wheat during water stress, Aust. J. Plant Physiol. 6 (1979) 379e389.
[6] Q. Ma, S.R. Niknam, D.W. Turner, Responses of osmotic adjustment and seedyield of Brassica napus and B. juncea to soil water deficit at different growthstages, Aust. J. Agric. Res. 57 (2006) 221e226.
[7] A. Blum, Crop responses to drought and the interpretation of adaptation, PlantGrowth Regul. 20 (1996) 135e148.
[8] T.L. Botwright, A.G. Condon, G.J. Rebetzke, R.A. Richards, Field evaluation ofearly vigour for genetic improvement of grain yield in wheat, Aust. J. Agric.Res. 53 (2002) 1137e1145.
[9] J.M. Morgan, Osmotic components and properties associated with genotypicdifferences in osmoregulation in wheat, Aust. J. Plant Physiol. 19 (1992)67e76.
[10] X. Zhu, H. Gong, G. Chen, S. Wang, C. Zhang, Different solute levels in twospring wheat cultivars induced by progressive filed water stress at differentdevelopment stages, J. Arid Environ. 62 (2005) 1e14.
[11] B.P. Naidu, L.G. Paleg, D. Aspinall, A.C. Jennings, G.P. Jones, Rate of impositionof water stress alters the accumulation of nitrogen-containing solutes bywheat seedlings, Aust. J. Plant Physiol. 17 (1990) 653e664.
[12] H. Nayyar, Variation in osmoregulation in differentially drought-sensitivewheat genotypes involves calcium, Biol. Plant 47 (2003) 541e547.
[13] J.M. Morgan, Growth and yield of wheat lines with differing osmoregulativecapacity at high soil water deficit in seasons of varying evaporative demand,Field Crops Res. 40 (1995) 143e152.
[14] J.M. Morgan, Increases in grain yield of wheat by breeding for an osmoreg-ulation gene: relationship to water supply and evaporative demand, Aust. J.Agric. Res. 51 (2000) 971e978.
[15] R.A. Fischer, Growth and water limitation to dryland wheat yield in Australia:a physiological framework, J. Aust. Inst. Agric. Sci. 45 (1979) 83e94.
[16] J.M. Morgan, The Drought Tolerance Gene in Australian Wheat Cultivars - anOverview Update of Research in Progress at the Tamworth Centre for CropImprovement (2001) pp. 9e11.
[17] R. Del Cima, M.F. D’antuono, W.K. Anderson, The effects of soil type andseasonal rainfall on the optimum seed rate of wheat in Western Australia,Aust. J. Exp. Agric. 44 (2004) 585e594.
[18] J.S. Boyer, R.A. James, R. Munns, A.G. Condon, Osmotic adjustment leads toanomalously low estimates of relative water content in wheat and barley,Funct. Plant Biol. 35 (2008) 1171e1182.
[19] R. Munns, P.A. Wallace, N.L. Teakle, T.D. Colmer, Measuring soluble ionconcentrations (Naþ, Kþ, Cl�) in salt-treated plants Chapter 23. in:R. Sunkar (Ed.), Plant Stress Tolerance, Methods and Protocols. HumanaPress, 2010, pp. 371e382.
[20] T.W.M. Fan, T.D. Colmer, A.N. Lane, R.M. Higashi, Determination of metabolitesby 1H NMR and GC: analysis for organic osmolytes in crude tissue extracts,Anal. Biochem. 214 (1993) 260e271.
[21] B.P. Naidu, Separation of sugars, polyols, proline analogues, and betaines instressed plant extracts by high performance liquid chromatography andquantification by ultra violet detection, Aust. J. Plant Physiol. 25 (1998)793e800.
[22] E.M. Yemm, A.J. Willis, The estimation of carbohydrates in plant extracts byanthrone, Biochem. J. 57 (1954) 508e514.
[23] G.J. Rebetzke, R.A. Richards, Genetic improvement of early vigour in wheat,Aust. J. Agric. Res. 50 (1999) 291e301.
[24] J.M. Morgan, A.G. Condon, Water use, grain yield, and osmoregulation inwheat, Aust. J. Plant Physiol. 13 (1986) 523e532.
[25] A. Blum, Drought resistance, water-use efficiency, and yield potential - arethey compatible, dissonant, or mutually exclusive? Aust. J. Agric. Res. 56(2005) 1159e1168.
[26] T. Hsiao, L.K. Xu, Sensitivity of growth of roots versus leaves to water stress:biophysical analysis and relation to water transport, J. Exp. Bot. 51 (2000)1595e1616.
[27] M.M. Chaves, J.P. Maroco, J.S. Pereira, Understanding plant responsesto drought-from genes to the whole plant, Funct. Plant Biol. 30 (2003)239e264.
[28] J.R. Wilson, M.M. Ludlow, Time trends of solute accumulation and theinfluence of potassium fertilizer on osmotic adjustment of water-stressedleaves of three tropical grasses, Aust. J. Plant Physiol. 10 (1983)523e537.
[29] R.E. Sharp, T.C. Hsiao, W.K. Silk, Growth of the maize primary root at lowwater potentials, II. Role of growth and deposition of hexose and potassium inosmotic adjustment, Plant Physiol. 93 (1990) 1337e1346.
[30] D. Rhodes, A.D. Hanson, Quaternary ammonium and tertiary sulfoniumcompounds in higher plants, Annu. Rev. Plant Physiol. Plant Mol. Biol. 44(1993) 357e384.
[31] M.J. Raymond, N. Smirnoff, Proline metabolism and transport in maize seed-lings at low water potential, Ann. Bot. 89 (2002) 812e823.
[32] R. Munns, R. Weir, Contribution of sugars to osmotic adjustment in elongatingand expanded zones of wheat leaves during moderate water deficits at twolight levels, Aust. J. Plant Physiol. 8 (1981) 93e105.
[33] A. Sturm, G.Q. Tang, The sucrose cleaving enzymes of plants are crucial fordevelopment, growth and carbon partitioning, Trends Plant Sci. 4 (1999)401e407.
[34] M. Bajji, S. Lutts, J. Kinet, Water deficit effects on solute contribution toosmotic adjustment as a function of leaf ageing in three durum wheat (Tri-ticum durum Desf.) cultivars performing differently in arid conditions, PlantSci. 160 (2001) 669e681.
[35] A. Kameli, D.M. Lösel, Growth and sugar accumulation in durum wheat plantsunder water stress, New Phytol. 132 (1996) 57e62.
[36] J.M. Morgan, A gene controlling differences in osmoregulation in wheat, Aust.J. Plant Physiol. 18 (1991) 249e257.

S.A. Nio et al. / Plant Physiology and Biochemistry 49 (2011) 1126e1137 1137
[37] J.M. Morgan, M.K. Tan, Chromosomal location of a wheat osmoregulation geneusing RFLP analysis, Aust. J. Plant Physiol. 23 (1996) 803e806.
[38] G. Galiba, L. Simon-Sarkadi, G. Kocsy, A. Salgo, J. Sutka, Possible chromosomallocation of genes determining the osmoregulation of wheat, Theor. Appl.Genet. 85 (1992) 415e418.
[39] R.A. Richards, Physiological traits used in the breeding of new cultivars forwater-scarce environments, Agric. Water Manage. 80 (2006) 197e211.
[40] K. Xu, X. Xu, T. Fukao, P. Canlas, R. Maghirang-Rodriguez, S. Heuer, A.M. Ismail,J. Bailey-Serres, P.C.Ronald,D.J.Mackill, Sub1A is anethylene-response-factor-likegene that confers submergence tolerance to rice, Nature 442 (2006) 705e708.