Embed Size (px)
Citation preview

foumat of Ijnsure Research Copyright 20052005, Vot. 37, No. I, pp. 51-76 National Recreation and Park Association
Participation in School-Based Extracurricular Activitiesand Adolescent Adjustment
Nancy DarlingProgram in Psychology
Bard CollegeLinda L. Caldwell
School of Hotel, Restaurant, and Recreation ManagementThe Pennsylvania State University
Robert SmithDepartment of Human Development & Family Studies
The Pennsylvania State University
This paper examines the association between participation in school-based ex-tracurricular activities (ECAs) and adolescent adjustment (drinking, marijuanause, grades, academic attitudes and academic aspirations) among students fromsix high schools. Three major issues were addressed: the potential confoundingof selective ECA participation by better adjusted students and measures of ad-justment, variability in the strength of the association between ECA participa-tion and adjustment as a function of adolescent demographic characteristicsand activity type, and the role of peers as mediators of the association betweenECA participation and adjustment. Adolescents who participated in ECAs re-ported higher grades, more positive attitudes toward schools, and higher aca-demic aspirations once demographic characteristics and prior adjustment werecontrolled. Alcohol and marijuana use were not independently associated withECA participation. The ECA-adjustment association did not vary by demo-graphic characteristics and did not appear to be mediated by peer character-istics. Those who participated in non-sport ECAs reported consistently betteradjustment than those who did not participate in ECAs and those who partic-ipate in sports.
KEYWORDS: Extracurricular activities, adolescence, sport.
Leisure provides adolescents with unique developmental opportunities.Unlike other social contexts, most notably school (Eccles, Lord, & Buchanan,1996), leisure is a context in which adolescents are encouraged to managetheir own experiences by exerting personal control over their environmentsand acting autonomously (Brown & Theobald, 1998; Silbereisen & Eyferth,1986). Leisure also provides opportunities for identity exploration and skill
Address correspondence to: Nancy Darling, Program in Psychology, Bard College, Annandale-on-Hudson, NY 12504. Email: [email protected].
Author note: The author wishes to thank B. Bradford Brown, Sanford Dornbusch, andLaurence Steinberg for use of these data. Data collection was supported by grants to LaurenceSteinberg and B. Bradford Brown from the U.S. Department of Education through the NationalCenter on Effective Secondary Schools at the University of Wisconsin-Madison, and to SanfordM. Dornbtisch and P. Herbert Leiderman from the Spencer Foundation.
51
52 DARLING, CALDWELL AND SMITH
building (Kleiber, 1999) as well as both social differentiation and integration.This paper examines one class of adolescent leisure: school-based extracur-ricular activities. School-based extracurricular activities provide highly struc-tured leisure environments, in which adolescents can exert control and ex-press their identity through choice of activity and actions within the setting,but which do not normally facilitate experimentation with roles and activitiesthat are not sanctioned by adults. Because of these characteristics, partici-pation in school-based extracurricular activities provides many of the positivedevelopmental opportunities offered by other forms of leisure, but may pro-vide more protection against experimentation with problematic activitiessuch as drug or alcohol use than unstructured social leisure settings (Cald-well & Darling, 1999; Shann, 2001). In addition, participation in school-based extracurricular activities may provide adolescents access to social net-works, activities, resources, and equipment that would be otherwiseunavailable to them.
Mahoney and Stattin (2000) characterize highly structured activities asincluding "regular participation schedules, rule-guided engagement, direc-tion by one or more adult activity leaders, an emphasis on skill developmentthat is continually increasing in complexity and challenge, activity perform-ance that requires sustained active attention, and clear feedback on perform-ance" (pp. 114-115). These characteristics, according to Bronfenbrenner andMorris (1998) and Larson (2000), facilitate the development of initiative andlead to healthy adolescent development. Many school-based extracurricularactivities, such as sports, student publications, radio stations, or performinggroups, can be characterized as highly structured activities. Although outsideof the narrowly defined academic curriculum (e.g., math, science, socialstudies, and English), extracurricular activities have traditionally been of-fered by schools as a way to offer developmental and leadership opportuni-ties for youth, and to build school spirit (see, for example, Dewey, 1916).Extracurricular activities are seen as a way of offering academically giftedstudents a way of excelling within the school environment, a way for academ-ically challenged students to achieve within the school setting, and as a wayof creating a sense of shared community within schools. The positive impactthat "extracurricular" activities can have on a school's academic mission issometimes emphasized by use of the term "co-curricular" to describe non-academic school-based activities (e.g., Hovet & Vinton, 1993; Kezar & Mor-iarty, 2000; Wren, 1997), although the term "co-curricular" is sometimes lim-ited to activities outside of the classroom explicitly designed to complementstudent learning.
Extracurricular activities have been touted by their proponents as ena-bling youths to socialize with peers and adults, set and achieve goals, competefairly, recover from defeat, and resolve disputes peaceably (Carnegie Cor-poration of New York, 1992; Danish & CuUotta, 2000). At the psychologicallevel, Dworkin, Larson, and Hansen (2003) argue that extracurricular activ-ities stand out from other aspects of adolescents' lives at school because theyprovide opportunity for identity work, develop initiative, and allow youth to
EXTRACURRICULAR ACTIVITIES AND ADOLESCENT ADJUSTMENT 53
learn emotional competencies and develop new social skills. At a more macrolevel, they argue that activity participation also allows youth to form newconnections with peers and acquire social capital. In addition, extracurric-ular activities are one ofthe few contexts in which adolescents regularly comein contact with unrelated adults outside of the classroom (for review, seeDarling, Hamilton, & Shaver, 2003).
The benefits of participating in structured leisure activities are certainlynot limited to school-based extracurricular activities. However, school-basedextracurricular activities are unique in several ways. First, they are one of thefew aspects of leisure actively promoted by schools and are thus amenableto programmatic and social policy initiatives. For example, requirements forart, music, and physical education may expose youth to experiences that theymay not have at home, encourage them to enroll in school-based extracur-ricular activities such as band, theater, or sports, and enrich their leisureoutside of school. Many courses outside the traditional academic curriculumare designed specifically to provide youth with skills that will last a lifetime.Voluntary participation in school-sponsored extracurricular activities pro-vides similar advantages. Although most extracurricular activities are offeredafter school, sometimes as part of an extended-care initiative for older youth,some schools allow students to participate in teacher-sponsored extracurric-ular activities during what would otherwise be traditional study halls (e.g.,Butler & Manning, 1998). These "exploratories" allow students to engage inactivities such as reading, magic, juggling, model building, knitting, or wood-working. Second, and most importantly for the purpose of this investigation,there are strong theoretical reasons for arguing that expanding adolescents'ties to the school through participation in extracurricular activities will en-hance students' bonds to their school as an institution, increase social con-trol over the individuals involved, and increase positive network ties to bothteachers and to students (see, McNeal (1995) for a full discussion of thistopic).
In sum, structured leisure experiences offer many potential benefits toyouth. There may be logistical and practical advantages to offering youth theopportunity to participate in structured leisure in the context of school-basedextracurricular activides. In addition, participation in leisure activities in theschool setting may help foster additional emotional bonds to the school, createopportunities for emotional bonding to teachers and other school-associatedadults in a context outside of the classroom, and thus increase students'emotional commitment to school and the adult-sanctioned values associatedwith schools (Hirschi, 1969). Extracurricular activities also provide youth theopportunity to associate with peers different from those they encounter athome and in the classroom.
Recent studies have documented the association of participation inschool-based extracurricular activities with higher levels of academic com-mitment and better academic performance (Cooper, Valentine, Nye, & Lind-say, 1999; Eccles & Barber, 1999; Jordan & Netdes, 1999), lower rates of highschool dropout (Davalos, Chavez, & Guardiola, 1999; Mahoney & Cairns,
54 DARLING, CALDWELL AND SMITH
1997; Mahoney & Stattin, 2000; McNeal, 1995), and lower levels of delin-quency and arrests (Cooley, Henriksen, Van Nelson, & Thompson, 1995;Eccles & Barber, 1999; R. Larson, 1994; Mahoney, 2000; Mahoney & Stattin,2000). Participation in extracurricular activities also facilitates the develop-ment of positive social reladons across ethnic groups (Khmelkov & Hallinan,1999), particularly for boys. These results are consistent with Holland andAndre's (1987) review of more than thirty earlier studies of extracurricularactivities. Although some researchers and policymakers (e.g.. Brown & Theo-bald, 1998; Carnegie Corporation of New York, 1992; Mahoney & Cairns,1997) have advocated school-based extracurricular acdvities as a context thatboth promotes positive youth development and protects youth from risksassociated with unsupervised free dme, this context has received litde atten-tion from researchers interested in the broader issue of leisure in the livesof adolescents. The lack of a strong theoretical foundadon for the roles ofactivities and leisure within developmental psychology in the United States(Silbereisen & Eyferth, 1986) and the marginal place of extracurricular ac-tivities within educational research (Brown & Theobald, 1998) have also con-tributed to this neglect. In addition to its theoretical interest, research doc-umendng the benefits of extracurricular activities and other leisure-relatedcourses are critical at a dme when many school administrators are facingstrong pressure to cut all activities that do not directly contribute to the coreacademic curriculum (for example, see Deasy, 2003). In addidon to financialconcerns, increasing paperwork loads and emphasis on standardized test per-formance have created time pressure on teachers and worries that "frills"will distract students from academics.
Critics of the extant literature on the association of extracurricular ac-dvity participation and adolescent development have noted two importantlimitations. First, much of this research is cross-sectional and thus the ob-served relationship between extracurricular activity participation and positiveadolescent outcomes could result from selecdve pardcipation, rather thanfrom participadon per se. For example, youth who are more positively ori-ented toward adult values, such as school success, are more likely to chooseto pardcipate in extracurricular activities (Rigsby & McDill, 1975). In addi-don, to the extent that participation is dependent upon auditions, tryouts,minimum GPA, cost, or other restrictions, students who participate in extra-curricular activides are likely to evince more positive outcomes than theirnon-participating peers (Burnett, 2000). Second, the effect sizes observedare small (Holland & Andre, 1987). Although the literature has consistendydocumented posidve outcomes associated with pardcipation in school-basedextracurricular activities, the magnitude of the difference between partici-pants and non-participants is quite small.
This study addressed five questions relevant to these two limitations: (1)Is pardcipadon in school-based extracurricular activides associated with in-dicators of adolescent adjustment? (2) Can the associadon between partici-pation in extracurricular activities and adolescent outcomes be documented
EXTRACURRICULAR ACTIVITIES AND ADOLESCENT ADJUSTMENT 5 5
controlling for such selecdon factors as demographic characterisdcs andprior adjustment? (3) Is participation more beneficial for some demographicgroups than for others and for those who are at relatively higher risk fordifficulties in adjustment? (4) Is participation in sports associated with thesame benefits as participation in non-sport activides? and (5) Is the associa-tion of extracurricular activity participation with adjustment mediatedthrough characteristics of the adolescent peer group?
Three indicators of positive adolescent adjustment (grades, attitude to-ward school, and academic aspirations) and two indicators of problematicadjustment (alcohol use and marijuana use) were assessed. These indicatorswere chosen to represent the protective functions attributed to extracurric-ular activides as well as their positive potential to bind youth to the school.The goal of the first two research questions was to address the issue of se-lective participation. Because variability in individuals and activides may helpto explain the small observed effect sizes. Questions 3 and 4 are designed toassess whether the association between participation and indicators of ad-justment are uniform across individuals with different characteristics and indifferent social contexts and whether the association is the same for differenttypes of activities. Question 5 was designed to illuminate the process throughwhich extracurricular activity participation may influence adolescent devel-opment. Literature related to these questions will be reviewed in the nextsection.
Related Literature
Questions 1 and 2: Selection
Can the association between participation in extracurricular activitiesand adolescent adjustment be documented over and above factors that pre-dispose adolescents to pardcipate? Perhaps one reason that extracurricularactivity participation has received less attention from researchers than mightbe warranted is that it is clear that adolescents who choose (and are chosen)to pardcipate in school-based extracurricular activities differ from non-pardcipants, making causal connections difficult to establish. Adolescentswho participate in school-based extracurricular acdvides tend to be of highersocial class, European-American, and more positively oriented to school com-pared to their peers (McNeal, 1998). Both rates of pardcipation and the typeof activity participated in vary by gender and grade (McNeal, 1999) in rathercomplicated ways. Girls are more likely to participate in all classes of extra-curricular activides except for sports. Compared to younger students, olderstudents are relatively more likely to be involved in non-sport activities, al-though older students become more dominant in varsity athletics. In addi-tion, adolescents who participate in school-based activities are more orientedtoward adult standards and are more likely to come from authoritadve fam-ilies (Durbin, Darling, Steinberg, & Brown, 1993). Because social class, raceand ethnicity, school orientation, gender, and grade are each associated with
56 DARLINC, CALDWELL AND SMITH
both participation and adjustment, it is difficult to untangle causal relation-ships between participation and adolescent adjustment from selection ef-fects.
Longitudinal studies examining the relationships provide more convinc-ing evidence of a causal association between extracurricular activity partici-pation and adjustment. Mahoney and Cairns (1997) found that early dropoutrates were markedly lower among high risk adolescents who had pardcipatedin at least one extracurricular activity during middle or early high schoolcompared to those who had not. In a paper explicitly examining selecdoneffects, Mahoney (2000) tested the hypothesis that early competence mayhave discriminated between those high risk youth who went on to becomeinvolved in extracurricular acdvities from tbose who did not. Within the highrisk cluster, there was only marginal evidence for such a selection effect.Eccles and Barber (1999) also used a longitudinal design to control for earlybackground characteristics and documented that activity participadon wasassociated with subsequent academic achievement and orientation and prob-lem behavior.
These analyses presented in this paper used a longitudinal design toexamine two classes of individual and contextual characteristics that providealternative explanations for the association between pardcipadon in extra-curricular activities and adolescent adjustment: demographic characterisdcs(grade, gender, parent education, and ethnicity) and prior adolescent ad-
justment. Controlling for demographic characterisdcs and prior adolescentadjustment provides a replication of prior research (e.g., Eccles & Barber,1999; Mahoney, 2000) in a larger and more socially diverse sample.
Questions 3: Variation as a Eunction of Demographic Characteristics
Mahoney (2000) has suggested that heterogeneity across extracurricularactivities and in the effect of extracurricular activities across people are tworeasons why associations between extracurricular activity participation andadolescent outcomes are small. This study tests that hypothesis by examiningpotential moderators between participation and adolescent adjustment. Var-iability in the relationship between extracurricular activity participation andadjustment was examined across four demographic characteristics (gender,ethnicity, parents' education, and grade).
Activity pardcipadon varies markedly as a function of demographic char-acterisdcs. Does pardcipation have the same benefits for members of differ-ent subgroups? Some researchers have hypothesized that one process un-derlying the association of extracurricular activity participation with positiveoutcomes is that it exposes adolescents to new opportunities (Brown & Theo-bald, 1998). In addition, extracurricular activities, like other protectivefactors (Bronfenbrenner & Morris, 1998; Rutter, Champion, Quinton,Maugham, & Pickles, 1995) may be particularly beneficial to those youthwho are at risk for poor adjustment or who have access to fewer resources.With regards to the adjustment indicators assessed here, this would be stu-
EXTRACURRICULAR ACTIVITIES AND ADOLESCENT ADJUSTMENT 57
dents at heightened risk for alcohol and marijuana use, poor grades, morenegative attitudes toward school, and lower academic aspirations. To the ex-tent that participation benefits at-risk adolescents more than adolescents notat risk, looking only at main effects across the whole population would sup-press observed effect sizes. For example, if European-American adolescentswith highly educated parents are able to access resources and be exposed topositive adult role models who value education through their home andneighborhood environments, addidonal access available to them throughextracurricular activities may provide few additional benefits with regards tothe indicators of adjustment assessed here. (Note, however, that this may notbe true with regards to other potential benefits, such as identity explorationor the development of new skills.)
The idea that at-risk populations will differendally benefit from expo-sure to highly structured leisure settings is consistent both with empiricalresearch (e.g., Mahoney & Stattin, 2000) and with ecological systems theory(e.g., Bronfenbrenner 8c Morris, 1998). Werner and Smith found that "Par-ticipation in extracurricular activities played an important part in the livesof the resilient youths, especially activides that were cooperative enterprises. . ." (1982/1989, p. 505), where resilient youths were defined as those whowere at high risk for adjustment problems, but who did not evince theseproblems. Based on this general principle, we predicted that participationin extracurricular activities will be (1) a relatively stronger predictor of allaspects of adolescent adjustment for youth whose parents are less educated;(2) a stronger predictor of academic adjustment (grades, attitudes towardschool, and academic aspirations) for African-American and Hispanic-American youth than for Asian-American and European-American youth; (3)a stronger predictor of drinking and marijuana use for European-Americanyouth than for youth of other backgrounds; and (4) a stronger predictor ofacademic adjustment for younger adolescents than older adolescents. Thelatter prediction is based on the notion that the social integration and net-work ties provided by participation in extracurricular activities may be par-ticularly beneficial for students who are moving to a new school environmentand may buffer them from the decline in academic adjustment normallyassociated with such a transition (Simmons 8c Blyth, 1987). Greater exposureto older peers through activity participation, however, may offset this advan-tage with regard to drinking and marijuana use (Simmons & Blyth, 1987).No specific hypotheses were developed about the differential association ex-tracurricular activities and adjustment as a function of gender.
Question 4: Variation as a Eunction of Activity Type
Is participation in sports more beneficial than participation in othertypes of extracurricular activities? Adolescents are more likely to participatein sports than in any other type of school-based extracurricular activity.Sports may be particularly beneficial for adolescents because they "representphysical and mental challenge, and provide an identity based on a sense of
58 DARLING, CALDWELL AND SMITH
competence and/or identification with a social group" (Shaw, Kleiber, &Caldwell, 1995, p. 247). Sports-related activities are (a) explicitly goal di-rected, (b) driven by competition, and (c) place adolescents in high statuspeer groups, all of which may promote greater well-being in adolescents thanparticipation in activities that provide less status (Cusick, 1973; Morgan &Alwin, 1980). On the other hand, participation in sports has been associatedwith greater use of alcohol, although lower use of other drugs (Shaw et al.,1995; Swisher 8c Hu, 1983). In a longitudinal study of middle to workingclass adolescents, Larson (1994) found that participation in arts and hobbies,as well as participation in youth organizations (e.g., student council, band,church groups), was associated with reduced levels of delinquency, whereasparticipation in athletic activities was not. Thus we hypothesized that adoles-cents who participate in sports will have higher rates of alcohol and mari-juana use than non-participants, while those who participate in other formsof extracurricular activities will be less involved in substance use. We pre-dicted participation in both sports and non-sport activities would be associ-ated with more positive academic adjustment.
Question 5: Peers and Extracurricular Activity Participation
One potential mediator of the observed relationship between extracur-ricular activity participation and adolescent outcomes is change in social net-work composition. Some researchers have hypothesized that one process un-derlying the association of extracurricular activity participation with positiveadjustment is contact with peers who are more positively oriented towardschool and less involved in deviance (e.g.. Brown & Theobald, 1998; Eccles& Barber, 1999; Mahoney & Stattin, 2000). This study investigated two char-acteristics of adolescent social networks as potential mediators of the asso-ciation between participation and adolescent outcomes: the extracurricularactivity participation rates and the adjustment of the adolescents' closefriends. If peer participation rates mediated the association between individ-ual participation and adjustment, it would suggest that the underlying proc-ess is one of a change in social networks. An observed mediational effect ofpeer characteristics between individual participation and outcomes would beconsistent with both the socialization hypothesis as well as with potentialselection effects.
Methods
Sampk
This study is a secondary data analysis of a larger survey study of thecontribution of non-school factors to academic performance, psychosocialdevelopment, and problem behavior (for a description of the larger goalsand results of the project, see Steinberg, Darling, & Fletcher, 1995). Thelarger study was carried out in nine high schools in California and Wisconsinfrom 1987-1991. Questionnaires focused on family and peer relationships.
EXTRACURRICULAR ACTIVITIES AND ADOLESCENT ADJUSTMENT 59
crowd membership, extracurricular activities, and neighborhood residence.Because of limitations of the variables available in the original data, theseanalyses rely on data from the six high schools in California that were col-lected during the 1987-1988 and 1989-1990 school years (hereafter referredto as Year 1 and Year 2, respectively). Participating schools were selected toinclude youth from a range of socioeconomic backgrounds (working, mid-dle, and upper class), community types (rural, suburban, urban), and ethnicand racial backgrounds. The proportion of parents who had graduated fromcollege ranged from 18% to 64% across the schools. European-Americanstudents were the largest racial/ethnic group in all schools, ranging from42% to 67% of the population at each school. Asian-American students werenext most frequent, ranging from 10% to 40% of school populations.Hispanic-American students ranged from 8% to 29% of schools' populations.African-American youth made up between 2% and 12% of the populationsof the schools in this study. Youth of Middle Eastern and Native Americanbackgrounds made up less than 1% of the population at each the six schoolsand were eliminated from these analyses.
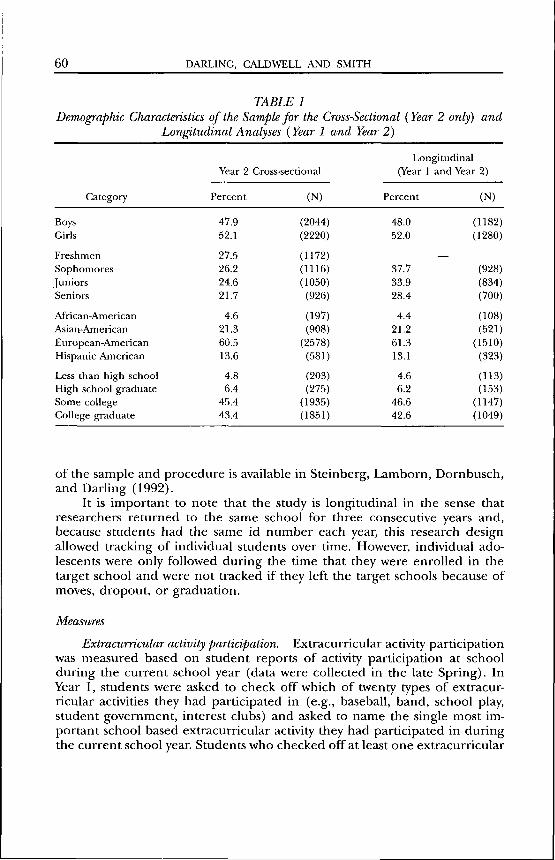
To allow for comparisons between the cross-sectional and longitudinalmodels, all cross-sectional analyses are performed using the Year 2 data andall longitudinal analyses using Year 1 and Year 2. Four thousand two hundredand sixty-four students participated in the cross-sectional component of thisstudy (Year 2), provided complete data on the variables of interest in thisinvestigation, and were used in these analyses. Two thousand four hundredand sixty-two participated in both Year 1 and Year 2 and were included inthe longitudinal analyses. In addition to normal attrition, this difference in-cludes the elimination of all students who were freshmen at Year 2, and thuswere not in the study at Year 1. A description of the demographic charac-teristics of the cross-sectional and longitudinal sample is provided in Table1. Demographic characteristics of the two samples are markedly similar, savefor the elimination of students who were freshmen at Year 2 from longitu-dinal analyses.
Procedure
Identical procedures were used to gather data each year of the study.All students in participating schools were invited to complete a self-reportquestionnaire that focused on school-related behaviors (e.g., academicachievement, engagement in classes, extracurricular participation) but alsoincluded measures of family relationships and parenting behaviors, peer re-lationships, deviance, and psychological adjustment. Questionnaires were ad-ministered in English. Because of its length, the questionnaire was dividedinto two sections administered on separate days. Active consent was obtainedfrom the adolescents and passive consent obtained from the parents. Ap-proximately 4% of students in attendance on days of questionnaire admin-istration chose not to participate in the study. Approximately 15% of studentswere absent on each day of questionnaire administration. A full description
60 DARLING, CALDWELL AND SMITH
TABLE 1Demographic Characteristics of the Sample for the Cross-Sectional (Year 2 only) and
Longitudinal Analyses (Year 1 and Year 2)
Category
BoysGirls
FreshmenSophomoresJuniorsSeniors
African-AmericanAsian-AmericanEuropean-AmericanHispanic American
Less than high schoolHigh school graduateSome collegeCollege graduate
Year 2
Percent
47.952.1
27.526.224.621.7
4.621.360.513.6
4.86.4
ibA43.4
Cross-sectional
(N)
(2044)(2220)
(1172)(1116)(1050)(926)
(197)(908)
(2578)(581)
(203)(275)
(1935)(1851)
Longitudinal(Year 1 and Year 2)
Percent
48.052.0
37.733.928.4
4.421.261.313.1
4.66.2
46.642.6
(N)
(1182)(1280)
(928)(834)(700)
(108)(521)
(1510)(323)
(113)(153)
(1147)(1049)
of the sample and procedure is available in Steinberg, Lamborn, Dornbusch,and Darling (1992).
It is important to note that the study is longitudinal in the sense thatresearchers returned to the same school for three consecutive years and,because students had the same id number each year, this research designallowed tracking of individual students over time. However, individual ado-lescents were only followed during the time that they were enrolled in thetarget school and were not tracked if they left the target schools because ofmoves, dropout, or graduation.
Measures
Extracurricular activity participation. Extracurricular activity participationwas measured based on student reports of activity participation at schoolduring the current school year (data were collected in the late Spring). InYear 1, students were asked to check off which of twenty types of extracur-ricular activities they had participated in (e.g., baseball, band, school play,student government, interest clubs) and asked to name the single most im-portant school based extracurricular activity they had participated in duringthe current school year. Students who checked off at least one extracurricular

EXTRACURRICULAR ACTIVITIES AND ADOLESCENT ADJUSTMENT 61
activity or who named a single most important extracurricular activity wereclassified as participants. Those who neither checked off nor named an ac-tivity were classified as non-participants. In Year 2, students were asked howmany hours they typically spend on school-sponsored extracurricular activi-ties and which activity was the most important to them. Students were clas-sified as participants either if they indicated spending time on school-sponsored extracurricular activities or if they named an activity. Students whodid not indicate spending any time on activities and did not name an activitywere classified as non-participants.
In order to examine the effects of these measurement differences, wecalculated participation rates for all students who participated in each yearof the original study (thus eliminating differences due to lack of freshmenin the longitudinal study, selective attrition, and other factors). In this fullsample, 66% of students were classified as having participated in an extra-curricular activity in Year 1 and 58% were classified as participants in Year2. Although it is possible that this difference is due to a true change inparticipation, it is more likely that the listing of specific activities in Year 1prompted reporting of less salient activities. Because the focus year of thestudy is Year 2, and it is possible that the way participation was measuredresulted in an under reporting of actual participation, the results of theseanalyses may be somewhat conservative in their estimates of the differencesbetween participants and non-participants. The nature of the data precludesconstructing measures of more differentiated aspects of activity involvement,such as emotional commitment.
The proportion of students in each school reporting that they partici-pated in extracurricular activities ranged from 45% to 63%. This did notvary systematically with the demographic character of the school, however,the two schools with the lowest participation rates (45% and 47%, respec-tively) also had the highest proportion of Hispanic-American students (27%and 22%, respectively).
Activity type. For descriptive purposes, the most important activitiesnamed were classified into four categories: sports (varsity and non-varsityteam and individual sports, including cheerleaders and pom-pom squads),performing groups (e.g., band, choir, school play), leadership groups (e.g.,student government, service club, prom committee), and interest clubs (e.g.,debate, student publications). These four categories were then coded intosports and non-sport. Five percent of activities had originally been coded as"other" and could not be further categorized.
Grade, gender, parent education, and ethnicity. Adolescents self-reportedon grade (freshman through senior), gender (male/female), parents' edu-cation, and racial/ethnic background. To assess parent education, adoles-cents were asked to report on the highest level of education each of theirparents and stepparents had completed in eight categories ("some gradeschool" to "professional or graduate degree"). This information was recodedinto four categories: (1) did not complete high school, (2) high school grad-
62 DARLING, CALDWELL AND SMITH
uate, (3) some college or training beyond high school, and (4) college de-gree. A mean was taken of the education reported of the parents with whomthe adolescent was living and classified into the same four categories.
Adolescents were asked to "Select one ethnic background that bests de-scribes you" from 18 listed racial and ethnic groups. Adolescents were clas-sified as African-American if they self-identified as "Black, African, Afro-American." They were classified as European-American if they self-identifiedas "White (Non-Hispanic), Anglo, Caucasian, European." They were classi-fied as Asian-American if they self-identified as any of the following: Chinese,Filipino, Japanese, Korean, Vietnamese, Other South East Asian, SouthAsian, or Pacific Islander. They were classified as Hispanic-American if theyself-identified as any of the following: Mexican, Mexican-American, Chicano,Central American, Puerto Rican, Cuban, Other Caribbean, or South Amer-ican. Although there are important nuances in the difference between useof the terms "race" and "ethnicity", these data do not allow for us to makethese distinctions. We followed the conventions advocated by federal guide-lines (e.g.. National Center for Chronic Disease Prevention and Health Pro-motion, 2002) and used the term "ethnicity" to describe these classificationsbecause it reflects (a) the racially diverse character of the Hispanic-Americanclassification and (b) the fact that classifications were based on self-identification.
Alcohol and marijuana use. Adolescents were asked to report how oftenthey had used alcohol and how often they had smoked marijuana since thebeginning of the school year. The response format was a four point scalefrom 1 = never to 4 = often. Mean alcohol use was 1.7 (sd = 1.0) and meanmarijuana use was 1.4 (sd = .8).
Academic adjustment. Three measures were used to assess academic ad-justment. Students' self-reports of last term grades in math, English, socialstudies, and science on a conventional four-point scale were averaged tocreate a measure grades (mean = 3.0, sd = .8). Previous work indicates thatself-reported grades and actual grades taken from official school records arehighly correlated (r = .80, Dornbusch, Ritter, Leiderman, Roberts, & Fral-eigh, 1987). Adolescents' attitudes toward school were measured using a six-item scale (Steinberg et al., 1992) in which students reported on their valueand commitment to school on a 4-point scale from 1 (strongly agree) to 4(strongly disagree); sample item: "I feel satisfied with school because I'mlearning a lot." (a = .69). Responses were recoded and averaged, with higherscores reflecting more positive school orientation (mean = 2.5, sd = .5).Academic aspirations were measured by asking adolescents "Consideringyour situation, what is the highest level that you really expect to reach inschool?" Adolescents were offered six choices coded from 1 ("leave schoolas soon as possible") to 6 ("finish college and take further training (medical,law, graduate school, etc."). Mean level of academic aspiration was 5.1 (sd= 1.1).
Adjustment and extracurricular activity participation of friends. As part ofthe questionnaire, adolescents were asked to "print the first and last namesof your five closest friends in the school (the students you hang around with

EXTRACURRICULAR ACTIVITIES AND ADOLESCENT ADJUSTMENT 6 3
the most)" and reminded that their answers were "absolutely confidential."Senior coders took the names provided and linked names to the id numbersused in the study. Because approximately 85% of the students in each schoolparticipated in the study, this technique allowed us to link information pro-vided by each adolescent to information provided by most of the friends thatthey named. Measures of friend adjustment and friend activity participationare thus not self-report, but calculated from data provided by the friendsthemselves. Note that with this technique, all data used to calculate thesemeasures were provided by individuals who actively consented to participatein the study and reported only about themselves. Friend activity participationin extracurricular activities was measured by counting the number of namedpeers who reported participating in at least one extracurricular activity. Fiveaspects of friend adjustment were measured: drinking, marijuana use, grades,attitude toward school, and academic aspirations, using tiie same methodsas was used to measure adjustment for the target adolescent. A mean scoreof friend self-reports was calculated for each aspect of adjustment.
Results
Preliminary Descriptive Analyses
Preliminary descriptive analyses were performed examining the types ofextracurricular activities students named as most important. In order of fre-quency, the most common activities listed by students included in the cross-sectional sample were: baseball and basketball (7% each), band and chorus(combined), swim team, soccer, and football (6% each), track and tennis(5% each), school play, cheerleading, student government, wrestling, andpom-pom squad (3% each).
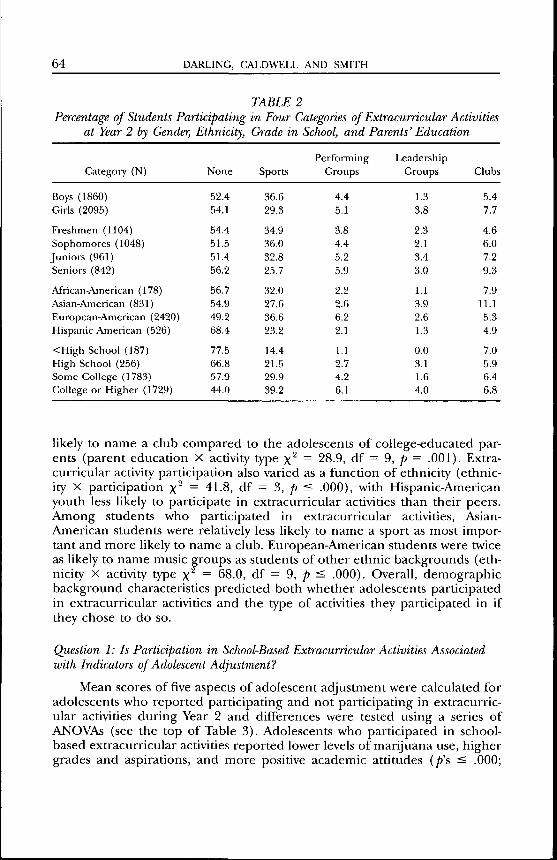
Because previous research has documented marked differences in ex-tracurricular activity participation as a function of demographic character-istics, the proportion of adolescents who reported participating in four typesof extracurricular activities or in no activities was calculated by gender, gradein school (freshman through senior), parents' education, and ethnicity. Re-sults are reported in Table 2. Patterns of participation covaried with all dem-ographic predictors. Overall, boys were slightly more likely to participate inextracurricular activities than girls (gender X participation x^ = 5-1, df =\, p = .02). Among those who participated, boys were more likely than girlsto name a sport as their most important activity and less likely to name otheractivities (gender X activity type x^ — 48.7, df = 3, jb :̂ .000). There was nodifference in extracurricular activity participation by grade (grade X partic-ipation x^ = 5.6, df = 3, p > .05). However, younger students who partici-pated were more likely than older students to name a sport as their mostimportant activity, while seniors were twice as likely as freshmen to name aclub (grade X activity type x^ — 41.4, df = 9, p ^ .000). Adolescents whoseparents had less education were markedly less likely to participate than theirpeers from more highly educated families (parents education X participationx'"̂ = 119.0, df = 2), p ^ .000). Participating adolescents whose parents wereless educated were less likely to name a sport as most important and more
64 DARLING, CALDWELL AND SMITH
TABLE 2Percentage of Students Participating in Four Categories of Extracurricular Activities
at Year 2 by Gender, Ethnicity, Grade in School, and Parents' Education
Category (N)
Boys (1860)Girls (2095)
Freshmen (1104)Sophomores (1048)Juniors (961)Seniors (842)
African-American (178)Asian-American (831)European-American (2420)Hispanic American (526)
<High School (187)High School (256)Some College (1783)Gollegeor Higher (1729)
None
52.454.1
54.451.551.456.2
56.754.949.268.4
77.566.857.944.0
Sports
36.629.3
34.936.032.825.7
32.027.636.623.2
14.421.529.939.2
PerformingGroups
4.45.1
3.84.45.25.9
2.22.66.22.1
1.12.74.26.1
LeadershipGroups
1.33.8
2.32.13.43.0
1.13.92.61.3
0.03.11.64.0
Glubs
5.41.1
4.66.07.29.3
7.911.15.34.9
7.05.96.46.8
likely to name a club compared to the adolescents of college-educated par-ents (parent education X activity type x^ = 28.9, df = 9, /> = .001). Extra-curricular activity participation also varied as a function of ethnicity (ethnic-ity X participation x^ = 41.8, df = 3, ^ < .000), with Hispanic-Americanyouth less likely to participate in extracurricular activities than their peers.Among students who participated in extracurricular activities, Asian-American students were relatively less likely to name a sport as most impor-tant and more likely to name a club. European-American students were twiceas likely to name music groups as students of other ethnic backgrounds (eth-nicity X activity type x^ = 68.0, df = 9, /> < .000). Overall, demographicbackground characteristics predicted both whether adolescents participatedin extracurricular activities and the type of activities they participated in ifthey chose to do so.
Question 1: Is Participation in School-Based Extracurricular Activities Associatedwith Indicators of Adolescent Adjustment?
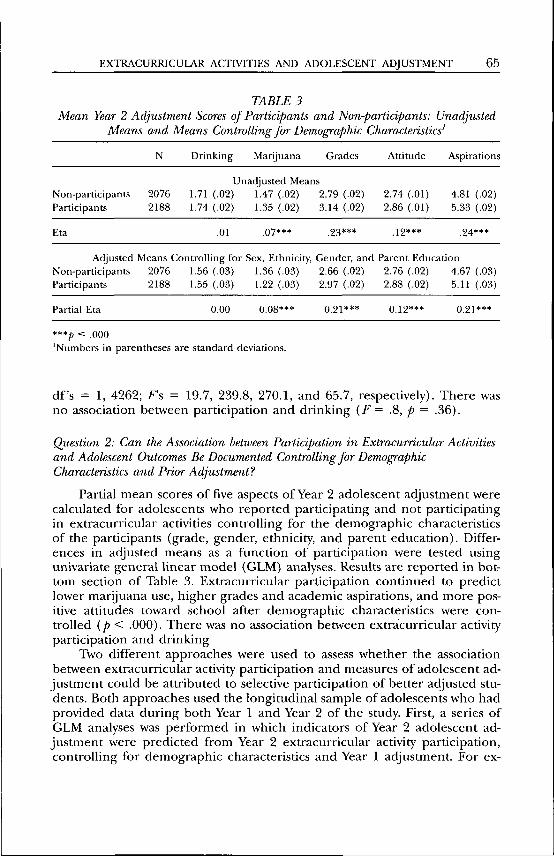
Mean scores of five aspects of adolescent adjustment were calculated foradolescents who reported participating and not participating in extracurric-ular activities during Year 2 and differences were tested using a series ofANOVAs (see the top of Table 3). Adolescents who participated in school-based extracurricular activities reported lower levels of marijuana use, highergrades and aspirations, and more positive academic attitudes {p's < .000;
EXTRACURRICULAR ACTIVITIES AND ADOLESCENT ADJUSTMENT 65
TABLE 3Mean Year 2 Adjustment Scores of Participants and Non-farticipants: Unadjusted
Means and Means Controlling for Demographic Characteristics'
Non-participantsParticipants
Eta
AdjustedNon-participantsParticipants
Partial Eta
N
20762188
Means20762188
Drinking Marijuana Grades
Unadjusted Means1.71 (.02) 1.47 (.02) 2.79 (.02)1.74 (.02) 1.35 (.02) 3.14 (.02)
.01
Controlling for1.56 (.03)1.55 (.03)
0.00
.07***
Sex, Ethnicity,1.36 (.03)1.22 (.03)
0.08***
.23***
Gender, and2.66 (.02)2.97 (.02)
0.21***
Attitude
2.74 (.01)2.86 (.01)
.12***
Aspirations
4.81 (.02)5.33 (.02)
.24***
Parent Education2.76 (.02) 4.67 (.03)2.88 (.02) 5.11 (.03)
0.12*** 0.21***
***p •& .000
'Ntimbers in parentheses are standard deviations.
df's = 1, 4262; Fs = 19.7, 239.8, 270.1, and 65.7, respectively). There wasno association between participation and drinking {E = .8, p = .36).
Question 2: Can the Association between Participation in Extracurricular Activitiesand Adolescent Outcomes Be Documented Controlling for DemographicCharacteristics and Prior Adjustment?
Partial mean scores of five aspects of Year 2 adolescent adjustment werecalculated for adolescents who reported participating and not participatingin extracurricular activities controlling for the demographic characteristicsofthe participants (grade, gender, ethnicity, and parent education). Differ-ences in adjusted means as a function of participation were tested usingunivariate general linear model (GLM) analyses. Results are reported in bot-tom section of Table 3. Extracurricular participation continued to predictlower marijuana use, higher grades and academic aspirations, and more pos-itive attitudes toward school after demographic characteristics were con-trolled {p < .000). There was no association between extracurricular activityparticipation and drinking
Two different approaches were used to assess whether the associationbetween extracurricular activity participation and measures of adolescent ad-justment could be attributed to selective participation of better adjusted stu-dents. Both approaches used the longitudinal sample of adolescents who hadprovided data during both Year 1 and Year 2 of the study. First, a series ofGLM analyses was performed in which indicators of Year 2 adolescent ad-justment were predicted from Year 2 extracurricular activity participation,controlling for demographic characteristics and Year 1 adjustment. For ex-
66 DARLING, CALDWELL AND SMITH
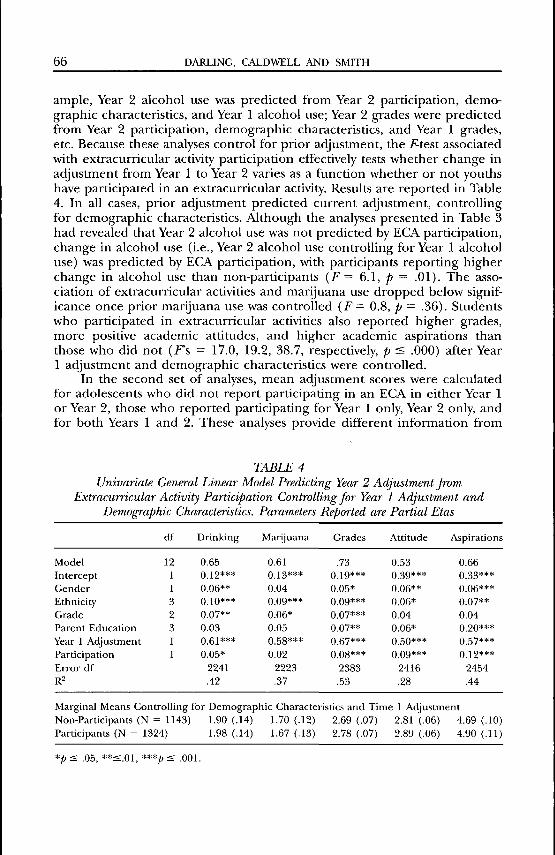
ample, Year 2 alcohol use was predicted from Year 2 participation, demo-graphic characteristics, and Year 1 alcohol use; Year 2 grades were predictedfrom Year 2 participation, demographic characteristics, and Year 1 grades,etc. Because these analyses control for prior adjustment, the F-test associatedwith extracurricular activity participation effectively tests whether change inadjustment from Year 1 to Year 2 varies as a function whether or not youthshave participated in an extracurricular activity. Results are reported in Table4. In all cases, prior adjustment predicted current adjustment, controllingfor demographic characteristics. Although the analyses presented in Table 3had revealed that Year 2 alcohol use was not predicted by ECA participation,change in alcohol use (i.e.. Year 2 alcohol use controlling for Year 1 alcoholuse) was predicted by ECA participation, with participants reporting higherchange in alcohol use than non-participants {F = 6.1, p = .01). The asso-ciation of extracurricular activities and marijuana use dropped below signif-icance once prior marijuana use was controlled {F = 0.8, p = .36). Studentswho participated in extracurricular activities also reported higher grades,more positive academic attitudes, and higher academic aspirations thanthose who did not {Fs = 17.0, 19.2, 38.7, respectively, p < .000) after Year1 adjustment and demographic characteristics were controlled.
In the second set of analyses, mean adjustment scores were calculatedfor adolescents who did not report participating in an ECA in either Year 1or Year 2, those who reported participating for Year 1 only. Year 2 only, andfor both Years 1 and 2. These analyses provide different information from
TABLE 4Univariate General Linear Model Predicting Year 2 Adjustment from
Extracurricular Activity Participation Controlling for Year 1 Adjustment andDemographic Characteristics. Parameters Reported are Partial Etas
ModelInterceptGenderEthnicityGradeParent EducationYear 1 AdjustmentParticipationError dfR2
df
121132311
Drinking
0.650.12***0.06**0.10***0.07**0.030.61***0.05*
2241.42
Marijuana
0.610.13***0.040.09***0.06*0.050.58***0.02
2223.37
Grades
.730.19***0.05*0.09***0.07***0.07**0.67***0.08***
2383.53
Attitude
0.530.39***0.06**0.06*0.040.06*0.50***0.09***
2416.28
Aspirations
0.660.33***0.06***0.07**0.040.20***0.57***0.12***
2454.44
Marginal Means Controlling for Demographic Characteristics and Time 1 AdjustmentNon-Participants (N = 1143) 1.90 (.14) 1.70 (.12) 2.69 (.07) 2.81 (.06) 4.69 (.10)Participants (N = 1324) 1.98 (.14) 1.67 (.13) 2.78 (.07) 2.89 (.06) 4.90 (.11)
*p s .05, **s.Ol, ***p £ .001.
EXTRACURRICULAR ACTIVITIES AND ADOLESCENT ADJUSTMENT 67
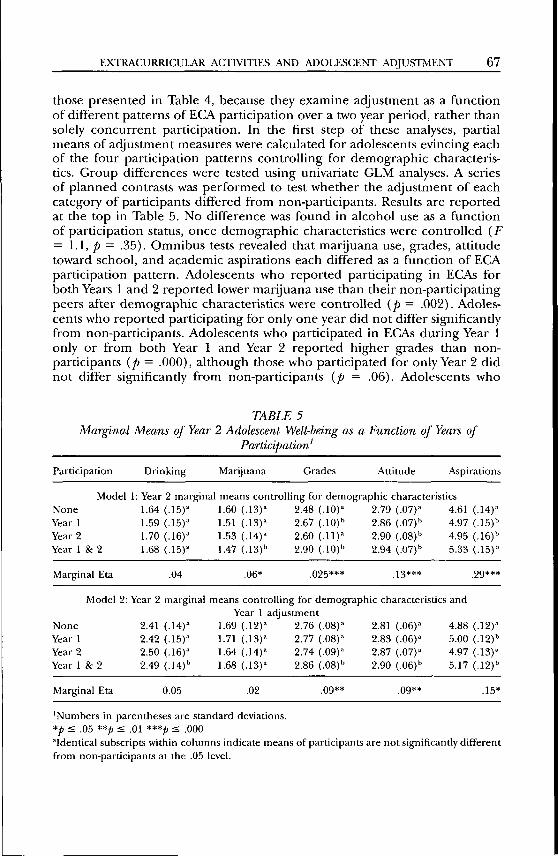
those presented in Table 4, because they examine adjustment as a functionof different patterns of ECA participation over a two year period, rather thansolely concurrent participation. In the first step of these analyses, partialmeans of adjustment measures were calculated for adolescents evincing eachof the four participation patterns controlling for demographic characteris-tics. Group differences were tested using univariate GLM analyses. A seriesof planned contrasts was performed to test whether the adjustment of eachcategory of participants differed from non-participants. Results are reportedat the top in Table 5. No difference was found in alcohol use as a functionof participation status, once demographic characteristics were controlled (E= 1.1, p = .35). Omnibus tests revealed that marijuana use, grades, attitudetoward school, and academic aspirations each differed as a function of ECAparticipation pattern. Adolescents who reported participating in ECAs forboth Years 1 and 2 reported lower marijuana use than their non-participatingpeers after demographic characteristics were controlled {p = .002). Adoles-cents who reported participating for only one year did not differ significantlyfrom non-participants. Adolescents who participated in ECAs during Year 1only or from both Year 1 and Year 2 reported higher grades than non-participants (p = .000), although those who participated for only Year 2 didnot differ significantly from non-participants (p = .06). Adolescents who
TABLE 5Marginal Means of Year 2 Adolescent Well-being as a Function of Years of
Participation'
Participation Drinking Marijuana Grades Attitude Aspirations
Model 1: Year 2 marginal means controlling for demographic characteristicsNone 1.64 (.]5)» 1.60 (.13)" 2.48 (.10)" 2.79 (.07)" 4.61 (.14)"Year 1 1.59 (.15)" 1.51 (.13)" 2.67 (.10)'' 2.86 (.07)'' 4.97 (.15)''Year 2 1.70 (.16)" 1.53 (.14)" 2.60 (.11)" 2.90 (.08)'' 4.95 (.16)''Year 1 & 2 1.68 (.15)" 1.47 (.13)'' 2.90 (.10)" 2.94 (.07)'' 5.33 (.15)''
Marginal Eta
Model 2:
NoneYear 1Year 2Year 1 & 2
Marginal Eta
Year 2
2.412.422.502.49
.04
marginal
(.14)"(.15)"(.16)"(.14)"
0.05
.06* .025***
means controlling for demographYear 1 adjustment
1.69 (.12)»1.71 (.13)"1.64 (.14)"1.68 (.13)"
.02
2.76 (.08)"2.77 (.08)"2.74 (.09)"2.86 (.08)"
.09**
.13***
ic characteristics
2.81 (.06)"2.83 (.06)"2.87 (.07)"2.90 (.06)"
.09**
and
4.885.004.975.17
.29***
(.12)"(.12)"(.13)"(.12)"
.15*
'Numbers in parentheses are standard deviations.*p < .05 **p s .01 ***p < .000"Identical subscripts within columns indicate means of participants are not significantly differentfrom non-participants at the .05 level.

68 DARLING, CALDWELL AND SMITH
participated in ECAs for at least one year reported more positive attitudestoward school and higher academic aspirations than non-participants, con-trolling for demographic characteristics (jb ^ .05). For each of the four in-dicators of adjustment that was significantly related to pattern of ECA par-ticipation—marijuana use, grades, attitude toward school, and academicaspirations—adolescents who participated for both Year 1 and Year 2 evincedthe most positive adjustment.
In the second step of the analyses. Year 2 adolescent adjustment waspredicted from pattern of ECA participation controlling for both demo-graphic characteristics and Year 1 adjustment. For example. Year 2 alcoholuse was predicted from pattern of ECA participation during Year 1 and Year2 controlling for Year 1 alcohol use. Year 2 grade in school, gender, ethnicity,and parents' education. Functionally, these analyses test the hypothesis thatchange in adjustment is predicted from ECA participation pattern control-ling for demographic characteristics. Once prior adjustment and demo-graphic characteristics are controlled, neither drinking nor marijuana useare associated with ECA participation {p > .10). Participation in ECAs did,however, predict higher grades and academic aspirations and more a positiveattitude toward school {p '^ .05) controlling for prior adjustment and dem-ographic characteristics. In the case of both grades and attitude towardschool, youth who reported participating in ECAs during both Years 1 andYear 2 differed from non-participants {p ^ .01), but those who participatedfor only one year did not. Those who participated in ECAs during both Year1 and Year 2 and those who participated only in Year 1 reported higheracademic aspirations than non-participants, but those who participated solelyin Year 2 did not.
Question 3: Is Participation More Beneficial for Some Demographic Groups than forOthers and for Those Who Are at Relatively Higher Risk for Difficulties inAdjustment ?
A series of univariate GLM analyses was performed predicting Year 2adolescent adjustment from Year 2 ECA participation, gender, ethnicity, par-ents' education, grade in school, and the interactions between ECA partici-pation and gender, ethnicity, parents' education, and year in school. Allterms were entered simultaneously. Contrary to our hypothesis, the associa-tion between ECA participation and adolescent adjustment did not differ bydemographic background. Only one of 20 interactions tested was statisticallysignificant at the .05 level, which does not exceed that which would be ex-pected by chance.
Question 4: Is Participation in Sports Associated with the Same Benefits asParticipation in Non-Sport Activities?
Two sets of analyses were performed to assess whether the associationbetween well-being and participation was the same for sports and non-sportextracurricular activities. In these analyses, adolescents were categorized as
EXTRACURRICULAR ACTIVITIES AND ADOLESCENT ADJUSTMENT 69
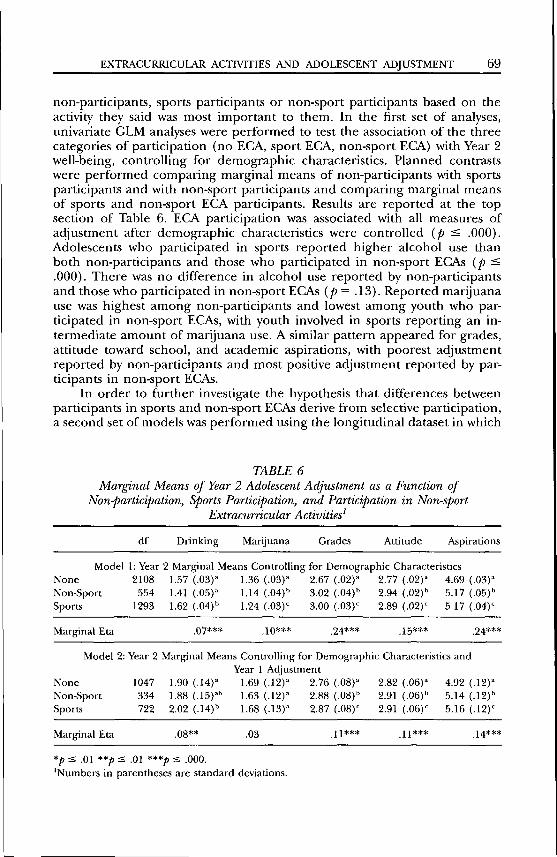
non-participants, sports participants or non-sport participants based on theactivity they said was most important to them. In the first set of analyses,univariate GLM analyses were performed to test the association of the threecategories of participation (no ECA, sport ECA, non-sport ECA) with Year 2well-being, controlling for demographic characteristics. Planned contrastswere performed comparing marginal means of non-participants with sportsparticipants and with non-sport participants and comparing marginal meansof sports and non-sport ECA participants. Results are reported at the topsection of Table 6. ECA participation was associated with all measures ofadjustment after demographic characteristics were controlled {p < .000).Adolescents who participated in sports reported higher alcohol use thanboth non-participants and those who participated in non-sport ECAs (/» ^.000). There was no difference in alcohol use reported by non-participantsand those who participated in non-sport ECAs {p = .13). Reported marijuanause was highest among non-participants and lowest among youth who par-ticipated in non-sport ECAs, with youth involved in sports reporting an in-termediate amount of marijuana use. A similar pattern appeared for grades,attitude toward school, and academic aspirations, with poorest adjustmentreported by non-participants and most positive adjustment reported by par-ticipants in non-sport ECAs.
In order to further investigate the hypothesis that differences betweenparticipants in sports and non-sport ECAs derive from selective participation,a second set of models was performed using the longitudinal dataset in which
TABLE 6Marginal Means of Year 2 Adolescent Adjustment as a Function of
Non-Participation, Sports Participation, and Participation in Non-sportExtracurricular Activities'
df Drinking Marijuana Grades Attitude Aspirations
Model 1: Year 2 Marginal Means Controlling for Demographic CharacteristicsNone 2108 1.57 (.03)'' 1.36 (.03)" 2.67 (.02)" 2.77 (.02)" 4.69 (.03)"Non-Sport 554 1.41 (.05)" 1.14 (.04)'' 3.02 (.04)" 2.94 (.02)" 5.17 (.05)"Sports 1293 1.62 (.04)" 1.24 (.03)' 3.00 (.03)' 2.89 (.02)' 5.17 (.04)'
Marginal Eta .07*** .10*** .24*** .15*** .24***
Model 2: Year 2 Marginal Means Controlling for Demographic Characteristics andYear 1 Adjustment
None 1047 1.90 (.14)" 1.69 (.12)" 2.76 (.08)" 2.82 (.06)" 4.92 (.12)"Non-Sport 334 1.88 (.15)"" 1.63 (.12)" 2.88 (.08)" 2.91 (.06)" 5.14 (.12)"Sports 722 2.02 (.14)" 1.68 (.13)" 2.87 (.08)' 2.91 (.06)' 5.16 (.12)'
Marginal Eta .08** .03 .11*** .11*** .14***
*p < .01 **p < .01 ***p s .000.'Numbers in parentheses are standard deviations.
70 DARLING, CALDWELL AND SMITH
Year 2 adjustment was predicted from Year 2 EGA participation (non-participant, sports participant, non-sport participant) controlling for demo-graphic hackground characteristics and Year 1 adjustment. Results are re-ported in the bottom of Tahle 6. Results were strikingly similar to thecross-sectional analyses, although differences hetween the groups were re-duced. Alcohol use, grades, attitude toward school, and academic aspirationswere each associated with ECA participation after controlling for demo-graphic characteristics and Year 1 adjustment {p ^ .01). The associationhetween marijuana use and participation dropped helow significance {p =.37).
Question 5: Is the Association of Extracurricular Activity Participation withAdjustment Mediated through Characteristics of the Adolescent Peer Group?
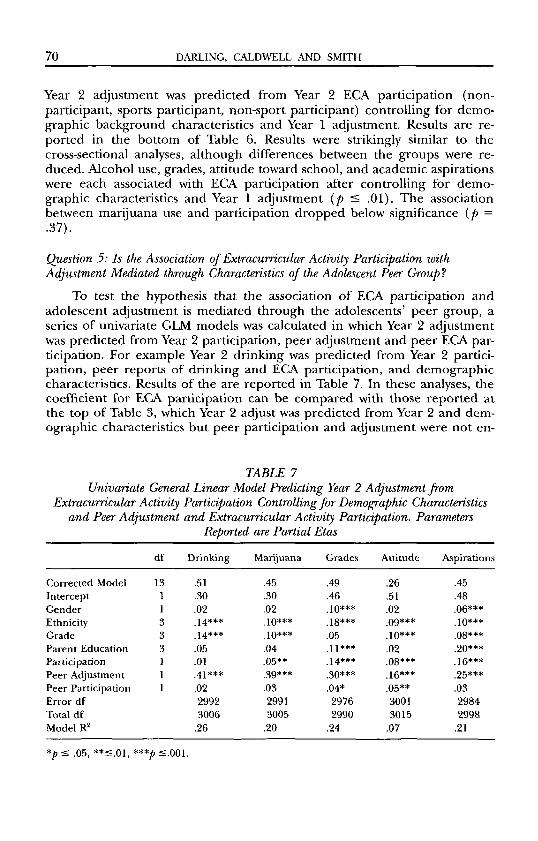
To test the hypothesis that the association of EG\ participation andadolescent adjustment is mediated through the adolescents' peer group, aseries of univariate GLM models was calculated in which Year 2 adjustmentwas predicted from Year 2 participation, peer adjustment and peer EGA par-ticipation. For example Year 2 drinking was predicted from Year 2 partici-pation, peer reports of drinking and EGA participation, and demographiccharacteristics. Results of the are reported in Tahle 7. In these analyses, thecoefficient for EGA participation can he compared with those reported atthe top of Table 3, which Year 2 adjust was predicted from Year 2 and dem-ographic characteristics but peer participation and adjustment were not en-
TABLE 7Univariate General Linear Model Predicting Year 2 Adjustment from
Extracurricular Activity Participation Gontrolling for Demographic Characteristicsand Peer Adjustment and Extracurricular Activity Participation. Parameters
Reported are Partial Etas
Corrected ModelInterceptGenderEthnicityGradeParent EducationParticipationPeer AdjustmentPeer ParticipationError dfTotal dfModel R̂
df
1311333111
Drinking
.51
.30
.02
.14***
.14***
.05
.01
.41***
.0229923006
.26
Marijuana
.45
.30
.02
.10***
.10***
.04
.05**
.39***
.0329913005
.20
Grades
.49
.46
.10***
.18***
.05
.11***
.14***
.30***
.04*29762990
.24
Attitude
.26
.51
.02
.09***
.10***
.02
.08***
.16***
.05**30013015
.07
Aspirations
.45
.48
.06***
.10***
.08***
.20***
.16***25***.0329842998
.21
*p < .05, **s.OI, ***/) £.001.
EXTRAGURRIGULAR ACTIVITIES AND ADOLESCENT ADJUSTMENT 71
tered into the model. As expected, in all cases, peer adjustment was positivelyassociated with adolescent adjustment {p ^ .01). There was no evidence tosupport the hypothesis that peer group characteristics mediated the associ-ation between EGA participation and adolescent adjustment. EGA partici-pation continued to predict marijuana use, grades, attitude toward school,and academic aspirations after peer adjustment and participation were con-trolled. (Alcohol use was not associated with EGA participation prior to con-trolling for peer characteristics.) However, EGA participation by peers wasassociated with hetter grades and a more positive attitude toward school,controlling for adolescents' own participation, peer adjustment, and demo-graphic characteristics {p ^ .05).
Discussion
The goals of this paper were to extend our understanding of the asso-ciation between extracurricular activity participation and adolescent adjust-ment by examining three major issues: the potential confounding of selectiveEGA participation by better adjusted students and measures of adjustment;the variability of the strength of the association between EGA participationand adjustment as a function of adolescent demographic characteristics andactivity type; and the role of peers as mediators of the association hetweenEGA participation and adjustment. Five specific questions were addressed;(1) Is participation in school-based extracurricular activities associated withindicators of adolescent adjustment? (2) Gan the association hetween partic-ipation in extracurricular activities and adolescent outcomes be documentedcontrolling for such selection factors as demographic characteristics andprior adjustment? (3) Is participation more beneficial for some demographicgroups than for others and for those who are at relatively higher risk fordifficulties in adjustment? (4) Is participation in sports associated with thesame benefits as participation in non-sport activities? and (5) Is the associa-tion of extracurricular activity participation with adjustment mediatedthrough characteristics of the adolescent peer group?
Although extracurricular activity participation varies across youth fromdifferent demographic backgrounds, these selection factors do not appearto explain the association of EGA participation and adolescent adjustment.Adolescents who participated in school based extracurricular activitiesshowed small, but significant, differences in marijuana use, grades, attitudestoward school, and academic aspirations (but not alcohol use), controllingfor demographic characteristics. Longitudinal analyses controlling for prioradjustment and demographic background characteristics concluded that ad-olescents who participated in extracurricular activities increased alcohol usefaster than their peers and showed improved grades, attitude toward school,and academic aspirations. Ghange in marijuana use was not predicted byEGA participation. Taken together, these results suggest that the better aca-demic adjustment evinced by students who participate in school-based extra-curricular activities are not the spurious result of the selection of better ad-
72 DARLING, CALDWELL AND SMITH
justed students into extracurricular activities. Rather, they are consistent withthe hypothesis that participation in school-based extracurricular activitiesleads to processes that bind students to the adult-oriented values of theschool (e.g., good academic performance, high academic aspirations, andhigh academic aspirations). These results are consistent with past researchon the academic benefits of participation for adolescents (e.g., Gooper etal., 1999; Davalos et al., 1999; Eccles & Barber, 1999; Jordan & Nettles, 1999;Mahoney & Gairns, 1997; Mahoney & Stattin, 2000; McNeal, 1995).
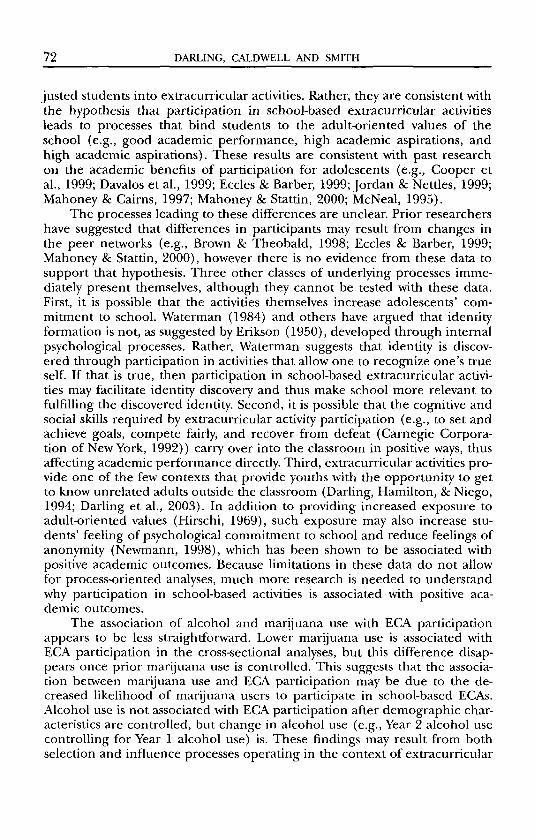
The processes leading to these differences are unclear. Prior researchershave suggested that differences in participants may result from changes inthe peer networks (e.g.. Brown & Theobald, 1998; Eccles & Barber, 1999;Mahoney & Stattin, 2000), however there is no evidence from these data tosupport that hypothesis. Three other classes of underlying processes imme-diately present themselves, although they cannot he tested with these data.Eirst, it is possible that the activities themselves increase adolescents' com-mitment to school. Waterman (1984) and others have argued that identityformation is not, as suggested by Erikson (1950), developed through internalpsychological processes. Rather, Waterman suggests that identity is discov-ered through participation in activities that allow one to recognize one's trueself. If that is true, then participation in school-based extracurricular activi-ties may facilitate identity discovery and thus make school more relevant tofulfilling the discovered identity. Second, it is possible that the cognitive andsocial skills required by extracurricular activity participation (e.g., to set andachieve goals, compete fairly, and recover from defeat (Garnegie Gorpora-tion of New York, 1992)) carry over into the classroom in positive ways, thusaffecting academic performance direcdy. Third, extracurricular activities pro-vide one of the few contexts that provide youths with the opportunity to getto know unrelated adults outside the classroom (Darling, Hamilton, & Niego,1994; Darling et al., 2003). In addition to providing increased exposure toadult-oriented values (Hirschi, 1969), such exposure may also increase stu-dents' feeling of psychological commitment to school and reduce feelings ofanonymity (Newmann, 1998), which has been shown to be associated withpositive academic outcomes. Because limitations in these data do not allowfor process-oriented analyses, much more research is needed to understandwhy participation in school-based activities is associated with positive aca-demic outcomes.
The association of alcohol and marijuana use with EGA participationappears to be less straightforward. Lower marijuana use is associated withECA participation in the cross-sectional analyses, but this difference disap-pears once prior marijuana use is controlled. This suggests that the associa-tion between marijuana use and EGA participation may be due to the de-creased likelihood of marijuana users to participate in school-based EGAs.Alcohol use is not associated with EGA participation after demographic char-acteristics are controlled, but change in alcohol use (e.g.. Year 2 alcohol usecontrolling for Year 1 alcohol use) is. These findings may result from bothselection and influence processes operating in the context of extracurricular
EXTRAGURRIGULAR ACTIVITIES AND ADOLESCENT ADJUSTMENT 7 3
activities. Consistent with prior research, comparisons of sports and non-sport participants suggest that athletics may provide a more supportive con-text for drinking than others types of EGAs (Eccles & Barber, 1999).
Although patterns of EGA participation were consistently associated withadolescent academic adjustment, the differences between participants andnon-participants were relatively small. Gontrary to our hypothesis, there wasno evidence that demographic variability in the association of EGA partici-pation with adjustment contributed to these small effect sizes. Similarly, al-though the most positive outcomes were associated with adolescents whoparticipated in non-sport EGAs, differences between sports participants andparticipants in other EGAs were small.
This research is limited in several respects. Most important, it providesno information about differences in adolescents' experiences in differentextracurricular activities. Some activities, such as sports or theater, regularlyrequire long hours of time committed to practice, sharpening of skills, andcoordination of self with others. Other activities, such as honor societies andsome clubs may require little time or commitment from students. Variationin the experience of adolescents across different activities would provide amuch richer and more detailed portrait of what types of activities may mostfacilitate positive development. Second, these data are limited in that extra-curricular activities vary in their timing across the school year, but outcomesare limited to measurement at a single point in time. Thus some studentsmay participate in a Fall sport, which would then be used to predict out-comes the following Spring, while other activities and outcomes are mea-sured contemporaneously. Both of these first two issues add variability anderror to the analyses that may suppress effect sizes. Unfortunately, these ques-tions cannot be addressed with the present data. Einally, this study is limitedin that all information, save for peer characteristics, comes from a singlesource: the adolescent themselves. It is possible that the relationships ob-served may thus result from perceptual or reporting differences of partici-pants and non-participants. Although controlling for prior characteristics inthe longitudinal analyses diminishes common source variance, it is likely thatadditional bias remains.
Taken together, these results, as well as the extant literature, suggestthat the relationship between extracurricular activity participation and ado-lescent adjustment is consistent, but small. Given the compelling statementsabout the potential benefits of participation made by proponents of extra-curricular activities (e.g.. Brown & Theobald, 1998; Garnegie Corporation ofNew York, 1992), one might reasonably ask "why?" Eirst, extracurricular ac-tivities, particularly school-based extracurricular activities, make up only asmall part of the broader context of leisure that contributes to adolescentdevelopment (Gooper et al., 1999), and taking more tban one context intoaccount may significantly increase predictive power. Second, as is implicit inpast work (e.g., Eccles & Barber, 1999; Mahoney, 2000; Mahoney & Stattin,2000), the impact of extracurricular activities on development may varymarkedly depending upon characteristics of the person, the setting, and the
74 DARLING, CALDWELL AND SMITH
activity. Although we have provided some evidence that the henefits of par-ticipation do not vary as a function of demographic characteristics, the em-pirical models employed remain quite crude in comparison to the theoreticalmodels from which they derive. More detailed analyses of adolescents' ex-periences in this setting are necessary if we are to develop a clear under-standing of the characteristics of ECA experiences that are most beneficial—particularly in terms of facilitating bonding of students to school. This maybe particularly important for those youth who are least likely to participatein EGAs: those from disadvantaged backgrounds.
References
Bronfenbrenner, U., & Morris, P. (1998). The ecology of developmental processes. In R. M.Lerner (Ed.), Handbook of child psychology. Theoretical models of human development (5 ed.. Vol.I, pp. 993-1028). New York: J. Wiley.
Brown, B. B., & Theobald, W. (1998). Learning contexts beyond the classroom: Extracurricularactivities, community organizations, and peer groups. In K. Borman & B. Schneider (Eds.),The adolescent years: Social influences and educational challenges: Ninety-seventh yearbook of theNational Society for the Study of Education, Part I (pp. 109-141). Ghicago, IL: The NationalSociety for the Study of Education.
Burnett, M. A. (2000). "One strike and you're out": An analysis of no pass/no play policies.High School Journal, 84(2), 1-6.
Butler, D. A., & Manning, M. L. (1998). Addressing Gender Differences in Young Adolescents. Olney,MD: Association for Ghildhood Education International.
Galdwell, L. L., & Darling, N. (1999). Leisure context, parental control, and resistance to peerpressure as predictors of adolescent partying and substance use: An ecological perspective.Journal of Leisure Research, 31, 57-77.
Garnegie Gorporation of New York. (1992). A matter of time: Risk and opportunity in the non-schoolhours. New York: Author.
Gooley, V. E., Henriksen, L. W., Van Nelson, G., & Thompson, J. G. (1995). A study to determinethe effect of extracurricular participation on student alcohol and drug use in secondaryschools./ourna/ of Alcohol & Drug Education, 40(2), 71-87.
Gooper, H., Valentine, J. G., Nye, B., & Lindsay, J. J. (1999). Relationships between five after-school activities and academic ach\evemenl. Journal of Educational Psychology, 91{2), 369-378.
Gusick, P. (1973). Inside High School. New York: Holt, Rinehart & Winston.Danish, S. J., & Gullotta, T. P. (Eds.). (2000). Developing competent youth and strong communities
through after-school programming. Washington, DG: Ghild Welfare League of America, Inc.Darling, N., Hamilton, S. R, & Niego, S. (1994). Adolescents' relations with adults outside the
family. In R. Montemayor & G. R. Adams (Eds.), Personal relationships during adolescence.Advances in adolescent development: An annual book series. Vol. 6. (pp. 216-235). Thousand Oaks,GA, USA: Sage Publications, Inc.
Darling, N., Hamilton, S. F., & Shaver, K. H. (2003). Relationships outside the family: Unrelatedadults. In G. R. Adams & M. D. Berzonsky (Eds.), Blackwell Handbook of Adolescence (pp. S49-370). Oxford, England: Blackwell Publishing.
Davalos, D. B., Ghavez, E. L., & Guardiola, R.J. (1999). The effects of extracurricular activity,ethnic identification, and perception of school on student dropout rates. Hispanic Journalof Behavioral Sciences, 2 i ( l ) , 61-77.
Deasy, R.J. (2003). Don't Axe the Arts. Principal, January/Eebruary, 14-15.Dewey, J. (1916). Democracy and Education. New York: The Macmillan Gompany.
EXTRAGURRIGULAR AGTIVITIES AND ADOLESGENT ADJUSTMENT 75
Dornbtisch, S. M., Ritter, P L., Leiderman, P H., Roberts, D. R, & Fraleigh, M.J. (1987). Therelation of parenting style to adolescent school performance. Child Development, 58(b), 1244-1257.
Durbin, D. L., Darling, N., Steinberg, L., & Brown, B. B. (1993). Parenting style and peer groupmembership among European-American adolescents. Journal of Research on Adolescence, 3(\),87-100.
Dworkin, J. B., Larson, R., & Hansen, D. (2003). Adolescents' accounts of growth experiencesin youth activities./ounia/ of Youth and Adolescence, 32(\), 17-26.
Eccles, J. S., & Barber, B. L. (1999). Student council, volunteering, basketball, or marching band:What kind of extracurricular involvement matters?/ourraa/ of Adolescent Research, 14(\), 10-43.
Eccles, J. S., Lord, S., & Buchanan, G. M. (1996). School transitions in early adolescence: Whatare we doing to our young people? In J. A. Graber & J. Brooks-Gunn (Eds.), Transitionsthrough adolescence: Interpersonal domains and context (pp. 251-284). Mahwah, NJ: LawrenceErlbaum Associates, Inc.
Erikson, E. H. (1950). Childhood and Society. New York: W.W. Norton & Go.Hirschi, T. (1969). Causes of Delinquency. Los Angeles, GA: University of Galifornia Press.Holland, A., & Andre, T (1987). Participation in extracurricular activities in secondary school:
What is known, what needs to be known? Review of Educational Research, 57(4), 437-466.Hovet, G. A., & Vinton, D. (1993). Gombining curricular and co-curricular components for a
comprehensive leadership development program. Journal of College Student Development,34{i), 307-308.
Jordan, W. J., & Nettles, S. M. (1999). How students invest their time outside of school: Effectson school-related outcomes. Social Psychology of Education, 5(4), 217-243.
Kezar, A., & Moriarty, D. (2000). Expanding our understanding of student leadership develop-ment: A study exploring gender and ethnic identity. Journal of College Student Development,41(1), 55-69.
Khmelkov, V. T, & Hallinan, M. T. (1999). Organizational effects on race relations in schools.Journal of Social Issues, -55(4), 627-645.
Kleiber, D. A. (1999). Leisure experiences and human development: A dialectical interpretation. NewYork, NY, USA: Basicbooks, Inc.
Larson, R. (1994). Youth organizations, hobbies, and sports as developmental contexts. In R. K.Silbereisen & E. Tot (Eds.), Adolescence in context: The interplay of family, school, peers, and workin adjustment (pp. 46-65). New York: Spring-Verlag.
Larson, R. W. (2000). Toward a psychology of positive youth development. American Psychologist,55(\), 170-183.
Mahoney, J. L. (2000). School extracurricular activity participation as a moderator in the devel-opment of antisocial patterns. Child Development, 7i(2), 502-516.
Mahoney, J. L., & Gairns, R. B. (1997). Do extracurricular activities protect against early schooldropout? Developmental Psychology, 33(2), 241-253.
Mahoney, J. L., & Stattin, H. (2000). Leisure activities and adolescent antisocial behavior: Therole of structure and social context. Journal of Adolescence, 23, 113-127.
McNeal, R. B., Jr. (1995). Extracurricular activities and high school dropouts. Sociology of Edu-cation, 65(1), 62-80.
McNeal, R. B., Jr. (1998). High school extracurricular activities: Glosed structures and stratifyingpatterns of p^Lrtidpation. Journal of Educational Research, 91{S), 183-191.
McNeal, R. B., Jr. (1999). Participation in high school extracurricular activities: Investigatingschool effects. Social Science Quarterly, 80(2), 291-309.
Morgan, D. L., & Alwin, D. F. (1980). When less Is more: School size and student social partic-ipation. Social Psychology Quarterly, 43(2), 241-252.

76 DARLING, GALDWELL AND SMITH
National Genter for Ghronic Disease Prevention and Health Promotion. (2002, August 16, 2002).Methodological and Technical Notes: Race and Ethnicity Definitions. Retrieved January 5, 2003,from http://www.cdc.gov/cvh/combinedatlas/racedef.htm
Newmann, F. M. (1998). How secondary schools contribute to academic success. In K. Borman& B. Schneider (Eds.), The adolescent years: Social influences and educational challenges: Ninety-seventh yearbook ofthe National Society for the Study of Education, Part I. (pp. 88-108). Ghicago,IL, USA: The National Society for the Study of Education.
Rigsby, L., & McDill, E. (1975). Value orientations of high school students. In H. R. Staub (Ed.),The sociology of education: A sourcebook (3rd ed., pp. 53-74). Homewood, IL: Dorsey.
Rutter, M., Ghampion, L., Quinton, D., Maugham, B., & Pickles, A. (1995). Understanding in-dividual differences in environmental-risk exposure. In P. Moen, G. H. Elder & K. Luscher(Eds.), Examining lives in context: Perspectives on the ecology of human development (pp. 61-96).Washington, DG: American Psychological Association.
Shann, M. H. (2001). Students' use of time outside of school: A case for after school programsfor urban middle school youth. Urban Review, 33(4), 339-356.
Shaw, S. M., Kleiber, D. A., & Galdwell, L. L. (1995). Leisure and identity formation in male andfemale adolescents: A preliminary examination./ourrea/ of Leisure Research, 27(S), 245-263.
Silbereisen, R. K., & Eyferth, K. (1986). Development as action in context. In R. K. Silbereisen,K. Eyferth & G. Rudinger (Eds.), Development as action in context: Problem behavior and normalyouth development (pp. 3-16). Berlin: Springer-Verlag.
Simmons, R. G., & Blyth, D. A. (1987). Moving into Adolescence. Hawthorne, NY: Aldine de Gruyter.Steinberg, L., Darling, N., & Fletcher, A. G. (1995). Authoritative parenting and adolescent
adjustment: An ecological journey. In P. Moen, G. H. Elder & K. Luscher (Eds.), Examininglives in context: Perspectives on the ecology of human development (pp. 423-466). Washington, DG:American Psychological Association.
Steinberg, L., Lamborn, S. D., Dornbusch, S. M., & Darling, N. (1992). Impact of parentingpractices on adolescent achievement: Authoritative parenting, school involvement, and en-couragement to succeed. Child Development, 63(5), 1266-1281.
Swisher, J. D., & Hu, T. (1983). Alternatives to drug abuse: Some are and some are not. In T J.Glynn, G. G. Leukefeld & J. P. Ludford (Eds.), Preventing adolescent drug abuse: Interventionstrategies (pp. 141-152). Rockville, MD: National Institute of Drug Abuse.
Waterman, A. (1984). Identity formation: Discovery or creation?/oMrna/ of Early Adolescence, 4,329-341.
Werner, E. E., & Smith, R. S. (1982/1989). Vulnerable, but invincible : A longitudinal study of resilientchildren and youth. New York: Adams, Bannister, Gox.
Wren, D.J. (1997). Adolescent females "voice" changes can signal difficulties for teachers andadministrators. Adolescence, 32(126), 463-470.


![New Mexico TEAM Professional Development Module ... · [Slide 4]: Please note that ... this child may have difficulty with participation in extracurricular activities, ... using language](https://img.dokumen.tips/doc/110x75/5ac1c6777f8b9a213f8d7946/new-mexico-team-professional-development-module-slide-4-please-note-that-.jpg)