Embed Size (px)
Citation preview
Lean Six Sigma Tools for
Planning and Execution
Participant Guide

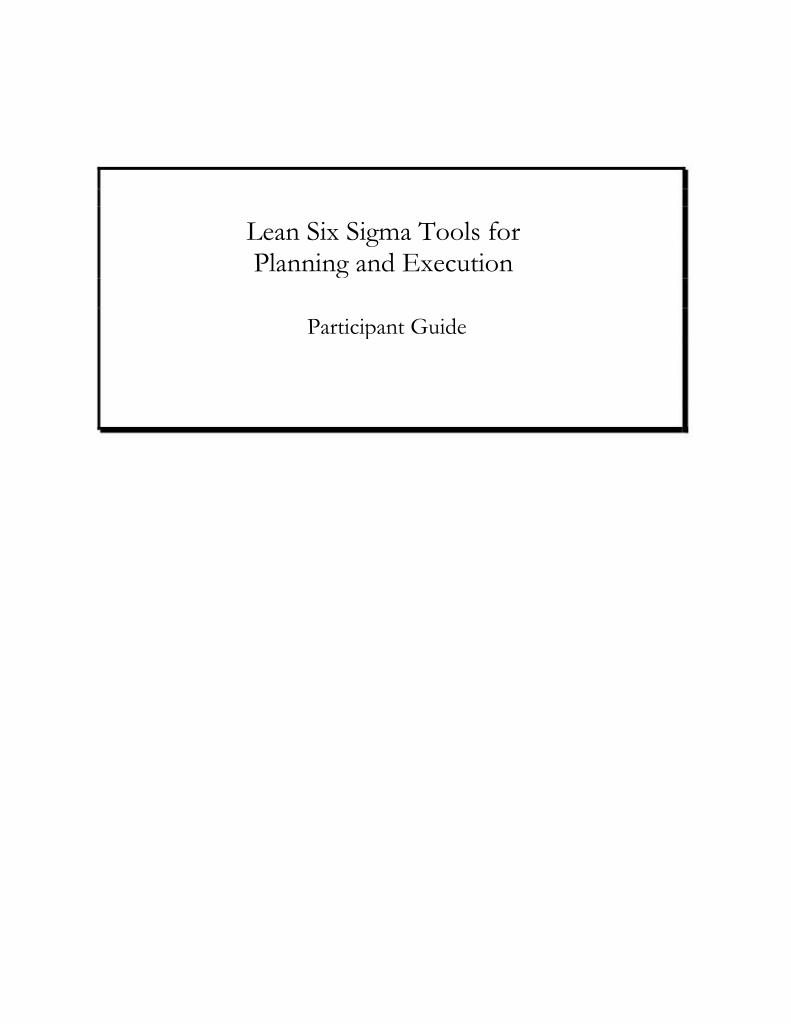
Lean Six Sigma Tools for Planning and Execution
Table of Contents
____________________________________________________________
1
2
3
4
5
6
7
8
9
10 11 12 13 14 15 16
Course Introduction
Lean Six Sigma Overview
Project Charter
RACI Diagram
SIPOC Diagram
Value Stream Mapping
“As Is” and “To Be” Spaghetti Diagrams
Waste Walk
5Ss Control Charts Theory of Constraints Cause-and-effect (Fishbone) Diagrams The “Five Whys” Technique Pareto Charts Poka-yokes Wrap-Up and Next Steps
____________________________________________________________


Course Introduction

Lean Six Sigma Tools for Planning and Execution Unit 1: Introduction
UNIT ONE:
COURSE INTRODUCTION
COURSE OBJECTIVES
As a result of your active participation in this course, you will be better able to perform the following tasks.
Unit 2: Lean Six Sigma Overview
Explain the necessity of each business unit’s objectives being aligned with the organization’s overall objectives.
Identify the difference between output measures and performance measures in a business process.
Identify the benefits and challenges of employing the Six Sigma methodology during a business process improvement engagement.
•
•
•
Unit 3: Project Charter
•
•
•
•
•
Prepare a project charter that states the scope, outlines the objectives, and delineates the roles and responsibilities for a project.
Explain the purpose and importance of the project charter.
Describe the three main uses of the project charter.
Describe what every project charter should include.
Create a project charter given a set of facts and circumstances surrounding a business process improvement project.
Prepared by: David Cutri, University of Toledo PG 1-1
Lean Six Sigma Tools for Planning and Execution Unit 1: Introduction
Unit 4: RACI Diagram
•
•
•
•
Complete a RACI diagram that is useful for clarifying decision-making assignments in cross-functional/departmental projects and processes.
Explain the purpose and importance of a RACI diagram.
Describe the key responsibility roles in a RACI diagram.
Illustrate the matrix format of the RACI diagram.
Unit 5: SIPOC Diagram
•
•
•
•
•
Produce a SIPOC diagram that captures key suppliers, inputs, process steps, outputs, and customers of a selected process.
Explain the purpose and importance of process mapping.
Explain the purpose and importance of a SIPOC diagram.
Construct a SIPOC diagram for capturing a business process and describing its key relationships.
Describe the keys to a successful SIPOC diagram.
Unit 6: Value Stream Mapping
•
•
•
•
•
Map the value stream of a given process to analyze the flow of materials and information required to bring a product or service to a customer.
Explain the importance of quantification in a value stream map.
Describe how customer value is tracked within a value stream map.
Describe the business process component categories captured in a value stream map.
Construct a value stream map for capturing a business process.
Prepared by: David Cutri, University of Toledo PG 1-2
Eliminate the superfluous steps in a “to-be” spaghetti diagram.
•
•
Lean Six Sigma Tools for Planning and Execution Unit 1: Introduction
Unit 7: “As Is” and “To Be” Spaghetti Diagrams
• Construct “as is” and “to be” spaghetti diagrams, adapted from process flowcharts, that highlight the number of key steps and spatial relationships of a particular process.
Explain the purpose of an “as is” and “to be” spaghetti diagram.
Demonstrate how “as is” and “to be” spaghetti diagrams are adapted from process flowcharts.
Examine the spatial relationships of the key steps in “as is” and “to-be” spaghetti diagrams and develop a more streamlined process path.
•
•
•
Unit 8: Waste Walk
•
•
•
•
•
Perform a waste walk and recognize common wastes in a business process.
Explain the purpose and importance of performing a waste walk.
Describe how to perform a waste walk effectively.
Describe common wastes that exist in a business process.
Describe the traditional “seven wastes” as a historical reference.
Unit 9: 5S
•
•
•
Utilize the 5S workplace organization methodology to assess work space efficiency and effectiveness.
Describe the five primary phases of 5S.
Describe the benefits of 5S. Unit 10: Control Charts
Use a control chart to determine process capability.
Explain the purpose and importance of process analysis.
Measure the performance of a process using a control chart.
Assess the capability of a process using a control chart.
Prepared by: David Cutri, University of Toledo PG 1-3
Lean Six Sigma Tools for Planning and Execution
Lean Six Sigma Tools for Planning and Execution Unit 1: Introduction
Prepared by: David Cutri, University of Toledo PG 1-4
Lean Six Sigma Tools for Planning and Execution
Unit 11: Theory of Constraints
Apply Eliyahu Moshe Goldratt’s Theory of Constraints to identify and resolve process bottlenecks.
Explain the purpose and importance of the Theory of Constraints.
Describe the five focusing steps related to the Theory of Constraints.
Explain the significance of constraints in the Theory of Constraints.
Explain the use of buffers in the Theory of Constraints.
Describe the “Five Thinking Process” an organization uses to support the Theory of Constraints.
Unit 12: Cause-and-effect (Fishbone) Diagrams
Employ a cause-and-effect (Fishbone) diagram to determine the root cause(s) of process breakdowns.
Explain the purpose and importance of root cause analysis.
Explain the purpose and importance of cause-and-effect (Fishbone) diagrams.
Describe the six categories of cause-and-effect (Fishbone) diagrams.
Construct a cause-and-effect (Fishbone) diagram for determining the root cause of an issue or problem.
Unit 13: The “Five Whys” Technique
Practice the “Five Whys” Technique for drilling down to the ultimate root cause of issues.
Employ the question-asking method for determining the root cause of an issue or problem.
Describe the two techniques for using the “Five Whys” method.
Lean Six Sigma Tools for Planning and Execution Unit 1: Introduction
Prepared by: David Cutri, University of Toledo PG 1-5
Unit 14: Pareto Charts
Build a Pareto chart to assist with highlighting the vital, most common causes of defects in a given process from among the various other causes.
Explain the purpose and importance of a Pareto chart.
Demonstrate root cause analysis using a Pareto chart.
Determine the scope of the process for which a Pareto analysis will be performed.
Describe risk analysis using a Pareto chart.
Unit 15: Poka-yokes
Use Poka-yokes to build controls into a process rather than onto a process.
Explain the use of Poka-yokes in mistake-proofing business processes.
Describe the types of business process errors that Poka-yokes are designed to address.
Develop Poka-Yokes to mistake-proof a business process.
Unit 16: Wrap-Up and Next Steps
Apply newly learned concepts, techniques and skills in the workplace.
Restate major concepts, techniques, and skills learned during the course.
Develop an action plan to apply selected concepts, techniques, and skills.
Lean Six Sigma Tools for Planning and Execution Unit 1: Introduction
PARTICIPATION
These activities will help build your understanding and skills and will require your participation:
Discussion Questions Breakout Session
Prepared by: David Cutri, University of Toledo PG 1-6
Lean Six Sigma Tools for Planning and Execution Unit 1: Introduction
PERSONAL LEARNING OBJECTIVES
What do you hope to gain from this course?
Prepared by: David Cutri, University of Toledo PG 1-7
Lean Six Sigma Tools for Planning and Execution Unit 1: Introduction
WORKING AGREEMENT
Learning is a process, and much of the success of this course depends on creating an effective learning environment that enhances the learning process. To nurture this environment, we want to establish a working agreement following the acronym PROCESS. Using this working agreement, we agree to demonstrate:
• P = Participation. This course is highly participatory. By agreeing to participate actively in discussions and exercises, you will get the greatest benefit from the program.
R = Respect. There will be times when we will “agree to disagree” on the significance of issues, possible solutions, and best practices. We agree to show respect by actively listening to other viewpoints and not forcing our views on others.
O = Openness. We will share our experiences and provide constructive feedback. By agreeing to such openness, you can expand your perspectives and build your skills.
C = Confidentiality. Confidential matters should not be discussed outside of class. Be aware that information of this kind may have consequences for others.
E = Enthusiasm. Be enthusiastic about this learning experience!
S = Sensitivity. You should be sensitive to the feelings and perspectives of others.
S = Sense of fun. This course should be an enjoyable experience for everyone. If we approach the discussions, exercises, and other learning tools with the right mindset, we not only will have more fun, but we will learn more as well.
•
•
•
•
•
•
Prepared by: David Cutri, University of Toledo PG 1-8
Lean Six Sigma Overview

Lean Six Sigma Tools for Planning and Execution Unit 2: Lean Six Sigma Overview
UNIT TWO: LEAN SIX SIGMA OVERVIEW
UNIT OBJECTIVES
As a result of your active participation in this unit, you will be able to:
• Explain the necessity of each business unit’s objectives being aligned with the organization’s overall objectives.
Identify the difference between output measures and performance measures in a business process.
Identify the benefits and challenges of employing the Six Sigma methodology during a business process improvement engagement.
•
•
Prepared by: David Cutri, University of Toledo PG 2-1
Lean Six Sigma Tools for Planning and Execution Unit 2: Lean Six Sigma Overview
BACKGROUND
The Six Sigma strategy is a business management strategy and a philosophy of doing business with a focus on eliminating defects through fundamental process knowledge. Originally developed by Motorola, USA, in 1986, Six Sigma methods integrate principles of business, statistics, and engineering to achieve tangible results. The Six Sigma strategy seeks to improve the quality of business process outputs by identifying and removing the causes of defects (errors) and minimizing variability. Understanding processes so that they can be improved by means of a Six Sigma approach requires the knowledge of the simple kit of quality tools and techniques covered in this course.
The term Six Sigma originated from terminology associated with manufacturing, specifically terms associated with the statistical modeling of manufacturing processes. Process effectiveness is measured by a “sigma” rating, or the percentage of defect-free products it creates. A Six Sigma process is one in which 99.99966 percent of the products manufactured are statistically expected to be free of defects. Processes that operate with "Six Sigma Quality" are assumed to produce long-term defect levels below 3.4 defects per million opportunities (DPMO). Six Sigma's implicit goal is to improve all processes to that level of quality or better. Motorola set a goal of "Six Sigma" for all of its manufacturing operations, and this goal became a byword for the management and engineering practices used to achieve it.
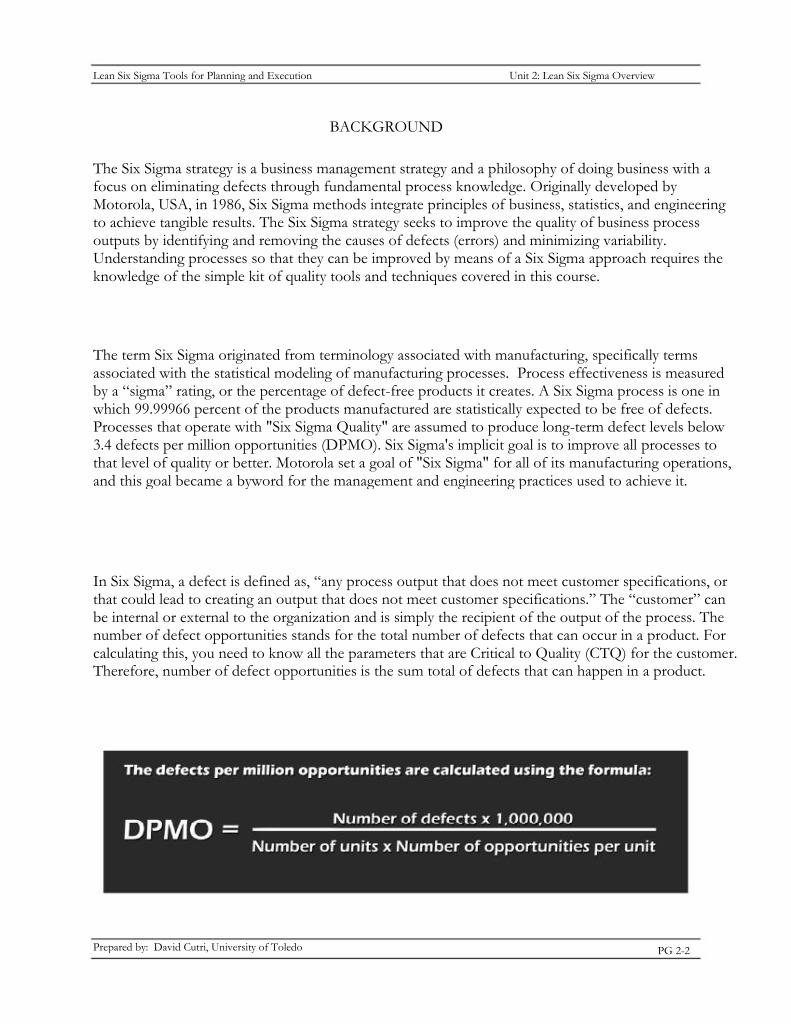
In Six Sigma, a defect is defined as, “any process output that does not meet customer specifications, or that could lead to creating an output that does not meet customer specifications.” The “customer” can be internal or external to the organization and is simply the recipient of the output of the process. The number of defect opportunities stands for the total number of defects that can occur in a product. For calculating this, you need to know all the parameters that are Critical to Quality (CTQ) for the customer. Therefore, number of defect opportunities is the sum total of defects that can happen in a product.
Prepared by: David Cutri, University of Toledo PG 2-2
Lean Six Sigma Tools for Planning and Execution Unit 2: Lean Six Sigma Overview
Although Six Sigma originated as a set of practices designed to improve manufacturing processes, its application has been extended to other types of business processes as well. They are applicable across every discipline, including: production, sales, marketing, design, administration, and service.
APPLICATION OF "SIX SIGMA"
How could you see Six Sigma being applied in the sales, marketing, design, administration, and service areas of your organization?
The Six Sigma doctrine asserts that:
•
•
•
Continuous efforts to achieve stable and predictable process results (i.e., reduce process variation) are of vital importance to business success. Manufacturing and business processes have characteristics that can be measured, analyzed, improved, and controlled. Achieving sustained quality improvement requires commitment from the entire organization, particularly from top-level management.
Six Sigma Process Elements
• • • • •
D - Define opportunity M - Measure performance A - Analyze opportunity I - Improve performance C - Control performance
Most practitioners and users of Six Sigma refer to Motorola's DMAIC (pronounced "duh-may-ick") acronym as a way of reinforcing and reminding participants what needs to be done. This methodology will be discussed in more detail later in this unit.
Prepared by: David Cutri, University of Toledo PG 2-3
Lean Six Sigma Tools for Planning and Execution Unit 2: Lean Six Sigma Overview
Lean Principles
Lean is the set of tools that assist in the identification and steady elimination of waste. As waste is eliminated, quality improves while production time and cost are reduced. Examples of such tools include:
• • •
Value stream mapping 5S Poka-Yoke (mistake-proofing)
A Lean approach provides companies with these tools as a necessary means to survive in a global market that demands higher quality, faster delivery, and lower prices.
Lean principles come from the Japanese manufacturing industry. The term Lean was first coined by John Krafcik in a Fall 1988 article, "Triumph of the Lean Production System," published in the Sloan Management Review. The article was based on his master's thesis at the Massachusetts Institute of Technology (MIT) Sloan School of Management, which produced the international best-seller book The Machine That Changed the World, co-authored by Jim Womack, Daniel Jones, and Daniel Roos. The book is based on MIT's five-year study on the future of the automobile and made the term Lean production known worldwide.
Henry Ford is generally regarded at the father of Lean principles, whose roots lie in two books he wrote in the 1920s, My Life and Work and Today and Tomorrow. In these books, Ford detailed ideas about the nature of work and workers, which Toyota later applied and triggered an industrial revolution.
"Lean Six Sigma"
Lean Six Sigma is a synergized managerial concept of Lean and Six Sigma, which are toolkits to reduce waste in business processes. Both Six Sigma and Lean manufacturing are proven concepts that have saved companies millions of dollars without capital investment.
Prepared by: David Cutri, University of Toledo PG 2-4
Lean Six Sigma Tools for Planning and Execution Unit 2: Lean Six Sigma Overview
The Lean Six Sigma concepts were first published in the book titled Lean Six Sigma: Combining Six Sigma with Lean Speed, authored by Michael George in the year 2002. Lean Six Sigma utilizes the DMAIC phases, similar to that of Six Sigma. The Lean Six Sigma projects comprise the Lean's waste elimination projects and the Six Sigma projects based on the CTQ characteristics. The DMAIC toolkit of Lean Six Sigma comprises all the Lean and Six Sigma tools. The training for Lean Six Sigma is provided through a belt-based training system, similar to that of Six Sigma. The belt personnel are designated as white belts, yellow belts, green belts, black belts, and master black belts.
Kaizen
Kaizen is Japanese for "improvement,” or "change for the better." It refers to the philosophy or practices that focus upon continuous improvement of processes.
When used in the business sense and applied to the workplace, Kaizen refers to activities that continually improve all functions and involve all employees, from the CEO to the assembly-line workers. It also applies to processes such as purchasing and logistics that cross organizational boundaries into the supply chain. By improving standardized activities and processes, Kaizen aims to eliminate waste.
A “Kaizen event” is an intensive, focused event of business process improvement, typically led by a cross-functional team targeting rapid results. These rapid results can bring substantial benefits to your company by targeting effort and resources to fix a business-crucial issue. For example, you may wish to focus your Kaizen event on a product quality issue or excessive lead time. By launching a Kaizen event, you’re letting the business know that there is an issue and that there are plans to resolve it. While Kaizen events may differ from business to business; they generally follow the DMAIC method.
Managers must show they are committed by providing the training and implementation support necessary.
Prepared by: David Cutri, University of Toledo PG 2-5
Lean Six Sigma Tools for Planning and Execution Unit 2: Lean Six Sigma Overview
NOTES AND TAKEAWAYS
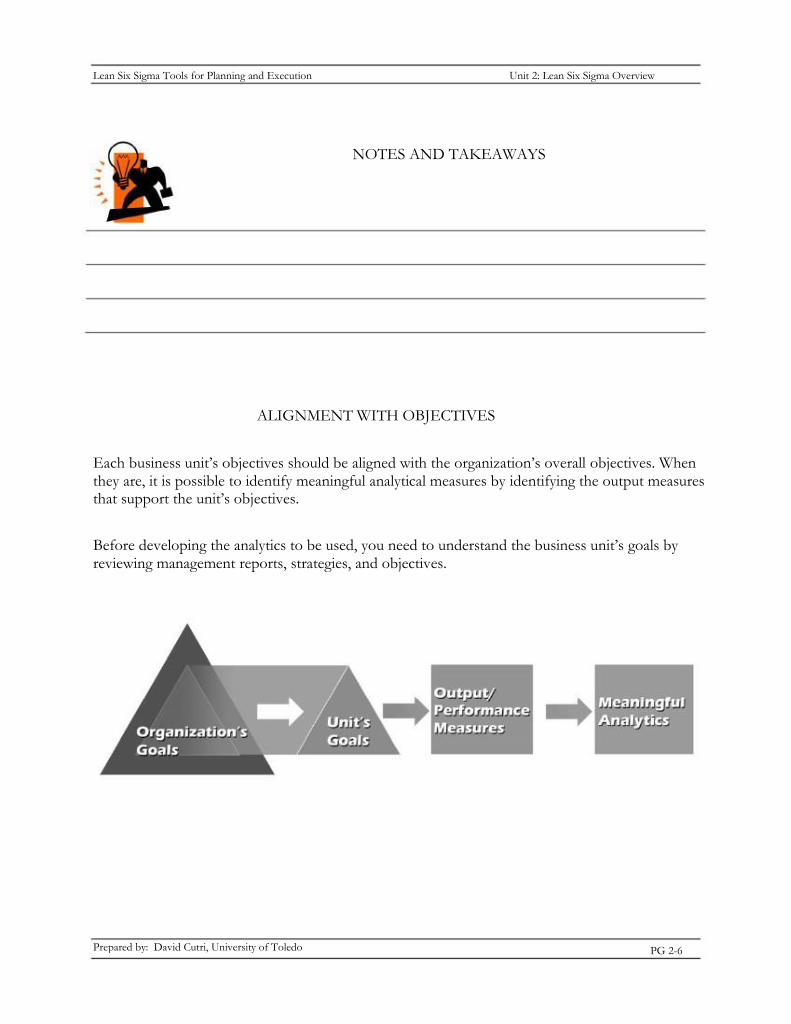
ALIGNMENT WITH OBJECTIVES
Each business unit’s objectives should be aligned with the organization’s overall objectives. When they are, it is possible to identify meaningful analytical measures by identifying the output measures that support the unit’s objectives.
Before developing the analytics to be used, you need to understand the business unit’s goals by reviewing management reports, strategies, and objectives.
Prepared by: David Cutri, University of Toledo PG 2-6
Lean Six Sigma Tools for Planning and Execution Unit 2: Lean Six Sigma Overview
OUTPUT VERSUS PERFORMANCE MEASURES
Key Process Input Variables (KPIVs) – An input factor in a process that has been determined to be a source of variability in the output of the process.
Key Process Output Variables (KPOVs) – A factor resulting from the output of a business process.
Output measures: • Refer to the key outputs of the business unit or process. • Are aligned with the business unit’s objectives. • Are linked directly with organizational goals and objectives and with the organization’s
mission statement.
Performance Metrics – A measure of an organization's activities and performance. Performance metrics should support a range of stakeholder needs, from customers, to shareholders, to employees. Traditionally many metrics have been financed-based; however, metrics may also focus on performance against customer requirements and value as well as time, cost, resources, and quality.
Developing performance metrics usually involves:
• • •
Establishing critical processes/customer requirements Developing measures Establishing targets against which the results can be scored
Performance measures: • Refer to task-level measures that support the output measures • Are important to efficient, effective operations but must underpin the output measures
The more business units — and so the more performance measures — there are in the chain, the harder it may be to see all of the output measures.
Analysis should be performed using output measures, not just performance measures.
Prepared by: David Cutri, University of Toledo PG 2-7
Lean Six Sigma Tools for Planning and Execution Unit 2: Lean Six Sigma Overview
LEAN SIX SIGMA BENEFITS AND CHALLENGES
Benefits
Lean Six Sigma offers a wealth of tangible benefits when skillfully applied, including:
• • • • • • • • • •
More efficient and effective business processes Improved process output quality Reduced costs through a self-funded approach to improvement Ability to drive improvements rapidly with internal resources Reduced process waste A better understanding of customer requirements Increased customer satisfaction and value Improved delivery and quality performance Critical process inputs needed to respond to changing customer requirements More robust products and processes
The effective use of Six Sigma tools and techniques requires collaboration with the people who actually work on the processes, and their commitment to this will be possible only if they are assured that management cares about improving quality. Managers must show they are committed by providing the training and implementation support necessary.
Challenges
• • •
Getting management and employee buy-in. Time and resources needed to execute process improvement projects/initiatives. Training required.
Prepared by: David Cutri, University of Toledo PG 2-8
Lean Six Sigma Tools for Planning and Execution Unit 2: Lean Six Sigma Overview
What benefits and/or challenges do you foresee from the use of Lean Six Sigma in your department?
Prepared by: David Cutri, University of Toledo PG 2-9
Lean Six Sigma Tools for Planning and Execution Unit 2: Lean Six Sigma Overview
IDEAS AND INSIGHTS
What new ideas or insights did you acquire?
How will you incorporate what you learned into your work?
Prepared by: David Cutri, University of Toledo PG 2-10


Project Charter

Lean Six Sigma Tools for Planning and Execution Unit 3: Project Charter
UNIT THREE: PROJECT CHARTER
UNIT OBJECTIVES
As a result of your active participation in this unit, you will be able to prepare a project charter that states the scope, outlines the objectives, and delineates the roles and responsibilities for a project by:
•
•
•
•
Explaining the purpose and importance of the project charter
Describing the three main uses of the project charter
Describing what every project charter should include
Creating a project charter given a set of facts and circumstances surrounding a business process improvement project
Prepared by: David Cutri, University of Toledo PG 3-1
Lean Six Sigma Tools for Planning and Execution Unit 3: Project Charter
PROJECT CHARTER
The project charter is a formal document that defines the high-level requirements for a project. It provides a preliminary delineation of roles and responsibilities, outlines the project objectives, identifies the main stakeholders, and defines the authority of the project manager.
The purpose of the project charter is to document:
• • • • • • • • •
Reasons for undertaking the project Objectives and constraints of the project Directions concerning the solution Identities of the main stakeholders In-scope and out-of-scope items A high-level risk management plan A communication plan Target project benefits High-level budget and spending authority
What do you think would happen to projects without a project charter?
Prepared by: David Cutri, University of Toledo PG 3-2
Lean Six Sigma Tools for Planning and Execution Unit 3: Project Charter
The three main uses of the project charter are:
•
•
To authorize the project – Using a comparable format, projects can be ranked and authorized by return on investment (ROI).
To serve as the primary sales document for the project – The project charter gives ranking stakeholders a one- to two-page summary to distribute, present, and keep handy for fending off other project or operations runs at project resources.
To serve as a focus point throughout the project – For example, the charter can be projected as people walk into team meetings and used in change control meetings to ensure tight scope management.
•
The project charter can take several forms, though at a minimum it should include the following three elements:
•
•
•
Project problem statement – States the organization’s business problem.
Project objective – States the project objective (i.e., part of the higher-level problem statement).
Required resources – Indicates the resources required to execute the project.
Each of these elements is discussed below.
Project Problem Statement The problem statement should be a complete description of the business problem and should be stated in such a way that the entire organization can understand the importance of deploying the project. It should include current performance baselines related to financial and operational metrics, including quantitative background information. This background information describes where the problem occurs, how it is measured, who is impacted by the problem, and by how much they are impacted. Other critical information should include all major internal and external impacts on the business due to the existence of the chronic problem, including those affecting the customer. The project’s metrics should link clearly with high-level business goals and objectives. It is also important that the problem statement contain no solutions or other information that may bias data collection and analysis efforts.
Prepared by: David Cutri, University of Toledo PG 3-3
Lean Six Sigma Tools for Planning and Execution Unit 3: Project Charter
Project Objective The project objective should be a part of the problem statement. It should be linked linearly to the overall problem and be in the same financial and operational metric format. As an example, if the higher-level problem is stated in terms of “excess inventory investment” and “low inventory turns,” then the project objective should have at least these same metrics. However, as the root-cause analysis proceeds, the team may be required to bring additional operational metrics into the project charter. The project objective changes as the team works through the root cause, but senior management always sees the overall business impact of the project.
Required Resources The resources required for the project will vary depending on the type of project. The goal is not to make major changes in the process that would require large capital outlays or significant resource commitments by the organization. This is not to say some high-leverage projects should not be resourced using capital, but only that this situation should be the exception, not the rule. The three categories requiring resources are:
• The people taking part in the project. • Payment for data collection and analysis. • The implementation of the process improvements.
The people making up the project team — as well as support personnel from information technology, finance, and other professionals within the organization — are often very busy. Their time is valuable. As a result, the project should use only the necessary level of human resources required to meet its objectives. This doesn’t mean the project should not be resourced properly, but that thought must be put into who should be on the team as well as what activities they will perform once they’re on the team.
Resources required for data collection and analysis are another important consideration. Some data collection efforts require that surveys be conducted or data be purchased. Examples are data required to obtain customer buying preferences, laboratory testing, and payments to consultants or other professionals for their time.
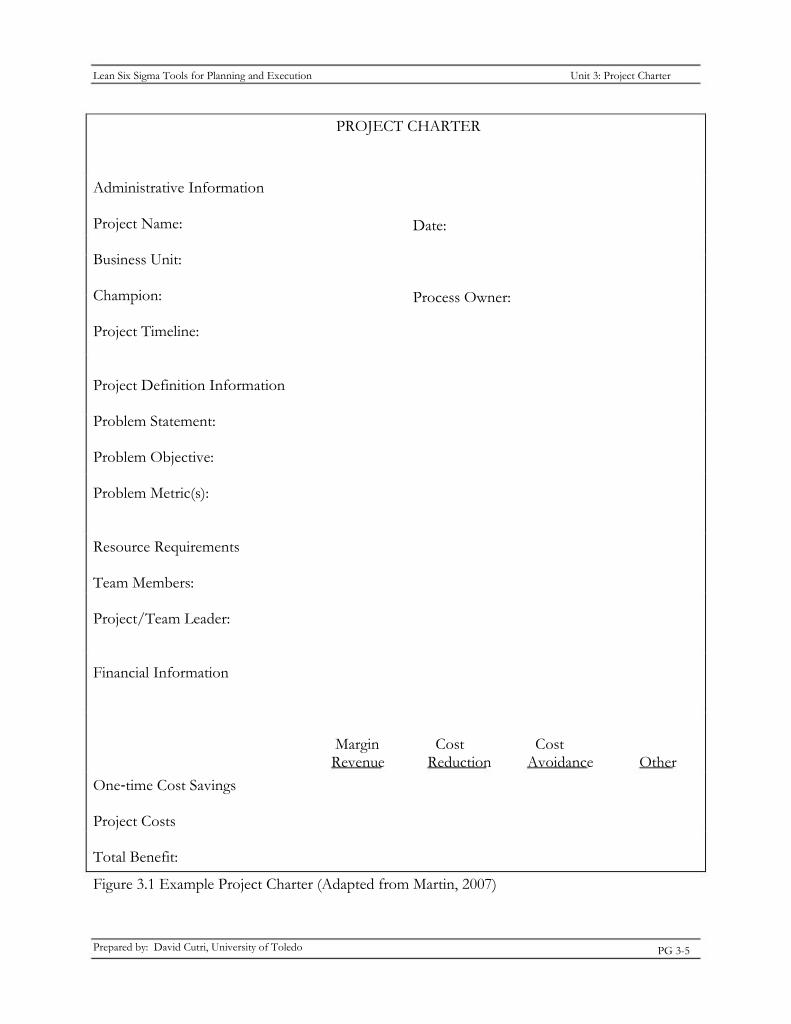
Finally, improvements will cost money. Examples include making minor changes to software code to mistake-proof data entry, modifications to the employee training program, or minor process changes. Resources should be managed well since they are expensive. Figure 3.1, below, provides an example of a project charter.
Prepared by: David Cutri, University of Toledo PG 3-4
Lean Six Sigma Tools for Planning and Execution Unit 3: Project Charter
PROJECT CHARTER
Administrative Information Project Name: Business Unit: Champion: Project Timeline: Project Definition Information Problem Statement: Problem Objective: Problem Metric(s): Resource Requirements Team Members: Project/Team Leader: Financial Information
One‐time Cost Savings Project Costs Total Benefit:
Date: Process Owner:
Margin Revenue
Cost Reduction
Cost Avoidance
Other
Figure 3.1 Example Project Charter (Adapted from Martin, 2007)
Prepared by: David Cutri, University of Toledo PG 3-5
Lean Six Sigma Tools for Planning and Execution Unit 3: Project Charter
Charters will be written specific to each project. In addition to the elements noted above, they should include the following aspects:
• Project Authorization – A brief written statement should identify the authorized project by name and/or number.
Project Manager Authorization – The name of the project manager, including a description of his/her responsibilities should be identified clearly.
Key Stakeholders – All key stakeholders identified in the project proposal (i.e. those who can influence the success or failure of a project positively or negatively) must be identified. Their functions and roles also must be defined clearly to avoid role confusion. List all stakeholders, their roles, and how they will contribute to the project.
Project Goal(s) – Having a clear, agreed-upon goal statement is vital to the success of the project. The goal statement in the project charter must be identical to the goal established in the approved project proposal. The goal must be:
o Specific. o Measurable. o Achievable. o Relevant to the corporate strategy. o Time-lined.
Project Priorities – A list of the project priorities (e.g., time, cost, scope, etc.) must be included and delineated in the order of importance. These priorities should remain constant throughout the project whenever possible. The importance of conveying project priorities to the project manager cannot be overstressed.
Scope Statement – The scope statement must describe the major activities of the project in such a way that it will be absolutely clear if extra work is added at a later date. Sometimes it is best also to include what is not in the scope of the project. The scope statement in the project charter must reflect the approved scope described in the project proposal and may expand further on its details. If a scope statement is not included in the project charter, it must be developed as part of the project scope planning efforts.
•
•
•
•
•
Prepared by: David Cutri, University of Toledo PG 3-6

Lean Six Sigma Tools for Planning and Execution Unit 3: Project Charter
IDEAS AND INSIGHTS
What new ideas or insights did you acquire?
How will you incorporate what you learned into your work?
Prepared by: David Cutri, University of Toledo PG 3-7

RACI Diagram

Lean Six Sigma Tools for Planning and Execution Unit 4: RACI Diagram
UNIT FOUR: RACI DIAGRAM
UNIT OBJECTIVES
As a result of your active participation in this unit, you will be able to complete a RACI diagram that is useful for clarifying decision-making assignments in cross-functional/departmental projects and processes by:
•
•
•
Explaining the purpose and importance of a RACI diagram
Describing the key responsibility roles in a RACI diagram
Construct a RACI diagram
Prepared by: David Cutri, University of Toledo PG 4-1
Lean Six Sigma Tools for Planning and Execution Unit 4: RACI Diagram
RACI DIAGRAM BACKGROUND
Many corporations and governmental organizations today operate in the matrix form of organizational structure, which is a grid-like structure that:
• • • •
Allows companies to focus on multiple business goals Facilitates the management of information Enables companies to establish economies of scale Speeds response to environmental demands
However, companies face a host of challenges when adopting a matrix structure, such as:
• • •
•
Competing or conflicting objectives among matrix dimensions Inadequate processes to align goals and detect possible misalignments Lack of synchronization, coordination, and poor timing of work plans and objectives Insufficient communication and consultation among matrix dimensions
Confusion over roles and responsibilities is a problem in almost all matrix organizations. Employees cite the following issues concerning unclear roles and responsibilities:
• • • •
Unclear job descriptions and guidelines for roles and responsibilities Tension among employees, created by ambiguous roles and responsibilities Confusion over who is the boss Not knowing whom to contact for information
Studies reveal that companies must have four fundamental elements when establishing roles and responsibilities:
1. 2. 3. 4.
Clear guidelines and descriptions on roles/areas of responsibility Assignment of accountability for business objectives A single point of contact for information or approval for areas of responsibility A set plan for communication and information sharing (e.g., monthly town hall meetings, newsletters, quarterly company/unit performance)
The RACI diagram is a tool to help employees clarify their roles and responsibilities.
Prepared by: David Cutri, University of Toledo PG 4-2
Lean Six Sigma Tools for Planning and Execution Unit 4: RACI Diagram
WHAT IS A RACI DIAGRAM?
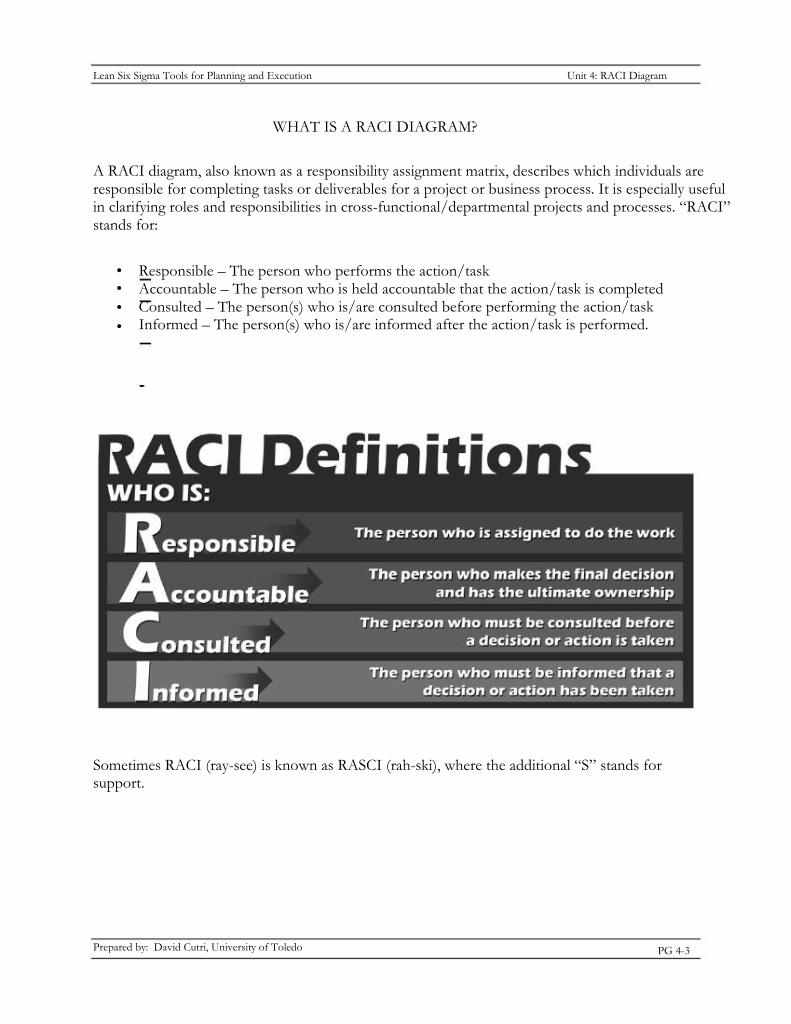
A RACI diagram, also known as a responsibility assignment matrix, describes which individuals are responsible for completing tasks or deliverables for a project or business process. It is especially useful in clarifying roles and responsibilities in cross-functional/departmental projects and processes. “RACI” stands for:
• •
•
•
Responsible – The person who performs the action/task Accountable – The person who is held accountable that the action/task is completed Consulted – The person(s) who is/are consulted before performing the action/task Informed – The person(s) who is/are informed after the action/task is performed.
Sometimes RACI (ray-see) is known as RASCI (rah-ski), where the additional “S” stands for support.
Prepared by: David Cutri, University of Toledo PG 4-3
Lean Six Sigma Tools for Planning and Execution Unit 4: RACI Diagram
NOTES AND REFLECTION
A RACI diagram can be used to determine fundamental issues with a process, such as when the wrong people are involved and/or no one is accountable. In its most basic form, it is a way to examine a process step, task, activity, effort, decision, or inspection to determine who is responsible, accountable, consulted, or informed. We will examine each of these elements in more detail below.
Prepared by: David Cutri, University of Toledo PG 4-4
Lean Six Sigma Tools for Planning and Execution Unit 4: RACI Diagram
RACI DIAGRAM KEY ROLES
Responsible • Typically, one person takes ultimate responsibility for the project, although others can be delegated to
assist with the work required. • The degree of responsibility is defined by the responsible person. • Responsibility can be shared. • Responsibility can be delegated (unlike accountability).
Accountable • This person is ultimately answerable for the correct and thorough completion of the deliverable or
task. • The accountable person delegates work to the responsible person (i.e., he/she must sign off on, or
approve of, the work provided by the responsible person). • There is only one person held accountable for each task/activity or deliverable. • Accountability is assigned at the lowest level and implied at higher levels. • Accountability cannot be delegated.
Consulted • The individuals who are consulted prior to making a final decision or taking action. • Those whose opinions are sought, typically subject matter experts, and who take part in two-way
communication.
Informed • The individuals who need to be informed after decisions are made or action is taken. • Those that are kept up-to-date on progress, often only on completion of the task or deliverable, and
with whom there is just one-way communication.
There is a distinction between a role and individually identified people: a role is a descriptor of an associated set of tasks, which may be performed by many people, and one person can perform many roles. For example, an organization may have 10 people who can perform the role of project manager, although traditionally each project only has one project manager at any one time; and a person who is able to perform the role of project manager also may be able to perform the role of business analyst and tester.
Prepared by: David Cutri, University of Toledo PG 4-5
Lean Six Sigma Tools for Planning and Execution Unit 4: RACI Diagram
Very often, the person assigned the role of accountability for a task or deliverable also is responsible for completing it. This scenario is indicated on the matrix by the task or deliverable having an accountability role, but no role responsible for the project’s completion (i.e., the role is implied). Outside of this exception, it is generally recommended that each role in the project or process for each task receive, at most, just one of the participation types. Where more than one participation type is shown, this generally implies that participation has not yet been resolved fully, which can impede the value of this technique in clarifying the participation of each role on each task. See page 4-11 for an example of a RACI diagram.
Prepared by: David Cutri, University of Toledo PG 4-6
Lean Six Sigma Tools for Planning and Execution Unit 4: RACI Diagram
RACI DIAGRAM REASONS, BENEFITS, AND USES
Reasons
Reasons for using a RACI diagram on a project include:
•
• •
•
•
“Too many cooks in the kitchen” – Everyone thinks they are responsible and accountable, resulting in duplication of effort and in-fighting. No one is responsible – Some steps are not owned. Informed versus consulted – Some people believe that they need to be consulted when they just really need to be told after the fact (informed). Need for consult – Some people need to be consulted for the process to move forward, but they are not. Improvement across the board – There is poor communication, poor process definition, and poor hand-offs.
Also, when you hear these types of comments in an organization, a RACI analysis may be overdue:
• • • • •
“My boss always overrules my decisions whenever she wants.” “The approval process for even the simplest item takes so long today.” “It seems everyone is putting together a spreadsheet on the same data.” “Things are always slipping through the cracks.” “I have the responsibility, but not the authority to get the job done.”
Benefits
There are numerous benefits of using a RACI diagram on a project. It can:
• • • • • • • • •
Encourage teamwork by clarifying roles and responsibilities. Eliminate duplication of effort. Reduce misunderstanding. Improve communication. Ensure people are not “left out.” Help determine ownership of process tasks. Clarify activities and tasks in a process. Reduce bad decisions by ensuring the correct people are involved. Clarify “hand-offs” and boundaries.
PG 4-7 Prepared by: David Cutri, University of Toledo
Lean Six Sigma Tools for Planning and Execution Unit 4: RACI Diagram
•
Uses
Improve cross-functional view for all employees.
A RACI diagram can be used for:
•
•
•
•
•
•
•
Workload analysis – When used against individuals or departments, overloads can be identified quickly Reorganization – To ensure that key functions and processes are not overlooked Employee turnover – Newcomers can identify their roles and responsibilities quickly Work assignment – Allows duties to be redistributed effectively among groups and individuals Project management – Allows for flexibility in matrix management situations and achieving the right balance between line and project accountabilities Conflict resolution – Provides a forum for discussing and resolving inter-departmental conflict Documents the status quo – The output from RACI is a simple, yet effective, method of documenting the roles and responsibilities in an organization
CONSTRUCTING A RACI DIAGRAM
Steps for constructing a RACI diagram are:
1. Identify the functions and processes within the organization or department and describe the key activities taking place. Avoid obvious or generic activities such as “attending meetings.”
2. Describe each activity or decision using a suitable action verb. Examples include: • Schedule• Write• Evaluate • Operate• Determine• Record • Update• Monitor• Prepare • Approve• Conduct• Collect • Inspect• Train• Develop • Review• Report• Publish • Decide• Plan• Authorize
Prepared by: David Cutri, University of Toledo PG 4-8
Lean Six Sigma Tools for Planning and Execution Unit 4: RACI Diagram
3. When the action implies a judgment or decision (e.g., evaluate, monitor, inspect, or review) create a phrase to indicate the primary outcome. For example:
• Monitor service desk customer requests to identify training needs. • Analyze call statistics to identify product problems.
4. Ensure that the activities or decisions to be made are short and apply to a role or need, not to the specific person currently carrying out the task.
5. Create a matrix with roles along the top and activities/tasks along the left side; in each of the table cells enter the appropriate RACI code.
When the analysis is done and the RACI matrix is populated, any ambiguities need to be resolved. The matrix must be reviewed and questions asked of the data pattern to explore what it is telling us. The way to do this is to proceed along the vertical and then the horizontal axes, in turn, and for each column or row ask: “If I find ... then what does this mean?”
Prepared by: David Cutri, University of Toledo PG 4-9
•
Lean Six Sigma Tools for Planning and Execution Unit 4: RACI Diagram
RACI Diagram Considerations
The following is a list of tips, tricks, and considerations for RACI diagrams.
• •
Each vertical column should have only one ‘A.’ Is there too many A’s in the matrix? If so, this is probably a sign of confusion. No one will be sure who really holds accountability for the task and each individual probably will have a different approach and/or expectation(s). Each vertical column should have one ‘R’, but can have more in some situations of shared responsibility. With no ‘R’s, a gap occurs. Who ensures that the task is being completed? Responsibility must be assigned. If a column has more than one ‘R,’ then determine whether the task can be subdivided. With too many ‘R’s an overlap can occur. Minimize the number of ‘C’s. Make sure the consult is necessary and not just a “feel good” contact. Are there too many “I”s? Maybe some people only need to be informed if exceptional circumstances occur. - Build the appropriate criteria into the process. If there are no empty spaces in a row, ask “Does this person need to be involved in every step?” Try to reduce ‘C’s and ‘I’s first. If one person has too many “R”s, he/she may have too much to do. Can the activities be broken into small sections and split out to others? If there are no ‘A’s or ‘R’s, consider whether this role should be eliminated from this process. Has the process changed over time so that they are no longer needed? If so, try to eliminate. If one person has too many ‘A’s, consider whether the person is a bottleneck, and ask “Can these tasks be shared or segregated?” If there is a completely empty row, ask “Why was this function included? Are we missing including them when they should be? Can the function be eliminated form the process?”
•
•
• • •
•
•
• •
•
• • • •
Prepared by: David Cutri, University of Toledo PG 4-10
Lean Six Sigma Tools for Planning and Execution Unit 4: RACI Diagram
IDEAS AND INSIGHTS
What new ideas or insights did you acquire?
How will you incorporate what you learned into your work?
Prepared by: David Cutri, University of Toledo PG 4-11

SIPOC Diagram

Lean Six Sigma Tools for Planning and Execution Unit 5: SIPOC Diagram
UNIT FIVE: SIPOC DIAGRAM
UNIT OBJECTIVES
As a result of your active participation in this unit, you will be able to produce a SIPOC diagram that captures key suppliers, inputs, process steps, outputs, and customers of a selected process by:
•
•
•
•
Explaining the purpose and importance of a process mapping
Explaining the purpose and importance of a SIPOC diagram
Constructing a SIPOC diagram for capturing a business process and describing its key relationships
Describing the keys to a successful SIPOC diagram
Prepared by: David Cutri, University of Toledo PG 5-1
Lean Six Sigma Tools for Planning and Execution Unit 5: SIPOC Diagram
BUSINESS PROCESS MAPPING
A process map is a diagram that shows the flow of material and information through the process. It is a logically grouped sequence of serial and parallel tasks consisting of people, machines, materials, and information. Process maps are useful especially in situations where a process is not achieving its operational targets or the workflow tasks are not defined well.
The first step before creating a process map should be to determine the project problem statement and objective, which are obtained from the project charter. The project’s problem statement sets the boundaries of the process under analysis based on the key process output variables (KPOVs). This will ensure that the data collection and analysis efforts are focused correctly.
High-level vs. Functional
High-level maps show the major organizational relationships within a process. Functional process maps show the relationships between functions as well as the flow through each function over time.
Business Process Mapping Tools
Three key Lean Six Sigma tools that can be used for effective process mapping in the planning phase of a process improvement project are:
• • •
SIPOC mapping Value stream mapping “As-is” and “to be” spaghetti diagram
In this unit, we will discuss the first of these three tools.
Prepared by: David Cutri, University of Toledo PG 5-2
Lean Six Sigma Tools for Planning and Execution Unit 5: SIPOC Diagram
SIPOC MAPPING
A key tool used to scope a project is a process map called the SIPOC. The SIPOC is a high-level, quantified system map that shows process input/output relationships. The acronym SIPOC stands for: • Supplier. • Inputs to the process, including materials, labor, and information. • Process, which converts inputs into outputs. • Outputs, including material, labor, and information. • Customer, who receives the output from the process. Because improvement projects can often cover activities outside of the enterprise, such as customers and suppliers, the analysis should cover their needs and requirements.
Development of the program to improve a major work stream begins with the SIPOC, which helps the team understand the major key process input variables (KPIVs) and KPOVs/requirements of the work stream as well as their inter-relationships. Additionally, the critical-to-quality (CTQ) elements of a business process should be noted. Identifying the key inputs and outputs of the process begins with a team brainstorming session, where the improvement team identifies all the possible inputs and associated outputs of the process. Using these inputs and outputs, the team creates a SIPOC map that describes spatial and dynamic relationships among all process activities. Materials needed during this session include:
• • •
A whiteboard, printed worksheets, or flipcharts to record inputs A SIPOC overview handout/PowerPoint presentation Posters that list:
o Action items. o Parking lot. o Plus/delta o Well-defined process.
The time required varies, depending on the complexity of the process, the knowledge of the participants of the process, and their previous experience creating SIPOCs, but generally plan for at least two hours.
Prepared by: David Cutri, University of Toledo PG 5-3
Lean Six Sigma Tools for Planning and Execution Unit 5: SIPOC Diagram
Steps to Create a SIPOC Diagram
1. Conduct an overview – Provide participants a brief overview of the SIPOC process, purpose, tools/templates, and especially the Keys to a Successful SIPOC, which are found on page 5-7. Do this step even if working with a knowledgeable group to “level set” the group and review elements critical to conducting a successful SIPOC session.
2. Establish the Framework – Review the SIPOC framework on the whiteboard, worksheet, or flipchart and identify: • The process owner. • The process name. • The process start/cue/prompt/trigger/event. • The process end/cue/prompt/trigger/event. • Any known process assumptions/constraints. • Any known operational definitions of key process elements. • Feedback loops (i.e., how you, your customer, and your supplier will communicate). • Supplier – Input/Requirements – Process – Outputs/Requirements – Customer – CTQs.
Use this review as a means of setting a positive tone with the group and developing a conversational style of facilitating the session. Remind the group that the assumptions and operational definitions are ongoing lists and may be added to as needed during the session. The idea is to make sure everyone is working on the same sheet of paper and means the same thing when using a term and that an assumption is made visible, discussed, and validated or challenged as appropriate.
Be flexible and use the group’s own words and terms. Write the framework down, and then ask open-ended, clarifying questions to get it right. Challenge the status quo, test group members’ understanding of their own process, and encourage them to dialogue.
Prepared by: David Cutri, University of Toledo PG 5-4
Lean Six Sigma Tools for Planning and Execution Unit 5: SIPOC Diagram
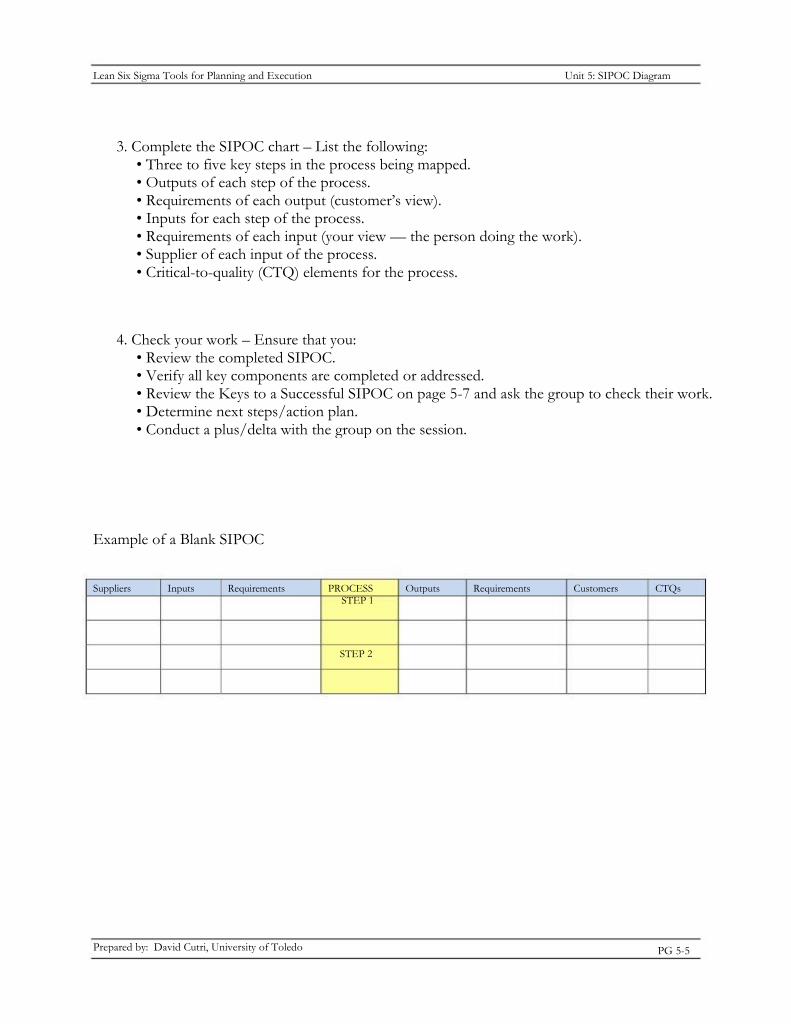
3. Complete the SIPOC chart – List the following: • Three to five key steps in the process being mapped. • Outputs of each step of the process. • Requirements of each output (customer’s view). • Inputs for each step of the process. • Requirements of each input (your view — the person doing the work). • Supplier of each input of the process. • Critical-to-quality (CTQ) elements for the process.
4. Check your work – Ensure that you: • Review the completed SIPOC. • Verify all key components are completed or addressed. • Review the Keys to a Successful SIPOC on page 5-7 and ask the group to check their work. • Determine next steps/action plan. • Conduct a plus/delta with the group on the session.
Example of a Blank SIPOC
Suppliers Inputs Requirements PROCESS STEP 1
Outputs Requirements Customers CTQs
STEP 2
Prepared by: David Cutri, University of Toledo PG 5-5
Lean Six Sigma Tools for Planning and Execution Unit 5: SIPOC Diagram
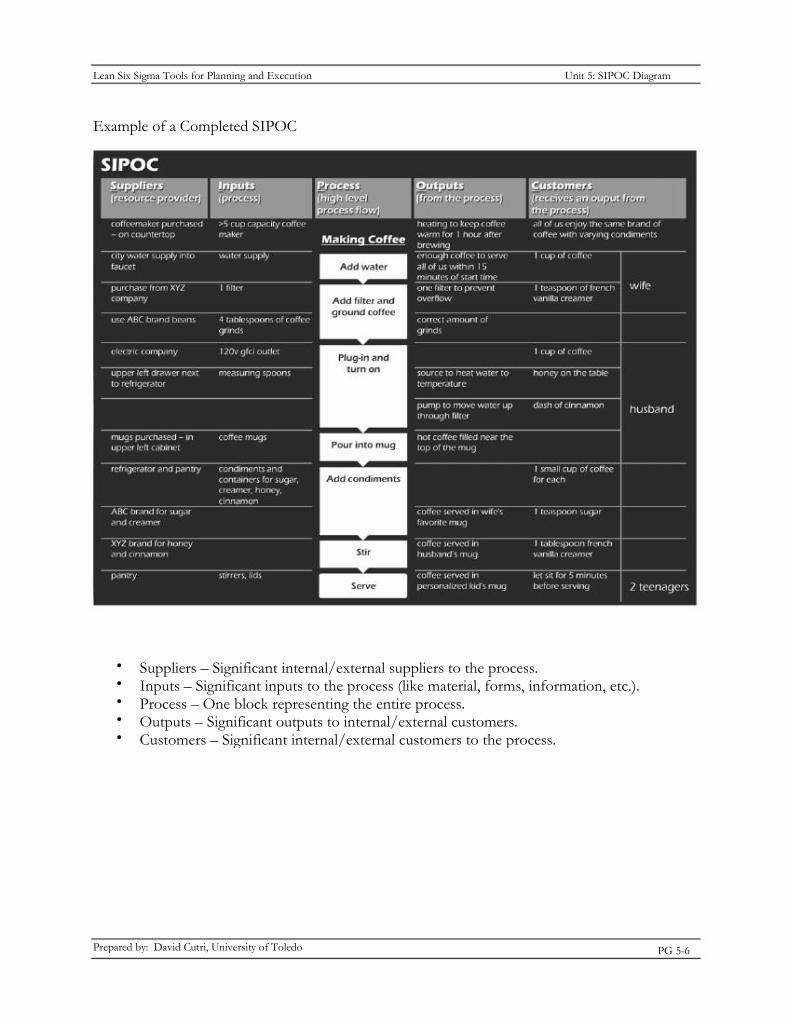
Example of a Completed SIPOC
• • • • •
Suppliers – Significant internal/external suppliers to the process. Inputs – Significant inputs to the process (like material, forms, information, etc.). Process – One block representing the entire process. Outputs – Significant outputs to internal/external customers. Customers – Significant internal/external customers to the process.
Prepared by: David Cutri, University of Toledo PG 5-6
Lean Six Sigma Tools for Planning and Execution Unit 5: SIPOC Diagram
SIPOC Key Learning Points
• • • • •
• •
All work is a process, and all processes can be improved. The real value of a SIPOC is the conversations it inspires. Begin with the end in mind (i.e., “How will you use this SIPOC?”) Define how things really get done, not how you want them to be. Make your process, assumptions, constraints, understanding, and decision criteria visible. Get it down on paper, and then get it right! Use only as much detail as needed to understand/communicate effectively.
Keys to a Successful SIPOC
•
• • •
• •
Clearly identify the start of your process (i.e., the cue, prompt, or trigger that requires you to act) Clearly identify the end of your process (i.e., How do you know you are done?) Make sure all assumptions are visible, discussed, validated, and documented Document the operational definitions of key terms, symbols, acronyms, equipment, standards, etc. Identify your information/communication loops and feedback mechanisms Document source specifications, standard operating procedures, and/or references for your process
The goal is planned, predictable performance at a world-class level!
Prepared by: David Cutri, University of Toledo PG 5-7
Lean Six Sigma Tools for Planning and Execution Unit 5: SIPOC Diagram
IDEAS AND INSIGHTS
What new ideas or insights did you acquire?
How will you incorporate what you learned into your work?
Prepared by: David Cutri, University of Toledo PG 5-8


Value Stream Mapping

Lean Six Sigma Tools for Planning and Execution Unit 6: Value Stream Mapping
UNIT SIX: VALUE STREAM MAPPING
UNIT OBJECTIVES
As a result of your active participation in this unit, you will be able to map the value stream of a given process to analyze the flow of materials and information required to bring a product or service to a customer by:
•
•
•
•
Explaining the importance of quantification in a value stream map
Describing how customer value is tracked within a value stream map
Describing the business process component categories captured in a value stream map
Constructing a value stream map for capturing a business process
Prepared by: David Cutri, University of Toledo PG 6-1
Lean Six Sigma Tools for Planning and Execution Unit 6: Value Stream Mapping
VALUE STREAM MAPPING
One of the most useful Lean Six Sigma tools used to conduct a process assessment is a value stream map (VSM). Similar to a flowchart, a VSM is a detailed and quantified process map that describes every operation within a work stream, including the operations’ inter-relationships. The VSM quantifies material and information flow through the process and is used to identify and eliminate unnecessary operations and other operational waste.
Quantification Quantitatively mapping a process, even at a high level, relative to key process input variables (KPIV) and their associated key process output variables (KPOV) usually identifies numerous ways to improve the process by highlighting its strengths and weaknesses. The more highly quantified the process map, the more useful its information is relative to potential process improvements.
Value VSMs are also very useful in mapping the flow of value throughout a process to identify those operations that can be eliminated, versus those that must be maintained as part of the system. The purpose of this analysis is to identify operations that are not adding value to the process. As the VSM analysis proceeds, each work task is correlated to the customer value it creates. Understanding what the external customer considers important (of value) has been shown to enhance the ability of the improvement team to differentiate nonessential operations from those that are important to the customer. An operational assessment analyzes a process starting from customer requirements and working backward through the process toward supplier inputs. Customer value is mapped back through the process in these maps.
Categories The operations within a process can be broken into three categories based on the concept of customer value: • Value-adding (VA). • Business value-adding (BVA). • Non-value-adding (NVA).
Prepared by: David Cutri, University of Toledo PG 6-2
Lean Six Sigma Tools for Planning and Execution Unit 6: Value Stream Mapping
Value-adding operations create the product, service attributes, and features the customer desires. The other two categories of operations increase process complexity, resulting in higher cost and cycle time:
• BVA operations – Operations that often are hidden from the customer, but they are necessary to ensure that the product or service offerings meet external customer requirements. Examples include back-office invoice processing, updating IT systems, inspection activities, and other tasks necessary to run the process. BVA operations exist because of technological barriers that prohibit their elimination. Although BVA operations may be necessary in the short term, they eventually should be eliminated from the process when technically feasible.
NVA operations – NVA are operations that are completely unnecessary from either the internal or external customer viewpoint. NVA operations should be eliminated immediately from the process.
•
An operational assessment is used to distinguish the three categories from each other.
Prepared by: David Cutri, University of Toledo PG 6-3
Lean Six Sigma Tools for Planning and Execution Unit 6: Value Stream Mapping
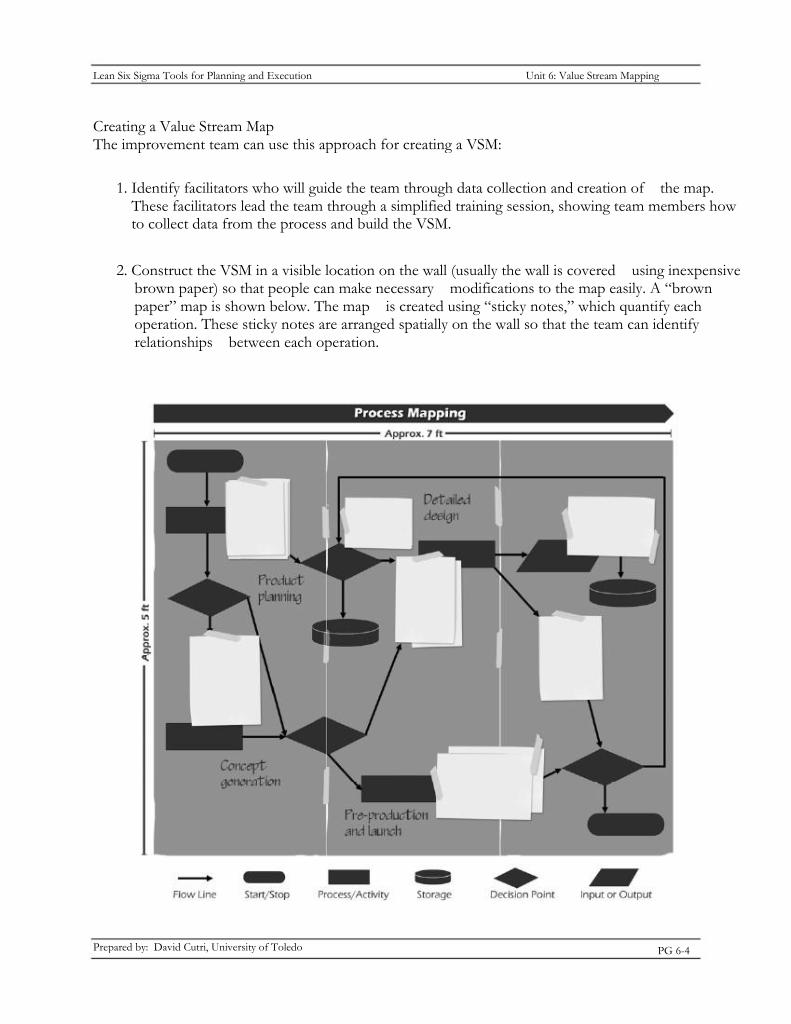
Creating a Value Stream Map The improvement team can use this approach for creating a VSM:
1. Identify facilitators who will guide the team through data collection and creation of the map. These facilitators lead the team through a simplified training session, showing team members how to collect data from the process and build the VSM.
2. Construct the VSM in a visible location on the wall (usually the wall is covered using inexpensive brown paper) so that people can make necessary modifications to the map easily. A “brown paper” map is shown below. The map is created using “sticky notes,” which quantify each operation. These sticky notes are arranged spatially on the wall so that the team can identify relationships between each operation.
Prepared by: David Cutri, University of Toledo PG 6-4
Lean Six Sigma Tools for Planning and Execution Unit 6: Value Stream Mapping
In addition to operational metrics quantifying material flow, paste copies of all management reports just below the sticky notes that describe each operation. These management reports include product forecasts, material control forms, inspection reports, testing reports, and schedules, as well as other relevant information.
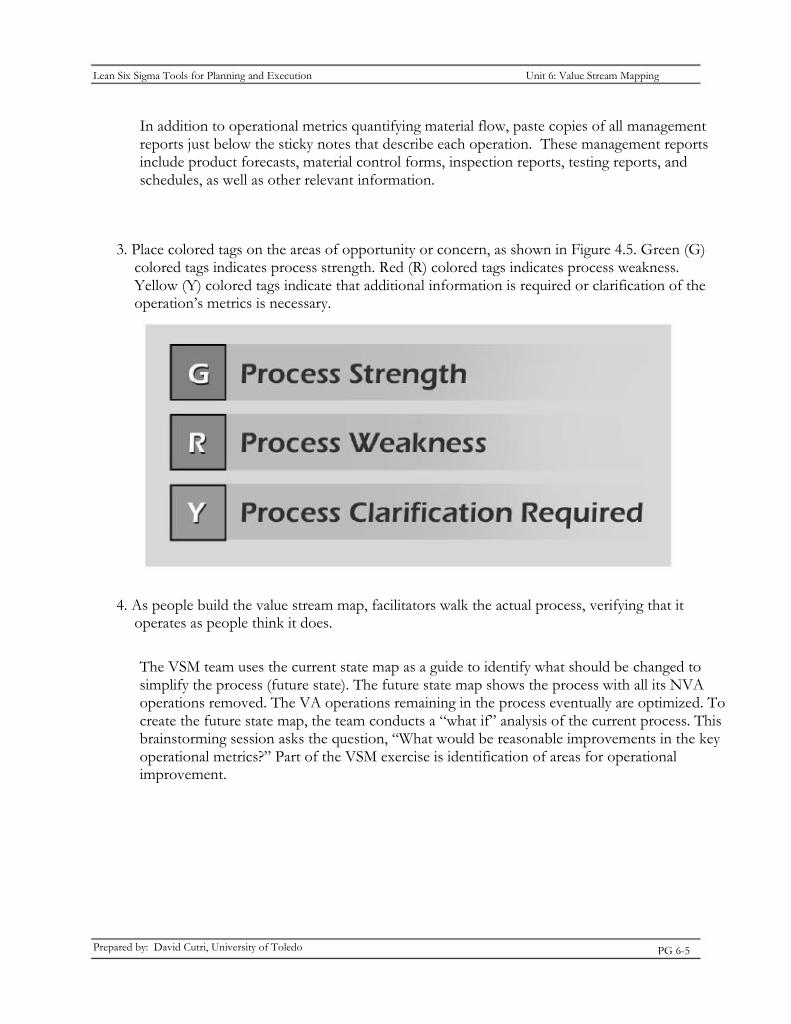
3. Place colored tags on the areas of opportunity or concern, as shown in Figure 4.5. Green (G) colored tags indicates process strength. Red (R) colored tags indicates process weakness. Yellow (Y) colored tags indicate that additional information is required or clarification of the operation’s metrics is necessary.
4. As people build the value stream map, facilitators walk the actual process, verifying that it operates as people think it does.
The VSM team uses the current state map as a guide to identify what should be changed to simplify the process (future state). The future state map shows the process with all its NVA operations removed. The VA operations remaining in the process eventually are optimized. To create the future state map, the team conducts a “what if” analysis of the current process. This brainstorming session asks the question, “What would be reasonable improvements in the key operational metrics?” Part of the VSM exercise is identification of areas for operational improvement.
Prepared by: David Cutri, University of Toledo PG 6-5

Lean Six Sigma Tools for Planning and Execution Unit 6: Value Stream Mapping
IDEAS AND INSIGHTS
What new ideas or insights did you acquire?
How will you incorporate what you learned into your work?
Prepared by: David Cutri, University of Toledo PG 6-6


“As Is” and “To Be” Spaghetti Diagrams

Examining the spatial relationships of the key steps in a “to be” spaghetti diagram and developing a more streamlined process path.
Lean Six Sigma Tools for Planning and Execution Unit 7: “As Is” and “To Be” Spaghetti Diagrams
UNIT SEVEN: “AS IS” AND “TO BE” SPAGHETTI DIAGRAMS
UNIT OBJECTIVES
As a result of your active participation in this unit, you will be able to construct “as is” and “to be” spaghetti diagrams, adapted from process flowcharts, which highlight and streamline the number of key steps and spatial relationships of a particular process by:
•
•
•
•
Explaining the purpose of an “as is” spaghetti diagram
Demonstrating how “as is” and “to be” spaghetti diagrams are adapted from process flowcharts
Eliminating the superfluous steps in a “to be” spaghetti diagram.
Prepared by: David Cutri, University of Toledo PG 7-1
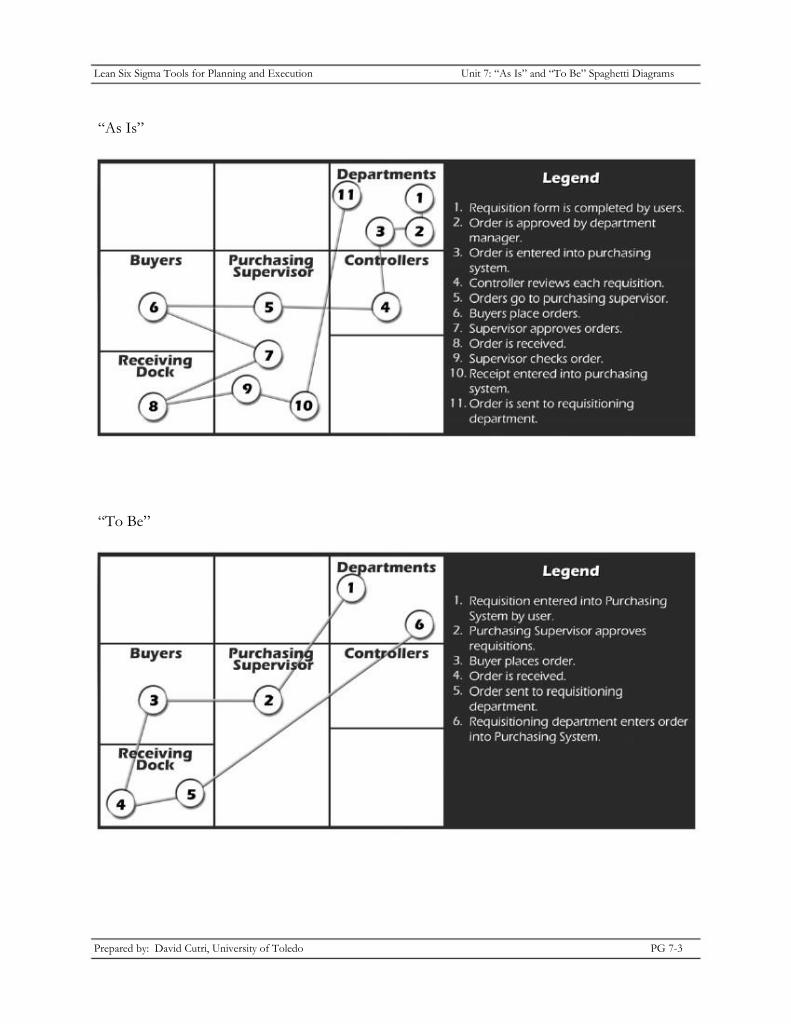
To create the “to be” spaghetti diagram, the “as-is” diagram is revised to incorporate all of the improvements recommended by employees. Comparison of the “as-is” and “to be” diagrams visually illustrates how the proposed process can be simplified and streamlined. This comparison can be the focal point of a short, very persuasive presentation to management.
Unit 7: “As Is” and “To Be” Spaghetti Diagrams
WHAT IS A SPAGHETTI DIAGRAM?
A spaghetti diagram is an adaptation of the flowchart that highlights the number of steps needed to complete a process and the sometimes circuitous route these steps take through various departments. It is typically less detailed than the standard process flowchart. Like the flowchart, the spaghetti diagram acts as a documentation and evaluation tool. However, the spaghetti diagram also is used as a reporting tool when the project is finished.
Two spaghetti diagrams usually are prepared in a Lean Six Sigma effort: an “as is” and a “to be.” The “as is” diagram is a simple, one-page diagram that’s normally prepared from the multi-page process flowchart to identify the number of steps in the process as well as the route the process follows as it moves from department to department. This simplified format is easy to review and understand. It serves two purposes:
1. It dramatizes how complicated the existing process is. It can be a powerful “selling” tool that change is needed.
2. Its simplicity makes it easy to review and comprehend. It spurs employees to question whether certain steps can be eliminated or departments can be bypassed.
Prepared by: David Cutri, University of Toledo PG 7-2
Lean Six Sigma Tools for Planning and Execution
Lean Six Sigma Tools for Planning and Execution
“As Is”
“To Be”
Unit 7: “As Is” and “To Be” Spaghetti Diagrams
Prepared by: David Cutri, University of Toledo PG 7-3
Lean Six Sigma Tools for Planning and Execution Unit 7: “As Is” and “To Be” Spaghetti Diagrams
Look at the process steps described in the above example of an “as is” spaghetti diagram. What are the movements for? Are large distances traveled? Are numerous movements made to the same location? Look at the process steps described in the above example of a “to be” spaghetti diagram. What improvements were made?
A spaghetti diagram is a graphical tool used to provide a visual representation of the physical flow of work and/or material in a process, using a continuous flow line, tracing the path of an item or activity through the process. The purpose of this tool is to expose inefficient process layouts, unnecessary travel distance between process steps, and overall process waste.
The continuous flow line enables process teams to identify redundancies in the work flow and opportunities to expedite process flow. The goal is to look for opportunities to move necessary process steps closer in location to one another to improve the process. Analyzing flows through systems also can help determine where time and energy is wasted and identify where streamlining would be beneficial.
In addition, spaghetti diagrams are a great way to monitor the movement of personnel within a predefined part of an organization. Monitoring movement is a crucial part of the analysis (remember, movement is one of the seven wastes) because by identifying movements, you can organize your layout better and improve efficiency. In fact, you can construct your spaghetti diagram as you walk the process during a waste walk. Waiting is one of the common wastes in a process as well.
Although this tool has its origins in manufacturing, these diagrams can be used in many different business environments and even work when analyzing an office environment. A spaghetti diagram differs from detailed process maps and value stream maps (VSMs) in that it does not necessarily require sequential process steps.
Prepared by: David Cutri, University of Toledo PG 7-4
Lean Six Sigma Tools for Planning and Execution Unit 7: “As Is” and “To Be” Spaghetti Diagrams
Benefits of Spaghetti Diagrams
Spaghetti diagrams are useful for identifying:
• • • • •
Inefficiencies in area/workspace layout/design Opportunities for less handling Opportunities for better workforce communication Resource allocation opportunities Opportunities for safety improvements
They can also help highlight major intersection points within the workspace. Areas where many walk paths overlap are causes of delay.
Collaboration of the staff most affected by the current workplace design is a residual benefit of creating the spaghetti diagram. Focusing on a common goal brings the team closer together while highlighting the purpose for placement of some work areas.
Creating an “As Is” Spaghetti Diagram There are four steps to create an “as is” spaghetti diagram:
1. Start by either printing out or drawing a diagram of the floor plan of the area that contains the process you’re evaluating.
2. Identify the object/person you wish to track and its starting point on the map. 3. Start your line from there to where the second step happens, replicating the actual flow of your
object/person on the map. 4. Continue the line until the completion of the process, where you have mapped all process steps.
A common mistake in creating a spaghetti diagram is drawing the line through walls; do not do this, as this does not realistically represent the actual flow of the object/person. When the diagram is drawn correctly, typically the line looks like a piece of spaghetti, which is how the diagram gets its name.
Producing a spaghetti diagram isn’t difficult. You don’t need specialist software; you can do it with a paper and pen. All you really need is a layout diagram of the building/office/area to be mapped and someone to track the movement of the object or resource of interest. Every time your target moves, annotate its tracks onto the layout diagram.
Prepared by: David Cutri, University of Toledo PG 7-5
Lean Six Sigma Tools for Planning and Execution Unit 7: “As Is” and “To Be” Spaghetti Diagrams
One point to consider is how long you should monitor your target. Ensure you monitor for enough time to get a representative sample. You might even want to run the monitoring event a number of times. (Remember that you want to use the data to make decisions, so it needs to be accurate.)
The real power of spaghetti diagrams is what they tell you when they’re completed. Remember, we’re looking to reduce excess movement, so we’re looking at how best to minimize both the number and distance travelled. Once the diagram is complete, look at what you’ve learned. What is the purpose of each movement? Are large distances travelled? Are numerous movements made to the same location? Once we understand the purpose of each movement, we can begin optimizing the workplace.
Prepared by: David Cutri, University of Toledo PG 7-6
Lean Six Sigma Tools for Planning and Execution Unit 7: “As Is” and “To Be” Spaghetti Diagrams
IDEAS AND INSIGHTS
What new ideas or insights did you acquire?
How will you incorporate what you learned into your work?
Prepared by: David Cutri, University of Toledo PG 7-7


Waste Walk

Lean Six Sigma Tools for Planning and Execution Unit 8: Waste Walk
UNIT EIGHT: WASTE WALK
UNIT OBJECTIVES
As a result of your active participation in this unit, you will be able to perform a waste walk and recognize common wastes in a business process by:
•
•
•
•
Explaining the purpose and importance of performing a waste walk
Describing how to perform a waste walk effectively
Describing common wastes that exist in a business process
Describing the traditional “seven wastes” as a historical reference
Prepared by: David Cutri, University of Toledo PG 8-1
Lean Six Sigma Tools for Planning and Execution Unit 8: Waste Walk
WASTE WALK
A “waste walk” is a Lean Six Sigma tool used to identify potential areas of waste. The purpose of a waste walk is to identify not only waste, but opportunities and solutions. It is can be conducted in conjunction with a walk-through. The scope of the waste walk is the specific area or business process to be reviewed.
The recommended group size for a waste walk is three to five people. Materials to be used on the waste walk generally can be as simple as a notepad, pen, and checklist. A digital camera could be used as well.
In conducting the waste walk, the following steps should be followed:
1. 2. 3. 4.
View selected business process or work center. Observe the business process or work center. Identify the wasteful activities. Describe your findings.
The graphic below, identifies and provides a guide for common wastes, which the project team should be alerted to observe and note during the waste walk.
Prepared by: David Cutri, University of Toledo PG 8-2
Lean Six Sigma Tools for Planning and Execution Unit 8: Waste Walk
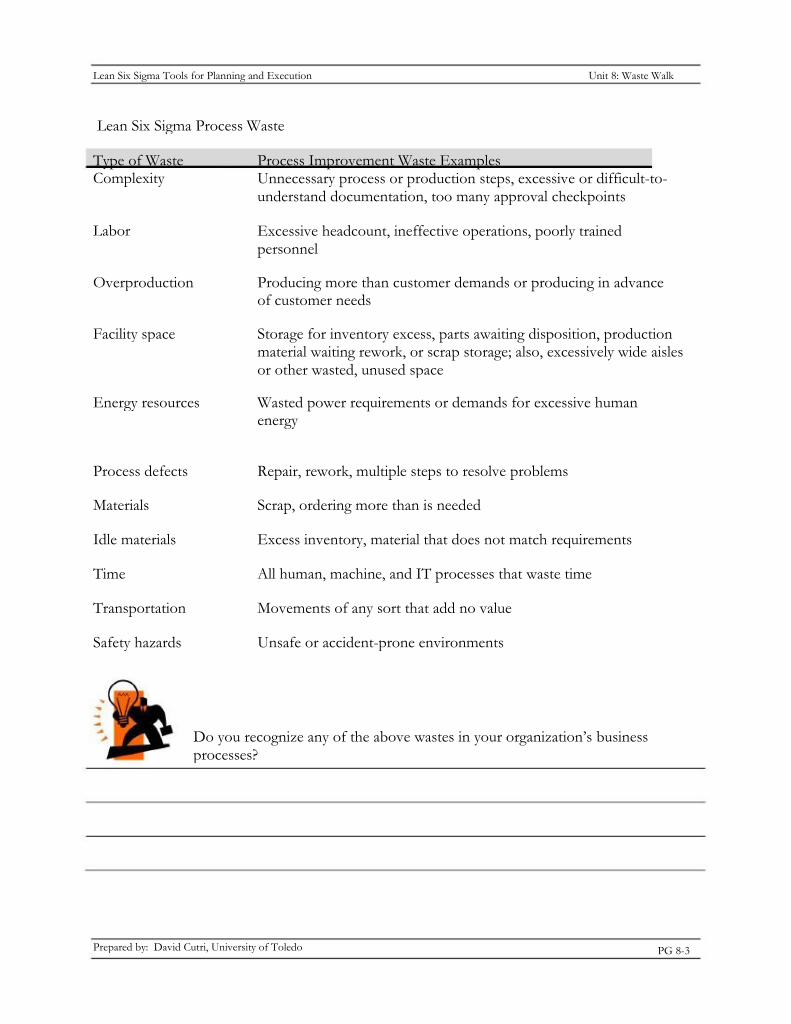
Lean Six Sigma Process Waste
Type of Waste Complexity
Process Improvement Waste Examples Unnecessary process or production steps, excessive or difficult-to-understand documentation, too many approval checkpoints
Excessive headcount, ineffective operations, poorly trained personnel
Producing more than customer demands or producing in advance of customer needs
Storage for inventory excess, parts awaiting disposition, production material waiting rework, or scrap storage; also, excessively wide aisles or other wasted, unused space
Wasted power requirements or demands for excessive human energy
Labor
Overproduction
Facility space
Energy resources
Process defects
Materials
Idle materials
Time
Transportation
Safety hazards
Repair, rework, multiple steps to resolve problems
Scrap, ordering more than is needed
Excess inventory, material that does not match requirements
All human, machine, and IT processes that waste time
Movements of any sort that add no value
Unsafe or accident-prone environments
Do you recognize any of the above wastes in your organization’s business processes?
Prepared by: David Cutri, University of Toledo PG 8-3
Lean Six Sigma Tools for Planning and Execution Unit 8: Waste Walk
SEVEN WASTES
There are "seven wastes" — originally based on Lean manufacturing principles — that reflect common inefficiencies in a supply chain process. The acronym for the Seven Wastes is “TIM WOOD,” which stands for:
• • • • • • •
Transportation Inventory Motion Waiting Overproduction Over-processing Defects
Each of these elements is described in more detail below:
• Transportation (Unnecessary) – Each time a product is moved, it stands the risk of being damaged, lost, delayed, etc., as well as being a cost for no added value. Transportation does not make any transformation to the product that the consumer is supposed to pay for.
Inventory – Inventory, be it in the form of raw materials, work-in-progress (WIP), or finished goods, represents a capital outlay that has not yet produced an income, either by the producer or for the consumer. Any of these three items not being processed actively to add value is considered waste.
Motion – As compared to unnecessary transportation (which deals with transport of the product) motion refers to movement of the producer, worker, or equipment, which can cause damage, wear, or safety issues. It also includes the fixed assets and expenses incurred in the production.
Waiting – Whenever goods are not in transport or being processed, they are waiting. In traditional processes, a large part of an individual product's life is spent waiting to be worked on.
Overproduction – Overproduction happens each time you engage more resources than needed to deliver to your customer. For instance, large batch production, because of long change overtime, exceeds the strict quantity ordered by the customer. For productivity improvement, operators are required to produce more than the customer needs. Extra parts are then stored and not sold.
PG 8-4
•
•
•
•
Prepared by: David Cutri, University of Toledo
Lean Six Sigma Tools for Planning and Execution Unit 8: Waste Walk
Overproduction is the worst waste because it hides or generates all other wastes, especially inventory. Overproduction increases the amount of space needed for storing raw material as well as finished goods. It also requires a preservation system.
• Over-processing – Over-processing occurs any time more work is done on a piece than what is required by the customer. This also includes using tools that are more precise, complex, or expensive than absolutely required.
Defects – Whenever defects occur, extra costs are incurred to rework the part, reschedule production, etc.
•
Following the waste walk, the improvement team should be ready to present their findings in a debriefing. The total time required for the review is approximately one hour (45 minutes for the waste walk and 15 minutes for the debriefing).
Prepared by: David Cutri, University of Toledo PG 8-5
Lean Six Sigma Tools for Planning and Execution Unit 8: Waste Walk
IDEAS AND INSIGHTS
What new ideas or insights did you acquire?
How will you incorporate what you learned into your work?
Prepared by: David Cutri, University of Toledo PG 8-6

5S

Lean Six Sigma Tools for Planning and Execution Unit 9: 5S
UNIT NINE: 5S
UNIT OBJECTIVES
As a result of your active participation in this unit, you will be able to utilize the 5S workplace organization methodology to assess work space efficiency and effectiveness by:
•
•
Describing the five primary phases of 5S
Describing the benefits of 5S
Prepared by: David Cutri, University of Toledo PG 9-1
Lean Six Sigma Tools for Planning and Execution Unit 9: 5S
WHAT IS 5S?
“5S” is the name of a workplace organization methodology that uses a list of five Japanese words: seiri, seiton, seiso, seiketsu, and shitsuke. They all start with the letter "S", hence the methodology’s name. The list describes how to organize a work space for efficiency and effectiveness by identifying and storing the items used, maintaining the area and items, and sustaining the new order. This Lean Six Sigma tool can be used while performing a waste walk and in conjunction with the walk-through. The decision-making process usually comes from a dialogue about standardization, which builds a clear understanding among employees about how work should be done. It also instills ownership of the process in each employee.
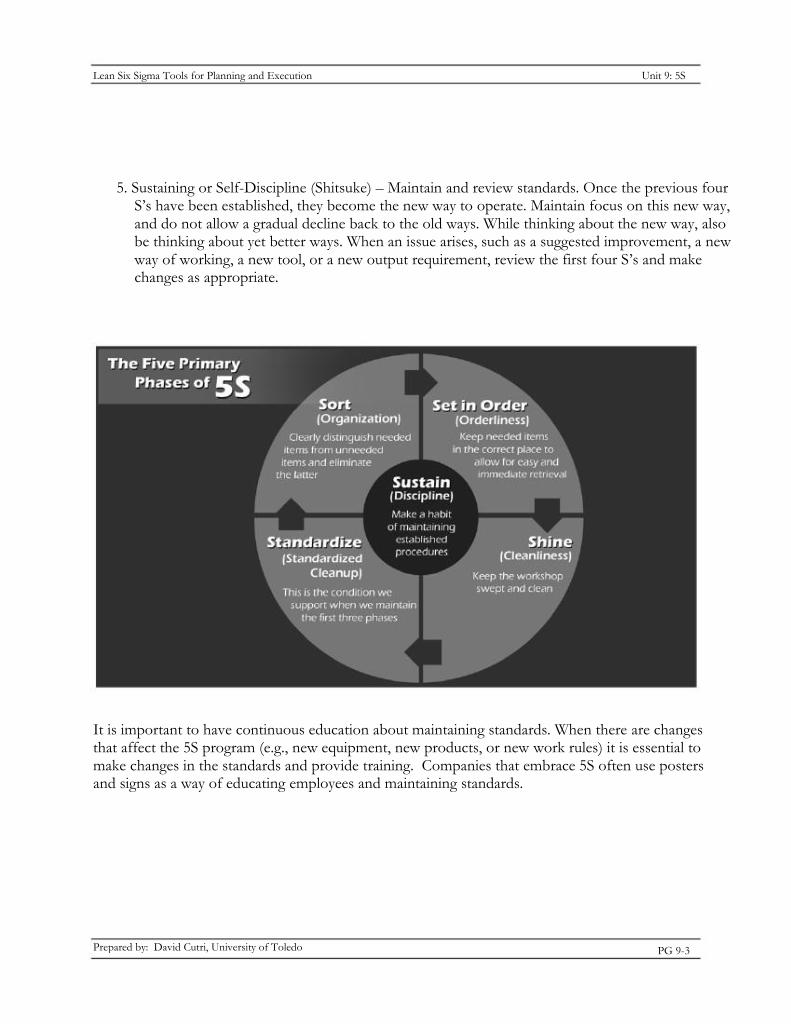
The five primary phases of 5S are:
1. Sorting (Seiri) – Eliminate all unnecessary supplies, paperwork, and instructions. Go through all documents and equipment in the work area and keep only essential items; eliminate what is not required. Prioritizing things per requirements and keeping them in easily-accessible places. Store or discard everything else.
2. Straightening or Setting in Order/Stabilize (Seiton) – There should be a place for everything, and everything should be in its place. Clearly label or demarcate the place for each item. Arrange items in a manner that promotes efficient work flow, with equipment used most often being the most easily accessible. Workers should not have to bend repetitively to access materials. Each file, document, or piece of equipment should be kept close to where it will be used (i.e., straighten the flow path).
3. Systematic Cleaning/Shine (Seiso) – Clean the work space and all equipment, and keep it clean, tidy, and organized. At the end of each work day, clean the work area and be sure everything is restored to its place. This makes it easy to know what goes where and ensures that everything is where it belongs. Messes become a visual signal for process steps that need attention. A key point is that maintaining cleanliness should be part of the daily work, not an occasional activity initiated when things get too messy.
4. Standardizing (Seiketsu) – Work practices should be consistent and standardized. All work stations for a particular job should be identical. All employees doing the same job should be able to work in any station; the same tools should be in the same location in every station. Everyone should know exactly his or her responsibilities for adhering to the first three Ss.
Prepared by: David Cutri, University of Toledo PG 9-2
Lean Six Sigma Tools for Planning and Execution Unit 9: 5S
5. Sustaining or Self-Discipline (Shitsuke) – Maintain and review standards. Once the previous four S’s have been established, they become the new way to operate. Maintain focus on this new way, and do not allow a gradual decline back to the old ways. While thinking about the new way, also be thinking about yet better ways. When an issue arises, such as a suggested improvement, a new way of working, a new tool, or a new output requirement, review the first four S’s and make changes as appropriate.
It is important to have continuous education about maintaining standards. When there are changes that affect the 5S program (e.g., new equipment, new products, or new work rules) it is essential to make changes in the standards and provide training. Companies that embrace 5S often use posters and signs as a way of educating employees and maintaining standards.
Prepared by: David Cutri, University of Toledo PG 9-3
Lean Six Sigma Tools for Planning and Execution Unit 9: 5S
Benefits There are a number of benefits from improved housekeeping. The most obvious benefit from items being organized in such a way that they are always readily available is improved productivity. Employees being diverted from their tasks to look for paperwork, supplies, etc. results in lost time. A key aspect of an organization approach is that the often-needed items are stored in the most accessible location, and correct adoption of the standardization approach means that they are returned to the correct location after use.
Improving the layout of the work area merges with the concept of visual management (i.e., giving employees great visibility to the status of work), thus removing the need for complex tracking and communication systems.
The 5S program focuses on having visual order, organization, cleanliness, and standardization. The results you can expect from a 5S program are: improved profitability, quality, efficiency, service, and employee safety.
Everyone and all types of business benefit from having a 5S program. Manufacturing and industrial plants come to mind first, as those are the businesses that can realize the greatest benefits. However, any type of business (e.g., a retail store, power plant, hospital, or television station) and all areas within a business will realize benefits from implementing a 5S program.
Costs The shipyard industry is spending nearly a million dollars to develop a 5S program the industry can use and to implement that program at two shipyards. On the other hand, you can implement a 5S program without adding an extra dollar to your budget.
Realistically, though, your organization probably will need to spend some extra money to get your 5S program going. There will be training time; work hours spent to get your facility cleaned up and organized; equipment purchases, such as buying a quality labeling system; and time spent on sustaining your 5S program once it is in place.
Your actual costs will depend on the current condition of your facility or work space. The further you are from meeting the goals of a 5S program, the more it will cost to implement one and the greater the benefits you'll see as a result of your 5S program.
Prepared by: David Cutri, University of Toledo PG 9-4
Lean Six Sigma Tools for Planning and Execution Unit 9: 5S
How could your organization/workplace benefit from 5S?
Prepared by: David Cutri, University of Toledo PG 9-5
Lean Six Sigma Tools for Planning and Execution Unit 9: 5S
IDEAS AND INSIGHTS
What new ideas or insights did you acquire?
How will you incorporate what you learned into your work?
Prepared by: David Cutri, University of Toledo PG 9-6


Control Charts

Lean Six Sigma Tools for Planning and Execution Unit 10: Control Charts
UNIT TEN: CONTROL CHARTS
UNIT OBJECTIVES
As a result of your active participation in this unit, you will be able to use a control chart to determine process capability by:
•
•
•
Explaining the purpose and importance of process capability
Identifying the variability of a process using a control chart
Assessing the capability of a process using a control chart
Prepared by: David Cutri, University of Toledo PG 10-1
Lean Six Sigma Tools for Planning and Execution Unit 10: Control Charts
CONTROL CHARTS
Process Capability
The term Six Sigma comes from a field of statistics known as “process capability studies.” Originally, it referred to the ability of manufacturing processes to produce a very high proportion of output within specification. Processes that operate with Six Sigma quality over the short term are assumed to produce long-term defect levels below 3.4 defects per million opportunities (DPMO). Six Sigma's implicit goal is to improve all processes to that level of quality or better.
All processes have inherent statistical variability, which can be evaluated by statistical methods. The process capability is a measurable property of a process to the specification. Process capability is defined as, “the capability of a process to meet its purpose.”
Control Charts
Control charts are graphs used to study how a process changes over time. A control chart helps you distinguish between normal and unusual variation in a process. A control chart always has a central line for the average, an upper line for the upper control limit, and a lower line for the lower control limit. These lines are determined from historical data. By comparing current data to these lines, you can draw conclusions about whether the process variation is consistent (in control) or is unpredictable (out of control). This Lean Six Sigma tool can be used on performance/operational process assurance engagements.
Benefits of Control Charts
Control charts have numerous benefits; they: • Focus attention on directing and monitoring process variation over time. • Distinguish special from common causes of variation, as a guide to local or management action. • Serve as a tool for ongoing control of a process. • Help improve a process to perform consistently and predictably for higher quality, lower cost, and
higher effective capacity. • Provide a common language for discussing process performance.
Prepared by: David Cutri, University of Toledo PG 10-2
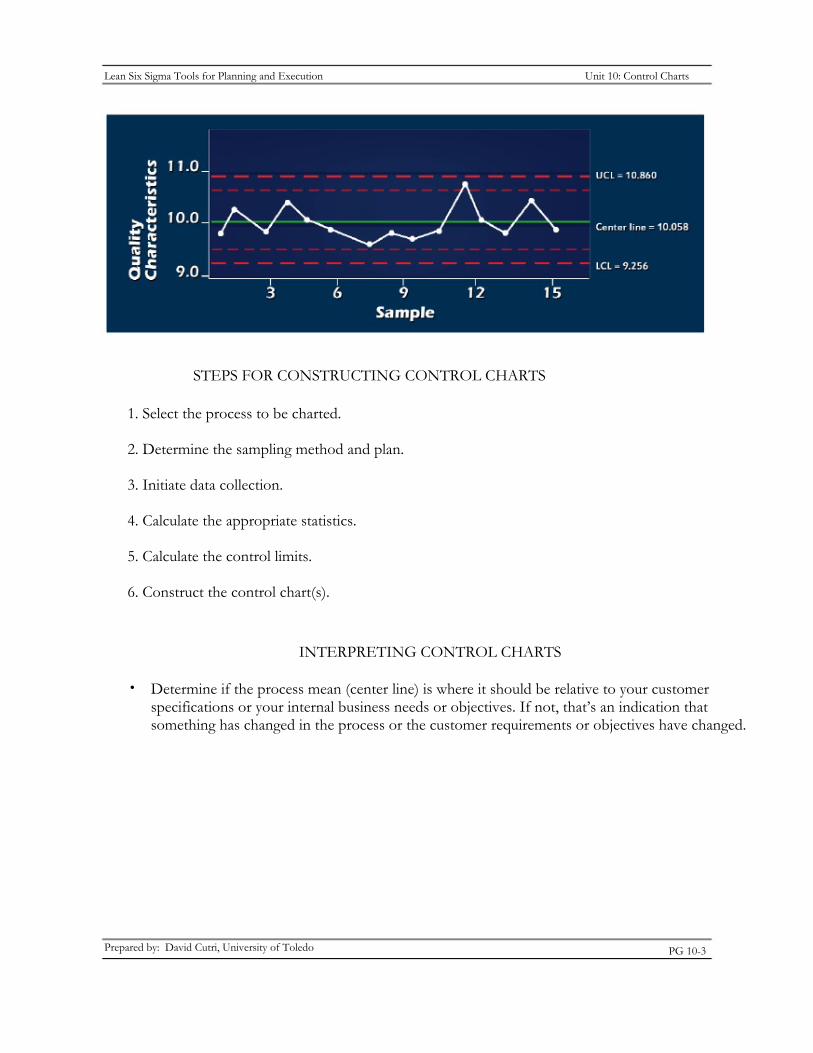
Lean Six Sigma Tools for Planning and Execution Unit 10: Control Charts
STEPS FOR CONSTRUCTING CONTROL CHARTS
1. Select the process to be charted.
2. Determine the sampling method and plan.
3. Initiate data collection.
4. Calculate the appropriate statistics.
5. Calculate the control limits.
6. Construct the control chart(s).
INTERPRETING CONTROL CHARTS
• Determine if the process mean (center line) is where it should be relative to your customer specifications or your internal business needs or objectives. If not, that’s an indication that something has changed in the process or the customer requirements or objectives have changed.
PG 10-3Prepared by: David Cutri, University of Toledo
Lean Six Sigma Tools for Planning and Execution Unit 10: Control Charts
Analyze the data relative to the control limits, distinguishing between common causes and special causes. The fluctuations of the points within the limits results from variation inherent in the process. This variation is due to common causes within the system (e.g., design, choice of machine, or preventive maintenance) and can be affected only by changing that system. However, points outside of the limits, or patterns within the limits, come from special causes (e.g., human errors, unplanned events, or freak occurrences) that are not part of the way the process normally operates or are present because of an unlikely combination of process steps. Special causes must be eliminated before the control chart can be used as a monitoring tool. Once this is done, the process will be “in control,” and samples can be taken at regular intervals to make sure that the process doesn’t fundamentally change.
• The process is in “statistical control” if the process is not being affected by special causes, the influence of an individual or machine. All of the points must fall within the control limits, and they must be dispersed randomly along the average line for an in-control system.
“Control” doesn’t necessarily mean that the process or service will meet your needs. It only means that the process is consistent. Don’t confuse control limits with specification limits. Specification limits are related to customer requirements, not process variation.
A process is said to be “out of control” if one or more points fall outside of the control limits. Once the points outside of the control limits are identified with a cause (or causes); they should be removed and the calculations and charts redone. Points within the control limits that show indications of trends, shifts, or instability are also special causes.
When a control chart has been initiated and all special causes removed, you may continue to plot new data on a new chart, but DO NOT recalculate the control limits. As long as the process does not change, the limits should not be changed. Control limits should be recalculated only when a permanent, desired change has occurred in the process and only by using data from after the change has occurred.
•
•
•
What processes in your organization do you think would benefit from a control chart analysis?
Prepared by: David Cutri, University of Toledo PG 10-4
•
Lean Six Sigma Tools for Planning and Execution Unit 10: Control Charts
COMMON QUESTIONS FOR INVESTIGATING AN OUT-OF-CONTROL PROCESS
Yes No Are there differences in the measurement accuracy of instruments/methods used?
Are there differences in the methods used by different personnel?
Is the process affected by the environment (e.g., temperature, humidity)?
Has there been a significant change in the environment?
Is the process affected by predictable conditions (e.g., tool wear)?
Were any untrained personnel involved in the process at the time?
Has there been a change in the source for input to the process (e.g., raw materials, information)?
Is the process affected by employee fatigue?
Yes No
Yes No
Yes No
Yes No
Yes No
Yes No
Yes No
Yes No Has there been a change in policies or procedures (e.g., maintenance procedures)?
Is the process adjusted frequently? Yes No
Yes No Did the samples come from different parts of the process, different shifts, or different individuals?
Are employees afraid to report “bad news”? Yes No
Teams should address each “Yes” answer as a potential source of a special cause.
Prepared by: David Cutri, University of Toledo PG 10-5
Lean Six Sigma Tools for Planning and Execution Unit 10: Control Charts
IDEAS AND INSIGHTS
What new ideas or insights did you acquire?
How will you incorporate what you learned into your work?
Prepared by: David Cutri, University of Toledo PG 10-6


Theory of Constraints

Lean Six Sigma Tools for Planning and Execution Unit 11: Theory of Constraints
UNIT ELEVEN: THEORY OF CONSTRAINTS
UNIT OBJECTIVES
As a result of your active participation in this unit, you will be able to apply Eliyahu Moshe Goldratt’s Theory of Constraints to identify and resolve process bottlenecks by:
•
•
•
•
•
Explaining the purpose and importance of the Theory of Constraints
Describing the five focusing steps related to the Theory of Constraints
Explaining the significance of constraints in the Theory of Constraints
Explaining the use of buffers in the Theory of Constraints
Describing the “Five Thinking Process” an organization uses to support the Theory of Constraints.
Prepared by: David Cutri, University of Toledo PG 11-1
Lean Six Sigma Tools for Planning and Execution Unit 11: Theory of Constraints
THEORY OF CONSTRAINTS
The Theory of Constraints (TOC) adopts the common idiom "A chain is no stronger than its weakest link" as a new management paradigm. This means that processes, organizations, etc., are vulnerable because the weakest person or part can always damage or break them — or at least adversely affect the outcome.
The analytic approach to the TOC comes from the contention that any manageable system is limited in achieving more of its goals by a very small number of constraints, and there is always at least one constraint. Hence, the TOC process seeks to identify the constraint and restructure the rest of the organization around it through the use of five focusing steps (explained below).
The underlying premise of the TOC is that organizations can be measured and controlled by variations on three measures: • Throughput – the rate at which the system generates money through sales. • Inventory – all the money that the system has invested in purchasing things that it intends to sell. • Operational expense – all the money the system spends in order to turn inventory into throughput. The organization’s goal is to make money. All other benefits are derived, in one way or another, from that single, primary goal.
One of the key focuses of the TOC is to identify bottlenecks in a process, which can be very useful on performance/operational and process assurance engagements.
Five Focusing Steps The TOC is based on the premise that the rate of goal achievement is limited by at least one constraining process. Only by increasing flow through the constraint can overall throughput be increased.
Assuming the goal of the organization has been articulated, the steps are:
1. Identify the constraint – Identify the resource or policy that prevents the organization from obtaining more of the goal.
2. Decide how to exploit the constraint – Get the most capacity out of the constrained process.
3. Subordinate all other processes to the above decision – Align the whole system or organization to support the above decision.
Prepared by: David Cutri, University of Toledo PG 11-2
Lean Six Sigma Tools for Planning and Execution Unit 11: Theory of Constraints
4. Elevate the constraint – Make other major changes needed to break the constraint.
5. If, as a result of these steps, the constraint has moved, return to Step 1. Don't let inertia become the constraint.
The five focusing steps aim to ensure ongoing improvement efforts are centered on the organization's constraints. In the TOC literature, this is referred to as “the process of ongoing improvement (POOGI).”
What processes in your organization are most susceptible to bottlenecks?
Constraints A constraint is anything that prevents the system from achieving more of its goal. There are many ways that constraints can appear, but a core principle within the TOC is that there are not tens or hundreds of constraints. There is at least one — and, at most, a few — in any given system. Constraints can be internal or external to the system. An internal constraint is in evidence when the market demands more from the system than it can deliver. If this is the case, then the focus of the organization should be on discovering that constraint and following the five focusing steps to open it up and potentially remove it. An external constraint exists when the system can produce more than the market will bear. If this is the case, then the organization should focus on mechanisms to create more demand for its products or services.
Buffers Buffers are used throughout the TOC. They often result as part of the exploit and subordinate steps of the five focusing steps. Buffers can be placed before the governing constraint, thus ensuring that the constraint is never starved. Buffers also can be placed behind the constraint to prevent downstream failure to block the constraint's output.
Prepared by: David Cutri, University of Toledo PG 11-3
Lean Six Sigma Tools for Planning and Execution Unit 11: Theory of Constraints
Used in this way, buffers protect the constraint from variations in the rest of the system and should allow for normal variation of processing time and the occasional upset (Murphy’s Law, i.e., whatever can go wrong, will go wrong) before and behind the constraint.
Buffers can be a bank of physical objects before a work center that is waiting to be processed by that work center. Buffers ultimately buy you time (i.e., the time before work reaches the constraint) and therefore are often called “time buffers.” There should always be enough (but not excessive) work in the time queue before the constraint and adequate offloading space behind the constraint.
Buffer management represents a crucial attribute of the TOC. There are many ways to do it, but the most often used is a visual system of designating the buffer in three colors: green (okay), yellow (caution), and red (action required). Creating this kind of visibility enables the system as a whole to align and thus subordinate to the need of the constraint in a holistic manner. This also can be done daily in a central operations room that is accessible to everybody.
Thinking Processes The thinking processes are a set of tools to help managers walk through the steps of initiating and implementing a project. When used in a logical flow, the thinking processes help walk through a buy-in process. The thinking processes steps are:
1. 2. 3. 4. 5.
Gain agreement on the problem. Gain agreement on the direction for a solution. Gain agreement that the solution solves the problem. Agree to overcome any potential negative ramifications. Agree to overcome any obstacles to implementation.
TOC practitioners sometimes refer to these in the negative, as working through layers of resistance to a change.
Prepared by: David Cutri, University of Toledo PG 11-4
Lean Six Sigma Tools for Planning and Execution Unit 11: Theory of Constraints
IDEAS AND INSIGHTS
What new ideas or insights did you acquire?
How will you incorporate what you learned into your work?
Prepared by: David Cutri, University of Toledo PG 11-5

Cause-and-effect
(Fishbone) Diagrams

Lean Six Sigma Tools for Planning and Execution Unit 12: Cause & Effect (Fishbone) Diagrams
UNIT TWELVE: CAUSE & EFFECT (FISHBONE) DIAGRAMS
UNIT OBJECTIVES
As a result of your active participation in this unit, you will be able to employ a cause-and-effect (Fishbone) diagram to determine the root cause(s) of process breakdowns by:
•
•
•
•
Explaining the purpose and importance of root cause analysis
Explaining the purpose and importance of cause-and-effect (Fishbone) diagrams
Describing the six categories of cause-and-effect (Fishbone) diagrams
Constructing a cause-and-effect (Fishbone) diagram for determining the root cause of an issue or problem
Prepared by: David Cutri, University of Toledo PG 12-1
Lean Six Sigma Tools for Planning and Execution Unit 12: Cause & Effect (Fishbone) Diagrams
ROOT CAUSE ANALYSIS
General Root cause analysis (RCA) is any structured approach to identifying the factors that caused the nature, magnitude, location, and timing of the harmful outcomes (consequences) of one or more past events in order to identify what behaviors, actions, inactions, or conditions need to be changed to prevent recurrence of similar harmful outcomes and to identify lessons to be learned to promote the achievement of better consequences. It encompasses a class of problem-solving methods aimed at identifying the root causes of problems or events.
The practice of RCA is predicated on the belief that problems are best solved by attempting to address, correct, or eliminate root causes, as opposed to addressing the immediately obvious symptoms. By directing corrective measures at root causes, it is more probable that problem recurrence will be prevented.
Root Cause Analysis Tools Two key Lean Six Sigma tools that can be used for effective root cause analysis in the fieldwork phase of a process improvement project are:
• •
Cause-and-effect (fishbone) diagrams. Pareto charts.
In this unit, we will cover the first of these two tools.
Prepared by: David Cutri, University of Toledo PG 12-2
Lean Six Sigma Tools for Planning and Execution Unit 12: Cause & Effect (Fishbone) Diagrams
CAUSE-AND-EFFECT (FISHBONE) DIAGRAMS
Cause-and-effect diagrams, also called Ishikawa diagrams, are causal diagrams that visually display the many potential causes for a problem or an effect. They can reveal key relationships among variables, and the possible causes provide additional insight into process behavior. Cause-and-effect diagrams are also known as fishbone diagrams because their shape is similar to the side view of a fish skeleton. It is a tool that uses a graphical description of the process elements to analyze potential sources of process variation.
When utilizing a team approach to problem-solving, there are often many opinions as to the problem’s root cause. The fishbone diagram facilitates capturing these different ideas and stimulating the team’s brainstorming on root causes. It can be used to structure the brainstorming session because it not only identifies the many possible causes for an effect or problem, but it sorts these ideas into useful categories. The typical six categories are:
•
•
•
•
•
•
Man (People) – Anyone involved with the process
Machine (Equipment/Technology) – Any equipment, software, hardware, tools, supplies, etc., required to accomplish the job
Measurements (Management) – Data generated from the process and metrics that are used to evaluate the process’s quality, efficiency, and/or effectiveness
Method (Process) – How the process is performed and the specific requirements for doing it, such as policies, procedures, and rules
Materials (Inputs) – Raw materials, parts, documents, data, etc., used to produce the final product /output of the process
Milieu (Environment) – The conditions, such as location, time, temperature, laws, regulations, and culture under which the process operates
Causes identified during brainstorming are grouped into the above categories and then traced back to the root causes, utilizing the “Five Whys” technique. Because people often like to skip right to determining what to do about a problem, this approach can help bring out a more thorough exploration of the issues behind the problem, which will lead to a more robust solution. The fishbone diagram is particularly useful in a group setting and for situations in which little quantitative data is available for analysis.
Prepared by: David Cutri, University of Toledo PG 12-3
Lean Six Sigma Tools for Planning and Execution Unit 12: Cause & Effect (Fishbone) Diagrams
The root cause of issues noted during the engagement must be determined and tied to the recommended management plan for action to resolve them. Cause-and-effect (Fishbone) diagrams provide an excellent tool and structured approach for these key tasks.
What method does your department presently use to determine the root cause of issues noted?
Steps to Constructing a Fishbone Diagram
Materials needed: flipchart or whiteboard, markers/pens.
1. Start with stating the problem in the form of a question, such as: “Why is the help desk’s abandon rate so high?” Framing it as a “why” question will help in brainstorming, as each root-cause idea should answer the question. The team should agree on the wording of the problem (or effect) and then place this question in a box at the “head” of the fishbone. Draw the box at the center right of the flipchart or whiteboard and draw a horizontal arrow running toward it. See the graphic below for an example.
2. Brainstorm the major categories of causes of the problem. If this is difficult, you may use the generic headings discussed above (man, machine, measurements, method, materials, and milieu). Modify the categories as necessary for your project and subject matter.
3. Draw the categories of causes as “branches” from the main arrow.
4. Once you have labeled the branches, begin brainstorming possible causes and attach them to the appropriate branches. For each cause identified, continue to ask, “Why does that happen?” and attach that information as another “bone” of the category branch. This will help identify the true drivers of a problem.
Prepared by: David Cutri, University of Toledo PG 12-4
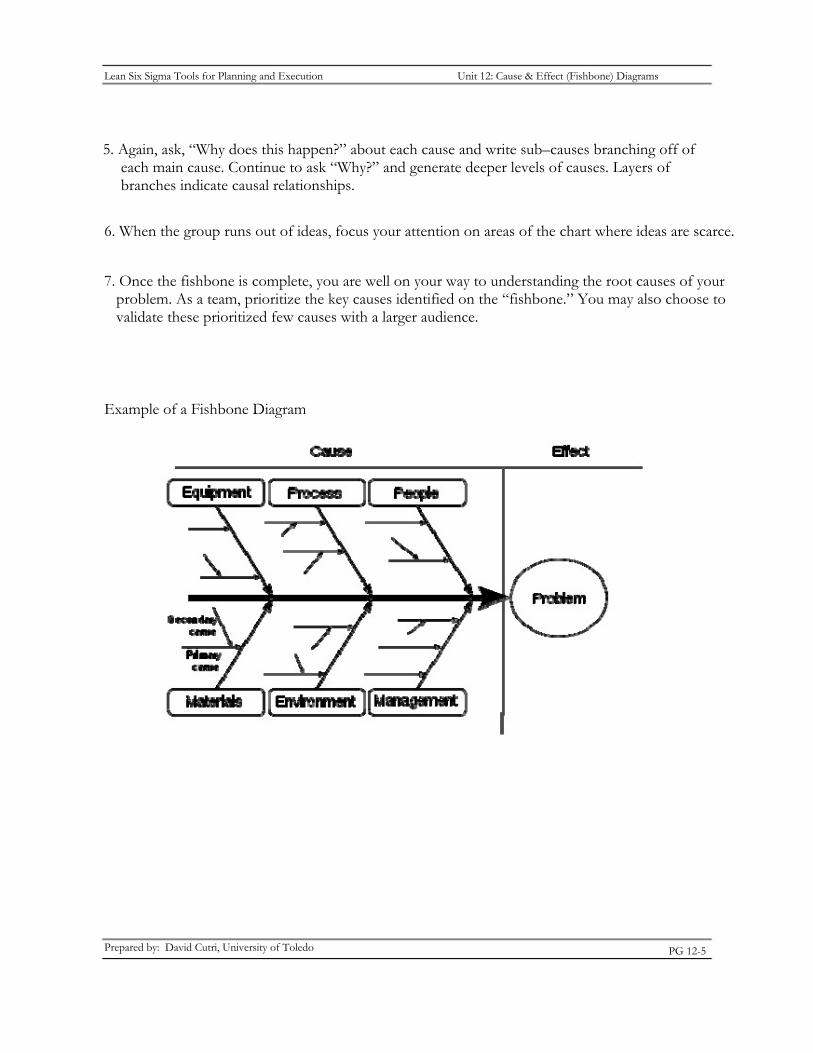
Lean Six Sigma Tools for Planning and Execution Unit 12: Cause & Effect (Fishbone) Diagrams
5. Again, ask, “Why does this happen?” about each cause and write sub–causes branching off of each main cause. Continue to ask “Why?” and generate deeper levels of causes. Layers of branches indicate causal relationships.
6. When the group runs out of ideas, focus your attention on areas of the chart where ideas are scarce.
7. Once the fishbone is complete, you are well on your way to understanding the root causes of your problem. As a team, prioritize the key causes identified on the “fishbone.” You may also choose to validate these prioritized few causes with a larger audience.
Example of a Fishbone Diagram
Prepared by: David Cutri, University of Toledo PG 12-5
Lean Six Sigma Tools for Planning and Execution Unit 12: Cause-and-effect (Fishbone) Diagrams
IDEAS AND INSIGHTS
What new ideas or insights did you acquire?
How will you incorporate what you learned into your work?
Prepared by: David Cutri, University of Toledo PG 12-6

The “Five Whys”
Technique

Lean Six Sigma Tools for Planning and Execution Unit 13: The “Five Whys” Technique
UNIT THIRTEEN: THE “FIVE WHYS” TECHNIQUE
UNIT OBJECTIVES
As a result of your active participation in this unit, you will be able to practice the “Five Whys” technique for drilling down to the ultimate root cause of issues by:
•
•
Employing the questions-asking method for determining the root cause of an issue or problem
Describing the two techniques for using the “Five Whys” method
Prepared by: David Cutri, University of Toledo PG 13-1
Lean Six Sigma Tools for Planning and Execution Unit 13: The “Five Whys” Technique
FIVE WHYS
The “Five Whys” technique is a questions-asking method used to explore the cause/effect relationships underlying a particular problem, with the goal of determining a root cause of a defect or problem. By asking “Why?” five times, the nature of the problem, as well as its solution, usually becomes clear.
This Lean Six Sigma technique can be used in conjunction with the cause-and-effect (Fishbone) diagram discussed in the previous unit to determine the root cause of issues noted and tie it to the management plan of action to address the issue.
Questions-asking Method
The following example demonstrates the basic process:
The vehicle will not start (the problem). 1. Why? The battery is dead (first why). 2. Why? The alternator is not functioning (second why). 3. Why? The alternator belt has broken (third why). 4. Why? The alternator belt was well beyond its useful service life and not replaced (fourth why). 5. Why? The vehicle was not maintained according to the recommended service schedule (fifth why, a
root cause).
While questioning could be taken further to a sixth, seventh, or higher level, five iterations of asking “Why?” generally is sufficient to get to a root cause. The key is to encourage the trouble-shooter to avoid assumptions and logic traps and instead trace the chain of causality in direct increments from the effect through any layers of abstraction to a root cause that still has some connection to the original problem.
It is interesting to note that the last answer points to a process. This is one of the most important aspects in the “Five Why” approach — the real root cause should point toward a process that is not working well or does not exist. Employees sometimes settle for causes that seem to point toward classic answers such as: “not enough time,” “not enough investments,” or “not enough manpower.” These answers sometimes are true, but in most cases they lead to conditions that are out of our control. Therefore, instead of asking the question “Why?” consider asking, “Why did the process fail?”
Prepared by: David Cutri, University of Toledo PG 13-2
Lean Six Sigma Tools for Planning and Execution Unit 13: The “Five Whys” Technique
A key phrase to keep in mind in any “Five Why” exercise is: People do not fail, processes do.
What do you think would happen if a team failed to get down to the true root cause of an issue?
Techniques
There are two primary techniques used to perform “Five Whys”: the Fishbone diagram, discussed in the last unit, and a hierarchical tabular format, which involves creating a spreadsheet using Excel. During this process, the “why” questions are added into separate columns; aptly named why 1, why 2, why 3, why 4, and why 5. The next column is reserved for the main root cause, which is used to create the end solution. A “recurrence prevention” column is designed to house the end solution, which can be referenced if the problem occurs again in the future.
Both of these tools allow for analysis to be branched in order to provide multiple root causes.
Prepared by: David Cutri, University of Toledo PG 13-3
Lean Six Sigma Tools for Planning and Execution Unit 13: The “Five Whys” Technique
IDEAS AND INSIGHTS
What new ideas or insights did you acquire?
How will you incorporate what you learned into your work?
Prepared by: David Cutri, University of Toledo PG 13-4


Pareto Charts

Lean Six Sigma Tools for Planning and Execution Unit 14: Pareto Charts
UNIT FOURTEEN: PARETO CHARTS
UNIT OBJECTIVES
As a result of your active participation in this unit, you will be able to build a Pareto chart to assist with highlighting the “vital few” most common causes of defects in a given process from among the various other causes by:
•
•
•
•
•
Explaining the purpose and importance of a Pareto chart
Demonstrating root cause analysis using a Pareto chart
Determining the scope of the process for which a Pareto analysis will be employed
Describing risk analysis using a Pareto chart
Constructing a Pareto chart to prioritize process failure issues
Prepared by: David Cutri, University of Toledo PG 14-1
Lean Six Sigma Tools for Planning and Execution Unit 14: Pareto Charts
PARETO CHART
The Pareto chart exemplifies the concept of identifying the “vital few” items or activities that most contribute to a problem or opportunity, showing the importance of the vital few. The Pareto chart illustrates the Pareto principle, frequently referred to as “The 80/20 Rule,” which offers that 20 percent of the population accounts for 80 percent of the phenomenon. For example, 20 percent of your customers account for 80 percent of your sales.
The Pareto chart enables a coordinated approach to identifying, ranking, and working to eliminate defects permanently. It focuses on important error sources. 80 percent of the problems are due to 20 percent of the causes.
Teams can use this Lean Six Sigma tool to sharpen their focus on the key reasons for the issue(s) noted.
Have you seen examples in your organization when only 80 percent of the problem was caused by only 20 percent of the items?
Pareto charts display the count frequency of categorical data in descending order by frequency and category and are useful because they focus attention on those categories that have the highest observational frequencies (counts). See the example, below. This is very useful in communicating project status as well as explaining why the team has focused the project in one direction rather than another.
Prepared by: David Cutri, University of Toledo PG 14-2

Lean Six Sigma Tools for Planning and Execution Unit 14: Pareto Charts
Root Cause Analysis Pareto charts often allow the team to drive to the root cause of the problem, or at least focus their attention in the direction of the major root causes. For example, raw-material inventory has a higher frequency (highest count) than either work-in-process (WIP) or finished-goods inventory. If we want to reduce the number of inventory items, as opposed to the most expensive items, raw-material inventory might be the initial focus of our project. Pareto charts also are analytical tools that can be used throughout the project. In the control phrase of the project, the team should be able to use Pareto charts and other analytical tools to show the process owner and local work team a reduction in defect occurrence.
Scoping Although the Pareto chart is an extremely effective tool to focus the team’s attention on the categories that have the largest occurrence frequency, many teams do not utilize this important tool fully. As a general rule, if the team has not scoped the project down to at least a third-level Pareto chart, then they are probably still too high in their project’s problem statement to focus its objective and conduct an effective root cause analysis of the problem.
The Pareto chart (first level) can be used to identify the process step that has the highest incidence rate. The team would then work to eliminate one or more defect types associated with that process step. Alternatively, the team could create a Pareto chart of all the defects in the order entry portion of the process and eliminate one or more defects for each of the process steps. Finally, the team could automate the process to remove all manual operations and associated defects. This would improve the quality level of the process permanently.
Prepared by: David Cutri, University of Toledo PG 14-3
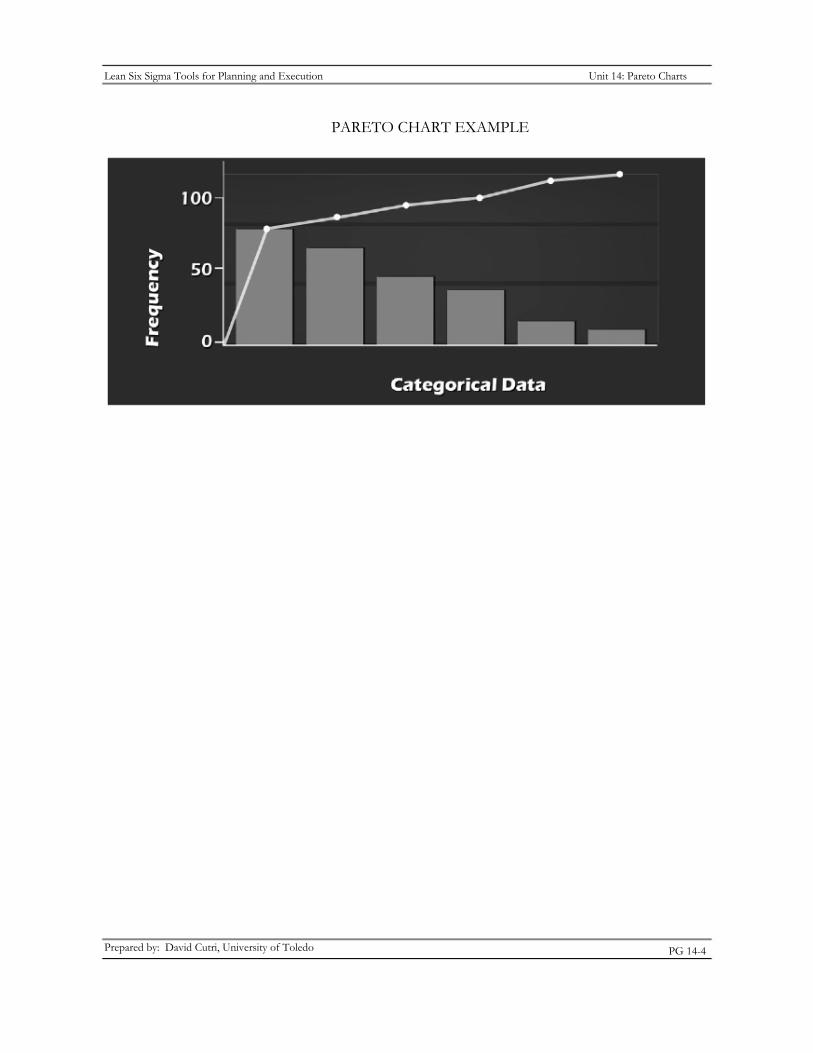
Lean Six Sigma Tools for Planning and Execution Unit 14: Pareto Charts
PARETO CHART EXAMPLE
Prepared by: David Cutri, University of Toledo PG 14-4
Lean Six Sigma Tools for Planning and Execution Unit 14: Pareto Charts
CREATING AND INTERPRETING A PARETO CHART
Here are the steps to follow to create and interpret a Pareto chart.
1. Decide which problem you want to know more about, and choose the problem or cause that will be monitored, compared, and rank-ordered by brainstorming with existing data.
2. Choose the most meaningful unit of measure (e.g., frequency or cost).
3. Choose the time period for the study.
4. Gather the necessary data on each problem category, either by using real-time observations or historical data.
5. Compare the relative cost or frequency of each problem category.
6. Use a line graph to show the cumulative total, listing the problem categories on the horizontal line and the frequencies on the vertical line.
7. Display the data in descending order on a bar chart.
8. Interpret the results, observing the strength or weakness of the Pareto principle.
If the principle applies, there will be a steep decline in the bars and a corresponding steep rise in the line graph. In such situations, the Pareto chart will allow you to identify the vital few.
Prepared by: David Cutri, University of Toledo PG 14-5

Lean Six Sigma Tools for Planning and Execution Unit 14: Pareto Charts
IDEAS AND INSIGHTS
What new ideas or insights did you acquire?
How will you incorporate what you learned into your work?
Prepared by: David Cutri, University of Toledo PG 14-6

Poka-yokes

Lean Six Sigma Tools for Planning and Execution Unit 15: Poka-yokes
UNIT FIFTEEN: POKA-YOKES
UNIT OBJECTIVES
As a result of your active participation in this unit, you will be able to use Poka-yokes to build controls into a process rather than onto a process by:
•
•
•
•
Explaining the use of Poka-yokes in mistake-proofing business processes
Describing the types of business process errors that Poka-yokes are designed to address.
Characterizing effective mistake-proofing techniques
Developing Poka-yokes to mistake-proof a business process
Prepared by: David Cutri, University of Toledo PG 15-1
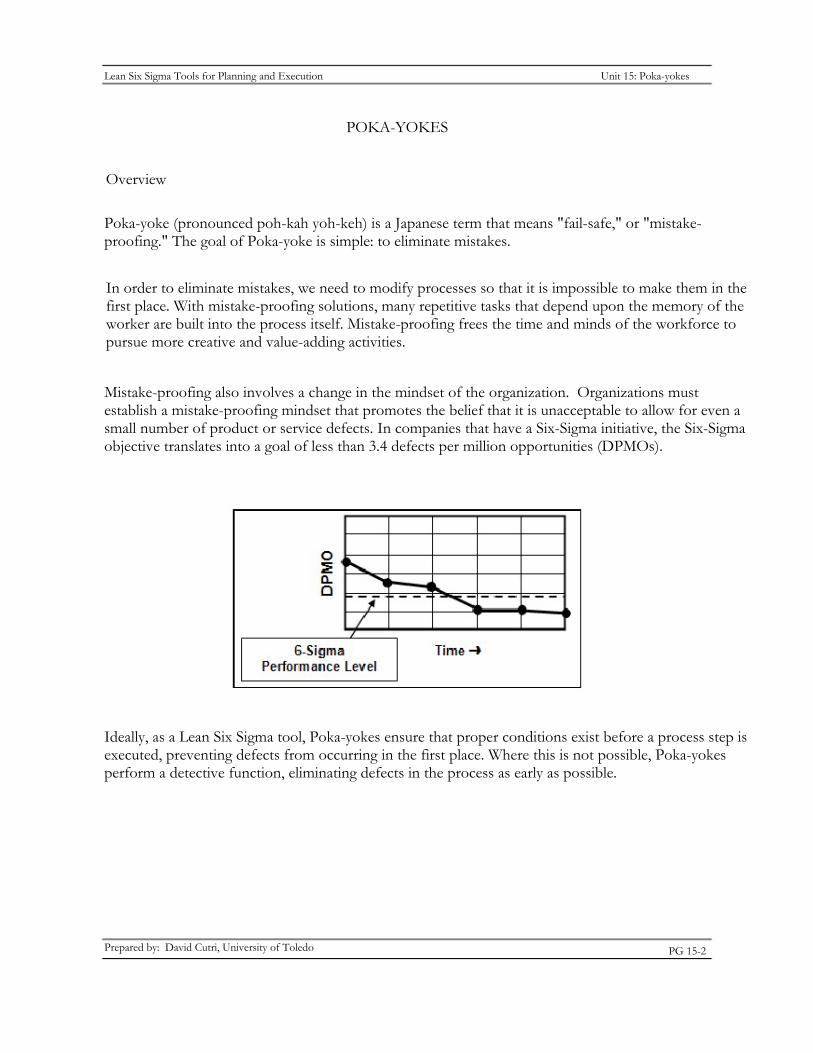
Lean Six Sigma Tools for Planning and Execution Unit 15: Poka-yokes
POKA-YOKES
Overview
Poka-yoke (pronounced poh-kah yoh-keh) is a Japanese term that means "fail-safe," or "mistake-proofing." The goal of Poka-yoke is simple: to eliminate mistakes.
In order to eliminate mistakes, we need to modify processes so that it is impossible to make them in the first place. With mistake-proofing solutions, many repetitive tasks that depend upon the memory of the worker are built into the process itself. Mistake-proofing frees the time and minds of the workforce to pursue more creative and value-adding activities.
Mistake-proofing also involves a change in the mindset of the organization. Organizations must establish a mistake-proofing mindset that promotes the belief that it is unacceptable to allow for even a small number of product or service defects. In companies that have a Six-Sigma initiative, the Six-Sigma objective translates into a goal of less than 3.4 defects per million opportunities (DPMOs).
Ideally, as a Lean Six Sigma tool, Poka-yokes ensure that proper conditions exist before a process step is executed, preventing defects from occurring in the first place. Where this is not possible, Poka-yokes perform a detective function, eliminating defects in the process as early as possible.
Prepared by: David Cutri, University of Toledo PG 15-2
Lean Six Sigma Tools for Planning and Execution Unit 15: Poka-yokes
Poka-yokes help people process work right the first time, attempting to make it impossible to make mistakes. These techniques can drive defects out of products and processes and substantially improve quality and reliability. They also can be used to fine-tune improvements and process designs from Six Sigma projects. The use of simple Poka-yoke ideas and methods in product and process design can eliminate both human and mechanical errors. Although flowcharts serve to describe the features of a process design, they do not provide any direct guidance for how to make the process conform to that design. Poka-yokes have the ability to block the inevitable mistake from becoming a process defect.
Manufacturing and Service Industry Applications
Poka-yokes can be applied to any type of process, whether in manufacturing or the service industry, to avoid the following types of errors:
•
•
•
•
•
•
Processing Error – Process operation missed or not performed per the standard operating procedure
Setup Error – Wrong software used or machine adjustments set incorrectly
Missing Part/Item – Parts/items missing from the assembly, collation, or other processes
Improper Part/Item – Wrong part/item used in the process
Operations Error – Task or operation carried out incorrectly; incorrect version or specification
Measurement Error – Errors in machine adjustment, test measurement, or dimensions of a part/item coming in from a supplier
In manufacturing, Poka-yoke examples include fixtures to ensure that parts can be attached only in the right way, electronic switches that automatically shut off equipment if a mistake is made, and kitting of parts prior to assembly to make sure the right quantities are used. The Toyota plant in Japan, for example, has an average of 12 Poka-yoke devices per machine.
There are many applications of Poka-yokes in the service industry as well. These can be classified into forced control, physical or visual contact (sensory alert), and warning methods by what are called the Three T’s:
•
•
•
Task – to be done (e.g., was the car fixed right?).
Treatment – accorded the customer (e.g., was the service manager courteous?).
Tangible – or environmental features of the service facility (e.g., was the waiting area clean and comfortable?).
Prepared by: David Cutri, University of Toledo PG 15-3
Lean Six Sigma Tools for Planning and Execution Unit 15: Poka-yokes
Unlike manufacturing, service Poka-yokes often must be applied to fail-safe the actions of the customer as well as the service employee.
Defects and Errors
Statistical quality control methods such as control charts do not prevent defects. Although they provide information to tell us probabilistically when a defect will occur, they are after-the-fact. The way to prevent defects from coming out at the end of a process is to introduce controls within the process.
It should be noted that there is a difference between errors and defects. Defects arise because people make errors. Even though errors are inevitable, defects can be prevented if feedback leading to corrective action takes place immediately after the errors are made. Such feedback and action require inspection, which should be done on 100 percent of the items produced. This inspection can be one of three types:
• Successive check – Inspection is performed by the next person in the process or by an objective evaluator such as a group leader. Information on defects is immediate feedback for the worker who produced the product, who then makes the repair.
Self-check – Inspection is done by the individual worker and is appropriate by itself on all but items that require sensory judgment (e.g., existence or severity of scratches, or correct matching of shades of paint). These require successive checks.
Source inspection – Inspection is also performed by the individual worker, except instead of checking for defects, the worker checks for the errors that will cause defects. The use of source inspection and the Poka-yoke system is to achieve zero defects by preventing the defects from ever occurring and hence requiring rework.
•
•
All three types of inspection rely on controls consisting of Poka-yoke fail-safe procedures or devices that: (1) prevent the employee from making an error that leads to a defect before starting a process; or (2) provide rapid feedback of abnormalities in the process to the employee in time to correct it.
Prepared by: David Cutri, University of Toledo PG 15-4
Lean Six Sigma Tools for Planning and Execution Unit 15: Poka-yokes
Detection and Correction
Corrective controls take over when improper outcomes occur and are detected. All the detective controls in the world are valueless if the identified deficiency remains uncorrected or can be permitted to recur. So, management must develop systems that keep the spotlight on an undesirable condition until it is corrected. Also, where appropriate, management must set up procedures to prevent recurrence. Documentation and reporting systems keep problems under management surveillance until they have been resolved or the defect has been corrected. Thus, corrective controls close the loop that starts with prevention and passes through detection to correction.
Poka-yoke Examples
Although we often take it for granted, mistake-proofing is all around us. Things we use every day have been mistake-proofed. While many products or processes are mistake-proofed for safety reasons, safety is not always the reason to mistake-proof. Some things are mistake-proofed to make the product work properly or to make it easier to use or assemble.
Sometimes, mistake-proofing means action will be initiated automatically as part of the process itself; sometimes we will get a signal alerting us to take action. Every day Poka-yoke examples include:
• Locks on airline lavatory doors that activate lights inside.
• Beepers on ATMs to warn people to take their card out of the machine.
• Indented trays used by surgeons to ensure that no instruments are left in the patient.
• Mirrors on phones to ensure a “smiling” voice.
• An alternate color of facial tissues toward the bottom of the box to indicate it’s almost empty.
• Three mistake-proofing devices for fueling vehicles:
o The filling pipe insert keeps larger, leaded-fuel nozzles from being inserted.
o The gas cap tether does not allow the motorist to drive off without the cap.
o The gas cap is fitted with ratchet to signal proper tightness and prevent over-tightening.
Prepared by: David Cutri, University of Toledo PG 15-5
Lean Six Sigma Tools for Planning and Execution Unit 15: Poka-yokes
• Hotel rooms in China, where electric power has been scarce, equipped with a room key holder that turns off the power when the key is removed. This ensures no electricity flows to the room while it is vacant.
• A number of areas at McDonald’s restaurants:
o The McDonald’s fry cooker only allows cooking of the optimum number of French fries at one time.
o A wide-mouthed scoop is used to pick up the precise amount of French fries for each order size (the employee never touches the product).
o Storage space is expressly designed for a predetermined mix of prepackaged and premeasured products.
Hamburgers and other types of sandwiches are wrapped in color-coded paper.
• Handheld buzzers at restaurants to make sure customers do not miss their table call.
What other Poka-yoke examples can you think of?
An example of a simple Poka-yoke that serves as a built-in control is the age-old way to divide a piece of cake between two children: one cuts and the other chooses. Neither can complain about the unfair division.
Prepared by: David Cutri, University of Toledo PG 15-6
Lean Six Sigma Tools for Planning and Execution Unit 15: Poka-yokes
MISTAKE-PROOFING TECHNIQUES
Forced Control Mistake-proofing
Forced control effects are preferred over other forms of mistake-proofing effects. Wherever possible, use mistake-proofing techniques that lead to a forced control effect. With forced control, the action or trigger that leads to the effect is both automatically triggered and compulsory. There are two families of devices or methods used to achieve a forced control effect: elimination and combination.
These devices do not have to be “high-tech” to work. In fact, many “low-tech” solutions are more elegant and robust than their “high-tech” counterparts.
Elimination techniques include: • Eliminating decisions. • Eliminating steps.
Combination techniques include: • Combining components. • Combining steps.
Sensory-alert Mistake-proofing
Sensory-alert solutions can make it easier to know when to take action to prevent an error or when to act on a defect. These solutions require the operator to see the alert and then react to it. Sensory-alert effects can be achieved from techniques such as color-coding, MIA (missing-in-action), and sensory-alert aids.
• Color-coding – When using color-coding, the presence or absence of a color or conflicts in color can help prevent errors or make it easy to pick out an error should one occur.
MIA (missing-in-action) – MIA techniques are intended to draw a person’s eye to where something belongs or where something is missing.
Sensory-alert Aids – These are simple sensory-alert techniques that help a person do the job right. Aids include diagrams, pictures, checklists, and 5S techniques.
•
•
Prepared by: David Cutri, University of Toledo PG 15-7
Lean Six Sigma Tools for Planning and Execution Unit 15: Poka-yokes
Like any tool, sometimes even a mistake-proofing solution itself may not be mistake-proofed and may be overridden. With sensory-alert solutions, for the solution to work, the operator must respond to the trigger or signal. If the trigger is not robust, it can be ignored.
To keep the trigger from being ignored:
•
•
•
Make sure you are mistake-proofing the root cause.
Try to find a solution that leads to mistake prevention before settling for mistake detection.
Make the alert so obvious it is impossible to miss.
The following are tips for using sensory alerts:
•
•
•
If you use color-coding, make sure the colors stand out.
If you use sensory aids, keep them simple.
Don’t underestimate the power of the 5Ss as a sensory-alert aid. For example, spills are always an important alert of something going wrong.
Placement
Poka-yokes should be positioned where they are most effective in a process. As such, they should be installed:
•
•
•
•
•
•
•
•
•
Before an expensive part of a project or process
Before points of no (or difficult) return
Where one phase of an operation ends and another starts
Where measurement is most convenient
Where corrective action is easier to take
Where time is left for corrective action
After a completed task
After the completion of an error-prone activity
Where accountability for resources change
PG 15-8Prepared by: David Cutri, University of Toledo
Lean Six Sigma Tools for Planning and Execution Unit 15: Poka-yokes
Reality Check
Before implementing a Poka-yoke solution, it is always a good idea to conduct a reality check, an assessment of whether the solution is:
•
•
•
Practical
Feasible
Cost-effective
Practicality and feasibility can be judged together. A Poka-yoke does not need to be costly. A cost-benefit analysis is one way of checking the cost-effectiveness. One benefit of mistaking-proofing is the elimination of risk. Therefore, compare the risk of not implementing the solution against the cost of implementing it. This will help you evaluate the cost-effectiveness from one perspective.
Prepared by: David Cutri, University of Toledo PG 15-9
Lean Six Sigma Tools for Planning and Execution Unit 15: Poka-yokes
Steps for Applying Poka-yokes
1. Identify the operation or process based on a Pareto analysis.
2. Analyze the fishbone diagram and “Five Whys” to understand the ways a process can fail.
3. Select the right Poka-yoke approach, such as using a shut-out type of Poka-yoke (preventing an error being made) or an attention type of Poka-yoke (highlighting that an error has been made). Take a more comprehensive approach; rather than merely thinking of Poka-yokes as limit switches or automatic shutoffs, a Poka-yoke can be electrical, mechanical, procedural, visual, human, or any other form that prevents incorrect execution of a process step.
4. Determine whether to use a contact (shape, size, or other physical attribute for detection), constant number (error triggered if a certain number of actions are not made, or sequence method (checklist to ensure completing all process steps is appropriate).
5. Try the method and see if it works.
6. Train the operator, review performance, and measure success.
Prepared by: David Cutri, University of Toledo PG 15-10

Lean Six Sigma Tools for Planning and Execution Unit 15: Poka-yokes
IDEAS AND INSIGHTS
What new ideas or insights did you acquire?
How will you incorporate what you learned into your work?
Prepared by: David Cutri, University of Toledo PG 15-11


Wrap-Up and Next Steps

Lean Six Sigma Tools for Planning and Execution Unit 16: Wrap-up and Next Steps
UNIT SIXTEEN: WRAP-UP AND NEXT STEPS
UNIT OBJECTIVES
This unit concludes the Lean Six Sigma Tools for Planning and Execution course. In this unit we will:
•
•
•
Apply newly learned concepts, techniques, and skills in the workplace.
Restate major concepts, techniques, and skills learned during the course.
Develop an action plan to apply selected concepts, techniques, and skills.
Prepared by: David Cutri, University of Toledo PG 16-1
Lean Six Sigma Tools for Planning and Execution Unit 16: Wrap-up and Next Steps
COURSE OBJECTIVES
As a result of your active participation in this course, you should be better able to perform the following tasks.
Unit 2: Six Sigma Overview
Explain the necessity of each business unit’s objectives being aligned with the organization’s overall objectives.
Identify the difference between output measures and performance measures in a business process.
Identify the benefits and challenges of employing the Six Sigma methodology during a process improvement engagement.
Unit 3: Project Charter
Prepare a project charter that states the scope, outlines the objectives, and delineates the roles and responsibilities for a project.
Explain the purpose and importance of the project charter. Describe the three main uses of the project charter. Describe what every project charter should include. Create a project charter given a set of facts and circumstances surrounding a business
process improvement project.
•
•
•
Prepared by: David Cutri, University of Toledo PG 16-2
Lean Six Sigma Tools for Planning and Execution Unit 16: Wrap-up and Next Steps
Prepared by: David Cutri, University of Toledo PG 16-3
Unit 4: RACI Diagram
Complete a RACI diagram that is useful for clarifying decision-making assignments in cross-functional/departmental projects and processes.
Explain the purpose and importance of a RACI diagram.
Describe the key roles in a RACI diagram.
Illustrate the matrix format of the RACI diagram.
Unit 5: SIPOC Diagram
Produce a SIPOC diagram that captures key suppliers, inputs, process steps, outputs, and customers of a selected process.
Explain the purpose and importance of process mapping.
Explain the purpose and importance of a SIPOC diagram.
Construct a SIPOC diagram for capturing a business process and describing its key relationships.
Describe the keys to a successful SIPOC diagram.
Unit 6: Value Stream Mapping
Map the value stream of a given process to analyze the flow of materials and information required to bring a product or service to a customer.
Explain the importance of quantification in a value stream map.
Describe how customer value is tracked within a value stream map.
Describe the business process component categories captured in a value stream map.
Construct a value stream map for capturing a business process.
Prepared by: David Cutri, University of Toledo PG 16-4
Lean Six Sigma Tools for Planning and Execution Unit 16: Wrap-up and Next Steps
Unit 7: “As Is” and “To Be” Spaghetti Diagrams
Construct “as is” and “to be” spaghetti diagrams, adapted from process flowcharts, that highlight the number of key steps and spatial relationships of a particular process.
Explain the purpose of “as is” and “to be” spaghetti diagrams.
Demonstrate how “as is” and “to be” spaghetti diagrams are adapted from process
flowcharts.
Capture “as is”, and construct "to be", spaghetti diagrams that streamline the number of key steps and spatial relationships of a particular process.
Eliminate the superfluous steps in a “to be” spaghetti diagram.
Examine the spatial relationships of the key steps in a “to be” spaghetti diagram and develop a more streamlined process path.
Unit 8: Waste Walk
Perform a waste walk and recognize common wastes in a business process.
Explain the purpose and importance of performing a waste walk. Describe how to perform a waste walk effectively.
Describe common wastes that exist in a business process.
Describe the traditional “seven wastes” as a historical reference.
Lean Six Sigma Tools for Planning and Execution Unit 16: Wrap-up and Next Steps
Unit 9: 5S
Utilize the 5S workplace organization methodology to assess work space efficiency and effectiveness.
Describe the five primary phases of 5S.
Describe the benefits of 5S. Unit 10: Control Charts
Use a control chart to determine process capability.
Explain the purpose and importance of process capability.
Identify the variability of a process using a control chart.
Assess the capability of a process using a control chart.
•
•
•
•
Prepared by: David Cutri, University of Toledo PG 16-5
Lean Six Sigma Tools for Planning and Execution Unit 16: Wrap-up and Next Steps
Unit 11: Theory of Constraints
•
•
•
•
•
•
Apply Eliyahu Moshe Goldratt’s Theory of Constraints to identify and resolve process bottlenecks.
Explain the purpose and importance of the Theory of Constraints.
Describe the five focusing steps related to the Theory of Constraints.
Explain the significance of constraints in the Theory of Constraints.
Explain the use of buffers in the Theory of Constraints.
Describe the “Five Thinking Process” an organization uses to support the Theory of Constraints.
Unit 12: Cause & Effect (Fishbone) Diagrams
•
•
•
•
•
Employ a cause-and-effect (Fishbone) diagram to determine the root cause(s) of process breakdowns.
Explain the purpose and importance of root cause analysis.
Explain the purpose and importance of cause-and-effect (Fishbone) diagrams.
Describe the six categories of cause-and-effect (Fishbone) diagrams.
Construct a cause-and-effect (Fishbone) diagram for determining the root cause of an issue or problem.
Unit 13: The “Five Whys” Technique
•
•
•
Practice the “Five Whys” technique for drilling down to the ultimate root cause of issues.
Employ the question-asking method for determining the root cause of an issue or problem.
Describe the two techniques for using the “Five Whys” method.
Prepared by: David Cutri, University of Toledo PG 16-6
Lean Six Sigma Tools for Planning and Execution Unit 16: Wrap-up and Next Steps
Unit 14: Pareto Charts
•
•
•
•
•
•
Build a Pareto chart to assist with highlighting the “vital few” most common causes of defects in a given process from among the various other causes.
Explain the purpose and importance of a Pareto chart.
Demonstrate root cause analysis using a Pareto chart.
Determine the scope of the process for which a Pareto analysis will be employed.
Describe risk analysis using a Pareto chart.
Construct a Pareto chart to prioritize process failure issues.
Unit 15: Poka-yokes
•
•
•
•
Use Poka-yokes to build controls into a process rather than onto a process.
Explain the use of Poka-yokes in mistake-proofing business processes.
Describe the types of business process errors that Poka-yokes are designed to address.
Develop Poka-yokes to mistake-proof a business process.
Prepared by: David Cutri, University of Toledo PG 16-7
Lean Six Sigma Tools for Planning and Execution Unit 16: Wrap-up and Next Steps
What is the best new idea or insight you gained from the entire course?
PLANNING FOR ACTION
What actions will you take to apply the ideas, insights, techniques, and skills you have learned? Be as specific as possible in identifying these actions.
When and how might you apply what you have learned?
Continued on next page…
Prepared by: David Cutri, University of Toledo PG 16-8
Lean Six Sigma Tools for Planning and Execution Unit 16: Wrap-up and Next Steps
Your department may be using some of these strategies and techniques already. If so, how might you apply them more effectively?
Thank you for your participation!
Prepared by: David Cutri, University of Toledo PG 16-9
Works Cited
Kahn, Kamran. "Applying Theory of Constraints to Manage Bottlenecks" I-Six Sigma 26 Feb.
2010. Web. 11 May 2012. <http://www.isixsigma.com/methodology/theory-of-
constraints/applying-theory-constraints-manage-bottlenecks/>.
Martin, James W. Lean Six Sigma for Supply Chain Management. New York: McGraw-Hill,
2007. Print.
"Mistake-Proofing (Poka Yoke) Resource Center" Quality Training Portal Web 11 May 2012.
<http://www.qualitytrainingportal.com/resources/mistake-proofing/index.htm>.