Embed Size (px)
DESCRIPTION
Partially Post-Tensioned Precast Concrete Walls. Yahya C. (Gino) Kurama Assistant Professor University of Notre Dame Notre Dame, Indiana, USA. American Concrete Institute Spring 2003 Convention Vancouver, Canada April 2, 2003. POST-TENSIONED PRECAST CONCRETE WALL. anchorage. wall panel. - PowerPoint PPT Presentation
Citation preview

Partially Post-TensionedPartially Post-TensionedPrecast Concrete WallsPrecast Concrete Walls
Yahya C. (Gino) KuramaYahya C. (Gino) Kurama
Assistant ProfessorAssistant Professor
University of Notre DameUniversity of Notre Dame
Notre Dame, Indiana, USANotre Dame, Indiana, USA
American Concrete Institute Spring 2003 ConventionAmerican Concrete Institute Spring 2003 ConventionVancouver, CanadaVancouver, Canada
April 2, 2003April 2, 2003

POST-TENSIONED PRECAST CONCRETE WALLPOST-TENSIONED PRECAST CONCRETE WALLanchorage
spiralreinforcement
wall panel
horizontaljointunbonded
PT bars
foundation
reinforcement bondedwire mesh
unbondedPT bar
spiral
precast wall with full PT

BEHAVIOR UNDER LATERAL LOADSBEHAVIOR UNDER LATERAL LOADS
gap opening

HYSTERETIC BEHAVIORHYSTERETIC BEHAVIOR base shear, kips (kN)
roof drift, %
0 1 2
800(3558)
-800(-3558)
-1-2

VERTICALLY JOINTED WALLSVERTICALLY JOINTED WALLS
Priestley et al.Perez et al.KuramaPall et al.
friction or metallic-yield damper
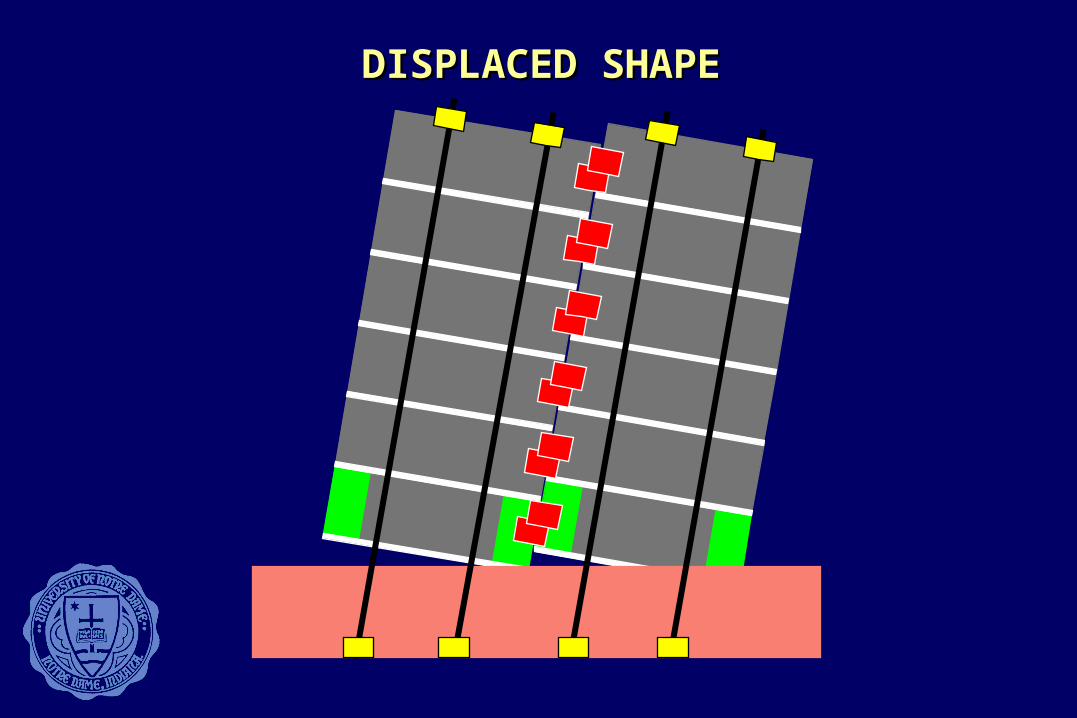
DISPLACED SHAPEDISPLACED SHAPE

WALLS WITH PARTIAL POST-TENSIONINGWALLS WITH PARTIAL POST-TENSIONING
unbondedPT bar
bondedmildbar
bondedmild bar
precast wall with partial PT
unbondedPT bar

ENERGY DISSIPATIONENERGY DISSIPATION
mild steelyielding

PARTIALLY POST-TENSIONED PRECAST FRAMEPARTIALLY POST-TENSIONED PRECAST FRAME
column
beam
PT tendon
mild steel bar
fiber reinforced grout
trough
beam-to-column joint
Cheok et al.Priestley et al.Stanton et al.Nakaki et al.

OBJECTIVESOBJECTIVES
• Investigate precast wall systems with PT steel and mild steel
• Develop seismic design approach
• Evaluate seismic response

• Prototype walls and expected behavior Prototype walls and expected behavior
• Seismic design approach and evaluationSeismic design approach and evaluation
• Summary and conclusionsSummary and conclusions
OUTLINE

• Four fully post-tensioned wallsFour fully post-tensioned walls
• Four walls with only mild steel (emulative walls) Four walls with only mild steel (emulative walls)
• Four partially post-tensioned wallsFour partially post-tensioned walls
PROTOTYPE WALLS

PLAN LAYOUT OF PROTOTYPE BUILDINGSPLAN LAYOUT OF PROTOTYPE BUILDINGS
N
gravity loadframe
wall
invertedT-beamL-beamcolumn
8 x 24 ft = 192 ft (58.5 m)40
+ 3
0 +
40
= 1
10 f
t
hollow- corepanels
lateral loadframe
(33.
5 m
)
4 story building, high seismicity 6 story building, high seismicity
10 story building, high seismicity 6 story building, medium seismicity

FULLY POST-TENSIONED WALLSFULLY POST-TENSIONED WALLS
55 ft
20 ft (6 m)
81 ft
20 ft (6 m)
133 ft
26 ft (8 m)
81 ft
20 ft (6 m)
(17 ft)
(25 ft)
(41 ft)
(25 ft)
4 storyhigh seismicity
6 storyhigh seismicity
10 storyhigh seismicity
6 storymedium seismicity

Wall PH410 ft (3 m)
CL
fpi=0.60-0.65fpu
Ap=1.49in2 (961mm2)#3 spirals
Wall PH610 ft (3 m)
CL
Wall PH10
13 ft (4 m)
CL
Wall PM6
10 ft (3 m)
CL
12in.(305mm)
12in.(305mm)
12in.(305mm)
12in.(305mm)
sp=7.3% fpi=0.60-0.65fpu
Ap=1.49in2 (961mm2)#3 spiralssp=7.3%
fpi=0.625fpu
Ap=1.49in2 (961mm2)#3 spiralssp=1.8%fpi=0.60-0.65fpu
Ap=1.49in2 (961mm2)#3 spiralssp=7.3%
FULLY POST-TENSIONED WALLSFULLY POST-TENSIONED WALLS

EMULATIVE WALLSEMULATIVE WALLS
Wall EH4
12in.
10 ft (3 m)
16 pairs CLNo. 8 bars
5 pairsNo. 5 bars
@ 2.25 in. @ 18 in.
Wall EH6
10 ft (3 m)
15 pairs CLNo. 8 bars
5 pairsNo. 5 bars
@ 2.5 in. @ 18 in.
Wall EH10
13 ft (4 m)
20 pairs CLNo. 8 bars
6 pairsNo. 5 bars
@ 2.25 in. @ 18 in.
Wall EM6
10 ft (3 m)
7 pairs CLNo. 6 bars
5 pairsNo. 5 bars
@ 5.25 in. @ 18 in.
(305mm)
12in.(305mm)
12in.(305mm)
12in.(305mm)
(@ 57 mm) (@ 457 mm) (@ 63 mm) (@ 457 mm)
(@ 57 mm) (@ 457 mm) (@ 133 mm) (@ 457 mm)

PARTIALLY POST-TENSIONED WALLSPARTIALLY POST-TENSIONED WALLS
Wall HH6-25
10 ft (3 m)
7 pairs CLNo. 5 bars
5 pairsNo. 5 bars
@ 5.5 in. @ 18 in.
Wall HH6-50
10 ft (3 m)
7 pairs CLNo. 8 bars
5 pairsNo. 5 bars
@ 5.5 in. @ 18 in.
Wall HH6-75
10 ft (3 m)
11 pairs CLNo. 8 bars
5 pairsNo. 5 bars
@ 3.5 in. @ 18 in.
Wall HM6-50
10 ft (3 m)
CL8 pairsNo. 5 bars
@ 17 in.
12in.(305mm)
12in.(305mm)
12in.(305mm)
12in.(305mm)
(@ 140 mm) (@ 457 mm) (@ 140 mm) (@ 457 mm)
(@ 89 mm) (@ 457 mm) (@ 432 mm)

ANALYTICAL WALL MODEL
fiberelement
kinematicconstraint
trusselement
-100 (690)
0
100 (690)
-0.08 0 0.08
stress, ksi (MPa)
strain
0
7 (48)
0.006
stress, ksi (MPa)
strain
160 (1103)
stress, ksi (MPa)
strain
120 (827)
0.03510
MILD STEEL
PT STEEL CONCRETE

WALL BEHAVIOR UNDER MONOTONIC LOADS
0 3 0 3
0 20 3
Wall PH4Wall EH4
Wall PM6
Wall EM6Wall HM6-50Wall PH10
Wall EH10
Wall PH6Wall HH6-25Wall HH6-50Wall HH6-75Wall EH6
1500base shear, kips (kN)
roof drift, %
1000base shear, kips (kN)
roof drift, %
1000base shear, kips (kN)
500base shear, kips (kN)
roof drift, %
(6672) (4448)
(4448) (2224)
roof drift, %

SIX STORY WALLS IN HIGH SEISMICITYSIX STORY WALLS IN HIGH SEISMICITY
-1000
0
1000
-3 0 3
base shear, kips (kN)
roof drift, %
Wall PH6(4448)
(-4448)
0
-3 0 3
Wall EH6
-1000
1000base shear, kips (kN)
(4448)
(-4448)
roof drift, %
Wall HH6-25 Wall HH6-50
0
-3 0 3
Wall HH6-75
-1000
1000base shear, kips (kN)
(4448)
(-4448)
roof drift, %
-3 0 3
base shear, kips (kN)
roof drift, %-3 0 3
base shear, kips (kN)
roof drift, %

NORMALIZED INELASTIC ENERGY DISSIPATIONNORMALIZED INELASTIC ENERGY DISSIPATION
-1000
0
1000
-3 0 3
base shear, kips (kN)
roof drift, %
Dh
Ue
-c
-c
Dh
Ue
dh =
ksec
(4448)
(-4448)

NORMALIZED INELASTIC ENERGY DISSIPATIONNORMALIZED INELASTIC ENERGY DISSIPATION
0
0.5
1
1.5
2
3
Wall PH4Wall EH4
(dh = Dh / Ue)
cycle roof drift,
0
0.5
1
1.5
2
3
(dh = Dh / Ue)
cycle roof drift,
0
0.5
1
1.5
2
3
(dh = Dh / Ue)
cycle roof drift,
0
0.5
1
1.5
2
2
(dh = Dh / Ue)
cycle roof drift, %
Wall PH10Wall EH10
Wall PH6Wall HH6-25Wall HH6-50Wall HH6-75Wall EH6
Wall PM6Wall HM6-50Wall EM6

DYNAMIC RESPONSEDYNAMIC RESPONSE
-2.5
0
2.5
0 15
roof drift, %
time, seconds-2.5
0
2.5
0 15
roof drift, %
time, seconds
-2.5
0
2.5
0 15
roof drift, %
time, seconds-1.5
0
1.5
0 15
roof drift, %
time, seconds
PH4EH4
PH10EH10
PH6HH6-25
HH6-75EH6
PM6HM6-50EM6
HH6-50NOSYPGA=0.97g
NOSYPGA=0.97g
NOSYPGA=0.97g
NOSYPGA=0.39g

0
0.2
0.4
0.6
0.8
1.0
0.2 0.4 0.6 0.8 1normalized mild steel ratio
normalized maximum roof drift
0
PH6 HH6-25 HH6-50 HH6-75 EH6
average
REDUCTION IN MAXIMUM ROOF DRIFTREDUCTION IN MAXIMUM ROOF DRIFT

0
2
4
6
8
0.5 1
average number of drift peaks
normalized amplitude of drift peak
0
2
4
6
8
0.5 1
average number of drift peaks
normalized amplitude of drift peak
0
2
4
6
8
0.5 1
average number of drift peaks
normalized amplitude of drift peak
0
2
4
6
8
0.5 1
average number of drift peaks
normalized amplitude of drift peak
WALL PH4WALL EH4
WALL PH10WALL EH10
WALL PM6WALL HM6-50WALL EM6
WALL PH6WALL HH6-25
WALL HH6-75WALL HH6-50
WALL EH6
REDUCTION IN NUMBER OF DRIFT PEAKSREDUCTION IN NUMBER OF DRIFT PEAKS

• Prototype wallsPrototype walls
• Expected behavior Expected behavior
• Seismic design approach and evaluationSeismic design approach and evaluation
• Summary and conclusionsSummary and conclusions
OUTLINE

FIRST MODE REPRESENTATIONFIRST MODE REPRESENTATION
-1.5
0
1.5
0 4 8 12 16time, seconds
roof drift, %
first modetotal
Wall HW1SAC LA25, PGA=0.87g

SDOF REPRESENTATION
Bilinear-Elastic (BE) Elasto-Plastic (EP)
+=
F F
(Fbe,be)
kbe
(rFbe,be)
skbe
kbe
Bilinear-Elastic/ Elasto-Plastic (BP)
F
[(1+r)Fbe,be]
(1+s)kbe
kbe
MDOF MODEL SDOF MODEL
-2000
0
2000
-3 0 3
base shear, kips (kN)
roof drift, %
(8896)
(8896)-2000
0
2000
-3 0 3
base shear, kips (kN)
roof drift, %
(8896)
(8896)

0.5 1 1.5 2 2.5 3 3.50
2
Los Ang., SD soil, survival-level (SAC LA21-40)
AVG spectrum
4
period, seconds
5% damping
SAC GROUND MOTIONSSAC GROUND MOTIONSpseudo-acceleration, g

SDOF/MDOF PEAK DISPLACEMENTSDOF/MDOF PEAK DISPLACEMENT
50 100 (381) 150
0.2
0.4
0.6
0.8
1.0
1.2
0
SDOF/MDOF maximum displacement ratio
maximum incremental velocity, in/sec (cm/sec)
Wall HW1SAC LA21- 40
mean

DUCTILITY DEMANDDUCTILITY DEMAND
(Nassar & Krawinkler, 1991)
• s = r = 1/4, 1/3, 1/2• = 0.02, 0.10• Moderate and High Seismicity• Design-Level and Survival-Level• Stiff Soil and Medium Soil Profiles
Bilinear-Elastic (BE) Elasto-Plastic (EP)
+=
F F
(Fbe,be)
kbe
(rFbe,be)
skbe
kbe
R=[c1)+1]1/c
c= +
Ta b
Ta+1 T
(Farrow and Kurama, 2001)
Bilinear-Elastic/
Elasto-Plastic (BP)
F
[(1+r)Fbe,be]
(1+s)kbe
kbe

DUCTILITY DEMAND SPECTRA (Farrow and Kurama, 2001)
14
0 3.5period, seconds
14
0 3.5
Design EQ (SAC): a=3.83, b=0.87 Survival EQ (SAC): a=1.08, b=0.89ductility demand,
period, seconds
ductility demand,
0
14
3.5 period, seconds0
14
3.5 period, seconds
regressionBP, mean
ductility demand, ductility demand,
EP, meanBP, mean
BE, mean
Survival EQ (SAC): BP versus EP Survival EQ (SAC): BP versus BE
r = s = 1/3, =0.10, High Seismicity, Stiff (Sd) Soil, R=1, 2, 4, 6, 8 (thin thick)

NONLINEAR DEMAND SPECTRANONLINEAR DEMAND SPECTRA
T = 0.5 sec.a = -0.71b = 0.94
=1
(linear-elastic)2
48
2
4
8
T = 1.5 sec.a = -0.71b = 0.94
=1(linear-elastic)
0 (39) 100
0.5
1
1.5
0
0.5
1
1.5
demand displacement, cm (in.)(39) 100
demand acceleration, g demand acceleration, g
demand displacement, cm (in.)

DESIGN OBJECTIVES – SURVIVAL LEVELDESIGN OBJECTIVES – SURVIVAL LEVEL
baseshear
roof drift
immediateoccupancy (t=1.19%)
collapseprevention (t=2.17%)
WALL WH1 WALL WH2

WALLS HW1 AND HW2WALLS HW1 AND HW2
Wall WH1
11 ft (3.35 m)
8 pairs CLNo. 10 bars
7 pairsNo. 5 bars
@ 2.5 in. @ 18 in.
Wall WH2
10 ft (3 m)
7 pairs CLNo. 10 bars
6 pairsNo. 5 bars
@ 2.5 in. @ 18 in.
12in.(305mm)
12in.(305mm)
(@ 63 mm) (@ 457 mm)
(@ 63 mm) (@ 457 mm)

WALL HW1WALL HW1
1
2
3
0 50 100 (381) 150
maximum roof drift, %
maximum incremental velocity, in/sec (cm/sec)
t=1.19%
mean=1.13%

WALL WH2WALL WH2
0
0.5
1
1.5
2
2.5
33.5
50 100
maximum roof drift, %
(381) 150maximum incremental velocity, in/sec (cm/sec)
t=2.17%
mean=1.85%

CONCLUSIONSCONCLUSIONS
Energy Dissipation
• Mild steel reinforcement yielding in tension and compression
Design Approach
• MDOF SDOF Nonlinear demand spectra
• Target drift
Seismic Response Evaluation
• Maximum drift reduced below target drift
• Significant scatter in results

National Science FoundationNational Science Foundation CAREER-Program CAREER-Program
CMS 98-74872CMS 98-74872
Program DirectorsProgram DirectorsDr. S. C. LiuDr. S. C. Liu
Dr. S. MaCabeDr. S. MaCabe