Embed Size (px)
Citation preview
Food Sci. Technol, Campinas, 37(Suppl. 1): 55-62, Dec. 2017 55
Food Science and Technology ISSN 0101-2061
DI:D http://dx.doi.org/10.1590/1678-457X.32216
1 IntroductionConsumers are increasingly aware of the importance of
healthy eating and the nutritional value of food as a condition for good health. In this respect, excessive consumption of some substances like sodium has been increasingly debated due to its relation to hypertension, problem considered typical of a modern society.
The word trend can be defined as the tendency of individuals to modify habits already established. The action is the result of economic, social, cultural and political movements, large and complex, that translate into constant influence on people’s lives. Trends “healthiness and well-being” are originated on factors such as the aging of populations, scientific discoveries linking certain diets to diseases, as well as income and life in big cities, influencing the search for a healthier lifestyle. There are several consumer segments that are emerging from these trends, including products with reduced sodium content (better-for-you) are being valued by consumers in several countries (Sullivan et al., 2013).
The agreement signed by the Brazilian Ministry of Health provides for gradual reduction of sodium in 16 food categories that should be met by the food industry by 2014 and deepened until 2016, raising once again the question of the importance of the adequacy of sodium intake among population. Products such as instant noodles, French bread, broth and ready spices, sausages, processed meats and processed products offer an abusive amount of this component (Brasil, 2012).
Bread is one of the foods most consumed by humans. It is estimated that one unit of French bread of 50 g has approximately 320 mg of sodium (Sosa et al., 2008), being this single unit responsible for 15% of the daily sodium intake recommended by the World Health Drganization (2007), making this food a major contributor to the sodium intake in many countries (Dötsch et al., 2009; Bolhuis et al., 2011).
Sodium chloride has an important role in the production of bread: it influences the behavior of gluten, reinforces the structure of the dough slows gas production, decreases the activity of yeast in the dough, and improves the flavor of bread. Despite its importance in the baking process, in some international analytical studies the authors found high levels of salt, pointing out the need to reduce its content in the baking industry, for health reasons for consumers (Miller & Hoseney, 2008).
Studies have found that it is feasible to decrease to 99.7% of the sodium in the formulation of white bread, without compromising the rheological properties, but generate an impact on the sensory acceptance by consumers (Silva et al., 2003). In Ireland, it was possible to produce bread with 0.3% and 0.6% salt compared to control (1.2% salt) without compromise the rheology of the dough and the quality characteristics (Lynch et al., 2009).
Another way to reduce sodium is partially replaced by another salt. The most commonly used is potassium chloride
Partial replacement of sodium chloride by potassium chloride in the formulation of French bread: effect on the physical, physicochemical and sensory parameters
Thaisa Abrantes Souza GUSMÃD1*, Anatalha Marinho ALEXANDRE2, Nayara Gabriela Gonçalves de SDUZA2, Katharina Kardinele Barros SASSI2, Rennan Pereira de GUSMÃD1, Ricardo Targino MDREIRA2
a
Received 17 Nov., 2016 Accepted 13 Feb., 20171Department of Food Engineering, Universidade Federal de Campina Grande – UFCG, Campina Grande, PB, Brazil2Department of Food Engineering, Universidade Federal da Paraíba – UFPB, João Pessoa, PB, Brazil*Corresponding author: [email protected]
AbstractThis study aimed to the replacement of sodium chloride (0.4 to 1.6%) by potassium chloride (0.2 to 0.8%) in French bread formulation and evaluate its effect on physical, physicochemical and sensory characteristics. For the preparation of bread was used a factorial design 22 with 4 factorial points and 3 central points, totaling 7 experiments. The physical and physicochemical parameters analyzed were: specific volume, moisture, color of the peel and crumb, pH, acidity and texture profile, sodium and potassium. The sensory evaluation of bread was performed using quantitative descriptive analysis, with 12 sensory terminologies. Response variables of salty taste and sensory chewiness generated statistically significant models. The results indicated optimal ranges of 0.2 to 0.5% of potassium chloride, and 1.0 to 1.6% for sodium chloride, and proved the technical feasibility of producing French bread with 50% salt reduction (174.09 mg.50 g–1), compared to a standard formulation of 1.88% (306.5 mg.50g-1) salt, corresponding to the prognosis recommended by the National Health Surveillance Agency.
Keywords: hypertension; prevention; sodium reduction.
Pratical Application: Potassium chloride contributed to obtain French bread with lower sodium content and did not 19 change its quality parameters.

Sodium reduction optimization in French bread
Food Sci. Technol, Campinas, 37(Suppl. 1): 55-62, Dec. 201756
(KCl), which has similar properties to NaCl and recognized as safe, can be used without loss of functionality. However, addition of potassium chloride is restricted due to bitter taste that gives the product when in large quantities. In wholemeal bread, a replacement of 55.2% of potassium chloride, 69.0% magnesium chloride and 34.8% calcium chloride was possible (Charlton et al., 2007).
Knowing that the excess of sodium in diet is responsible for a number of health problems, and considering the need to reduce sodium content in French bread, it is proposed in this study to evaluate the effects of lowering the concentration of the sodium chloride content and its partial replacement by potassium chloride on the physical, physicochemical and sensory of French bread.
2 Material and methodsThe experiment was an applied research, conducted in loco,
developed in real conditions on a baking company located in the city of João Pessoa – PB/ Brazil.
2.1 Raw materials and formulation of French bread
The experiments were performed starting with a standard French bread formulation using wheat flour fortified with iron and folic acid (4 kg-100%), Water (1.6 L-40%), ice (500 g), baking powder (120 g-3%) margarine (50 g-1.25%) and flour improver (40 g-1%). The percentages of ingredients are calculated based on the amount of flour (100%). The effect of replacing sodium chloride with potassium chloride was analyzed from a factorial design 22, with 4 factorial points (levels ± 1) and three central points (level 0), totaling 7 experiments, having as independent variables the sodium chloride content (0.4 to 1.6%) and the contents of potassium chloride (0.2 to 0.8%) relative to wheat flour weight (Table 1).
The choice of sodium chloride levels was based on the regulation issued by the Ministry of Health on the reduction of NaCl levels in the formulation of French bread (Brasil, 2012). The choice of KCl levels was based on the positive results of previous studies in French bread (Charlton et al., 2007; Ignácio et al., 2013).
2.2 Manufacturing process of French bread
The production of bread follows the straight dough process with batch of 4.0 kg of wheat flour. The ingredients were mixed in Supreme dough mixer (model SR 15, São Paulo, Brazil).
This step was performed in two phases: slow speed (90 rpm) for 5 minutes and fast speed (180 rpm) for 5 minutes until the dough reached full development of the gluten. Water temperature used was approximately 10 °C to obtain dough with a final temperature of about 28 °C. After mixing, the dough was divided into pieces of 1.8 kg, subdivided into 60 g portions, which were molded into the form of French bread, in a modeler 0.5 Hp HM2 model (Hypo Ferraz Vasconcelos, São Paulo, Brazil), arranged in wire mesh and left to ferment in fermentation chamber with temperature around 32 °C and relative moisture of 80% at 8 h period, where it was observed an increase in the volume of about two times its initial volume. Before the beginning of molding, the dough rest for 20 minutes, fixed for all tests. Subsequently, after fermentation, was conducted the cutting of the surface of the dough and baking in an electric furnace with steam injection for 10 minutes at 220 °C. The cooling of bread was performed in wire mesh at room temperature.
2.3 Physical and physicochemical analyzes
The breads were submitted to analysis of specific volume, moisture, color of the peel and crumb, pH, acidity and texture profile.
The specific volume was determined by the displacement method of millet seeds, calculating the result by the ratio of the volume (cm3) and the bread dough (g) being expressed in cm3.g–1 (American Association of Cereal Chemists, 2000). Moisture content was analyzed at 105 °C to constant weight (Association of Dfficial Analytical Chemists, 1997). For pH and acidity, it was homogenized 10 g of each sample with 90 mL of distilled water, and the pH determined was resulting suspension using potentiometer model 0400 (Quimis, São Paulo, Brazil), previously calibrated and operated according to the instructions of the manufacturer. Then the suspension was titrated with 0.1N NaDH solution to pH 8.5. The titratable acidity was expressed in mL of 0.1 N NaDH consumed by 10 g of bread (Robert et al., 2006).
French bread color analysis was performed at three different points in the peel and three in the crumb and the results of each part was expressed by mean, using a digital colorimeter Model CR 300 (Minolta, NJ, USA), after its calibration in a white ceramics. The color was determined according to the CIE L* a* b* (Commision Internationale L’Eclairage) in which the parameters L* (brightness ranging from 0 to 100), a* (–a* to a* indicating green to red) and b* (–b* a b* indicating blue to yellow) were analyzed (Altamirano-Fortoul & Rosell, 2011).
Breads texture profile was performed one day after its manufacture, with the help of texturometer model TA-XT2i (Stable Micro Systems, Surrey, UK), equipped with compression cylindrical probe, with 36 mm in diameter. The parameters determined were texture firmness (N), elasticity, cohesiveness and chewiness (J). The instrumental analysis of texture was performed under the following conditions: pre-test speed, test and post-test of 2.0 mm.s–1, 5.0 mm.s–1 and 5.0 mm.s–1, respectively; with a distance of 20 mm, 20 g trigger type and time between the two compressions of 5 sec. For analysis of these parameters, the ends of French bread were removed, resulting in a cylinder with approximately 6.0 cm long (Carr & Tadini, 2003).
Table 1. Matrix of experimental design for the preparation of French bread with replacement of NaCl by KCl.
Assays Sodium chloride (%)X1
Potassium chloride (%)X2
1 0.4 (–1) 0.2 (–1)2 1.6 (+1) 0.2 (–1)3 0.4 (–1) 0.8 (+1)4 1.6 (+1) 0.8 (+1)5 1.0 (0) 0.5 (0)6 1.0 (0) 0.5 (0)7 1.0 (0) 0.5 (0)
Gusmão et al.
Food Sci. Technol, Campinas, 37(Suppl. 1): 55-62, Dec. 2017 57
The sodium and potassium concentrations were quantified by energy dispersive X-ray fluorescence from the ashes obtained from breads. The fluorescent X-ray spectrometer used was the model EDX-720 (Shimadzu, Japan).
2.4 Sensory evaluation
The work was submitted to the Research Ethics Committee of the Health Sciences Center of the Federal University of Paraíba CCS / UFPB by Brazil platform where the certificate was issued for performing activities under No. 0280/13, CAAE: 1503713.4. 0000.5188; all participants signed the Informed Consent and Clarified (IC), agreeing to voluntarily participate in the tests, as required by resolution n.466 / 2012 of the National Health Council. French bread samples were subjected to most probable number analysis and total and thermotolerant coliforms and Salmonella sp (Food and Drug Administration, 2007).
Sensory evaluation was performed by Quantitative Descriptive Analysis (QDA) technique developed by Stone et al. (2008). Initially were recruited 33 volunteers between groups of students of the Federal University of Paraiba Technology Center - CT / UFPB; after the steps of pre-selection and training,
14 judges were selected based on their discriminative capacity (pF samples < 0.50), reproducibility (pF repetitions > 0.05) and consensus with team (> 80% of descriptors) .
The evaluated attributes were: peel color, purity of the Surface color, opening of the peel, crumb color, crumb structure, fermented aroma, salty taste, residual bitter, peel crispness, softness of crumb, chewiness and moisture. The evaluation of the attributes described was performed using unstructured scales of nine centimeters, anchored at the ends; the references are described in Table 2.
2.5 Statistical analysis
The results were evaluated by analysis of variance (ANDVA) using Statistica version 5.0 software (Statsoft, 2004) where the effect of certain variables and coefficients of the models for experimental responses were estimated. Statistical analysis was based on a significance level of 95% (p ≤ 0.05).
The sensory responses were assessed by the methodology of Principal Component Analysis (PCA), using the statistical softwares The Unscrumbler 9.7 and Matlab R2008a.
Table 2. Definitions of terms and references descriptors chosen for evaluation of the samples.
TABLE DF REFERENCES FDR SENSDRY ANALYSIS DF FRENCH BREAD
Descriptive terms (attributes) Definition References
Appearance (Peel)
Peel color Brown color characteristic of baked French bread peel
Light (Brown): French bread with minimum baking timeDark (dark brown): French bread with maximum baking time
Purity of the Surface color Regarding the brightness of the peel of French bread
Dpaque: Egg Sponge Bread (bisnaguinha)
Bright: Sweet bread
Dpening of the peelThe bread should not be obstructed; the cuts should be regular, well-defined, smooth surface and well highlighted edges.
Closed: French bread with closed peel
Dpen: French bread with open peel
Appearance (Crumb)
Crumb color White color characteristic of French bread crumbWeak (pure white): Wheat flourStrong (Lightly cream): Milky Flour
Crumb structure Homogeneous with slightly elongated cells with thin walls and without holes
Uniform: Egg Sponge Bread (bisnaguinha)Not uniform: Panettone
Aroma Fermented aroma characteristic aroma of fermented doughNone: filtered waterStrong: Biological yeast paste
Taste
Salty taste Taste stimulated by the presence (intensity) of salt in the sample
None: filtered waterStrong: Cracker
Residual Bitter Bitter taste perceived in the mouth after swallowing the sample
Weak: (filtered water)Strong (accented bitter taste): Solution with 1% caffeine
Texture
Peel crispness It produces a sharp sound when bitten, clicking on teeth
Little (no sound): cornstarch biscuit immersed in waterMuch (Displays noise): Toast
Softness of Crumb Referring to the soft appearance of the crumb when chewing or cutting, ranging from firm to soft
Weak (low smoothness): water and salt crackerStrong (Soft): Commercial Cake
Chewiness Required number of chews before swallowingLittle: Gum Biscuits (raivinha)Much: Cereal bar
Moisture Sensation caused by the amount of water in the foodLittle: Water and salt crackerMuch: Commercial Cake
Sodium reduction optimization in French bread
Food Sci. Technol, Campinas, 37(Suppl. 1): 55-62, Dec. 201758
3 Results e discussion3.1 Physical and physicochemical analyzes
Results of physical and physical-chemical analysis of French bread are shown in Table 3, where for moisture responses (A), specific volume (VE), pH (pH), acidity (BC), crust color and crumb color (a*, b*, L*) the experimental data did not fit the model tested (1st order), it was not possible to establish meaningful models, indicating that the product has uniformity among treatments.
Mean values for pH and acidity of bread vary from 5.66 to 5.86 and from 2.83 to 3.63 mL of NaDH 0.1 N.10g–1 of bread, respectively. Ph values are close to the value considered great for French bread type, which is 5.60, recommended by Quaglia (1991). Breads also showed satisfactory acidity, being close to the observed (1.5-3.3 mL NaDH 0.1 N.10g–1 of bread) in French bread only added with yeasts (Quílez et al., 2006; Belz et al., 2012). These authors observed that the acceptance increased with increase in pH and a reduction in acidity.
The specific volume of breads were above 6.0 cm3.g–1, being between 6.07 to 7.38 cm3.g–1. Belz et al. (2012), found values between 3.56 to 5.10 cm3.g–1 when using calcium propionate on the microbial shelf-life of salt reduced bread. Ignácio et al. (2013) found specific volumes ranging from 3.22 to 4.06 cm3.g-1, in samples with replacement of sodium chloride by potassium chloride in 30 and 50% in French bread.
Resolution - RDC n. 90 of 18 Dctober 2000 of the National Health Surveillance Agency establishes a maximum limit of 38% moisture to baked breads exclusively with plain wheat flour and/or special purpose flour (semolina/wheat semolina) (Brasil, 2000). Breads produced in this study had moisture between 29.98 and 31.82%, being lower than recommended by Resolution.
Mean of luminosity of French bread peel varies from 59.38 to 68.37, with all situated near 60 to 78, range satisfactory (Purlis & Salvadori, 2009). According to Purlis (2011), breads with luminosity around 70 have good sensory acceptance. However, values below 60 results in excessive browning, and above 78 results in very bright color, indicative of insufficient cooking.
Regarding the mean of bread peel chromaticity parameters, it was found that a* ranged from 3.46 to 8.63 and b* of 31.82 to 39.13. With respect to these features was not found in the literature any reports on recommended values in French bread or studies correlating values of these parameters with sensory analysis.
The mean luminosity value of the bread crumb varies from 81.58 to 84.97. Some factors such as type of flour and proportion of ingredients used, can influence the crumb color (Gallagher et al., 2003; Salgado et al., 2011.). For the chromaticity parameters of the crumb was observed that the mean of a* ranged from –1.31 to –2.00 and b* ranged from 14.68 to 16.31.
Results of the texture profile analysis (TPA) are presented in Table 3, where for firm answers, elasticity, cohesiveness and chewiness, the experimental data did not fit the model tested (1st order), it was not possible to establish meaningful models, indicating that the product has uniformity among treatments.
The means of firmness of French bread ranged from 6.51 N to 9.53 N, lower than reported by Lynch et al. (2009), which, by reducing the salt to levels of 1.2, 0.6, 0.3 and 0% in the formulation of French bread, firmness increased from 9.7 N to 14.0 N after reducing this ingredient.
In relation to other parameters of French bread texture, it was found that the average of chewiness ranged from 4.14 to 5.71 J J and elasticity of 0.87 to 0.93 mm. Regarding the cohesiveness, values were observed between 0.63 and 0.77, while Carr &
Table 3. Responses of physical and physicochemical parameters of quality of French bread with partial replacement of sodium chloride (NaCl) by potassium chloride (KCl).
Samples**Assays
1 2 3 4 5 6 7Moisture 30.62 ± 0.42 30.76 ± 1.00 31.37 ± 1.09 29.98 ± 0.48 31.04 ± 0.33 31.70 ± 0.07 31.82 ± 0.25pH 5.78 ± 0.02 5.72 ± 0.01 5.86 ± 0.01 5.73 ± 0.02 5.74 ± 0.01 5.66 ± 0.02 5.83 ± 0.01Acidity 2.83 ± 0.09 3.46 ± 0.05 3.10 ± 0.05 3.40 ± 0.15 2.76 ± 0.06 3.63 ± 0.05 3.20 ± 0.06Specified volume 7.38 ± 0.29 6.07 ± 0.07 6.98 ± 0.43 6.50 ± 0.64 6.95 ± 0.32 6.69 ± 0.44 7.20 ± 0.10
Peel color
L* 67.89 ± 5.88 66.84 ± 2.36 69.13 ± 1.98 59.38 ± 1.70 68.37 ± 5.01 67.14 ± 0.44 62.82 ± 2.79a* 3.46 ± 1.73 8.63 ± 1.94 6.49 ± 2.36 7.27 ± 2.46 5.87 ± 1.27 8.09 ± 0.08 7.89 ± 2.04b* 32.37 ± 2.12 38.05 ± 3.32 35.49 ± 5.75 31.82 ± 4.30 35.61 ± 0.85 39.13 ± 0.38 35.72 ± 4.64
Crumb color
L* 84.27 ± 0.68 83.06 ± 1.06 84.01 ± 0.69 83.45 ± 1.53 84.91 ± 1.11 81.58 ± 2.47 83.44 ± 0.94a* -1.82 ± 0.13 -1.68 ± 0.07 -1.86 ± 0.06 -1.32 ± 0.09 -1.94 ± 0.07 -1.86 ± 0.13 -2.00 ± 0.06b* 15.46 ± 1.30 16.07 ± 0.31 14.88 ± 0.38 16.31 ± 0.56 15.24 ± 1.28 14.68 ± 1.16 15.04 ± 0.28
Chewiness*** (J) 5.46 ± 1.12 4.14 ± 0.54 5.61 ± 1.63 5.71 ± 0.71 4.91 ± 0.96 5.59 ± 0.89 5.35 ± 1.15Elasticity*** (mm) 0.87 ± 0.07 0.93 ± 0.16 0.85 ± 0.05 0.94 ± 0.02 0.93 ± 0.05 0.94 ± 0.02 0.91 ± 0.02Cohesivenes*** (Dimensionless) 0.65 ± 0.05 0.63 ± 0.04 0.63 ± 0.06 0.73 ± 0.06 0.69 ± 0.02 0.77 ± 0.07 0.68 ± 0.02Firmness*** (N) 9.53 ± 0.85 7.46 ± 0.91 7.30 ± 1.76 7.85 ± 1.22 7.66 ± 1.01 6.51 ± 0.93 8.55 ± 1.81L* (luminosity); a* (intensity of red/green); b* (intensity of yellow/blue) - color parameters (CIELab). ** Mean of triplicate (± standard deviation); *** Mean of ten repetitions on different samples (± standard deviation).
Gusmão et al.
Food Sci. Technol, Campinas, 37(Suppl. 1): 55-62, Dec. 2017 59
Tadini (2003) had values between 0.65 and 0.72. A smaller value indicates less cohesiveness strength to stretch the food until it is broken (Szczesniak, 1998).
3.2 Sensory quality of French bread
The responses of sensory variables of French bread are shown in Table 4. For the attributes of peel color, purity of the surface color, opening of the peel, crumb color, crumb structure, fermented aroma, residual bitter, crispiness of the peel, crumb softness and moisture, it was not possible to establish meaningful models, i.e., the experimental data does not incorporate the model (1st order), this result indicates that in spite of variations in sodium chloride and potassium chloride concentration, these did not influence the sensory characteristics described, obtaining a uniform product to the treatments studied.
For the peel color attribute, samples were considered by the sensory panel as clear staining score ranging from 2.87 to 5.19. The peel of French bread should be golden, homogenous and shiny. Usually gets a more golden peel when you add sugar in the bread formulation. The brightness of the French bread crust is important as it highlights the gold, and this effect is optimized using the water vapor during and a few minutes before breads being put into the oven. The attribute purity of surface color which is related to the brightness of the peel, scores ranged from 1.46 to 5.45. This variation can be explained because the production of water vapor is not uniform inside the oven.
The opening on the bread peel should not be obstructed, the cuts should be regular, well-defined, with a smooth surface and well highlighted edges. Scores for this attribute ranged from 2.55 to 6.20. For fermented aroma attribute, all trials were considered mild flavor (2.03 to 2.88). Jensen et al. (2015) evaluated the sensory profile of breads with manioc flour and obtained mean score for that attribute between 2.09 and 7.77.
Breads had the crumb color ranging from 1.62 to 2.19, indicating crumbs with white to lightly cream color. Crumb
structure was classified as very homogeneous and without holes (4.32 to 5.46).
As for attributes salty taste and bitter taste, samples were considered insufficiently salty (1.31 the 4.10) and with a very small residual bitter taste (the 0.86 1.70).
Regarding crispness, samples were considered slightly crunchy (1.37 the 2.43), it was not observed by Carr & Tadini (2003), when evaluating the commercial French bread had a mean score of 6.8 and 6.5. For crumb softness, samples were considered soft by sensory panel (6.63 to 8.56). For moisture, the same author found values between 5.46 to 5.82, that were similar to those determined by this work.
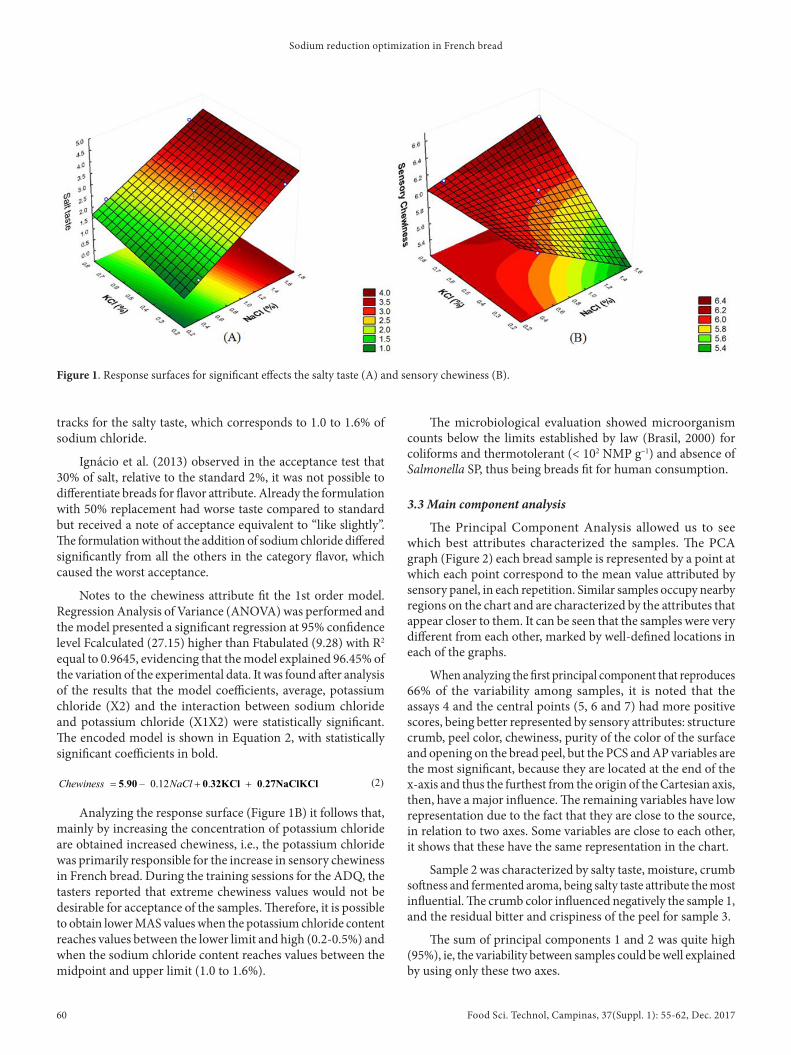
For the sensory response variable salty flavor was possible to establish meaningful models. . The data varied from 1.31 to 4.10 (Table 4). The statistical analysis indicated that the models were adequate because they have satisfactory values of the R2 for all the responses and model significance. Regression Analysis of Variance (ANDVA) was performed and the model presented a significant regression at 95% confidence level Fcalculated (16.74) higher than Ftabulated (9.28) with R2 equal to 0.9436, evidencing that the model explained 94.36% of the variation of the experimental data. It was found after analysis of the results that coefficient of sodium chloride model (X1) and the mean were statistically significant. The encoded model (Response = β0 + β1x1 + β2x2 + β3x1x2) is shown in Equation 1, with statistically significant coefficients in bold.
. . 0.20 – 0.11= + +2 72 1 11NaClSalty taste KCl NaClKCl (1)
Analyzing the response surface for saltiness (Figure 1A) it was seen that, mainly by increasing the concentration of the sodium chloride content, it is obtained a higher salty taste. Breads assays of 2 e 4 were considered more salty by sensory panel, the tests 5, 6 and 7 were considered intermediate salty flavor and tests 1 and 3 were considered the least salty; adopting these assays as to the sodium chloride content, it is obtained optimum
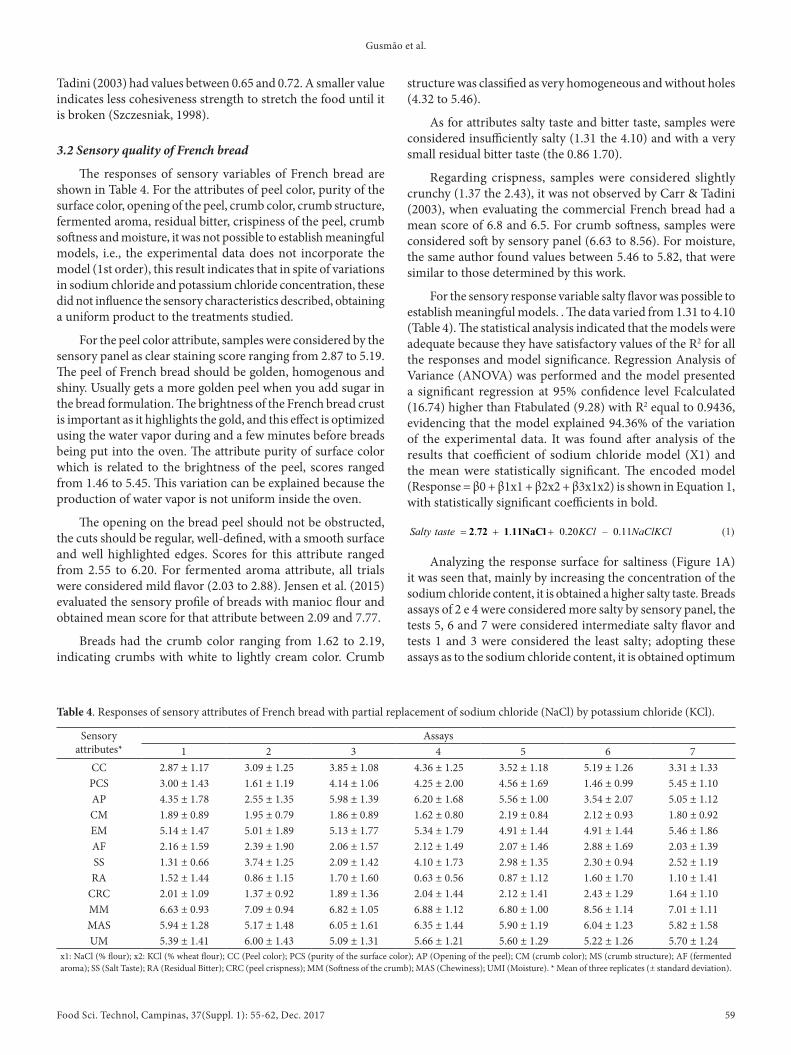
Table 4. Responses of sensory attributes of French bread with partial replacement of sodium chloride (NaCl) by potassium chloride (KCl).
Sensory attributes*
Assays1 2 3 4 5 6 7
CC 2.87 ± 1.17 3.09 ± 1.25 3.85 ± 1.08 4.36 ± 1.25 3.52 ± 1.18 5.19 ± 1.26 3.31 ± 1.33PCS 3.00 ± 1.43 1.61 ± 1.19 4.14 ± 1.06 4.25 ± 2.00 4.56 ± 1.69 1.46 ± 0.99 5.45 ± 1.10AP 4.35 ± 1.78 2.55 ± 1.35 5.98 ± 1.39 6.20 ± 1.68 5.56 ± 1.00 3.54 ± 2.07 5.05 ± 1.12CM 1.89 ± 0.89 1.95 ± 0.79 1.86 ± 0.89 1.62 ± 0.80 2.19 ± 0.84 2.12 ± 0.93 1.80 ± 0.92EM 5.14 ± 1.47 5.01 ± 1.89 5.13 ± 1.77 5.34 ± 1.79 4.91 ± 1.44 4.91 ± 1.44 5.46 ± 1.86AF 2.16 ± 1.59 2.39 ± 1.90 2.06 ± 1.57 2.12 ± 1.49 2.07 ± 1.46 2.88 ± 1.69 2.03 ± 1.39SS 1.31 ± 0.66 3.74 ± 1.25 2.09 ± 1.42 4.10 ± 1.73 2.98 ± 1.35 2.30 ± 0.94 2.52 ± 1.19RA 1.52 ± 1.44 0.86 ± 1.15 1.70 ± 1.60 0.63 ± 0.56 0.87 ± 1.12 1.60 ± 1.70 1.10 ± 1.41
CRC 2.01 ± 1.09 1.37 ± 0.92 1.89 ± 1.36 2.04 ± 1.44 2.12 ± 1.41 2.43 ± 1.29 1.64 ± 1.10MM 6.63 ± 0.93 7.09 ± 0.94 6.82 ± 1.05 6.88 ± 1.12 6.80 ± 1.00 8.56 ± 1.14 7.01 ± 1.11MAS 5.94 ± 1.28 5.17 ± 1.48 6.05 ± 1.61 6.35 ± 1.44 5.90 ± 1.19 6.04 ± 1.23 5.82 ± 1.58UM 5.39 ± 1.41 6.00 ± 1.43 5.09 ± 1.31 5.66 ± 1.21 5.60 ± 1.29 5.22 ± 1.26 5.70 ± 1.24
x1: NaCl (% flour); x2: KCl (% wheat flour); CC (Peel color); PCS (purity of the surface color); AP (Dpening of the peel); CM (crumb color); MS (crumb structure); AF (fermented aroma); SS (Salt Taste); RA (Residual Bitter); CRC (peel crispness); MM (Softness of the crumb); MAS (Chewiness); UMI (Moisture). * Mean of three replicates (± standard deviation).
Sodium reduction optimization in French bread
Food Sci. Technol, Campinas, 37(Suppl. 1): 55-62, Dec. 201760
tracks for the salty taste, which corresponds to 1.0 to 1.6% of sodium chloride.
Ignácio et al. (2013) observed in the acceptance test that 30% of salt, relative to the standard 2%, it was not possible to differentiate breads for flavor attribute. Already the formulation with 50% replacement had worse taste compared to standard but received a note of acceptance equivalent to “like slightly”. The formulation without the addition of sodium chloride differed significantly from all the others in the category flavor, which caused the worst acceptance.
Notes to the chewiness attribute fit the 1st order model. Regression Analysis of Variance (ANDVA) was performed and the model presented a significant regression at 95% confidence level Fcalculated (27.15) higher than Ftabulated (9.28) with R2 equal to 0.9645, evidencing that the model explained 96.45% of the variation of the experimental data. It was found after analysis of the results that the model coefficients, average, potassium chloride (X2) and the interaction between sodium chloride and potassium chloride (X1X2) were statistically significant. The encoded model is shown in Equation 2, with statistically significant coefficients in bold.
. – 0.12 . .= + +5 90 0 32KCl 0 27NaClKClChewiness NaCl (2)
Analyzing the response surface (Figure 1B) it follows that, mainly by increasing the concentration of potassium chloride are obtained increased chewiness, i.e., the potassium chloride was primarily responsible for the increase in sensory chewiness in French bread. During the training sessions for the ADQ, the tasters reported that extreme chewiness values would not be desirable for acceptance of the samples. Therefore, it is possible to obtain lower MAS values when the potassium chloride content reaches values between the lower limit and high (0.2-0.5%) and when the sodium chloride content reaches values between the midpoint and upper limit (1.0 to 1.6%).
The microbiological evaluation showed microorganism counts below the limits established by law (Brasil, 2000) for coliforms and thermotolerant (< 102 NMP g–1) and absence of Salmonella SP, thus being breads fit for human consumption.
3.3 Main component analysis
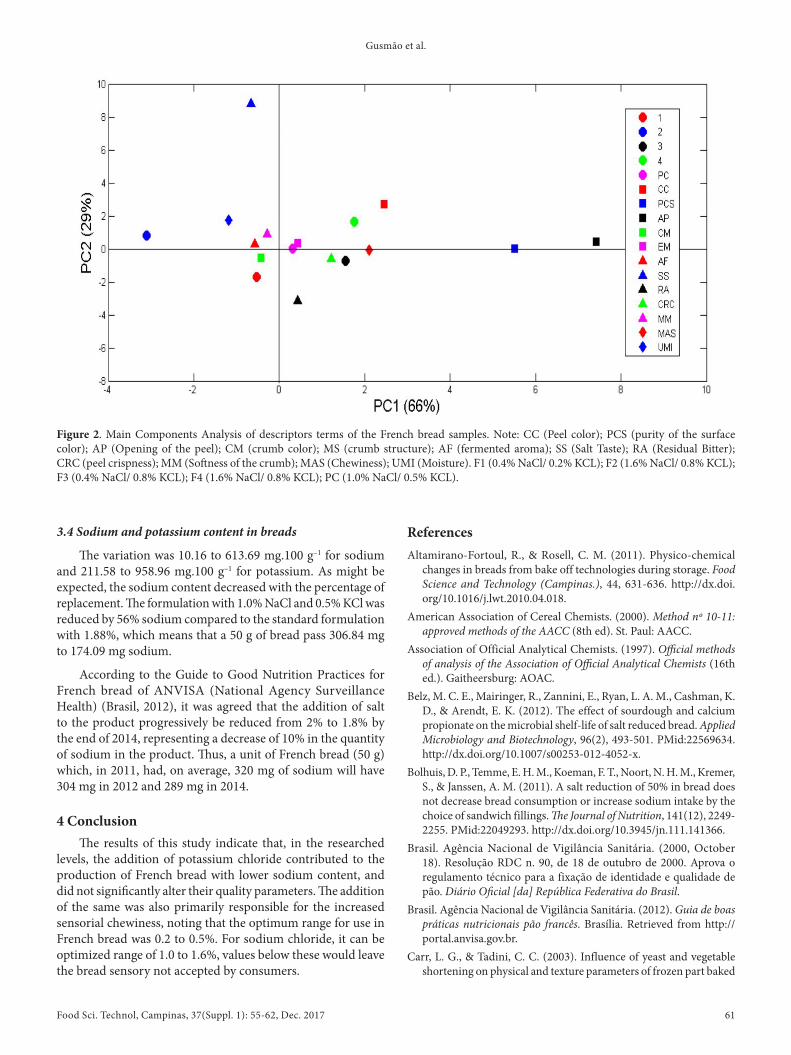
The Principal Component Analysis allowed us to see which best attributes characterized the samples. The PCA graph (Figure 2) each bread sample is represented by a point at which each point correspond to the mean value attributed by sensory panel, in each repetition. Similar samples occupy nearby regions on the chart and are characterized by the attributes that appear closer to them. It can be seen that the samples were very different from each other, marked by well-defined locations in each of the graphs.
When analyzing the first principal component that reproduces 66% of the variability among samples, it is noted that the assays 4 and the central points (5, 6 and 7) had more positive scores, being better represented by sensory attributes: structure crumb, peel color, chewiness, purity of the color of the surface and opening on the bread peel, but the PCS and AP variables are the most significant, because they are located at the end of the x-axis and thus the furthest from the origin of the Cartesian axis, then, have a major influence. The remaining variables have low representation due to the fact that they are close to the source, in relation to two axes. Some variables are close to each other, it shows that these have the same representation in the chart.
Sample 2 was characterized by salty taste, moisture, crumb softness and fermented aroma, being salty taste attribute the most influential. The crumb color influenced negatively the sample 1, and the residual bitter and crispiness of the peel for sample 3.
The sum of principal components 1 and 2 was quite high (95%), ie, the variability between samples could be well explained by using only these two axes.
Figure 1. Response surfaces for significant effects the salty taste (A) and sensory chewiness (B).
Gusmão et al.
Food Sci. Technol, Campinas, 37(Suppl. 1): 55-62, Dec. 2017 61
3.4 Sodium and potassium content in breads
The variation was 10.16 to 613.69 mg.100 g–1 for sodium and 211.58 to 958.96 mg.100 g–1 for potassium. As might be expected, the sodium content decreased with the percentage of replacement. The formulation with 1.0% NaCl and 0.5% KCl was reduced by 56% sodium compared to the standard formulation with 1.88%, which means that a 50 g of bread pass 306.84 mg to 174.09 mg sodium.
According to the Guide to Good Nutrition Practices for French bread of ANVISA (National Agency Surveillance Health) (Brasil, 2012), it was agreed that the addition of salt to the product progressively be reduced from 2% to 1.8% by the end of 2014, representing a decrease of 10% in the quantity of sodium in the product. Thus, a unit of French bread (50 g) which, in 2011, had, on average, 320 mg of sodium will have 304 mg in 2012 and 289 mg in 2014.
4 ConclusionThe results of this study indicate that, in the researched
levels, the addition of potassium chloride contributed to the production of French bread with lower sodium content, and did not significantly alter their quality parameters. The addition of the same was also primarily responsible for the increased sensorial chewiness, noting that the optimum range for use in French bread was 0.2 to 0.5%. For sodium chloride, it can be optimized range of 1.0 to 1.6%, values below these would leave the bread sensory not accepted by consumers.
ReferencesAltamirano-Fortoul, R., & Rosell, C. M. (2011). Physico-chemical
changes in breads from bake off technologies during storage. Food Science and Technology (Campinas.), 44, 631-636. http://dx.doi.org/10.1016/j.lwt.2010.04.018.
American Association of Cereal Chemists. (2000). Method nº 10-11: approved methods of the AACC (8th ed). St. Paul: AACC.
Association of Dfficial Analytical Chemists. (1997). Official methods of analysis of the Association of Official Analytical Chemists (16th ed.). Gaitheersburg: ADAC.
Belz, M. C. E., Mairinger, R., Zannini, E., Ryan, L. A. M., Cashman, K. D., & Arendt, E. K. (2012). The effect of sourdough and calcium propionate on the microbial shelf-life of salt reduced bread. Applied Microbiology and Biotechnology, 96(2), 493-501. PMid:22569634. http://dx.doi.org/10.1007/s00253-012-4052-x.
Bolhuis, D. P., Temme, E. H. M., Koeman, F. T., Noort, N. H. M., Kremer, S., & Janssen, A. M. (2011). A salt reduction of 50% in bread does not decrease bread consumption or increase sodium intake by the choice of sandwich fillings. The Journal of Nutrition, 141(12), 2249-2255. PMid:22049293. http://dx.doi.org/10.3945/jn.111.141366.
Brasil. Agência Nacional de Vigilância Sanitária. (2000, Dctober 18). Resolução RDC n. 90, de 18 de outubro de 2000. Aprova o regulamento técnico para a fixação de identidade e qualidade de pão. Diário Oficial [da] República Federativa do Brasil.
Brasil. Agência Nacional de Vigilância Sanitária. (2012). Guia de boas práticas nutricionais pão francês. Brasília. Retrieved from http://portal.anvisa.gov.br.
Carr, L. G., & Tadini, C. C. (2003). Influence of yeast and vegetable shortening on physical and texture parameters of frozen part baked
Figure 2. Main Components Analysis of descriptors terms of the French bread samples. Note: CC (Peel color); PCS (purity of the surface color); AP (Dpening of the peel); CM (crumb color); MS (crumb structure); AF (fermented aroma); SS (Salt Taste); RA (Residual Bitter); CRC (peel crispness); MM (Softness of the crumb); MAS (Chewiness); UMI (Moisture). F1 (0.4% NaCl/ 0.2% KCL); F2 (1.6% NaCl/ 0.8% KCL); F3 (0.4% NaCl/ 0.8% KCL); F4 (1.6% NaCl/ 0.8% KCL); PC (1.0% NaCl/ 0.5% KCL).
Sodium reduction optimization in French bread
Food Sci. Technol, Campinas, 37(Suppl. 1): 55-62, Dec. 201762
Quaglia, G. (1991). Ciência e tecnologia de la panificacíon (485 p.). Zaragoga: Acríbia.
Quílez, J., Ruiz, J. A., & Romero, M. P. (2006). Ralationships between sensory flavor evaluation and volatile and nonvolatile compounds in commercial wheat bread type baguette. Journal of Food Science, 71(6), 423-427. http://dx.doi.org/10.1111/j.1750-3841.2006.00053.x.
Robert, H., Gabriel, V., Lefebvre, D., Rabier, P., Vayssier, Y., & Fontagné-Faucher, C. (2006). Study of the Lactobacillus plantarum and Leuconostoc starters during a complete wheat sourdough breadmaking process. Food Science and Technology (Campinas.), 39, 256-265. http://dx.doi.org/10.1016/j.lwt.2005.01.013.
Salgado, J. M., Rodrigues, B. S., Donado-Pestana, C. M., Dias, C. T. S., & Morzelle, M. C. (2011). Cupuassu (Theobroma grandiflorum) peel as potential source of dietary fiber and phytochemicals in whole-bread preparations. Plant Foods for Human Nutrition (Dordrecht, Netherlands), 66(4), 384-390. PMid:21948632. http://dx.doi.org/10.1007/s11130-011-0254-0.
Silva, M. E. M. P., Yonamine, G. E., & Mitsuiki, L. (2003). Development and evaluation of homemade french bread containing no salt. Brazilian Journal of Food Technology, 6(2), 229-236.
Sosa, M., Flores, A., Hough, G., Apro, N., Ferreyra, V., & Drbea, M. M. (2008). Dptimum Level of salt in french-type bread: influence of income status, salt level in daily bread consumption, and test location. Journal of Food Science, 73(8), 392-397. PMid:19019126. http://dx.doi.org/10.1111/j.1750-3841.2008.00898.x.
Statsoft. (2004). Statistica for windows. Tulsa. Retrieved from http://www.statsoft.com.br.
Stone, H., Sidel, J., Dliver, S., Woolsey, A., & Singleton, R. S. (2008). Sensory evaluation by quantitative descriptive analysis. Food Technology. http://dx.doi.org/10.1002/9780470385036.ch1c.
Sullivan, P., Arendt, E., & Gallagher, E. (2013). The increasing use of barley and barley by-products in the production of healthier baked goods. Trends in Food Science & Technology, 29(2), 124-134. http://dx.doi.org/10.1016/j.tifs.2012.10.005.
Szczesniak, A. S. (1998). Sensory texture profiling: historical and scientific perspectives. Food Technology, 52(8), 54-57.
World Health Drganization. (2007). Reducing salt intake in populations (Report of a WHD Forum and Technical Meeting). Geneva: WHD.
French bread. Food Science and Technology (Campinas.), 36(6), 609-614. http://dx.doi.org/10.1016/S0023-6438(03)00079-3.
Charlton, E. K., Mac Gregor, E., Vorster, H. N., Levitt, S. N., & Steyn, K. (2007). Partial replacement of NaCl can be achieved with potassium, magnesium and calcium salts in brown bread. International Journal of Food Sciences and Nutrition, 58(7), 508-521. PMid:17852502. http://dx.doi.org/10.1080/09637480701331148.
Dötsch, M., Busch, J., Batenburg, M., Liem, G., Tareilus, E., Mueller, R., & Meijer, G. (2009). Strategies to reduce sodium consumption: a food industry perspective. Critical Reviews in Food Science and Nutrition, 49(10), 841-851. PMid:19960392. http://dx.doi.org/10.1080/10408390903044297.
Food and Drug Administration. (2007). Salmonella. In Bacteriological analytical manual (chap. 5, pp. 1-21). Retrieved from http://www.fda.gov/downloads/food/ScienceResearch/LaboratoryMethods/BacteriologicalAnalyticalManualBAM/UCM244774.pdf.
Gallagher, E., Gormley, T. R., & Arendt, E. K. (2003). Crust and crumb characteristics of gluten free breads. Journal of Food Engineering, 56(2-3), 153-161. http://dx.doi.org/10.1016/S0260-8774(02)00244-3.
Ignácio, A. K. F., Rodrigues, J. T. D., Niizu, P. Y., Chang, Y. K., & Stell, C. J. (2013). Efeito da substituição de cloreto de sódio por cloreto de potássio em pão francês. Brazilian Journal of Food Technology, 16(1), 1-11. http://dx.doi.org/10.1590/S1981-67232013005000010.
Jensen, S., Skibsted, L. H., Kidmose, U., & Thybo, A. K. (2015). Addition of cassava flours in bread-making: sensory and textural evaluation. Food Science and Technology (Campinas.), 60(1), 292-299. http://dx.doi.org/10.1016/j.lwt.2014.08.037.
Lynch, E. J., Dal Bello, F., Sheeran, E. M., Cashman, K. D., & Arent, E. K. (2009). Fundamental studies on the reduction of salt on dough and bread characteristics. Food Research International, 42(7), 885-891. http://dx.doi.org/10.1016/j.foodres.2009.03.014.
Miller, R. A., & Hoseney, R. C. (2008). Role of salt in baking. Cereal Foods World, 53, 4-6.
Purlis, E. (2011). Bread baking: technological considerations based on process modeling and simulation. Journal of Food Engineering, 103(1), 92-102. http://dx.doi.org/10.1016/j.jfoodeng.2010.10.003.
Purlis, E., & Salvadori, V. D. (2009). Modelling the browning of bread during baking. Food Research International, 42(7), 865-870. http://dx.doi.org/10.1016/j.foodres.2009.03.007.