Embed Size (px)
Citation preview
MonitoringImpact4partpartpartpartpart
207Elements of Participatory Evaluation
Elements of Participatory Evaluation
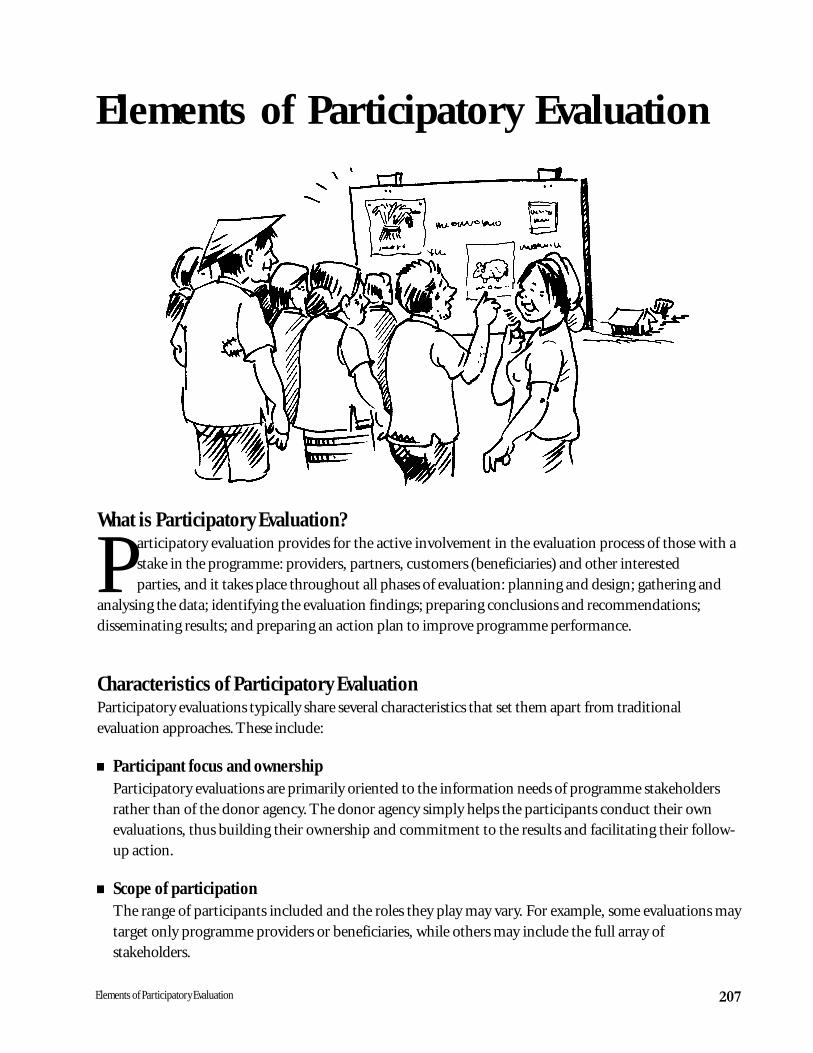
What is Participatory Evaluation?articipatory evaluation provides for the active involvement in the evaluation process of those with astake in the programme: providers, partners, customers (beneficiaries) and other interestedparties, and it takes place throughout all phases of evaluation: planning and design; gathering and
analysing the data; identifying the evaluation findings; preparing conclusions and recommendations;disseminating results; and preparing an action plan to improve programme performance.
Characteristics of Participatory EvaluationParticipatory evaluations typically share several characteristics that set them apart from traditionalevaluation approaches. These include:
n Participant focus and ownershipParticipatory evaluations are primarily oriented to the information needs of programme stakeholdersrather than of the donor agency. The donor agency simply helps the participants conduct their ownevaluations, thus building their ownership and commitment to the results and facilitating their follow-up action.
n Scope of participationThe range of participants included and the roles they play may vary. For example, some evaluations maytarget only programme providers or beneficiaries, while others may include the full array ofstakeholders.
P
208 ENHANCING OWNERSHIP AND SUSTAINABILITY: A RESOURCE BOOK ON PARTICIPATION
n Participant negotiationsParticipating groups meet to communicate and negotiate, to reacha consensus on evaluation findings, to solve problems and tomake plans to improve performance.
n Diversity of viewsViews of all participants are sought and recognised. Morepowerful stakeholders allow participation of the less powerful.
n Learning processThe process is a learning experience for participants. Emphasis ison identifying lessons learned that will help participants improveprogramme implementation, as well as on assessing whethertargets were achieved.
n Flexible designWhile some preliminary planning for the evaluation may benecessary, most of the design issues are decided in the participatoryprocess. Generally, evaluation questions and data collection andanalysis methods are determined by the participants and not byexternal evaluators.
n Empirical orientationGood participatory evaluations are based on empirical data.Typically, rapid appraisal techniques are used to determine whathappened and why.
Differences Between Conventional and Participatory Evaluation
Who
What
How
When
Why
External experts
Predetermined indicators of success, principally costand production outputs
Focus on �scientific objectivity�; distancing ofevaluators from other participants, uniform, complexprocedures; delayed, limited access to results
Usually upon completion of project/programme;sometimes also mid-term
Accountability, usually summative, to determine iffunding continues
Community members, project staff, facilitator
People identify their own indicators of success,which may include production outputs
Self-evaluation; simple methods adapted to localculture; open, immediate sharing of results throughlocal involvement in evaluation processes
More frequent, small-scale evaluations
To empower local people to initiate, control andtake corrective action
Source: Narayan-Parker, 1993: 12
Arguments forParticipatory Monitoringand Evaluation
n Enhanced participation, especiallyof beneficiaries, in monitoringand evaluation (M&E) helpsimprove understanding of thedevelopment process itself.
n Increased authenticity of M&Efindings that are locally relevant.
n Improvement of the sustainabilityof project activities by identifyingstrengths and weaknesses forbetter project management anddecision-making.
n Increasing local-level capacity inM&E, which in turn contributesto self-reliance in overall projectimplementation.
n Sharing of experience throughsystematic documentation andanalysis based on broad-based participation.
n Strengthenedaccountability to donors.
n More efficient allocationof resources.
Sources: Feuerstein,1986; Rugh, 1992;Sommers, 1993; CONCERN1996; Abbot and Guijit, 1997.
Conventional Participatory
209Elements of Participatory Evaluation
n Use of facilitatorsParticipants actually conduct the evaluation, not outside evaluators as is traditional. However, one ormore outside experts usually serves as facilitator with a supporting role as mentor, trainer, groupprocessor, negotiator and/or methodologist.
Why Conduct a Participatory Evaluation?Experience has shown that participatory evaluations improve programme performance. Listening to andlearning from programme beneficiaries, field staff and other stakeholders who know why a programme isor is not working is critical to making improvements. Also, the more these insiders are involved inidentifying evaluation questions and in gathering and analysing data, the more likely they are to use theinformation to improve performance. Participatory evaluation empowers programme providers andbeneficiaries to act on the knowledge gained.
Advantages of Participatory Evaluationn Examines relevant issues by involving key players in evaluation
design.n Promotes participants’ learning about the programme and its
performance and enhances their understanding of otherstakeholders’ points of view.
n Improves participants’ evaluation skills.n Enables the community to measure its own progress.n Mobilises stakeholders, enhances teamwork and builds a
shared commitment to act on evaluationrecommendations.
n Increases the likelihood that evaluation information will beused to improve performance.
n Gives people an opportunity to reflect not only about the project butalso about themselves as a community.
Disadvantages of Participatory Evaluationn May be viewed as “less objective” because it involves
programme staff, beneficiaries and other stakeholders withpossible vested interests.
n May be less useful in addressing highly technical aspectsof a project.
n May require considerable time and resources toidentify and involve a wide array of stakeholders.
n May be used as an opportunity for manipulation bysome stakeholders to further their own interests.
210 ENHANCING OWNERSHIP AND SUSTAINABILITY: A RESOURCE BOOK ON PARTICIPATION
Evaluation initiator
Purpose
Question-maker(s)
Methods
Evaluator�s versusfacilitator�s role
Impact/Outcome
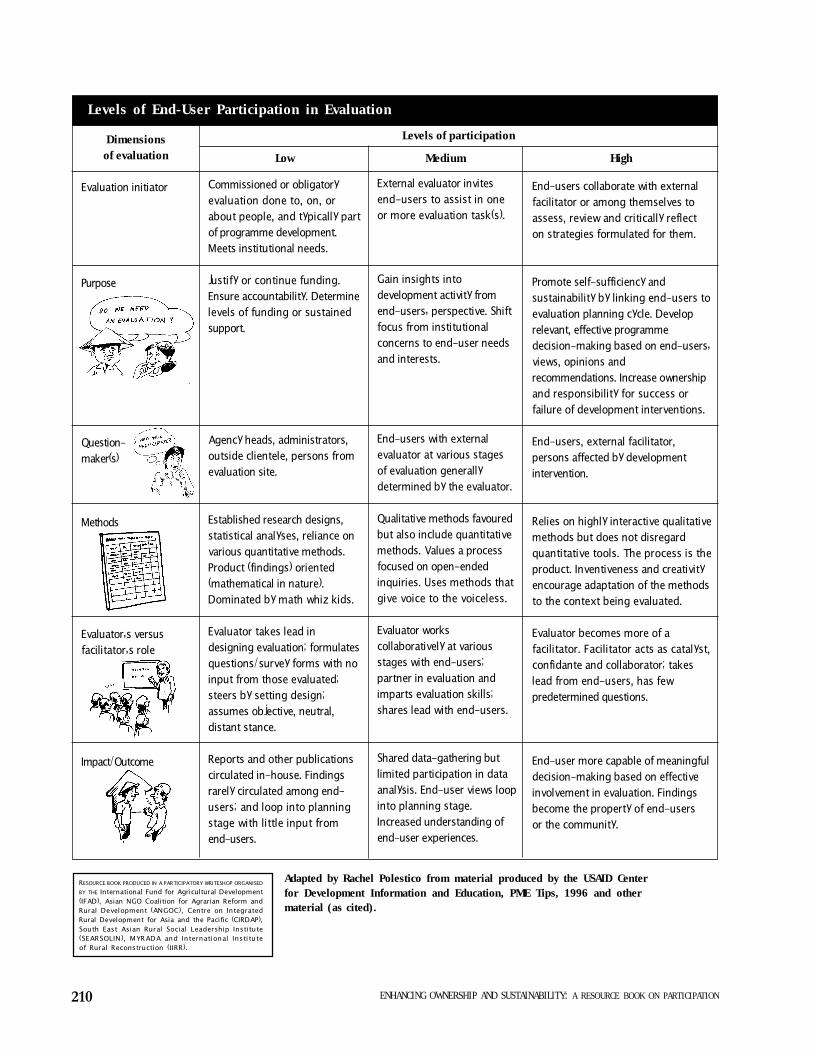
Levels of End-User Participation in Evaluation
Commissioned or obligatoryevaluation done to, on, orabout people, and typically partof programme development.Meets institutional needs.
Justify or continue funding.Ensure accountability. Determinelevels of funding or sustainedsupport.
Agency heads, administrators,outside clientele, persons fromevaluation site.
Established research designs,statistical analyses, reliance onvarious quantitative methods.Product (findings) oriented(mathematical in nature).Dominated by math whiz kids.
Evaluator takes lead indesigning evaluation; formulatesquestions/survey forms with noinput from those evaluated;steers by setting design;assumes objective, neutral,distant stance.
Reports and other publicationscirculated in-house. Findingsrarely circulated among end-users; and loop into planningstage with little input fromend-users.
External evaluator invitesend-users to assist in oneor more evaluation task(s).
Gain insights intodevelopment activity fromend-users� perspective. Shiftfocus from institutionalconcerns to end-user needsand interests.
End-users with externalevaluator at various stagesof evaluation generallydetermined by the evaluator.
Qualitative methods favouredbut also include quantitativemethods. Values a processfocused on open-endedinquiries. Uses methods thatgive voice to the voiceless.
Evaluator workscollaboratively at variousstages with end-users;partner in evaluation andimparts evaluation skills;shares lead with end-users.
Shared data-gathering butlimited participation in dataanalysis. End-user views loopinto planning stage.Increased understanding ofend-user experiences.
End-users collaborate with externalfacilitator or among themselves toassess, review and critically reflecton strategies formulated for them.
Promote self-sufficiency andsustainability by linking end-users toevaluation planning cycle. Developrelevant, effective programmedecision-making based on end-users�views, opinions andrecommendations. Increase ownershipand responsibility for success orfailure of development interventions.
End-users, external facilitator,persons affected by developmentintervention.
Relies on highly interactive qualitativemethods but does not disregardquantitative tools. The process is theproduct. Inventiveness and creativityencourage adaptation of the methodsto the context being evaluated.
Evaluator becomes more of afacilitator. Facilitator acts as catalyst,confidante and collaborator; takeslead from end-users, has fewpredetermined questions.
End-user more capable of meaningfuldecision-making based on effectiveinvolvement in evaluation. Findingsbecome the property of end-usersor the community.
Levels of participationDimensionsof evaluation Low Medium High
Adapted by Rachel Polestico from material produced by the USAID Centerfor Development Information and Education, PME Tips, 1996 and othermaterial (as cited).
RESOURCE BOOK PRODUCED IN A PARTICIPATORY WRITESHOP ORGANISED
BY THE International Fund for Agricultural Development(IFAD), Asian NGO Coalition for Agrarian Reform andRural Development (ANGOC), Centre on IntegratedRural Development for Asia and the Pacific (CIRDAP),South East Asian Rural Social Leadership Institute(SEARSOLIN), MYRADA and International Instituteof Rural Reconstruction (IIRR).

211Systematisation: Documentation and Sharing of Project Experiences and Lessons
Systematisation: Documentation andSharing of Project Experiencesand Lessons
ystematisation is a methodology which facilitates the on-goingdescription, analysis and documentation of the processes andresults of a development project in a participatory way.
New knowledge is generated through a systematic learning process,which is then fed back and used to make decisions about actions tobe implemented to improve project performance. The lessons learnedare shared with others.
Objectives of SystematisationThere are six related objectives of systematisation. Each objective,while important in and of itself, is also a step toward achieving thenext objective.
1. Preserve project information through documentationIn recent years, development workers and project beneficiarieshave expressed the need to describe, analyse and document their
S Systematisation is...
n a continuous processn a comprehensive processn a participatory exercisen a planning tooln a monitoring and
evaluation tooln a problem-solving tool
Systematisation is not...
n a one-time evaluationn an external evaluationn an impact evaluationn a simple descriptive
exercisen a mere documentation
212 ENHANCING OWNERSHIP AND SUSTAINABILITY: A RESOURCE BOOK ON PARTICIPATION
accumulated development experiences. In their daily work, these people often reflect on howdevelopment projects are planned and implemented, as well as on their impact and how they can beimproved. Such informal lessons are rarely documented, so the experience and knowledge gained is lostover time. The systematisation process facilitates the documentation of these experiences so they can beused for analysis and learning in an organised and coherent manner. The information also serves as abasis for writing reports, articles, papers and training materials.
2. Continuously improve project performance and resultsOn-going reflection and analysis enable organisations to learn from their successes and failures, as wellas from the different factors that hinder or facilitate project performance. The lessons learned throughthis process are fed back into the project to improve its performance which, in turn, will contribute toachieving better results and impact.
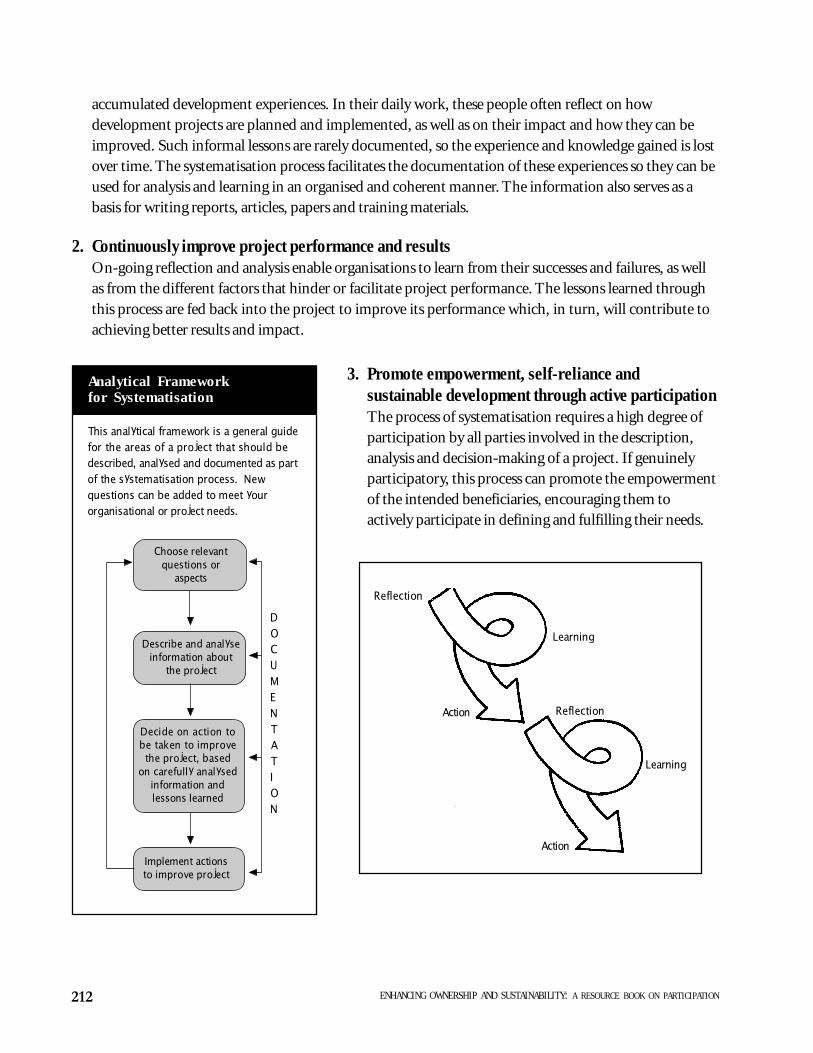
Analytical Frameworkfor Systematisation
This analytical framework is a general guidefor the areas of a project that should bedescribed, analysed and documented as partof the systematisation process. Newquestions can be added to meet yourorganisational or project needs.
Describe and analyseinformation about
the project
Decide on action tobe taken to improvethe project, based
on carefully analysedinformation andlessons learned
Implement actionsto improve project
Choose relevantquestions or
aspects
DOCUMENTATION
Learning
Reflection
Learning
Action
Action
Reflection
3. Promote empowerment, self-reliance andsustainable development through active participationThe process of systematisation requires a high degree ofparticipation by all parties involved in the description,analysis and decision-making of a project. If genuinelyparticipatory, this process can promote the empowermentof the intended beneficiaries, encouraging them toactively participate in defining and fulfilling their needs.
213Systematisation: Documentation and Sharing of Project Experiences and Lessons
4. Contribute to mutual understanding and cooperation between communities and developmentorganisationsBecause systematisation is a participatory process, it facilitates reaching a common understandingbetween community members and the development organisation staff about the nature of communityproblems and the actions to be taken to solve them. On-going dialogue and partnership in the processof reflection, planning, implementation and evaluation of development activities is essential.
5. Enhance organisational capacity through development of skillsSystematisation helps participants to develop their ability to plan and implement activities, learn andmanage resources efficiently. It also facilitates common understanding of a project by its staff. Thisprocess also allows organisations to develop skills for networking with other organisations (NGOs,GROs, GA, donors), thereby promoting cooperation and sharing of knowledge.
6. Strengthen organisations through the sharing of lessons learnedSharing lessons learned is important for organisations to play a meaningful role in society. Sharingknowledge and experiences with other organisations saves time and resources as it will make them lesslikely to make similar mistakes. In this way, systematisation facilitates institutional learning, commonproblem-solving, capacity-building and networking. If information is shared with donor agencies, itgives them a better idea of the needs of various organisations and enables them to allocate resourcesmore effectively. Sharing of lessons may be done through workshops, conferences, training courses,publications and formal or informal networks.
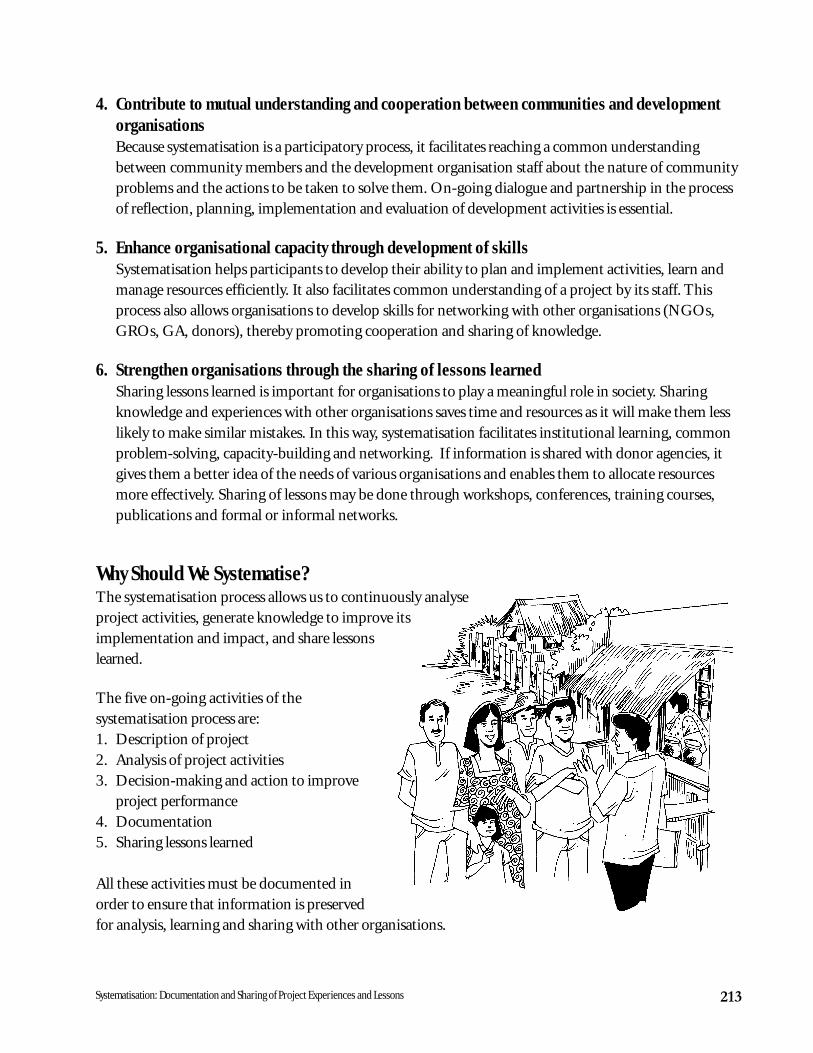
Why Should We Systematise?The systematisation process allows us to continuously analyseproject activities, generate knowledge to improve itsimplementation and impact, and share lessonslearned.
The five on-going activities of thesystematisation process are:1. Description of project2. Analysis of project activities3. Decision-making and action to improve
project performance4. Documentation5. Sharing lessons learned
All these activities must be documented inorder to ensure that information is preservedfor analysis, learning and sharing with other organisations.
214 ENHANCING OWNERSHIP AND SUSTAINABILITY: A RESOURCE BOOK ON PARTICIPATION
Who Can Participate in theSystematisation Process?
Anyone who is involved in the designand implementation of a developmentproject can participate in thesystematisation process.
This can include:n Project participantsn Community leadersn Development workersn Facilitatorsn Technical staffn Social workersn Educatorsn Researchers and evaluatorsn Government officialsn Donors
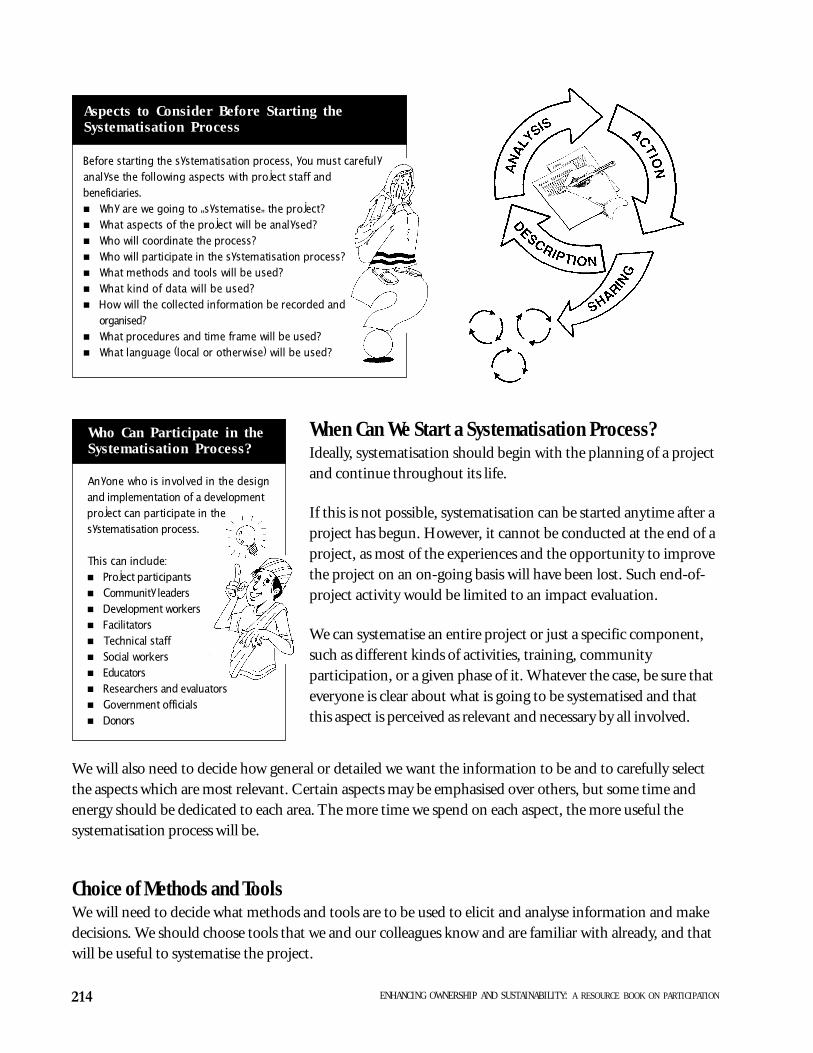
Aspects to Consider Before Starting theSystematisation Process
Before starting the systematisation process, you must carefulyanalyse the following aspects with project staff andbeneficiaries.n Why are we going to �systematise� the project?n What aspects of the project will be analysed?n Who will coordinate the process?n Who will participate in the systematisation process?n What methods and tools will be used?n What kind of data will be used?n How will the collected information be recorded and
organised?n What procedures and time frame will be used?n What language (local or otherwise) will be used?
When Can We Start a Systematisation Process?Ideally, systematisation should begin with the planning of a projectand continue throughout its life.
If this is not possible, systematisation can be started anytime after aproject has begun. However, it cannot be conducted at the end of aproject, as most of the experiences and the opportunity to improvethe project on an on-going basis will have been lost. Such end-of-project activity would be limited to an impact evaluation.
We can systematise an entire project or just a specific component,such as different kinds of activities, training, communityparticipation, or a given phase of it. Whatever the case, be sure thateveryone is clear about what is going to be systematised and thatthis aspect is perceived as relevant and necessary by all involved.
We will also need to decide how general or detailed we want the information to be and to carefully selectthe aspects which are most relevant. Certain aspects may be emphasised over others, but some time andenergy should be dedicated to each area. The more time we spend on each aspect, the more useful thesystematisation process will be.
Choice of Methods and ToolsWe will need to decide what methods and tools are to be used to elicit and analyse information and makedecisions. We should choose tools that we and our colleagues know and are familiar with already, and thatwill be useful to systematise the project.
215Systematisation: Documentation and Sharing of Project Experiences and Lessons
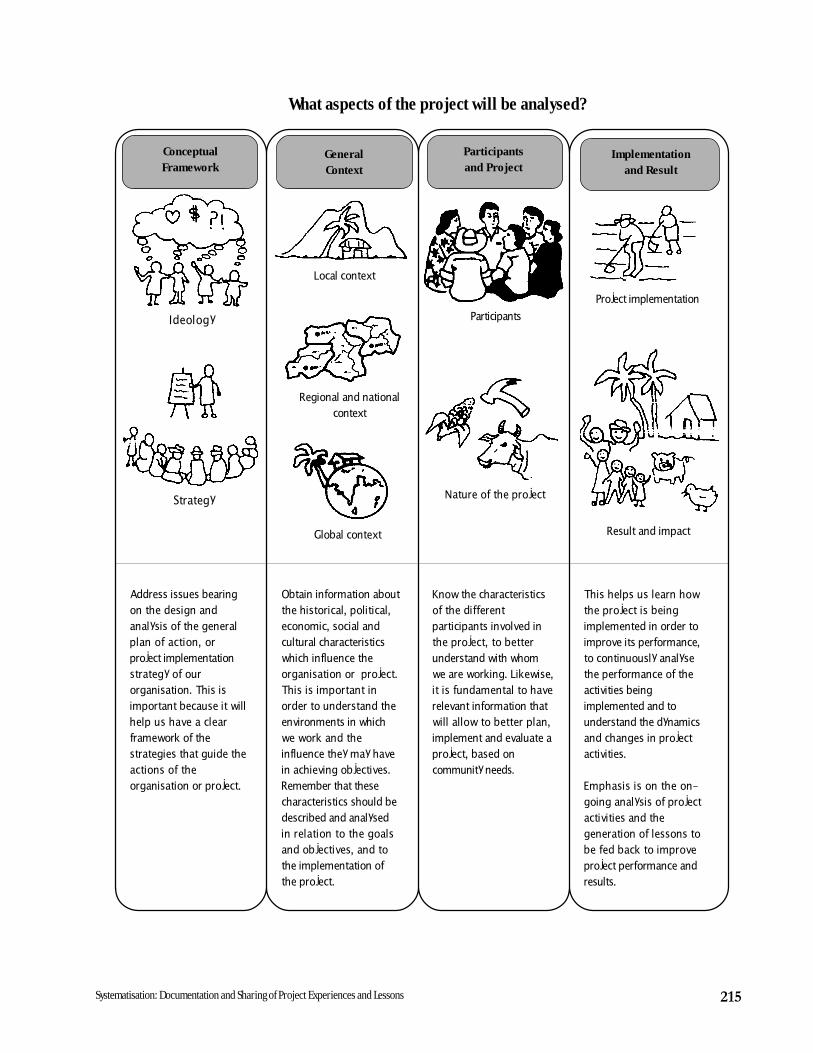
Participantsand Project
Implementationand Result
Ideology
Strategy
Global context
Regional and nationalcontext
Local context
Participants
Nature of the project
Result and impact
Project implementation
What aspects of the project will be analysed?
Address issues bearingon the design andanalysis of the generalplan of action, orproject implementationstrategy of ourorganisation. This isimportant because it willhelp us have a clearframework of thestrategies that guide theactions of theorganisation or project.
Obtain information aboutthe historical, political,economic, social andcultural characteristicswhich influence theorganisation or project.This is important inorder to understand theenvironments in whichwe work and theinfluence they may havein achieving objectives.Remember that thesecharacteristics should bedescribed and analysedin relation to the goalsand objectives, and tothe implementation ofthe project.
Know the characteristicsof the differentparticipants involved inthe project, to betterunderstand with whomwe are working. Likewise,it is fundamental to haverelevant information thatwill allow to better plan,implement and evaluate aproject, based oncommunity needs.
This helps us learn howthe project is beingimplemented in order toimprove its performance,to continuously analysethe performance of theactivities beingimplemented and tounderstand the dynamicsand changes in projectactivities.
Emphasis is on the on-going analysis of projectactivities and thegeneration of lessons tobe fed back to improveproject performance andresults.
ConceptualFramework
GeneralContext
216 ENHANCING OWNERSHIP AND SUSTAINABILITY: A RESOURCE BOOK ON PARTICIPATION
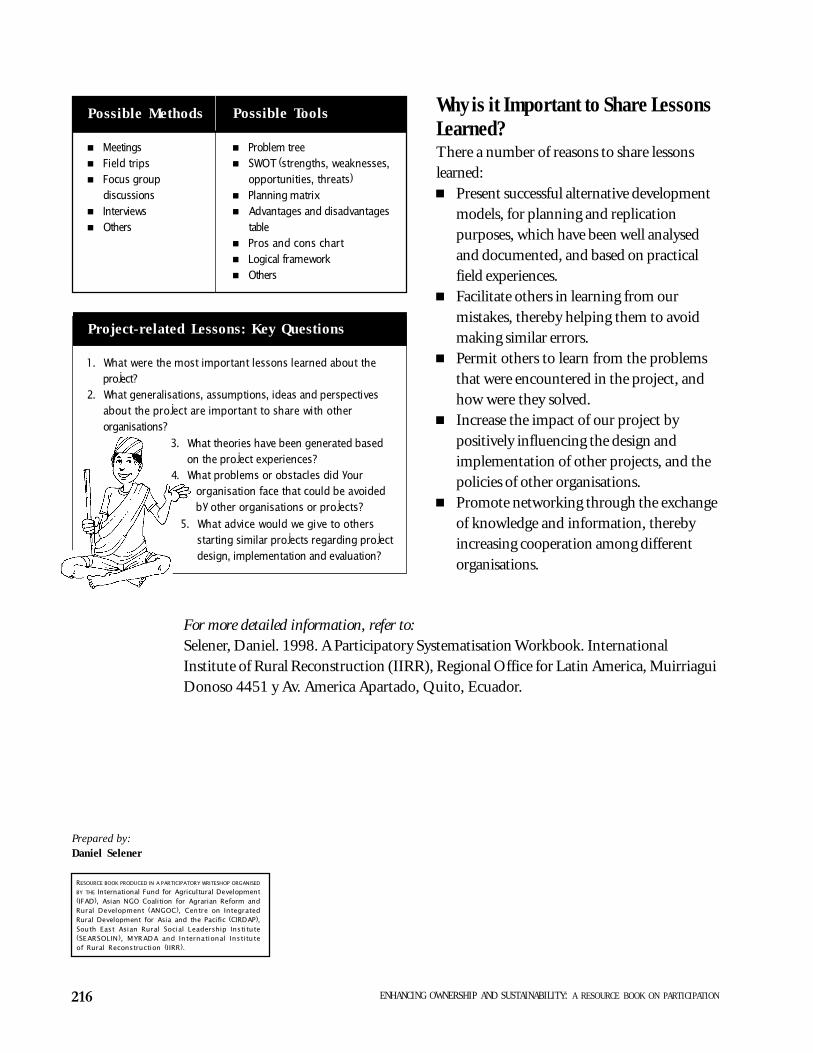
Why is it Important to Share LessonsLearned?There a number of reasons to share lessonslearned:n Present successful alternative development
models, for planning and replicationpurposes, which have been well analysedand documented, and based on practicalfield experiences.
n Facilitate others in learning from ourmistakes, thereby helping them to avoidmaking similar errors.
n Permit others to learn from the problemsthat were encountered in the project, andhow were they solved.
n Increase the impact of our project bypositively influencing the design andimplementation of other projects, and thepolicies of other organisations.
n Promote networking through the exchangeof knowledge and information, therebyincreasing cooperation among differentorganisations.
Project-related Lessons: Key Questions
1. What were the most important lessons learned about theproject?
2. What generalisations, assumptions, ideas and perspectivesabout the project are important to share with otherorganisations?
Possible Methods
n Meetingsn Field tripsn Focus group
discussionsn Interviewsn Others
Possible Tools
n Problem treen SWOT (strengths, weaknesses,
opportunities, threats)n Planning matrixn Advantages and disadvantages
tablen Pros and cons chartn Logical frameworkn Others
Prepared by:Daniel Selener
3. What theories have been generated basedon the project experiences?
4. What problems or obstacles did yourorganisation face that could be avoidedby other organisations or projects?
5. What advice would we give to othersstarting similar projects regarding projectdesign, implementation and evaluation?
For more detailed information, refer to:Selener, Daniel. 1998. A Participatory Systematisation Workbook. InternationalInstitute of Rural Reconstruction (IIRR), Regional Office for Latin America, MuirriaguiDonoso 4451 y Av. America Apartado, Quito, Ecuador.
RESOURCE BOOK PRODUCED IN A PARTICIPATORY WRITESHOP ORGANISED
BY THE International Fund for Agricultural Development(IFAD), Asian NGO Coalition for Agrarian Reform andRural Development (ANGOC), Centre on IntegratedRural Development for Asia and the Pacific (CIRDAP),South East Asian Rural Social Leadership Institute(SEARSOLIN), MYRADA and International Instituteof Rural Reconstruction (IIRR).
217Innovative Experiences in the Use of Participatory Monitoring Tools
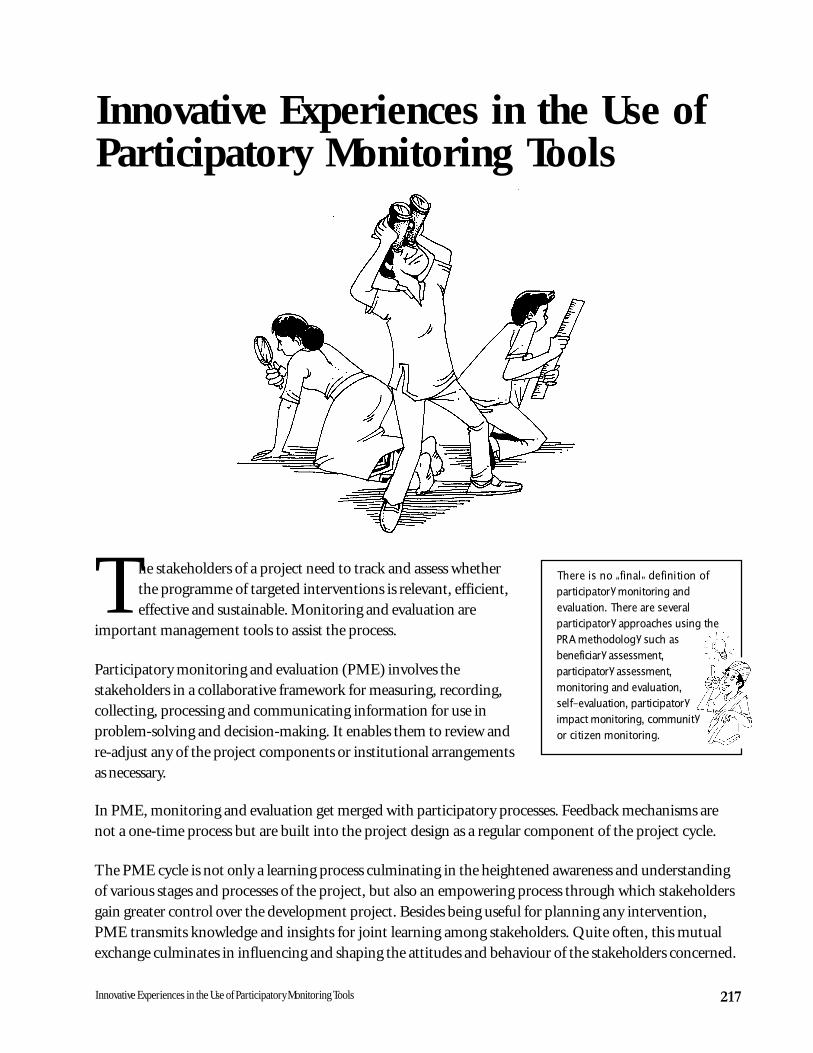
Innovative Experiences in the Use ofParticipatory Monitoring Tools
he stakeholders of a project need to track and assess whetherthe programme of targeted interventions is relevant, efficient,effective and sustainable. Monitoring and evaluation are
important management tools to assist the process.
Participatory monitoring and evaluation (PME) involves thestakeholders in a collaborative framework for measuring, recording,collecting, processing and communicating information for use inproblem-solving and decision-making. It enables them to review andre-adjust any of the project components or institutional arrangementsas necessary.
T
In PME, monitoring and evaluation get merged with participatory processes. Feedback mechanisms arenot a one-time process but are built into the project design as a regular component of the project cycle.
The PME cycle is not only a learning process culminating in the heightened awareness and understandingof various stages and processes of the project, but also an empowering process through which stakeholdersgain greater control over the development project. Besides being useful for planning any intervention,PME transmits knowledge and insights for joint learning among stakeholders. Quite often, this mutualexchange culminates in influencing and shaping the attitudes and behaviour of the stakeholders concerned.
There is no �final� definition ofparticipatory monitoring andevaluation. There are severalparticipatory approaches using thePRA methodology such asbeneficiary assessment,participatory assessment,monitoring and evaluation,self-evaluation, participatoryimpact monitoring, communityor citizen monitoring.
218 ENHANCING OWNERSHIP AND SUSTAINABILITY: A RESOURCE BOOK ON PARTICIPATION
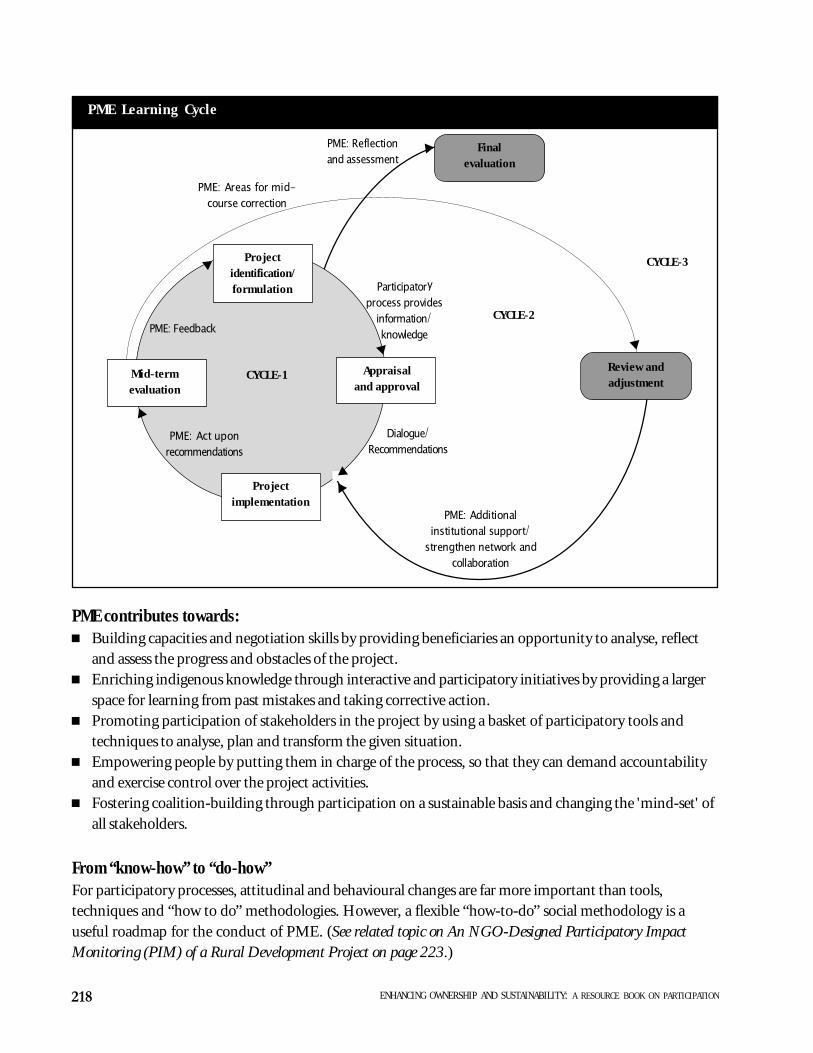
PME Learning Cycle
PME contributes towards:n Building capacities and negotiation skills by providing beneficiaries an opportunity to analyse, reflect
and assess the progress and obstacles of the project.n Enriching indigenous knowledge through interactive and participatory initiatives by providing a larger
space for learning from past mistakes and taking corrective action.n Promoting participation of stakeholders in the project by using a basket of participatory tools and
techniques to analyse, plan and transform the given situation.n Empowering people by putting them in charge of the process, so that they can demand accountability
and exercise control over the project activities.n Fostering coalition-building through participation on a sustainable basis and changing the 'mind-set' of
all stakeholders.
Projectimplementation
Mid-termevaluation
Appraisaland approval
Projectidentification/formulation
PME: Areas for mid-course correction
PME: Feedback
PME: Act uponrecommendations
Dialogue/Recommendations
Participatoryprocess provides
information/knowledge
PME: Additionalinstitutional support/
strengthen network andcollaboration
PME: Reflectionand assessment
Review andadjustment
Finalevaluation
�
�
�
�
�
�
�
CYCLE-2
CYCLE-1
CYCLE-3
From “know-how” to “do-how”For participatory processes, attitudinal and behavioural changes are far more important than tools,techniques and “how to do” methodologies. However, a flexible “how-to-do” social methodology is auseful roadmap for the conduct of PME. (See related topic on An NGO-Designed Participatory ImpactMonitoring (PIM) of a Rural Development Project on page 223.)
219Innovative Experiences in the Use of Participatory Monitoring Tools
The Self-Monitoring Chart for SHGs
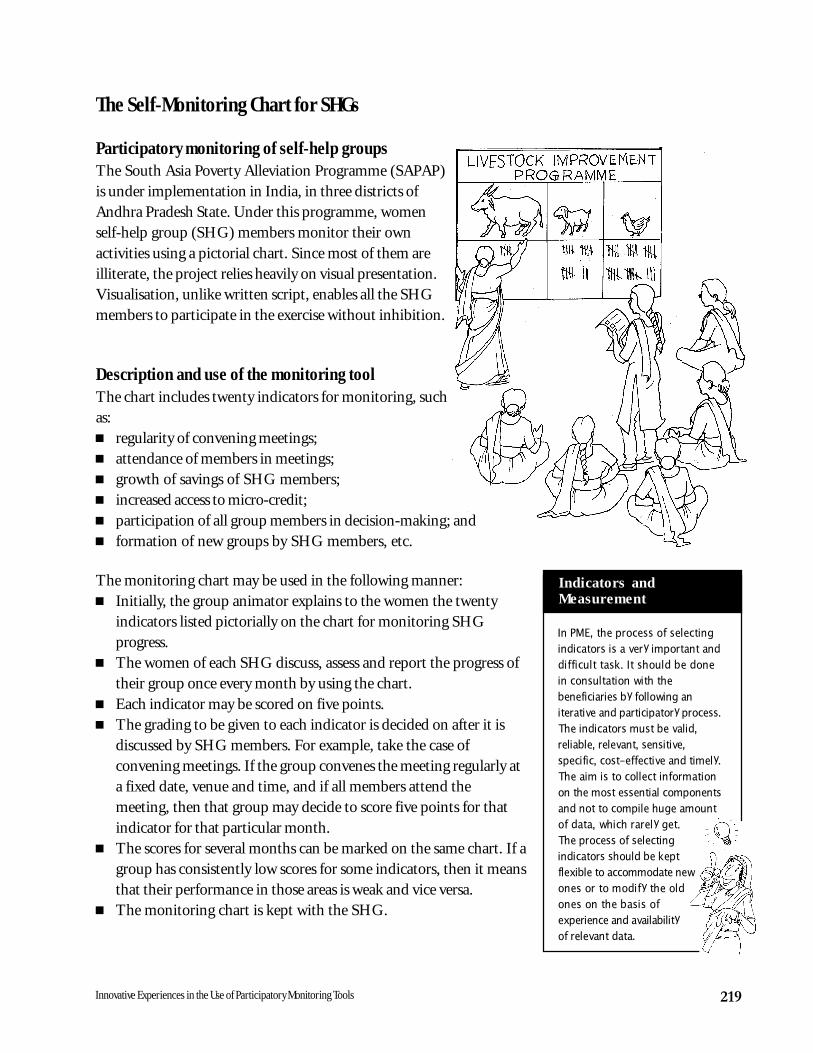
Participatory monitoring of self-help groupsThe South Asia Poverty Alleviation Programme (SAPAP)is under implementation in India, in three districts ofAndhra Pradesh State. Under this programme, womenself-help group (SHG) members monitor their ownactivities using a pictorial chart. Since most of them areilliterate, the project relies heavily on visual presentation.Visualisation, unlike written script, enables all the SHGmembers to participate in the exercise without inhibition.
Description and use of the monitoring toolThe chart includes twenty indicators for monitoring, suchas:n regularity of convening meetings;n attendance of members in meetings;n growth of savings of SHG members;n increased access to micro-credit;n participation of all group members in decision-making; andn formation of new groups by SHG members, etc.
The monitoring chart may be used in the following manner:n Initially, the group animator explains to the women the twenty
indicators listed pictorially on the chart for monitoring SHGprogress.
n The women of each SHG discuss, assess and report the progress oftheir group once every month by using the chart.
n Each indicator may be scored on five points.n The grading to be given to each indicator is decided on after it is
discussed by SHG members. For example, take the case ofconvening meetings. If the group convenes the meeting regularly ata fixed date, venue and time, and if all members attend themeeting, then that group may decide to score five points for thatindicator for that particular month.
n The scores for several months can be marked on the same chart. If agroup has consistently low scores for some indicators, then it meansthat their performance in those areas is weak and vice versa.
n The monitoring chart is kept with the SHG.
Indicators andMeasurement
In PME, the process of selectingindicators is a very important anddifficult task. It should be donein consultation with thebeneficiaries by following aniterative and participatory process.The indicators must be valid,reliable, relevant, sensitive,specific, cost-effective and timely.The aim is to collect informationon the most essential componentsand not to compile huge amountof data, which rarely get.The process of selectingindicators should be keptflexible to accommodate newones or to modify the oldones on the basis ofexperience and availabilityof relevant data.
220 ENHANCING OWNERSHIP AND SUSTAINABILITY: A RESOURCE BOOK ON PARTICIPATION
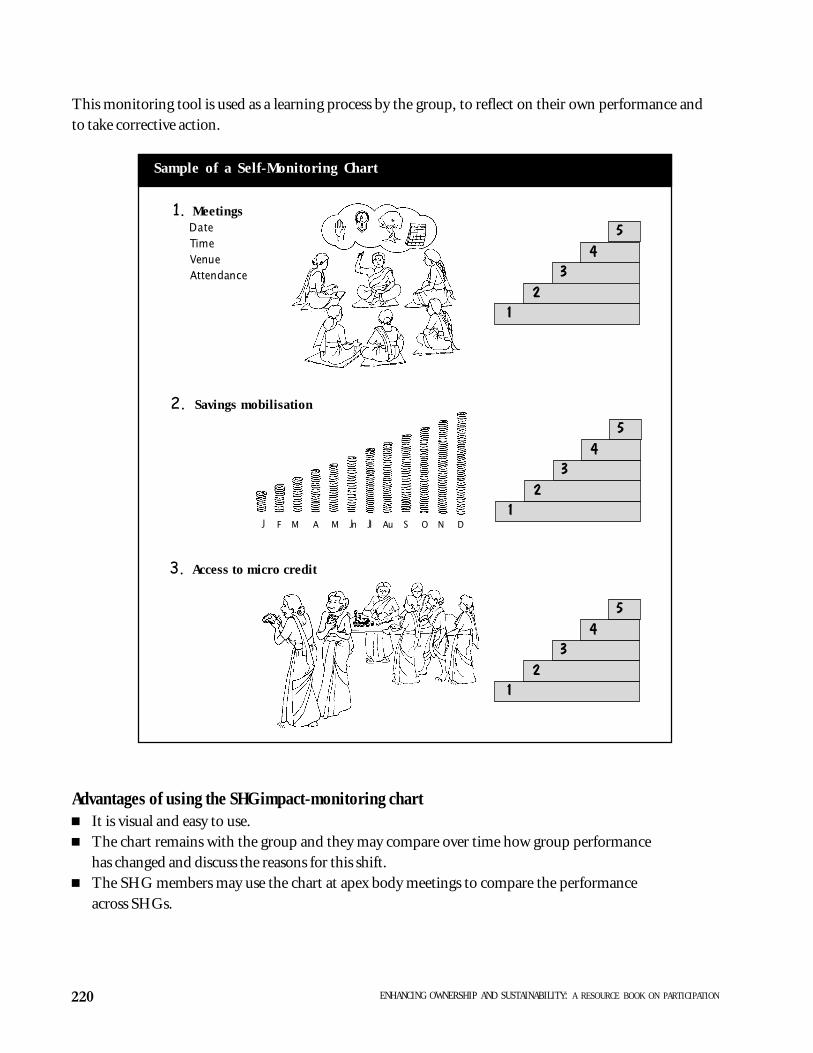
This monitoring tool is used as a learning process by the group, to reflect on their own performance andto take corrective action.
Sample of a Self-Monitoring Chart
1. Meetings Date Time Venue Attendance
2. Savings mobilisation
3. Access to micro credit
12
3
54
12
3
54
12
3
54
J F M A M Jn Jl Au S O N D
Advantages of using the SHG impact-monitoring chartn It is visual and easy to use.n The chart remains with the group and they may compare over time how group performance
has changed and discuss the reasons for this shift.n The SHG members may use the chart at apex body meetings to compare the performance
across SHGs.
221Innovative Experiences in the Use of Participatory Monitoring Tools
The Ladder Approach to Monitoring Decision-Making Processes in the FamilyThe Participatory Resource Management Project (PRMP) in Tuyen Quang, Vietnam, pursues participatoryprocesses in all stages of the project cycle. The following is an illustration of how PME tools have beenused by the project to monitor decision-making dynamics involving men and women in the family.
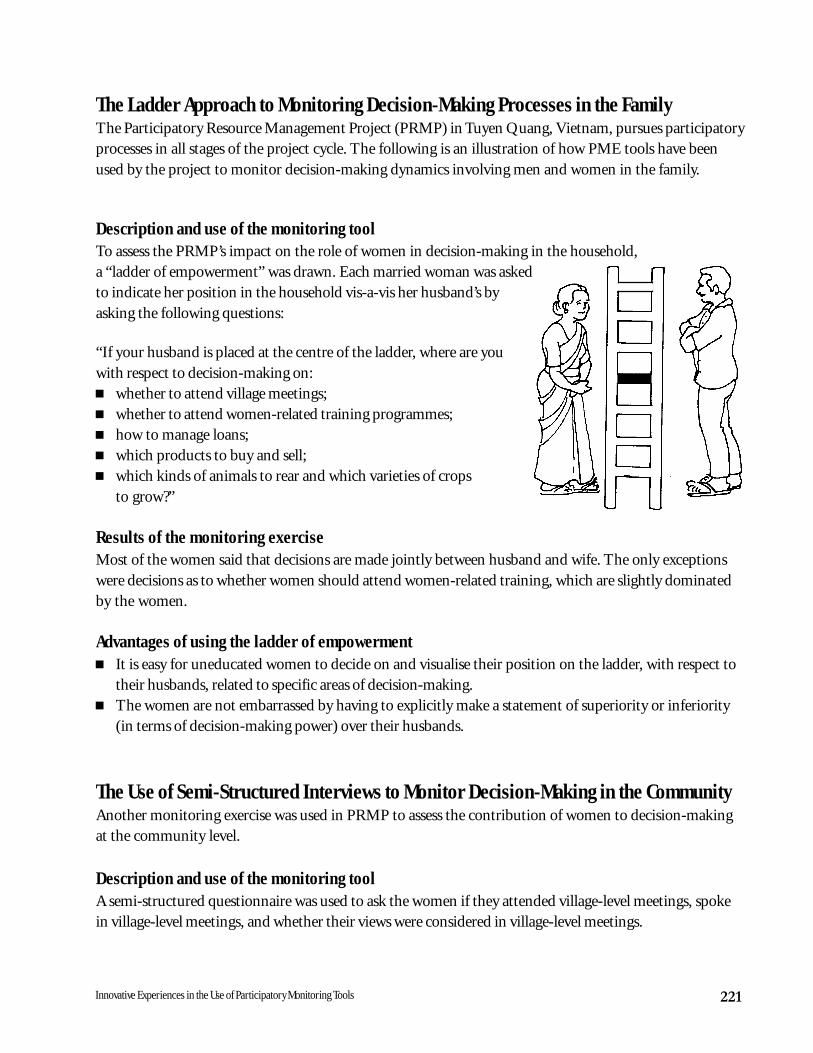
Description and use of the monitoring toolTo assess the PRMP’s impact on the role of women in decision-making in the household,a “ladder of empowerment” was drawn. Each married woman was askedto indicate her position in the household vis-a-vis her husband’s byasking the following questions:
“If your husband is placed at the centre of the ladder, where are youwith respect to decision-making on:n whether to attend village meetings;n whether to attend women-related training programmes;n how to manage loans;n which products to buy and sell;n which kinds of animals to rear and which varieties of crops
to grow?”
Results of the monitoring exerciseMost of the women said that decisions are made jointly between husband and wife. The only exceptionswere decisions as to whether women should attend women-related training, which are slightly dominatedby the women.
Advantages of using the ladder of empowermentn It is easy for uneducated women to decide on and visualise their position on the ladder, with respect to
their husbands, related to specific areas of decision-making.n The women are not embarrassed by having to explicitly make a statement of superiority or inferiority
(in terms of decision-making power) over their husbands.
The Use of Semi-Structured Interviews to Monitor Decision-Making in the CommunityAnother monitoring exercise was used in PRMP to assess the contribution of women to decision-makingat the community level.
Description and use of the monitoring toolA semi-structured questionnaire was used to ask the women if they attended village-level meetings, spokein village-level meetings, and whether their views were considered in village-level meetings.
222 ENHANCING OWNERSHIP AND SUSTAINABILITY: A RESOURCE BOOK ON PARTICIPATION
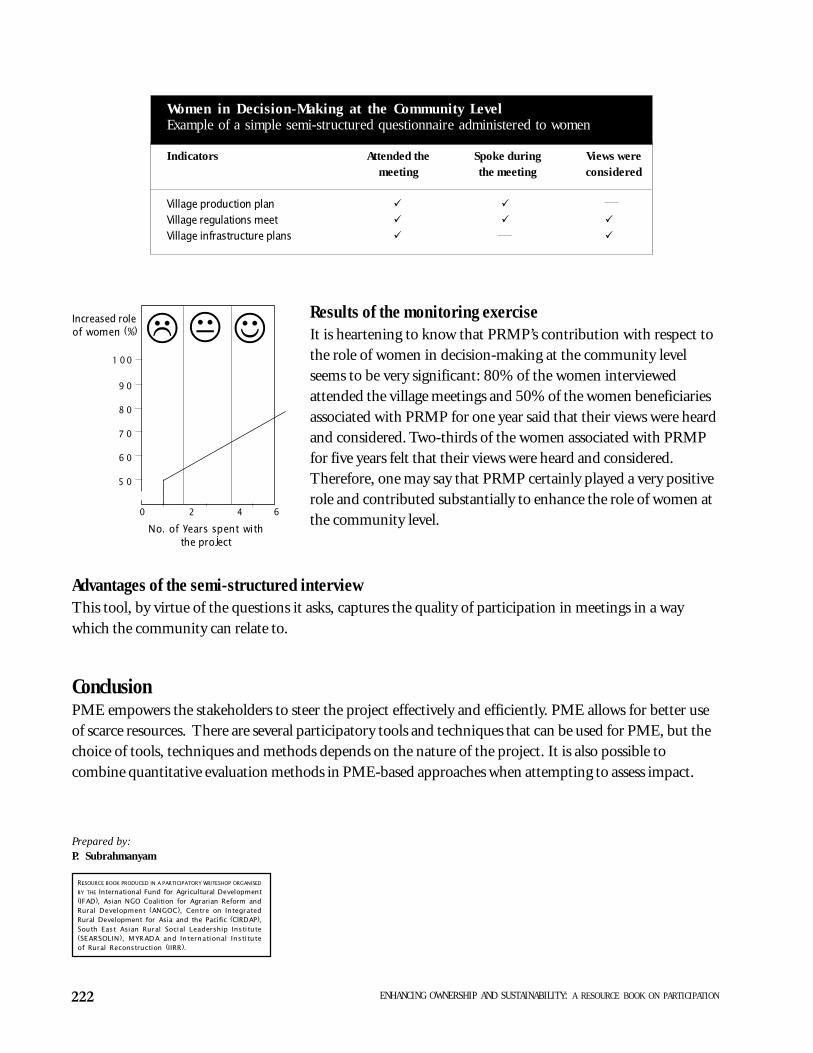
Results of the monitoring exerciseIt is heartening to know that PRMP’s contribution with respect tothe role of women in decision-making at the community levelseems to be very significant: 80% of the women interviewedattended the village meetings and 50% of the women beneficiariesassociated with PRMP for one year said that their views were heardand considered. Two-thirds of the women associated with PRMPfor five years felt that their views were heard and considered.Therefore, one may say that PRMP certainly played a very positiverole and contributed substantially to enhance the role of women atthe community level.
JKL1 0 0
9 0
8 0
7 0
6 0
5 0
0 2 4 6
Advantages of the semi-structured interviewThis tool, by virtue of the questions it asks, captures the quality of participation in meetings in a waywhich the community can relate to.
ConclusionPME empowers the stakeholders to steer the project effectively and efficiently. PME allows for better useof scarce resources. There are several participatory tools and techniques that can be used for PME, but thechoice of tools, techniques and methods depends on the nature of the project. It is also possible tocombine quantitative evaluation methods in PME-based approaches when attempting to assess impact.
No. of years spent withthe project
Increased roleof women (%)
Women in Decision-Making at the Community LevelExample of a simple semi-structured questionnaire administered to women
Indicators Attended the Spoke during Views weremeeting the meeting considered
Village production plan ü ü
Village regulations meet ü ü ü
Village infrastructure plans ü ü
Prepared by:P. Subrahmanyam
RESOURCE BOOK PRODUCED IN A PARTICIPATORY WRITESHOP ORGANISED
BY THE International Fund for Agricultural Development(IFAD), Asian NGO Coalition for Agrarian Reform andRural Development (ANGOC), Centre on IntegratedRural Development for Asia and the Pacific (CIRDAP),South East Asian Rural Social Leadership Institute(SEARSOLIN), MYRADA and International Instituteof Rural Reconstruction (IIRR).
223An NGO-Designed Participatory Impact Monitoring (PIM) of a Rural Development Project
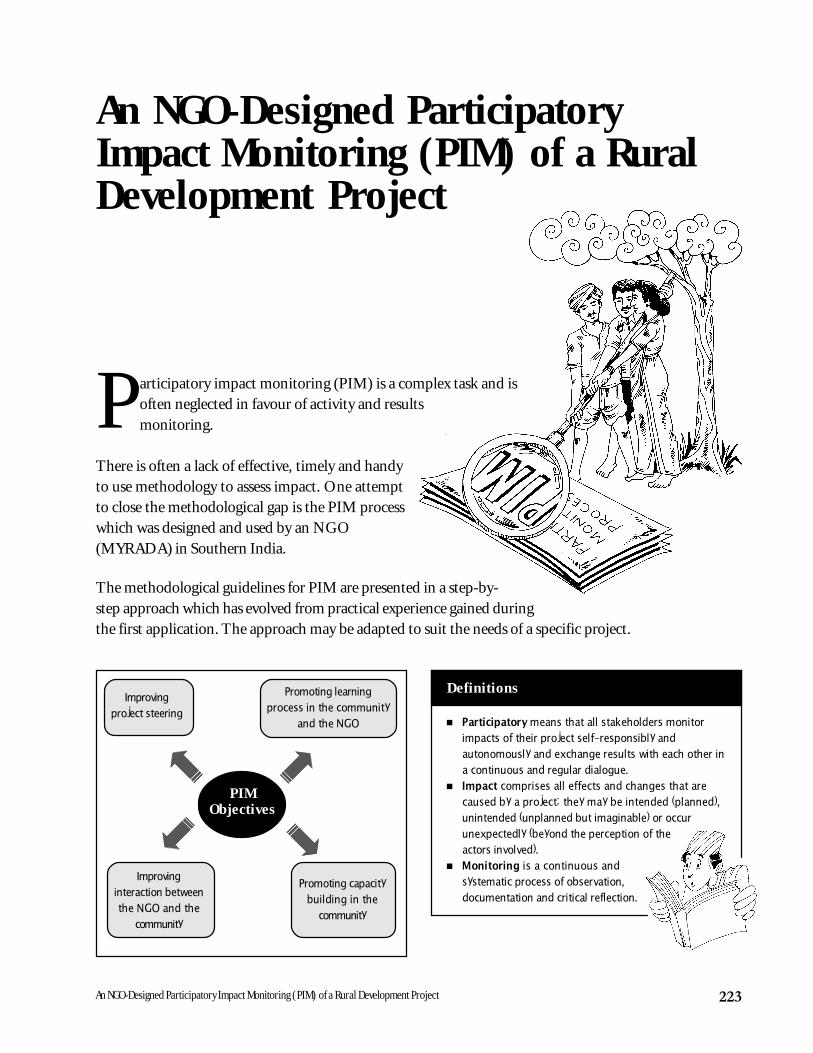
articipatory impact monitoring (PIM) is a complex task and isoften neglected in favour of activity and resultsmonitoring.
There is often a lack of effective, timely and handyto use methodology to assess impact. One attemptto close the methodological gap is the PIM processwhich was designed and used by an NGO(MYRADA) in Southern India.
The methodological guidelines for PIM are presented in a step-by-step approach which has evolved from practical experience gained duringthe first application. The approach may be adapted to suit the needs of a specific project.
An NGO-Designed ParticipatoryImpact Monitoring (PIM) of a RuralDevelopment Project
Improvinginteraction betweenthe NGO and the
community
Promoting learningprocess in the community
and the NGO
Improvingproject steering
Promoting capacitybuilding in the
community
Definitions
P
PIMObjectives
n Participatory means that all stakeholders monitorimpacts of their project self-responsibly andautonomously and exchange results with each other ina continuous and regular dialogue.
n Impact comprises all effects and changes that arecaused by a project; they may be intended (planned),unintended (unplanned but imaginable) or occurunexpectedly (beyond the perception of theactors involved).
n Monitoring is a continuous andsystematic process of observation,documentation and critical reflection.
224 ENHANCING OWNERSHIP AND SUSTAINABILITY: A RESOURCE BOOK ON PARTICIPATION
Phase I: Preparation for MonitoringPIM starts with several decisions concerning the programmes and impacts to be monitored. In thesedecisions, various interests of the NGO and possibly its partner organisations have to be made transparentand reconciled.
Step 1: Decide on which programmes to monitorAn integrated rural development project usually consists of several programmes (e.g., health and sanitation,watershed development, micro-credit, literacy, etc.). A few or only one programme should be selected formonitoring.
Step 2: Identify possible impacts of the programme(s)A list of intended and unintended impacts of the programme(s) must be developed during this stage. Abrainstorming session is an appropriate instrument to facilitate the identification of impacts.
The guiding questions for this process are:n What positive changes do we intend to create with the programme?n What unintended changes (positive/negative) do we expect or fear will occur in the course of our
programme?
Step 3: Clarify key terms and agree on the meaning of the impactsEach individual perceives impact and defines key terms differently. There must be a commonunderstanding of the meaning of the impacts and an agreement of their definitions must be reached.
Step 4: Decide on impacts to be monitoredA manageable list of selected impacts to be monitored is generated in this step. Criteria for the selection ofimpacts depend on the needs of the NGO. In order to get a holistic picture of a programme, the packagecan comprise socio-cultural (“soft”) impacts as well as technical-economic (“hard”) impacts.
The Importance of PIM
Funds for development assistance are decreasing anddevelopment agencies worldwide are beingquestioned to justify how and to what extentthe expenditures benefited the rural poor andto what degree the efforts have affecteddevelopment processes. A major concern lies inthe sustainability of the project and the effect onpoverty alleviation. In addition, the communitiesthemselves must be empowered to monitor theimpact of development interventions. PIM seeks toclose the methodological gap.
225An NGO-Designed Participatory Impact Monitoring (PIM) of a Rural Development Project
Phase II: Reflection on the Impacts to be MonitoredDuring this phase, it is necessary to examine the relationship between project activities that result in acertain impact as well as other factors that may contribute towards creating this impact.
Step 5: Investigate the relationship between project activities and impactsDuring this step, all activities of the NGO that influence the impact must be identified and cause-effectrelationships must be established.
A guiding question which may be used at this stage is: “How and to what extent are the impacts related tothe project activities?”
Step 6: Investigate the relationship between factors external to the project and impactsMost impacts are influenced by a large number of external factors besides project activities. These can havefostering or hampering effects on the achievements of the project (e.g., government programmes and themedia). The extent to which these factors influence each impact should be established.
A guiding question which may be used at this stage is: “Which other factors might influence the impact?”
Elements for Successful Adoptionof PIM
As with any successful introduction of a newinstrument within a given project framework, theadoption of PIM requires change on both sides:n The instrument has to be flexible enough to suit
the needs, capabilities and constraints of theusers.
n The users have to be willing to acquire new skillsand to provide favourable framework conditions.Practical experience indicates that, for PIM to be
successful, staff should feel a need forit. Since PIM involves extra work, the
project personnel must feel motivated toapply it and PIM should not be considered
only as a donor or head office concern. Itmust also be remembered that additional inputs,especially in terms of finances and time, areneeded. These should be realistically assessedbefore PIM is introduced.
226 ENHANCING OWNERSHIP AND SUSTAINABILITY: A RESOURCE BOOK ON PARTICIPATION
Step 7: Examine the existing M&E activities measuring impactPIM must consult information and data already available in a project. These data refer to all backgroundinformation that has already been monitored or compiled in the form of publications, lists, reports, files,etc. This step makes it easier to identify information needs and starting points for the integration of PIMinto an existing monitoring and evaluation (M&E) system. Furthermore, this step will be useful in toavoid “re-inventing the wheel” in the monitoring process.
Phase III: Development of IndicatorsDeveloping indicators and methods that allow for measurement of the chosen impacts is the core andmost challenging phase of PIM. In this phase, the involvement of the target group is absolutely necessary.
Step 8: Draft the indicatorsIn order to make an impact observable or measurable, indicators and methods have to be developed.Indicators are detailed descriptions of impacts, developed in order to assess the impacts. It is unrealistic toexpect that good indicators and methods may be developed at one go. Instead, a step-by-step procedure isnecessary, starting with the drafting of preliminary indicators and data collection tools. A preliminary listof indicators, missing information about the indicators, and the rationale for choosing these indicatorshave to be identified in this step.
Step 9: Consult the community and other resource persons for indicator developmentThe preliminary list of indicators developed previously must be reworked with the community. In Step 8,they have been formulated only on the basis of the experience of the NGO and on available informationabout the project. The community must be consulted to finalise the indicators since they are the mostknowledgeable about their environment and often have their own indicators for assessing changes relevantto them.
Need for Training in PIM
PIM requires experienced facilitators andthe most demanding task is training thefield staff in indicator development anddata processing as well as analysingmeasurement results. Experience withinterviewing, facilitation and the use ofparticipatory rural appraisal (PRA) toolsis desirable. Furthermore, dataprocessing will be much easier if staffhas analytical skills and some experiencewith documentation and computer use.
227An NGO-Designed Participatory Impact Monitoring (PIM) of a Rural Development Project
“How do you notice that an impact has occurred?” and “Can you give a concrete example as to how youobserve an impact?” are guiding questions for the community.
Any open questions concerning impacts, the indicators, their rationale and their limitations have to beclarified with the community.
Step 10: Select the most appropriate indicatorsIt may turn out that the number of indicators generated so far is too high. In view of limitedresources, a decision has to be made as to which of the indicators (or sets of indicators) are mostappropriate to measure various impacts to a satisfactory degree. The development of criteria for theselection of indicators must allow for a ranking of the (sets of ) indicators. Matrix scoring is anappropriate tool to facilitate such a ranking. Criteria for selection of indicators may be: user-friendliness, low cost, precision, etc.
Step 11: Define survey units and decide on the sampling procedureSurvey units (e.g., comunity-based groups) and respondents (members) have to be defined at thisstage. A further decision has also to be made on the sampling procedure and the minimum samplesize, as sampling also has a critical influence on the reliability of the results.
Step 12: Design data collection toolsThe data collection method is to a large extent already defined by the selection of indicators. Forinterviews, the staff has to decide on a limited number of questions per indicator. If the indicator is tobe measured using PRA tools, detailed instructions for the facilitator must be developed.
Step 13: Design data processing and data analysis sheetsIn order to handle data obtained during the measurement phase in a systematic manner, it isimportant to have data processing sheets ready for data entry. It is also necessary to have a clear ideaabout how the data may be analysed subsequent to the measurement phase.
Step 14: Pre-test indicators, methods and data analysisA pre-test is carried out to check whether the data collection instruments are adequate, unambiguousand manageable in the field. This step is absolutely essential in preparing for measurement since it isthe last check of the feasibility and usefulness of selected instruments before they are applied on abroad scale.
Step 15: Determine thresholds and targeted achievementsThe assessment of impacts is based on the comparison of results with “milestones” set in advance. Inorder to know whether an NGO and a community have achieved their goals, it is necessary to qualifyand quantify their goals beforehand.
228 ENHANCING OWNERSHIP AND SUSTAINABILITY: A RESOURCE BOOK ON PARTICIPATION
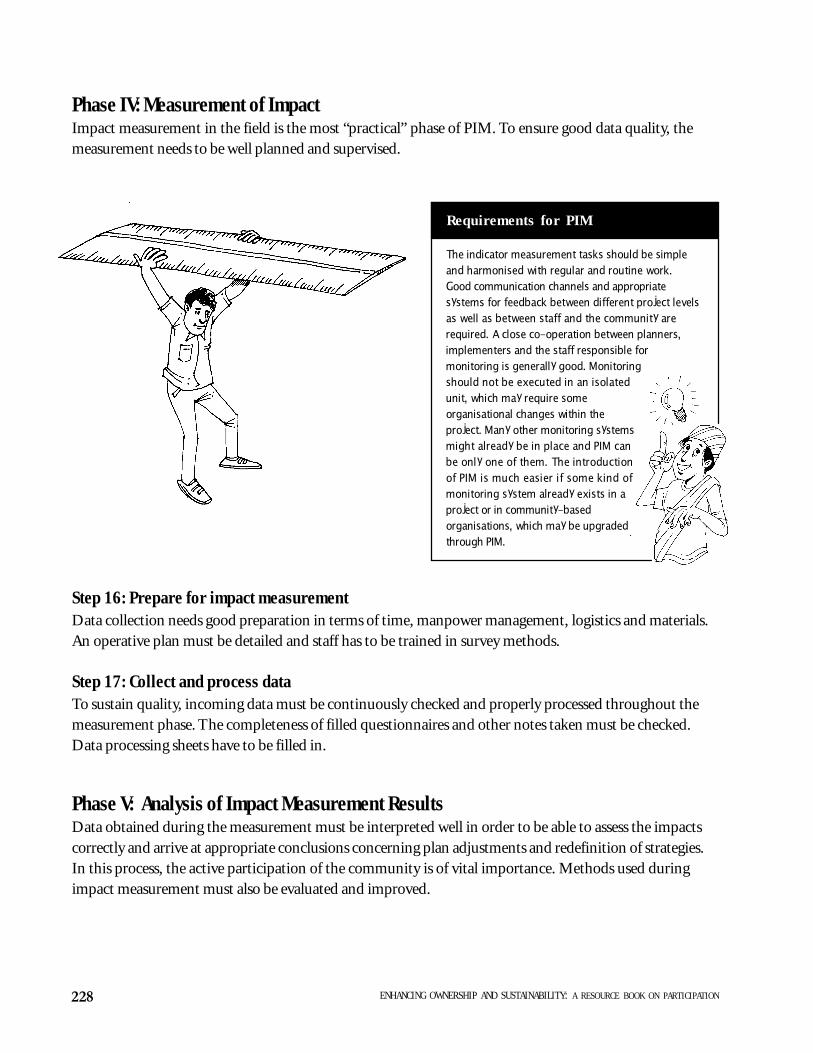
Phase IV: Measurement of ImpactImpact measurement in the field is the most “practical” phase of PIM. To ensure good data quality, themeasurement needs to be well planned and supervised.
Requirements for PIM
The indicator measurement tasks should be simpleand harmonised with regular and routine work.Good communication channels and appropriatesystems for feedback between different project levelsas well as between staff and the community arerequired. A close co-operation between planners,implementers and the staff responsible formonitoring is generally good. Monitoringshould not be executed in an isolatedunit, which may require someorganisational changes within theproject. Many other monitoring systemsmight already be in place and PIM canbe only one of them. The introductionof PIM is much easier if some kind ofmonitoring system already exists in aproject or in community-basedorganisations, which may be upgradedthrough PIM.
Step 16: Prepare for impact measurementData collection needs good preparation in terms of time, manpower management, logistics and materials.An operative plan must be detailed and staff has to be trained in survey methods.
Step 17: Collect and process dataTo sustain quality, incoming data must be continuously checked and properly processed throughout themeasurement phase. The completeness of filled questionnaires and other notes taken must be checked.Data processing sheets have to be filled in.
Phase V: Analysis of Impact Measurement ResultsData obtained during the measurement must be interpreted well in order to be able to assess the impactscorrectly and arrive at appropriate conclusions concerning plan adjustments and redefinition of strategies.In this process, the active participation of the community is of vital importance. Methods used duringimpact measurement must also be evaluated and improved.
229An NGO-Designed Participatory Impact Monitoring (PIM) of a Rural Development Project
Step 18: Analyse and pre-assess resultsResults of the measurement must be analysed and preliminaryconclusions should be drawn.
Step 19: Draw conclusions in joint reflection with thecommunityAfter having identified possible weak areas of the project, themain tasks are to analyse the reasons for deviations from thetargeted achievements, to draw conclusions for plan adjustments and the redefinition ofproject strategies. The active involvement of the community in joint reflection isnecessary in this phase. Joint reflection workshops are a good platform to share the resultsof impact measurement with the community. Issues such as, how far observed changesmay be attributed to the project or some of the targets have not been achieved, may bediscussed with the community.
Step 20: Evolve recommendations for future monitoringAs monitoring is a continuous, repetitive activity, PIM must be institutionalised in the NGO and incommunity-based institutions. Recommendations for future monitoring must be made at this stage.Designing ways to institutionalise these activities into the existing M&E system is the aim of this step.
The steps described should not be seen as static. It is neither possible nor desirable to have a rigid singledesign of PIM to which all projects must conform in the same sequence and order. Developed indicatorsmight be valid for similar projects, but it is also possible that indicators and tools may have to be modifiedand iteratively updated by the users to fit in their specific situations and needs. (A practical example of howPIM has been introduced in a project has been described in the topic on Testing Participatory ImpactMonitoring: Participatory Resource Management Project in Vietnam on page 236).
Prepared by:Anke Schuermann
RESOURCE BOOK PRODUCED IN A PARTICIPATORY WRITESHOP ORGANISED
BY THE International Fund for Agricultural Development(IFAD), Asian NGO Coalition for Agrarian Reform andRural Development (ANGOC), Centre on IntegratedRural Development for Asia and the Pacific (CIRDAP),South East Asian Rural Social Leadership Institute(SEARSOLIN), MYRADA and International Instituteof Rural Reconstruction (IIRR).
230 ENHANCING OWNERSHIP AND SUSTAINABILITY: A RESOURCE BOOK ON PARTICIPATION
Using PRA for ParticipatoryImpact Monitoring:An Illustrative Example
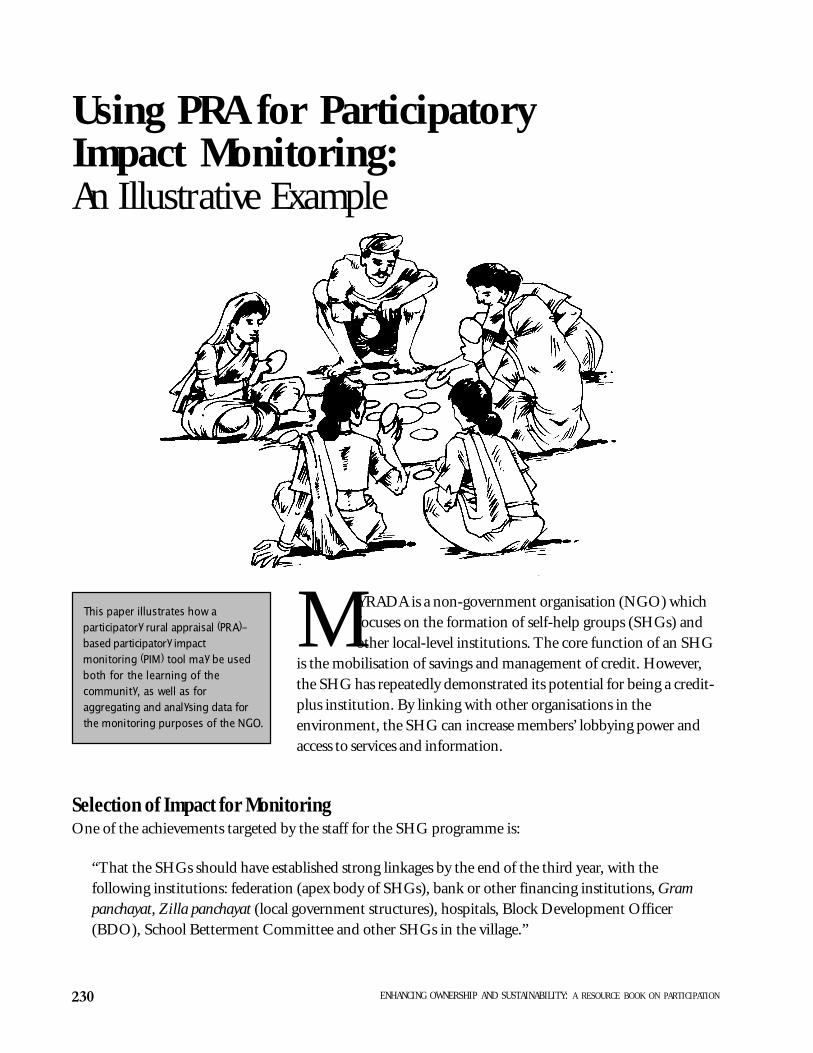
YRADA is a non-government organisation (NGO) whichfocuses on the formation of self-help groups (SHGs) andother local-level institutions. The core function of an SHG
is the mobilisation of savings and management of credit. However,the SHG has repeatedly demonstrated its potential for being a credit-plus institution. By linking with other organisations in theenvironment, the SHG can increase members’ lobbying power andaccess to services and information.
This paper illustrates how aparticipatory rural appraisal (PRA)-based participatory impactmonitoring (PIM) tool may be usedboth for the learning of thecommunity, as well as foraggregating and analysing data forthe monitoring purposes of the NGO.
M
Selection of Impact for MonitoringOne of the achievements targeted by the staff for the SHG programme is:
“That the SHGs should have established strong linkages by the end of the third year, with thefollowing institutions: federation (apex body of SHGs), bank or other financing institutions, Grampanchayat, Zilla panchayat (local government structures), hospitals, Block Development Officer(BDO), School Betterment Committee and other SHGs in the village.”
231Using PRA for Participatory Impact Monitoring: An Illustrative Example
The impact to be monitored, “Development of Networks with other Institutions”, was chosen in order toinvestigate the extent to which this has been achieved by the project.
Indicators Selected for Measurement and Rationale for Choosing these IndicatorsThe indicators chosen to measure impact are:n the number of linkages between SHGs and other institutions;n the intensity of their contact; andn the importance of each linkage for SHG members.
The number, strength and importance of linkages of SHGs with other institutions determine the qualityof an institutional network. Therefore, investigating the development of these features can assess thegrowth and effectiveness of networks.
Adaptation of Chapati (Venn) diagramming for monitoring impactChapati diagrams have been successfully used by community-based groups for assessing linkages.However, one problem faced in using them for monitoring impact at the project level, is that chapati sizes,as well as their distances from the centre of the diagram, vary freely. Thus, analysing the chapati diagramsto allow for comparisons in the monitoring process becomes difficult. To aid the comparative analysis ofchapati diagram results from different SHGs, the number of chapati sizes and their distance from thecentre of the diagram have been limited to two categories:n three different sizes of chapatis represent three degrees of importance (high, medium and low)
attributed by SHG members to the institutions involved; andn three circles around the centre of the diagram represent three degrees of interaction between the SHG
and these institutions.
Limitations of the methodDespite modifications, the method still has some limitations.n Since a chapati diagram is a participatory tool, the quality of the results depends strongly on the quality
of group facilitation and detailed documentation of the process.n Moreover, the results depend very much on the subjective point of view of the
respondents, which makes their comparison difficult.n Finally, the result analysis can, for the most part, only be done in a very descriptive
way, which means that the drawings may at best support data analysis.
Use of the method
1. Instructions for data collectionn Prepare the tool before you go to the field.n Introduce the chapati diagram and thoroughly explain the meaning of the three
different circles and chapati sizes to the SHG members.

232 ENHANCING OWNERSHIP AND SUSTAINABILITY: A RESOURCE BOOK ON PARTICIPATION
n Cross-check whether the SHG members have really understoodwhat is meant by “institutions”, “importance of linkages” and“intensity of linkages”.
n Brainstorm and identify all institutions they are in touch with –within and outside the village – and write them down on aseparate sheet of paper. Do not list them with numbers, as thismay indicate priorities. Do not list institutions if participants areonly aware of their existence without any established contact withthem or institutions to which they have individual contact andnot a group contact.
n Ask the SHG members to prioritise the institutions mentionedwith regard to their importance (high, medium, and low) for theSHG. Note down the name of each institution on the appropriatesize of the chapati.
n Identify the degree of intensity of contact between the SHG andthe institutions by putting the chapatis in the three different circles(I, II or III). Let participants move the chapatis within the threecircles until they come to a consensus.
n Crosscheck by verifying and clarifying their choices.n Stick the chapatis with glue.
The stage of data collection haspotential for being a learningexercise and a training tool forcommunity members as they canevaluate in detail what linkages areimportant to them and whetherthese linkages have been madestrong. It is important at thisstage to also deal with issues ofcausality - why are certain linkagesweak (if they are important to SHGmembers) and what may be doneto strengthen them. The chapatidiagram must be kept withthe SHG members for futuremonitoring. At this stage it isalso vital for facilitators tonote the perceptions ofmembers as to why alinkage is consideredimportant or why it is weak.Collating these data for theentire project at the end ofthe exercise will throw morelight on the final data analysis.
I . Strong interaction, very goodrapport, frequent/ regularcontact, high accessibility,benefiting very much from eachother, mobilising each other.Score: 3
I I : Some interaction, continuousbut not regular contact, notbenefiting very much fromeach other.Score: 2
I I I : Only sporadic contact, onlyknowing each other.Score: 1
A : High importanceScore: 3
B : Medium importanceScore: 2
C : Low importanceScore: 1
Chapati Diagram: Features of Linkages and their Scores
SHG ó
l
ó
ll
ó
lll
ó ó
ll
ó
lll l
233Using PRA for Participatory Impact Monitoring: An Illustrative Example
n Discuss their plans for building and strengthening linkages in the future, based on the results, e.g., ifthey have indicated that a relationship with an institution is important to them but their interaction isweak, then they may discuss why this is so and what they can do to change the situation.
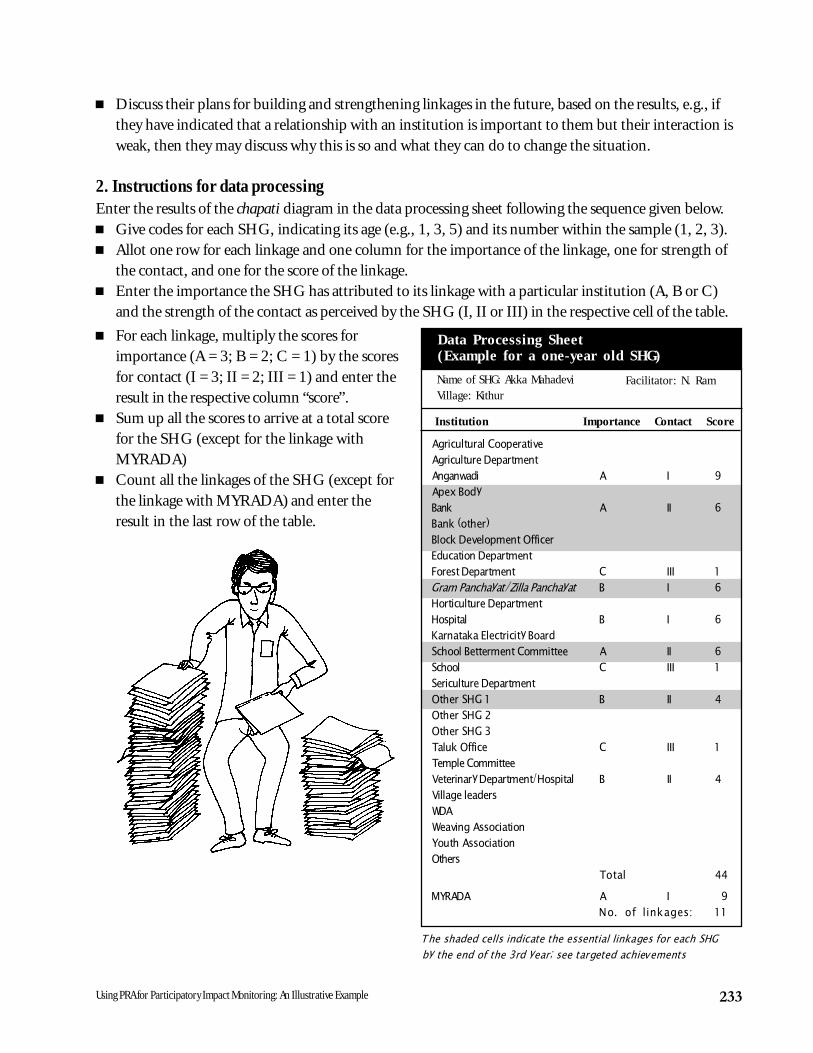
2. Instructions for data processingEnter the results of the chapati diagram in the data processing sheet following the sequence given below.n Give codes for each SHG, indicating its age (e.g., 1, 3, 5) and its number within the sample (1, 2, 3).n Allot one row for each linkage and one column for the importance of the linkage, one for strength of
the contact, and one for the score of the linkage.n Enter the importance the SHG has attributed to its linkage with a particular institution (A, B or C)
and the strength of the contact as perceived by the SHG (I, II or III) in the respective cell of the table.
Data Processing Sheet(Example for a one-year old SHG)
Institution Importance Contact Score
n For each linkage, multiply the scores forimportance (A = 3; B = 2; C = 1) by the scoresfor contact (I = 3; II = 2; III = 1) and enter theresult in the respective column “score”.
n Sum up all the scores to arrive at a total scorefor the SHG (except for the linkage withMYRADA)
n Count all the linkages of the SHG (except forthe linkage with MYRADA) and enter theresult in the last row of the table.
Name of SHG: Akka MahadeviVillage: Kithur
Facilitator: N. Ram
The shaded cells indicate the essential linkages for each SHGby the end of the 3rd year; see targeted achievements
Agricultural CooperativeAgriculture DepartmentAnganwadi A I 9Apex BodyBank A II 6Bank (other)Block Development OfficerEducation DepartmentForest Department C III 1Gram Panchayat/Zilla Panchayat B I 6Horticulture DepartmentHospital B I 6Karnataka Electricity BoardSchool Betterment Committee A II 6School C III 1Sericulture DepartmentOther SHG 1 B II 4Other SHG 2Other SHG 3Taluk Office C III 1Temple CommitteeVeterinary Department/Hospital B II 4Village leadersWDAWeaving AssociationYouth AssociationOthers
Total 44
MYRADA A I 9No. of linkages: 11
234 ENHANCING OWNERSHIP AND SUSTAINABILITY: A RESOURCE BOOK ON PARTICIPATION
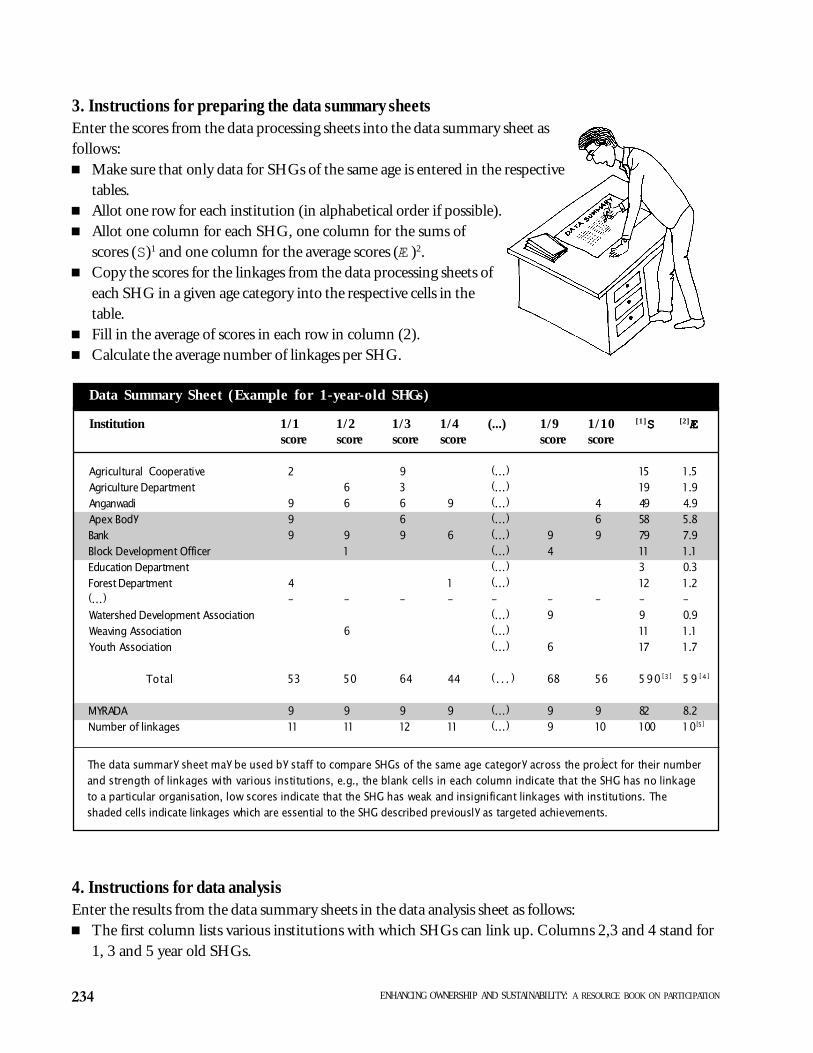
3. Instructions for preparing the data summary sheetsEnter the scores from the data processing sheets into the data summary sheet asfollows:n Make sure that only data for SHGs of the same age is entered in the respective
tables.n Allot one row for each institution (in alphabetical order if possible).n Allot one column for each SHG, one column for the sums of
scores (S)1 and one column for the average scores (Æ)2.n Copy the scores for the linkages from the data processing sheets of
each SHG in a given age category into the respective cells in thetable.
n Fill in the average of scores in each row in column (2).n Calculate the average number of linkages per SHG.
The data summary sheet may be used by staff to compare SHGs of the same age category across the project for their numberand strength of linkages with various institutions, e.g., the blank cells in each column indicate that the SHG has no linkageto a particular organisation, low scores indicate that the SHG has weak and insignificant linkages with institutions. Theshaded cells indicate linkages which are essential to the SHG described previously as targeted achievements.
Institution 1/1 1/2 1/3 1/4 (...) 1/9 1/10 [1]SSSSS [2]ÆÆÆÆÆscore score score score score score
Agricultural Cooperative 2 9 (...) 15 1.5Agriculture Department 6 3 (...) 19 1.9Anganwadi 9 6 6 9 (...) 4 49 4.9Apex Body 9 6 (...) 6 58 5.8Bank 9 9 9 6 (...) 9 9 79 7.9Block Development Officer 1 (...) 4 11 1.1Education Department (...) 3 0.3Forest Department 4 1 (...) 12 1.2(...) - - - - - - - - -Watershed Development Association (...) 9 9 0.9Weaving Association 6 (...) 11 1.1Youth Association (...) 6 17 1.7
Total 53 50 64 44 ( . . . ) 68 56 590 [3] 59 [4 ]
MYRADA 9 9 9 9 (...) 9 9 82 8.2Number of linkages 11 11 12 11 (...) 9 10 100 10[5]
Data Summary Sheet (Example for 1-year-old SHGs)
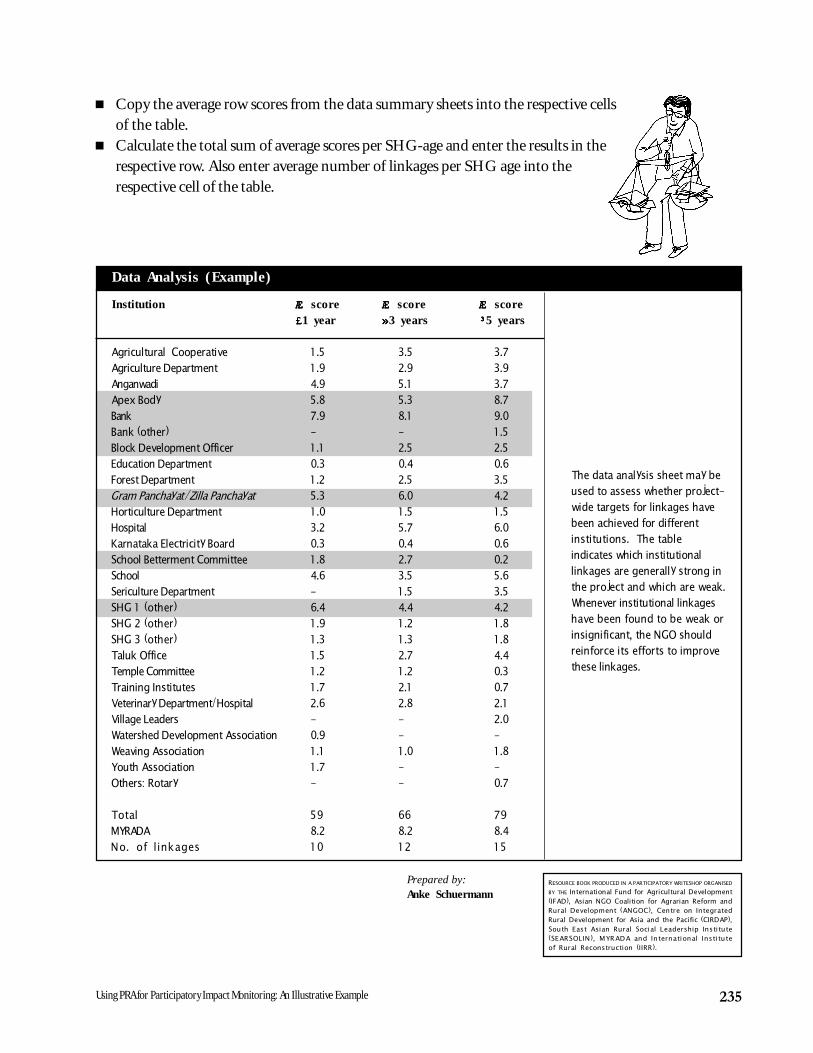
4. Instructions for data analysisEnter the results from the data summary sheets in the data analysis sheet as follows:n The first column lists various institutions with which SHGs can link up. Columns 2,3 and 4 stand for
1, 3 and 5 year old SHGs.
235Using PRA for Participatory Impact Monitoring: An Illustrative Example
Institution ÆÆÆÆÆ score ÆÆÆÆÆ score ÆÆÆÆÆ score£££££1 year »»»»»3 years ³³³³³ 5 years
Agricultural Cooperative 1.5 3.5 3.7Agriculture Department 1.9 2.9 3.9Anganwadi 4.9 5.1 3.7Apex Body 5.8 5.3 8.7Bank 7.9 8.1 9.0Bank (other) - - 1.5Block Development Officer 1.1 2.5 2.5Education Department 0.3 0.4 0.6Forest Department 1.2 2.5 3.5Gram Panchayat/Zilla Panchayat 5.3 6.0 4.2Horticulture Department 1.0 1.5 1.5Hospital 3.2 5.7 6.0Karnataka Electricity Board 0.3 0.4 0.6School Betterment Committee 1.8 2.7 0.2School 4.6 3.5 5.6Sericulture Department - 1.5 3.5SHG 1 (other) 6.4 4.4 4.2SHG 2 (other) 1.9 1.2 1.8SHG 3 (other) 1.3 1.3 1.8Taluk Office 1.5 2.7 4.4Temple Committee 1.2 1.2 0.3Training Institutes 1.7 2.1 0.7Veterinary Department/Hospital 2.6 2.8 2.1Village Leaders - - 2.0Watershed Development Association 0.9 - -Weaving Association 1.1 1.0 1.8Youth Association 1.7 - -Others: Rotary - - 0.7
Total 59 66 79MYRADA 8.2 8.2 8.4No. of linkages 10 12 15
The data analysis sheet may beused to assess whether project-wide targets for linkages havebeen achieved for differentinstitutions. The tableindicates which institutionallinkages are generally strong inthe project and which are weak.Whenever institutional linkageshave been found to be weak orinsignificant, the NGO shouldreinforce its efforts to improvethese linkages.
Data Analysis (Example)
n Copy the average row scores from the data summary sheets into the respective cellsof the table.
n Calculate the total sum of average scores per SHG-age and enter the results in therespective row. Also enter average number of linkages per SHG age into therespective cell of the table.
Prepared by:Anke Schuermann
RESOURCE BOOK PRODUCED IN A PARTICIPATORY WRITESHOP ORGANISED
BY THE International Fund for Agricultural Development(IFAD), Asian NGO Coalition for Agrarian Reform andRural Development (ANGOC), Centre on IntegratedRural Development for Asia and the Pacific (CIRDAP),South East Asian Rural Social Leadership Institute(SEARSOLIN), MYRADA and International Instituteof Rural Reconstruction (IIRR).
236 ENHANCING OWNERSHIP AND SUSTAINABILITY: A RESOURCE BOOK ON PARTICIPATION
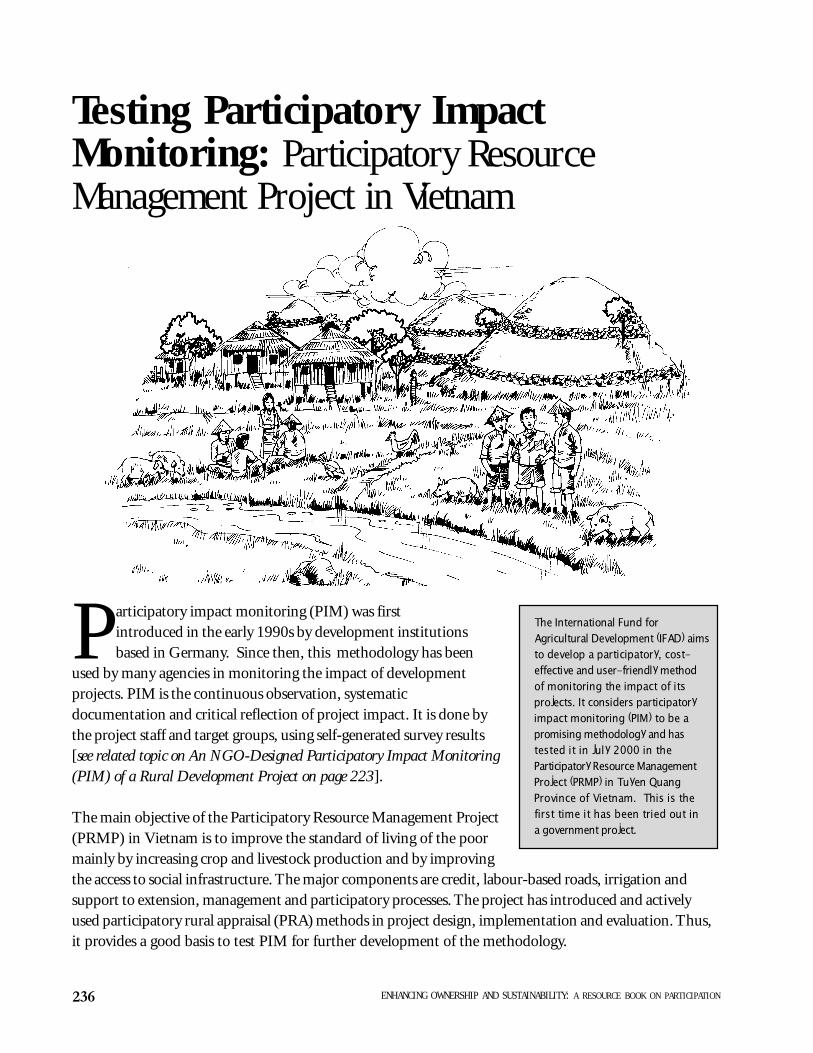
articipatory impact monitoring (PIM) was firstintroduced in the early 1990s by development institutionsbased in Germany. Since then, this methodology has been
used by many agencies in monitoring the impact of developmentprojects. PIM is the continuous observation, systematicdocumentation and critical reflection of project impact. It is done bythe project staff and target groups, using self-generated survey results[see related topic on An NGO-Designed Participatory Impact Monitoring(PIM) of a Rural Development Project on page 223].
The main objective of the Participatory Resource Management Project(PRMP) in Vietnam is to improve the standard of living of the poormainly by increasing crop and livestock production and by improvingthe access to social infrastructure. The major components are credit, labour-based roads, irrigation andsupport to extension, management and participatory processes. The project has introduced and activelyused participatory rural appraisal (PRA) methods in project design, implementation and evaluation. Thus,it provides a good basis to test PIM for further development of the methodology.
Testing Participatory ImpactMonitoring: Participatory ResourceManagement Project in Vietnam
The International Fund forAgricultural Development (IFAD) aimsto develop a participatory, cost-effective and user-friendly methodof monitoring the impact of itsprojects. It considers participatoryimpact monitoring (PIM) to be apromising methodology and hastested it in July 2000 in theParticipatory Resource ManagementProject (PRMP) in Tuyen QuangProvince of Vietnam. This is thefirst time it has been tried out ina government project.
P
237Testing Participatory Impact Monitoring: Participatory Resource Management Project in Vietnam
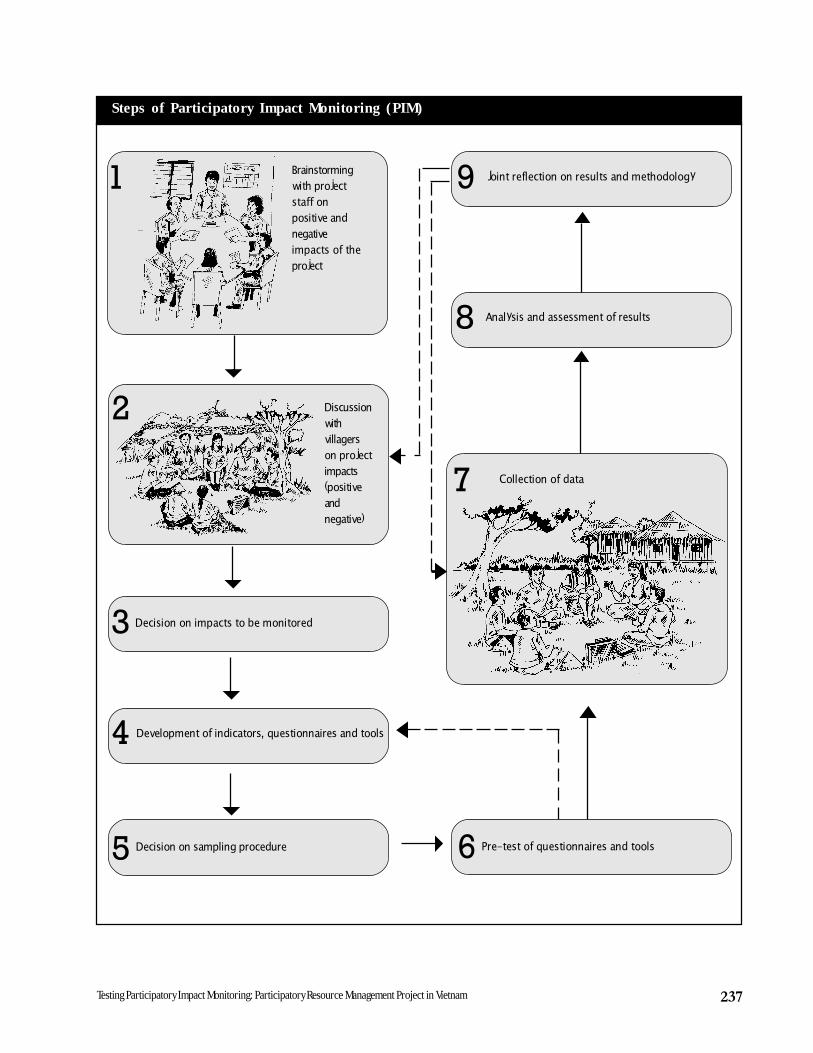
Steps of Participatory Impact Monitoring (PIM)
Joint reflection on results and methodology
Collection of data
Pre-test of questionnaires and tools
Brainstormingwith projectstaff onpositive andnegativeimpacts of theproject
1
6
7
9
Decision on sampling procedure5
Development of indicators, questionnaires and tools4
Decision on impacts to be monitored3
Discussionwithvillagerson projectimpacts(positiveandnegative)
2
Analysis and assessment of results8
238 ENHANCING OWNERSHIP AND SUSTAINABILITY: A RESOURCE BOOK ON PARTICIPATION
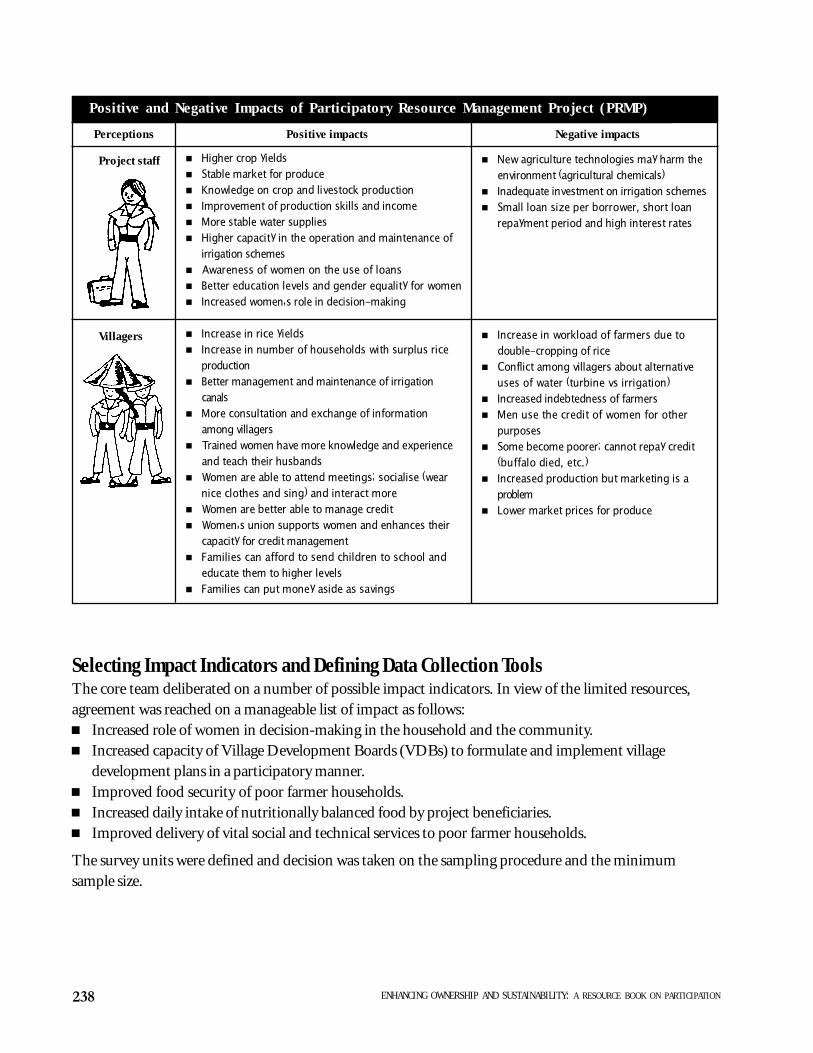
Project staff
Villagers
Perceptions Positive impacts Negative impacts
n Higher crop yieldsn Stable market for producen Knowledge on crop and livestock productionn Improvement of production skills and incomen More stable water suppliesn Higher capacity in the operation and maintenance of
irrigation schemesn Awareness of women on the use of loansn Better education levels and gender equality for womenn Increased women�s role in decision-making
n Increase in rice yieldsn Increase in number of households with surplus rice
productionn Better management and maintenance of irrigation
canalsn More consultation and exchange of information
among villagersn Trained women have more knowledge and experience
and teach their husbandsn Women are able to attend meetings; socialise (wear
nice clothes and sing) and interact moren Women are better able to manage creditn Women�s union supports women and enhances their
capacity for credit managementn Families can afford to send children to school and
educate them to higher levelsn Families can put money aside as savings
n New agriculture technologies may harm theenvironment (agricultural chemicals)
n Inadequate investment on irrigation schemesn Small loan size per borrower, short loan
repayment period and high interest rates
n Increase in workload of farmers due todouble-cropping of rice
n Conflict among villagers about alternativeuses of water (turbine vs irrigation)
n Increased indebtedness of farmersn Men use the credit of women for other
purposesn Some become poorer; cannot repay credit
(buffalo died, etc.)n Increased production but marketing is a
problemn Lower market prices for produce
Positive and Negative Impacts of Participatory Resource Management Project (PRMP)
Selecting Impact Indicators and Defining Data Collection ToolsThe core team deliberated on a number of possible impact indicators. In view of the limited resources,agreement was reached on a manageable list of impact as follows:n Increased role of women in decision-making in the household and the community.n Increased capacity of Village Development Boards (VDBs) to formulate and implement village
development plans in a participatory manner.n Improved food security of poor farmer households.n Increased daily intake of nutritionally balanced food by project beneficiaries.n Improved delivery of vital social and technical services to poor farmer households.
The survey units were defined and decision was taken on the sampling procedure and the minimumsample size.

239Testing Participatory Impact Monitoring: Participatory Resource Management Project in Vietnam
Impact
Definitions
Indicators
Survey Unit
Respondent
Method
Write down the final formulation of the impact statement.Example: Increased role of women in decision-making in the household.
Identify important terms and define each term in a simple manner.Example:Role: Accepted position a person has in society (family, village, etc.)Decision-making: Decisions on attending meetings; management of loans (how toutilise them, how to repay, etc.); buying and selling of products; and selection ofthe breeds of animals to rear.Household: People living under one roof.
Identify one or more indicators to measure the impact.Example: The percentage of women who acquired a stronger position to decidethe following has increased:n whether to attend village meetings or women-related training;n how to manage loans;n which products to buy and to sell; andn which breeds of animals to rear.
Identify what unit is relevant for the impact.Example: Household, with both husband and wife.
Determine whom to ask the questions to.Example: The woman (wife) in the household.
Select the method to be used (questionnaire or PRA).Example: An interview method � an interview sheet with illustrationwas used. The respondents (women) were asked to ratethemselves in relation to the man (husband), in terms ofdecision-making in the household. They could then ratethemselves either below, at par, or above the man.
Select a sample that will allow comparisons of changesover time, or differences across populations or areas.Example: A triangulation sampling method was used.
Finally, explain the limitations and why certain indicators were used.Clarify certain assumptions taken in the study.
Sample
Rationale andLimitations of
Indicators
The PIM Process: Steps for Developing Impact Indicators
240 ENHANCING OWNERSHIP AND SUSTAINABILITY: A RESOURCE BOOK ON PARTICIPATION
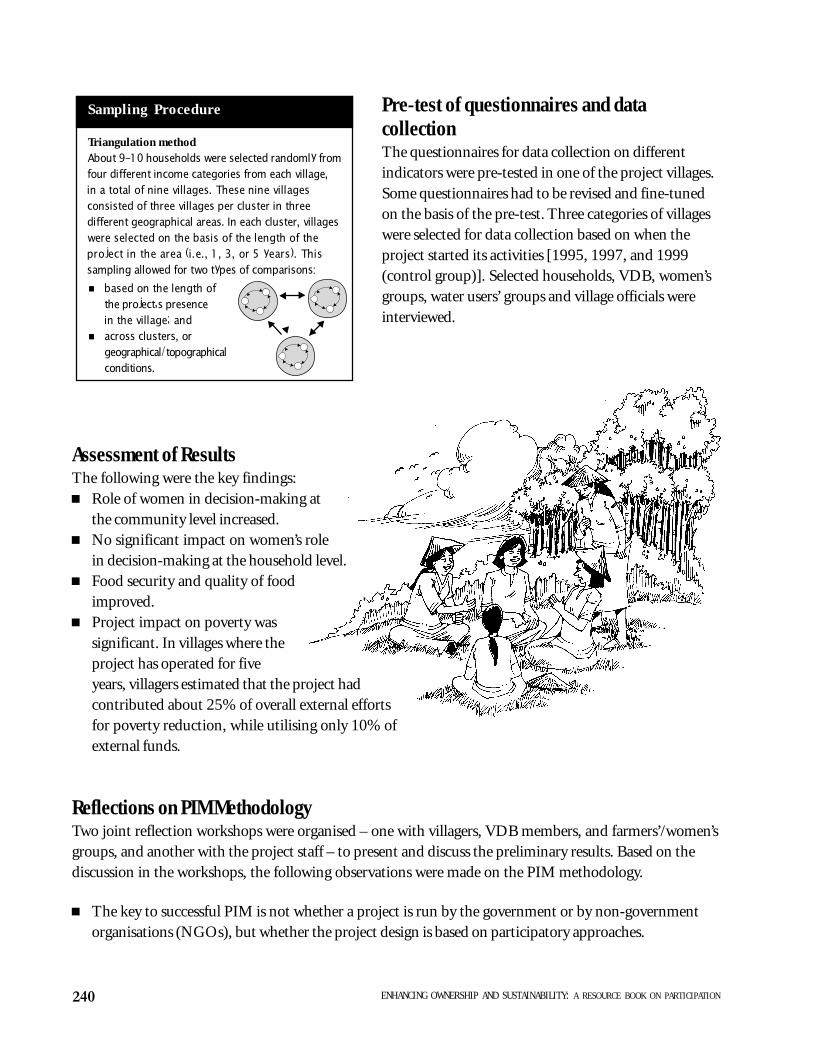
Assessment of ResultsThe following were the key findings:n Role of women in decision-making at
the community level increased.n No significant impact on women’s role
in decision-making at the household level.n Food security and quality of food
improved.n Project impact on poverty was
significant. In villages where theproject has operated for fiveyears, villagers estimated that the project hadcontributed about 25% of overall external effortsfor poverty reduction, while utilising only 10% ofexternal funds.
Reflections on PIM MethodologyTwo joint reflection workshops were organised – one with villagers, VDB members, and farmers’/women’sgroups, and another with the project staff – to present and discuss the preliminary results. Based on thediscussion in the workshops, the following observations were made on the PIM methodology.
n The key to successful PIM is not whether a project is run by the government or by non-governmentorganisations (NGOs), but whether the project design is based on participatory approaches.
Pre-test of questionnaires and datacollectionThe questionnaires for data collection on differentindicators were pre-tested in one of the project villages.Some questionnaires had to be revised and fine-tunedon the basis of the pre-test. Three categories of villageswere selected for data collection based on when theproject started its activities [1995, 1997, and 1999(control group)]. Selected households, VDB, women’sgroups, water users’ groups and village officials wereinterviewed.
Sampling Procedure
Triangulation methodAbout 9-10 households were selected randomly fromfour different income categories from each village,in a total of nine villages. These nine villagesconsisted of three villages per cluster in threedifferent geographical areas. In each cluster, villageswere selected on the basis of the length of theproject in the area (i.e., 1, 3, or 5 years). Thissampling allowed for two types of comparisons:
n based on the length ofthe project�s presencein the village; and
n across clusters, orgeographical/topographicalconditions.
�� ���
�
�
�
�
�
�
�
�
�
�
�
�
�
�
�
�
� ��
241Testing Participatory Impact Monitoring: Participatory Resource Management Project in Vietnam
n Some level of prior experience of project staff in PRA is essential since PRA methods andphilosophy emphasise:– an inherent belief and confidence in the ability of people to objectively perceive and assess
qualitative changes;– an appreciation on the part of the researcher for non-parametric measurements (e.g., rating
scales) as opposed to relying solely on parametric measurements (e.g., amount of credit given,repayment rates); and
– a sense of ownership among beneficiaries.
n PIM should be introduced at least one year after initiation of the project because it takes time forboth the staff and the target beneficiary groups to understand the directions of the project andwhich impact indicators to use.
n The project had several negative impacts on the beneficiary household, but the most importantones had not been identified by the project staff (e.g., increased indebtedness of farmers, marketingproblems and the use of women’s loans by men for other purposes).
n Although the methodology proved to be useful for impact monitoring, further simplification,particularly for data processing and analysis, will be needed.
n The indicators and questionnaires were relatively good in assessing the impact of PRMP in the areasof gender, food security and nutrition, institutional capacity-building and service delivery. However,the methods should be further fine-tuned to assess the capacities of village-level institutions (VDBs,women’s groups, etc.) in planning and implementing village development plans in a participatorymanner.
n The development of indicators was heavily influenced by the core team from the district-levelmonitoring and evaluation units, who require greater quantitative accuracy than would be feasibleby institutions such as VDBs. There is thus a need to bring this analysis down to the beneficiarylevel (VDBs, farmers’ groups) so that community groups are empowered to monitor the impact ofthe project.
Prepared by:Ganesh Thapa
With contributions from:Tony Quizon,Christian Berg andJon Dean
RESOURCE BOOK PRODUCED IN A PARTICIPATORY WRITESHOP ORGANISED
BY THE International Fund for Agricultural Development(IFAD), Asian NGO Coalition for Agrarian Reform andRural Development (ANGOC), Centre on IntegratedRural Development for Asia and the Pacific (CIRDAP),South East Asian Rural Social Leadership Institute(SEARSOLIN), MYRADA and International Instituteof Rural Reconstruction (IIRR).
242 ENHANCING OWNERSHIP AND SUSTAINABILITY: A RESOURCE BOOK ON PARTICIPATION
Scaling Up Local Successes
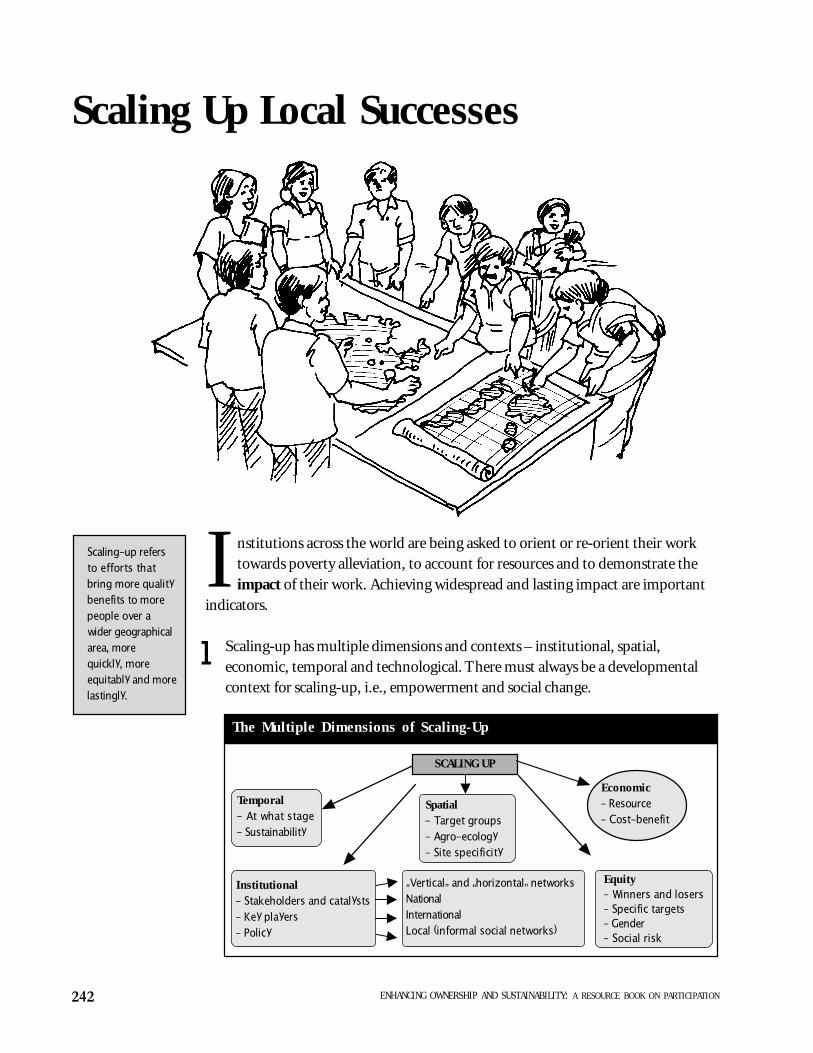
nstitutions across the world are being asked to orient or re-orient their worktowards poverty alleviation, to account for resources and to demonstrate theimpact of their work. Achieving widespread and lasting impact are important
indicators.
Scaling-up has multiple dimensions and contexts – institutional, spatial,economic, temporal and technological. There must always be a developmentalcontext for scaling-up, i.e., empowerment and social change.
Scaling-up refersto efforts thatbring more qualitybenefits to morepeople over awider geographicalarea, morequickly, moreequitably and morelastingly.
SCALING UP
Temporal- At what stage- Sustainability
Spatial- Target groups- Agro-ecology- Site specificity
Economic- Resource- Cost-benefit
Institutional- Stakeholders and catalysts- Key players- Policy
�Vertical� and �horizontal� networksNationalInternationalLocal (informal social networks)
Equity- Winners and losers- Specific targets- Gender- Social risk
The Multiple Dimensions of Scaling-Up
I1
243Scaling Up Local Successes
Scaling-up involves a learning and a participatory process and is about people. Because of thedevelopment and political contexts of going to scale, there is often a potential tension betweenparticipation and scaling-up.
The technology, the process and the institutional/methodological and policy innovations all gotogether (are integrated) in the scaling-up effort. The degree by which any of these are scaled up varieshowever, depending on the major concern/activity at each stage of the scaling-up process.
It is not technologies that are scaled up but processes and principles behind the technologies/innovations.This is consistent with the belief that scaling-up is not just replication, but involves adaptation andlearning.
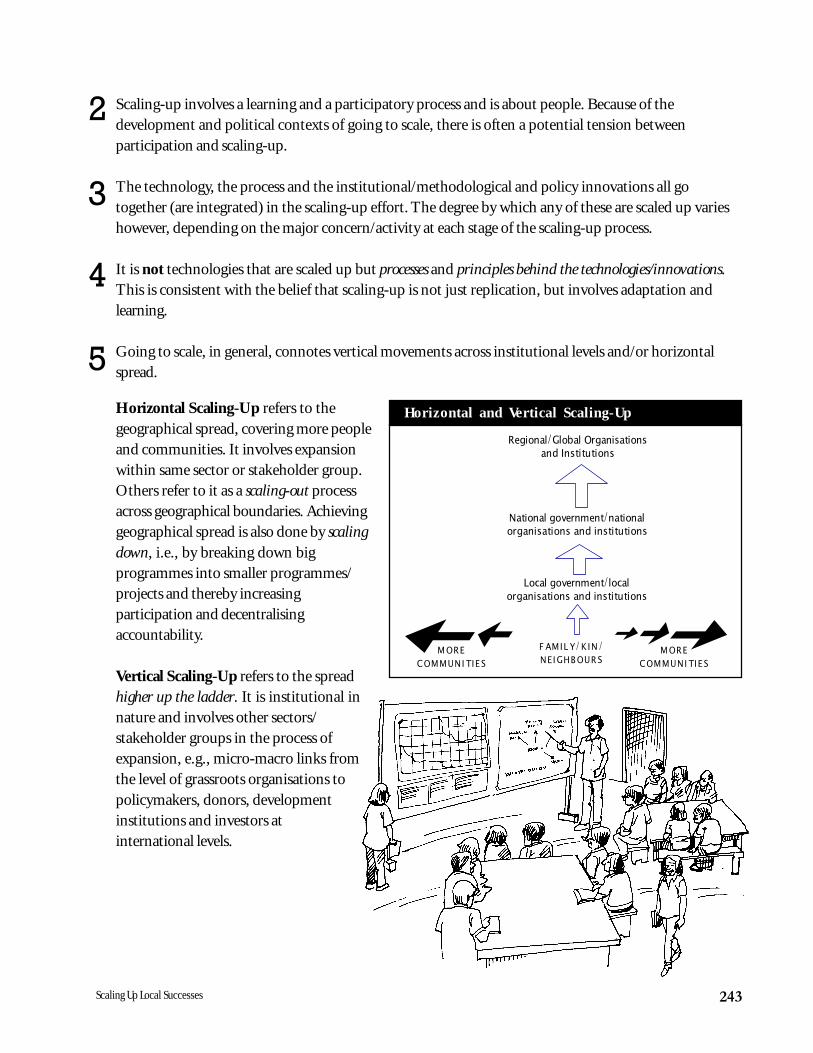
Going to scale, in general, connotes vertical movements across institutional levels and/or horizontalspread.
Horizontal Scaling-Up refers to thegeographical spread, covering more peopleand communities. It involves expansionwithin same sector or stakeholder group.Others refer to it as a scaling-out processacross geographical boundaries. Achievinggeographical spread is also done by scalingdown, i.e., by breaking down bigprogrammes into smaller programmes/projects and thereby increasingparticipation and decentralisingaccountability.
Vertical Scaling-Up refers to the spreadhigher up the ladder. It is institutional innature and involves other sectors/stakeholder groups in the process ofexpansion, e.g., micro-macro links fromthe level of grassroots organisations topolicymakers, donors, developmentinstitutions and investors atinternational levels.
2
3
4
5
FAMILY/KIN/NEIGHBORS
Local Government/LocalOrganizations & Institutions
National Government/NationalOrganizations & Institutions
Regional/GlobalOrganizations & Institutions
MORECOMMUNITIES
MORECOMMUNITIES
Local government/localorganisations and institutions
National government/nationalorganisations and institutions
Regional/Global Organisationsand Institutions
MORECOMMUNITIES
MORECOMMUNITIES
FAMILY/KIN/NEIGHBOURS
Horizontal and Vertical Scaling-Up

244 ENHANCING OWNERSHIP AND SUSTAINABILITY: A RESOURCE BOOK ON PARTICIPATION
The higher up the institutional levels (vertical scaling-up), the greater the chances for horizontal spread;likewise, the farther geographically (horizontal scaling-up), the greater the chances of influencing thoseat the higher levels.
While these institutional and spatial/geographic dimensions normally are central to the discussions andstrategies for going to scale, other aspects have been recognised as critical and integral to the wholeprocess and cannot be treated in isolation. These are the technological, economic, temporal and equityaspects.
Scaling-up is really about communicating options to people. However, we need to balance theintroduction of options with efforts to nurture farmers’ ability to adapt. We also need to nurture localcapacities to make better decisions.
Scaling-up almost always has a “power” and adevelopment dimension – of contributing to socialchange and people’s empowerment. Benefits accrue todifferent actors at different levels of the process.Scaling-up therefore should be a subset of (orsupportive of ) people’s movements, where the drivingforce can come from either the recipient (demand-driven) or from groups convincing the recipient(supply-driven).
6
7
8
9Power or the ability to influence decisionsdetermines what is scaled up. It is often theconcerns of the more influential block that getscaled up. This dominant block could bethe policy-makers, the aid supporters,the privileged professionals (researchers,scientists, academics, extensionists, etc.)or the local people themselves who areable to organise and position themselvesstrategically. If the overall context ofscaling-up is bringing development tothe poor, then people�s empowerment isa critical dimension in the process.
245Scaling Up Local Successes
Building the capacity to innovate in order to facilitate local adaptation to changes is important tothe scaling-up process. As such, scaling-up is integral to (and a stage in) the adaptive/active learningprocess – the learning to expand stage of the learning process approach to programme developmentas described by David Korten (see box below). The learning process approach to programdevelopment proceeds through the three stages, with each stage involving a different learning task,e.g., effectiveness, efficiency and expansion.
Participation of farmers and technicians in a processof exchange of knowledge, experimentation andadaptation strengthens local capacity toinnovate. It is this participation whichleads to success in local development.
Scaling up this process of strengtheninginnovative capacity assures sustainabilitybecause of an improved capacity to adjust tochanging conditions (e.g., when the currenttechnology is no longer appropriate).
10
11
12
Time
PE
R
F
O
R
M
A
N
CE
LOW
HIGH
EFFECTIVENESS EFFICIENCYEXPANSION
INITIATION
TRANSITI
ON
TRANSITI
ON
MATURITY
Stage 1:Learning tobe Effective
Stage 2: Learning tobe Efficient
Stage 3: Learning toEXPAND
The Learning Process Approach
HIGH
PERFORMANCE
LOW
INITIATION
Stage 1:Learning tobe effective
Effectiveness
TRANSITION
TRANSITION
MATURITY
Stage 2:Learning to be efficient
Stage 3:Learning to expand
Time
EfficiencyExpansion
The program learning curves where it is expected that (i) some effectiveness will be sacrificed for efficiency and expansionand (ii) efficiency will likely suffer with expansion due to trade-offs with expansion requirements.
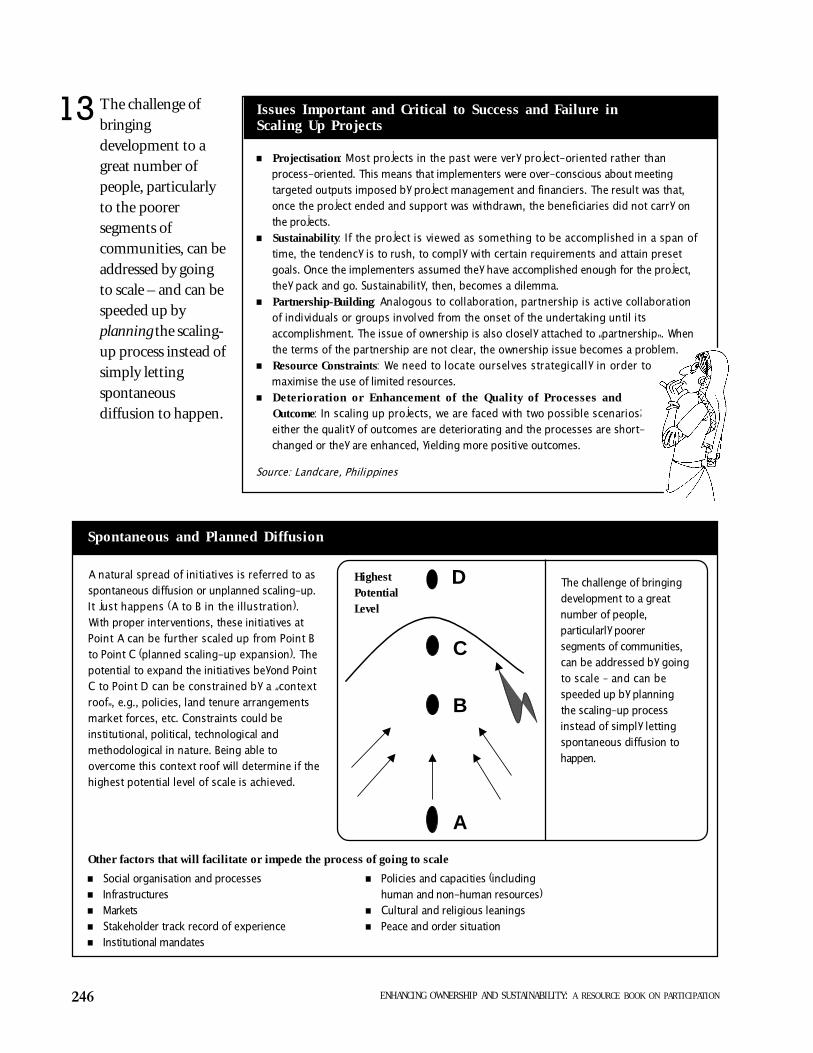
246 ENHANCING OWNERSHIP AND SUSTAINABILITY: A RESOURCE BOOK ON PARTICIPATION
The challenge ofbringingdevelopment to agreat number ofpeople, particularlyto the poorersegments ofcommunities, can beaddressed by goingto scale – and can bespeeded up byplanning the scaling-up process instead ofsimply lettingspontaneousdiffusion to happen.
n Social organisation and processesn Infrastructuresn Marketsn Stakeholder track record of experiencen Institutional mandates
Other factors that will facilitate or impede the process of going to scale
A natural spread of initiatives is referred to asspontaneous diffusion or unplanned scaling-up.It just happens (A to B in the illustration).With proper interventions, these initiatives atPoint A can be further scaled up from Point Bto Point C (planned scaling-up expansion). Thepotential to expand the initiatives beyond PointC to Point D can be constrained by a �contextroof�, e.g., policies, land tenure arrangementsmarket forces, etc. Constraints could beinstitutional, political, technological andmethodological in nature. Being able toovercome this context roof will determine if thehighest potential level of scale is achieved.
The challenge of bringingdevelopment to a greatnumber of people,particularly poorersegments of communities,can be addressed by goingto scale � and can bespeeded up by planningthe scaling-up processinstead of simply lettingspontaneous diffusion tohappen.
A
B
C
DHighestPotentialLevel
Spontaneous and Planned Diffusion
n Policies and capacities (includinghuman and non-human resources)
n Cultural and religious leaningsn Peace and order situation
13 Issues Important and Critical to Success and Failure inScaling Up Projects
n Projectisation: Most projects in the past were very project-oriented rather thanprocess-oriented. This means that implementers were over-conscious about meetingtargeted outputs imposed by project management and financiers. The result was that,once the project ended and support was withdrawn, the beneficiaries did not carry onthe projects.
n Sustainability: If the project is viewed as something to be accomplished in a span oftime, the tendency is to rush, to comply with certain requirements and attain presetgoals. Once the implementers assumed they have accomplished enough for the project,they pack and go. Sustainability, then, becomes a dilemma.
n Partnership-Building: Analogous to collaboration, partnership is active collaborationof individuals or groups involved from the onset of the undertaking until itsaccomplishment. The issue of ownership is also closely attached to �partnership�. Whenthe terms of the partnership are not clear, the ownership issue becomes a problem.
n Resource Constraints: We need to locate ourselves strategically in order tomaximise the use of limited resources.
n Deterioration or Enhancement of the Quality of Processes andOutcome: In scaling up projects, we are faced with two possible scenarios;either the quality of outcomes are deteriorating and the processes are short-changed or they are enhanced, yielding more positive outcomes.
Source: Landcare, Philippines
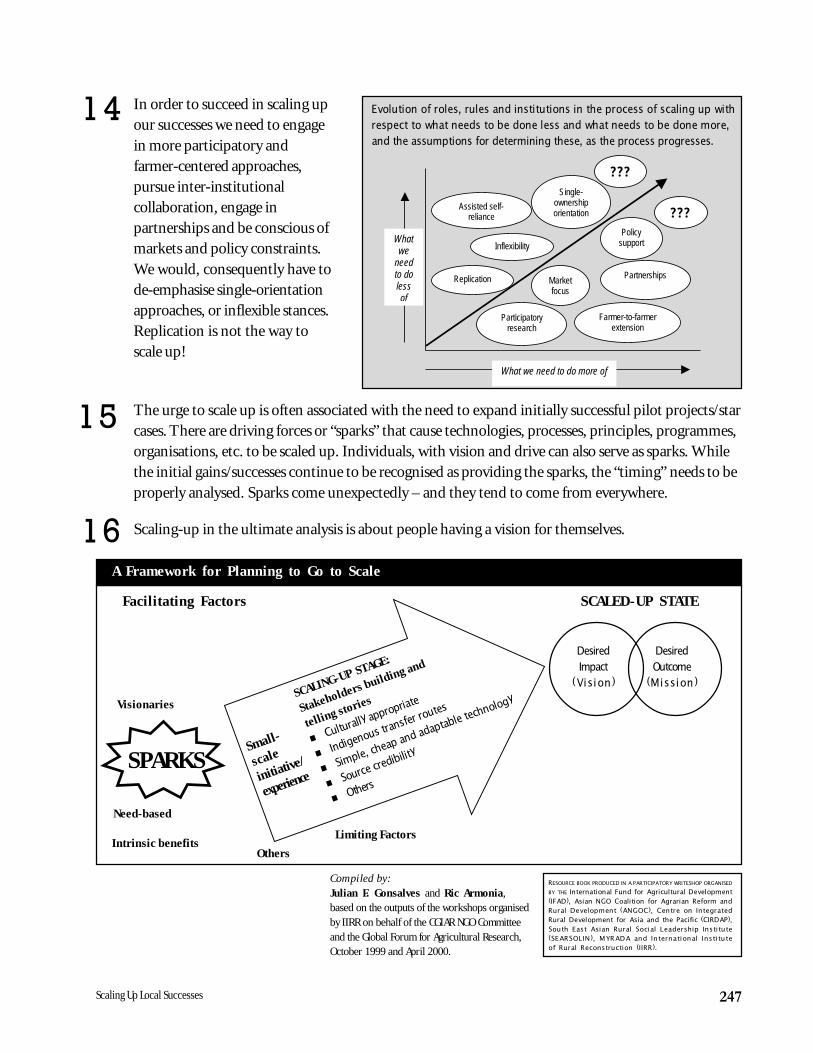
247Scaling Up Local Successes
In order to succeed in scaling upour successes we need to engagein more participatory andfarmer-centered approaches,pursue inter-institutionalcollaboration, engage inpartnerships and be conscious ofmarkets and policy constraints.We would, consequently have tode-emphasise single-orientationapproaches, or inflexible stances.Replication is not the way toscale up!
A Framework for Planning to Go to Scale
The urge to scale up is often associated with the need to expand initially successful pilot projects/starcases. There are driving forces or “sparks” that cause technologies, processes, principles, programmes,organisations, etc. to be scaled up. Individuals, with vision and drive can also serve as sparks. Whilethe initial gains/successes continue to be recognised as providing the sparks, the “timing” needs to beproperly analysed. Sparks come unexpectedly – and they tend to come from everywhere.
Scaling-up in the ultimate analysis is about people having a vision for themselves.
Compiled by:Julian F. Gonsalves and Ric Armonia,based on the outputs of the workshops organisedby IIRR on behalf of the CGIAR NGO Committeeand the Global Forum for Agricultural Research,October 1999 and April 2000.
SCALED-UP STATE
DesiredImpact
(Vision)
DesiredOutcome
(Mission)
SPARKS
SCALING-UP STAGE:
Stakeholders building and
telling stories
nCulturally appropriate
nIndigenous tra
nsfer routes
nSimple, cheap and adaptable technology
nSource credibility
nOthers
Small-
scale
initiative/
experience
Facilitating Factors
Visionaries
Need-based
Intrinsic benefitsOthers
Limiting Factors
14
15
16
Whatwe
needto dolessof
What we need to do more of
Single-ownershiporientation
Inflexibility
Replication
Assisted self-reliance
Policysupport
PartnershipsMarketfocus
Participatoryresearch
Farmer-to-farmerextension
???
???
Evolution of roles, rules and institutions in the process of scaling up withrespect to what needs to be done less and what needs to be done more,and the assumptions for determining these, as the process progresses.
RESOURCE BOOK PRODUCED IN A PARTICIPATORY WRITESHOP ORGANISED
BY THE International Fund for Agricultural Development(IFAD), Asian NGO Coalition for Agrarian Reform andRural Development (ANGOC), Centre on IntegratedRural Development for Asia and the Pacific (CIRDAP),South East Asian Rural Social Leadership Institute(SEARSOLIN), MYRADA and International Instituteof Rural Reconstruction (IIRR).
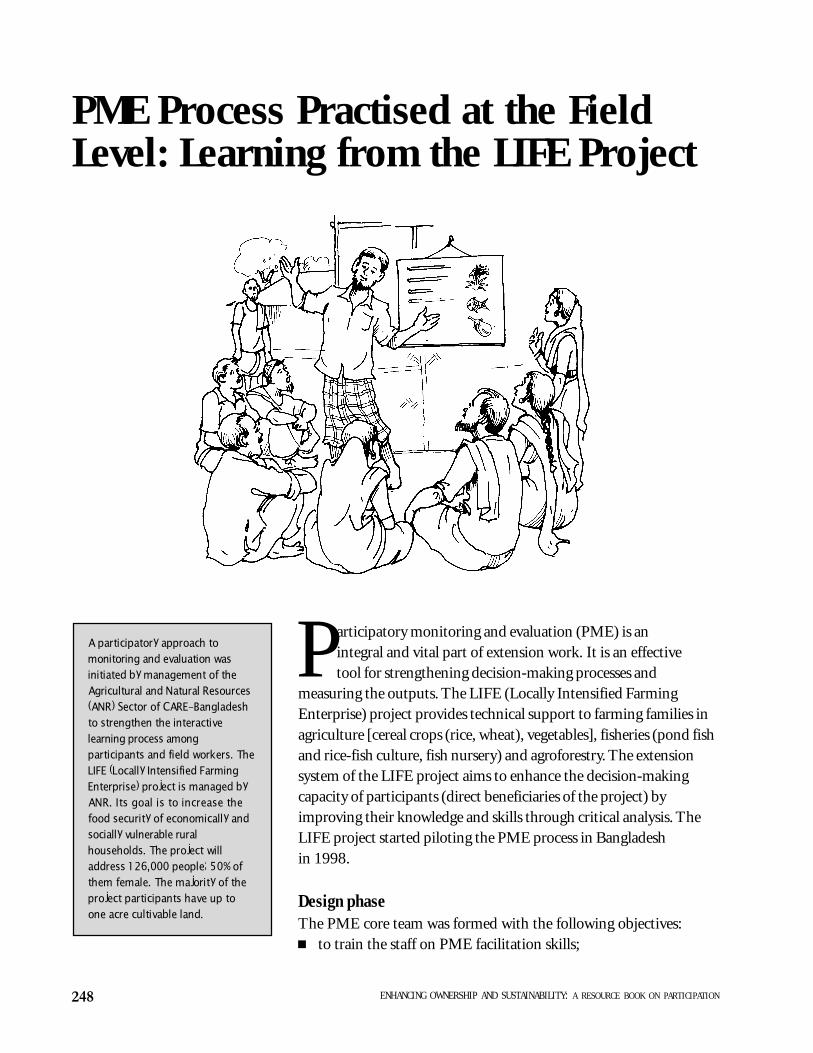
248 ENHANCING OWNERSHIP AND SUSTAINABILITY: A RESOURCE BOOK ON PARTICIPATION
articipatory monitoring and evaluation (PME) is anintegral and vital part of extension work. It is an effectivetool for strengthening decision-making processes and
measuring the outputs. The LIFE (Locally Intensified FarmingEnterprise) project provides technical support to farming families inagriculture [cereal crops (rice, wheat), vegetables], fisheries (pond fishand rice-fish culture, fish nursery) and agroforestry. The extensionsystem of the LIFE project aims to enhance the decision-makingcapacity of participants (direct beneficiaries of the project) byimproving their knowledge and skills through critical analysis. TheLIFE project started piloting the PME process in Bangladeshin 1998.
Design phaseThe PME core team was formed with the following objectives:n to train the staff on PME facilitation skills;
PME Process Practised at the FieldLevel: Learning from the LIFE Project
A participatory approach tomonitoring and evaluation wasinitiated by management of theAgricultural and Natural Resources(ANR) Sector of CARE-Bangladeshto strengthen the interactivelearning process amongparticipants and field workers. TheLIFE (Locally Intensified FarmingEnterprise) project is managed byANR. Its goal is to increase thefood security of economically andsocially vulnerable ruralhouseholds. The project willaddress 126,000 people; 50% ofthem female. The majority of theproject participants have up toone acre cultivable land.
P
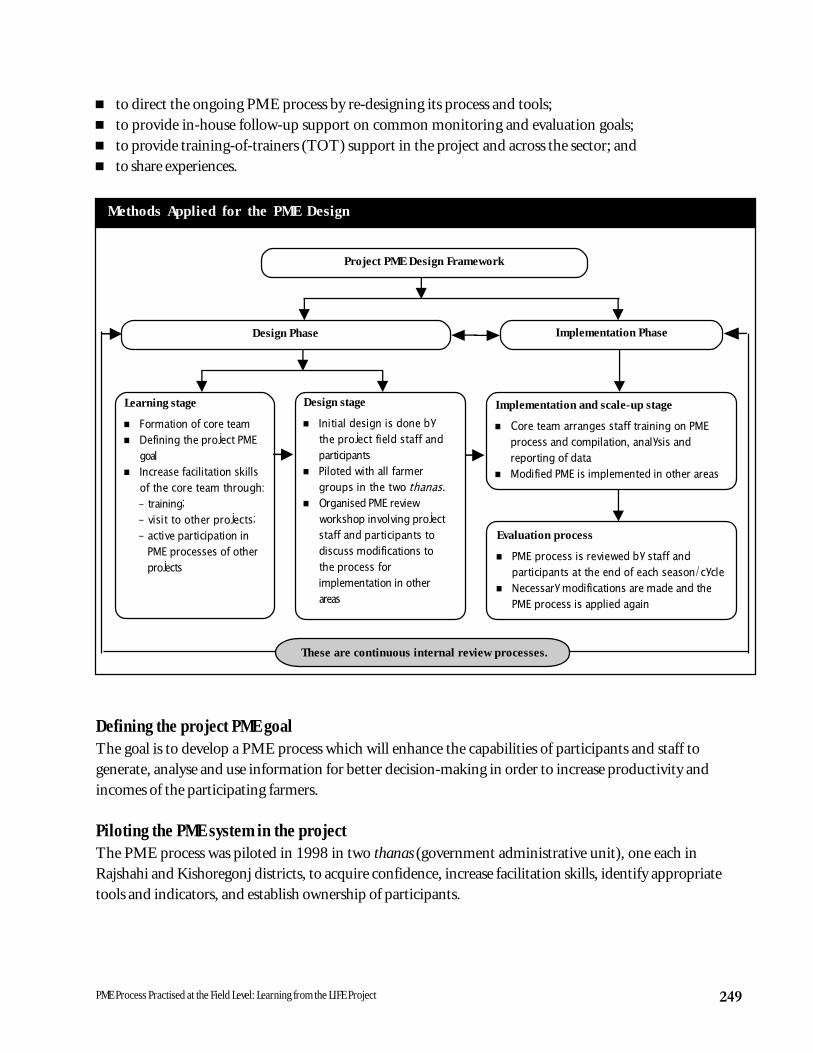
249PME Process Practised at the Field Level: Learning from the LIFE Project
n to direct the ongoing PME process by re-designing its process and tools;n to provide in-house follow-up support on common monitoring and evaluation goals;n to provide training-of-trainers (TOT) support in the project and across the sector; andn to share experiences.
Defining the project PME goalThe goal is to develop a PME process which will enhance the capabilities of participants and staff togenerate, analyse and use information for better decision-making in order to increase productivity andincomes of the participating farmers.
Piloting the PME system in the projectThe PME process was piloted in 1998 in two thanas (government administrative unit), one each inRajshahi and Kishoregonj districts, to acquire confidence, increase facilitation skills, identify appropriatetools and indicators, and establish ownership of participants.
Methods Applied for the PME Design
Project PME Design Framework
Design Phase Implementation Phase
Learning stage
n Formation of core teamn Defining the project PME
goaln Increase facilitation skills
of the core team through:- training;- visit to other projects;- active participation in
PME processes of otherprojects
Design stage
n Initial design is done bythe project field staff andparticipants
n Piloted with all farmergroups in the two thanas.
n Organised PME reviewworkshop involving projectstaff and participants todiscuss modifications tothe process forimplementation in otherareas
Implementation and scale-up stage
n Core team arranges staff training on PMEprocess and compilation, analysis andreporting of data
n Modified PME is implemented in other areas
Evaluation process
n PME process is reviewed by staff andparticipants at the end of each season/cycle
n Necessary modifications are made and thePME process is applied again
These are continuous internal review processes.
250 ENHANCING OWNERSHIP AND SUSTAINABILITY: A RESOURCE BOOK ON PARTICIPATION
The central QuEST team (Quantitative/Qualitative Evaluation Strengthening Team) of ANR assisted theproject core team in providing training, communicating and sharing different issues and ideas/experienceson the PME process of different projects.
During the annual review of the pilot PME process, the team observed that the system is complex andtime consuming. During the pilot phase, all components/ interventions had been included in PME,incorporating both quantitative and qualitative data. It was difficult to accomplish all components in onesession and to understand all indicators and tools. Based on these observations, the PME processwas simplified.
PME has increased farmers’ analytical skills. They can now analyse problems and project activities morecritically. PME has also increased farmers’ confidence and ownership of the project activities.
Implementation phase
Expansion strategyIn 1999, the project was scaled up in 6 thanas (3 thanas in each of the two districts). A staff-to-stafftraining strategy was followed to build staff capacity in PME practice. Also, cross visits were arranged tolearn from other project PME sessions.
Information flowA bottom-up approach to information flow is established in order to maximise use of information fordecision-making at all levels. Data are analysed at the farmer group level during the PME session. Thenthey are compiled at the thana level and a report is prepared. The data are again compiled at the districtlevel, then the final report is prepared, and shared at all levels.
Process review and evaluationAn annual review of PME activities involving different stakeholders isconducted to find out how to improve the quality and articulate futuredirections of PME practices. An internal review process is establishedto institutionalise the PME process. Through this review, participantsshare their experiences and identify successes and mistakes. Thus,learning opportunities are created at all levels. This process of reviewand evaluation is practised regularly to bring qualitative improvementin the PME process.
PME at the Field LevelParticipants use PME to articulate their existing situation. The PME cycle follows the aman (July-December) and boro (January-June) seasons. The project baseline is conducted once for each group offarmers, both male and female. Each group of farmers is provided with one year support and a new group
When one group in Rajshahi wasasked how the PME sessionbenefited them, farmersresponded that in thepast they had neverdiscussed theirproblems in a group.
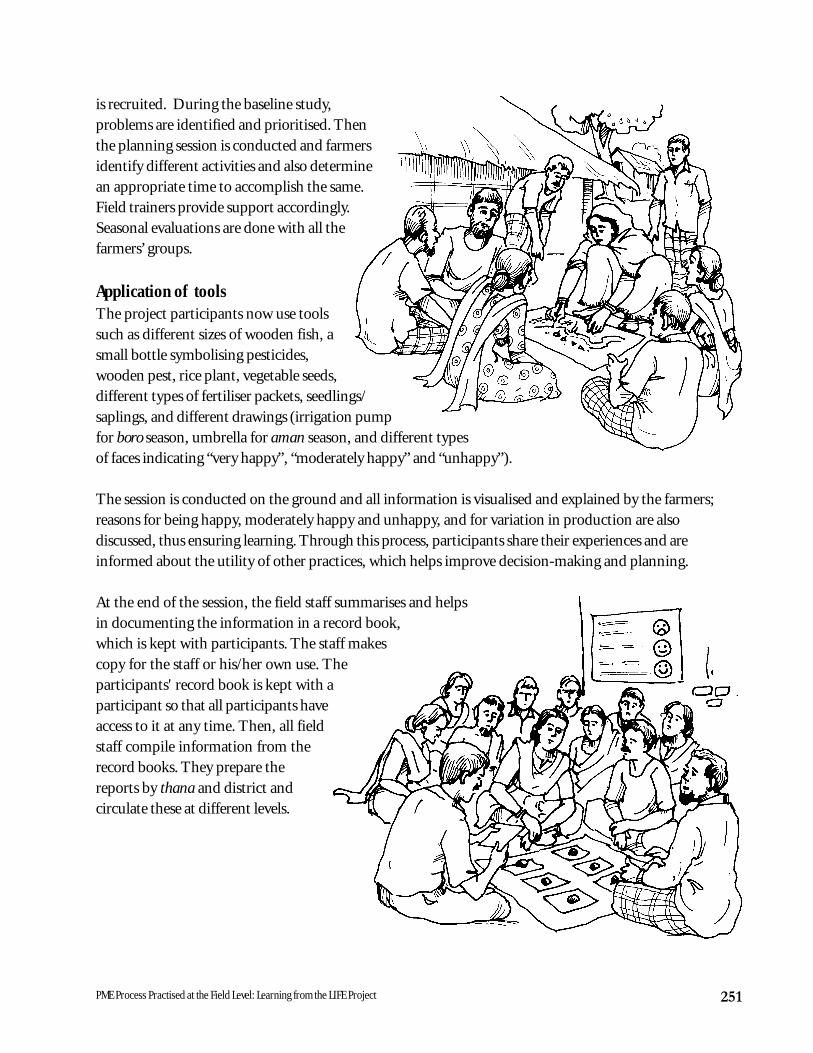
251PME Process Practised at the Field Level: Learning from the LIFE Project
is recruited. During the baseline study,problems are identified and prioritised. Thenthe planning session is conducted and farmersidentify different activities and also determinean appropriate time to accomplish the same.Field trainers provide support accordingly.Seasonal evaluations are done with all thefarmers’ groups.
Application of toolsThe project participants now use toolssuch as different sizes of wooden fish, asmall bottle symbolising pesticides,wooden pest, rice plant, vegetable seeds,different types of fertiliser packets, seedlings/saplings, and different drawings (irrigation pumpfor boro season, umbrella for aman season, and different typesof faces indicating “very happy”, “moderately happy” and “unhappy”).
The session is conducted on the ground and all information is visualised and explained by the farmers;reasons for being happy, moderately happy and unhappy, and for variation in production are alsodiscussed, thus ensuring learning. Through this process, participants share their experiences and areinformed about the utility of other practices, which helps improve decision-making and planning.
At the end of the session, the field staff summarises and helpsin documenting the information in a record book,which is kept with participants. The staff makescopy for the staff or his/her own use. Theparticipants' record book is kept with aparticipant so that all participants haveaccess to it at any time. Then, all fieldstaff compile information from therecord books. They prepare thereports by thana and district andcirculate these at different levels.
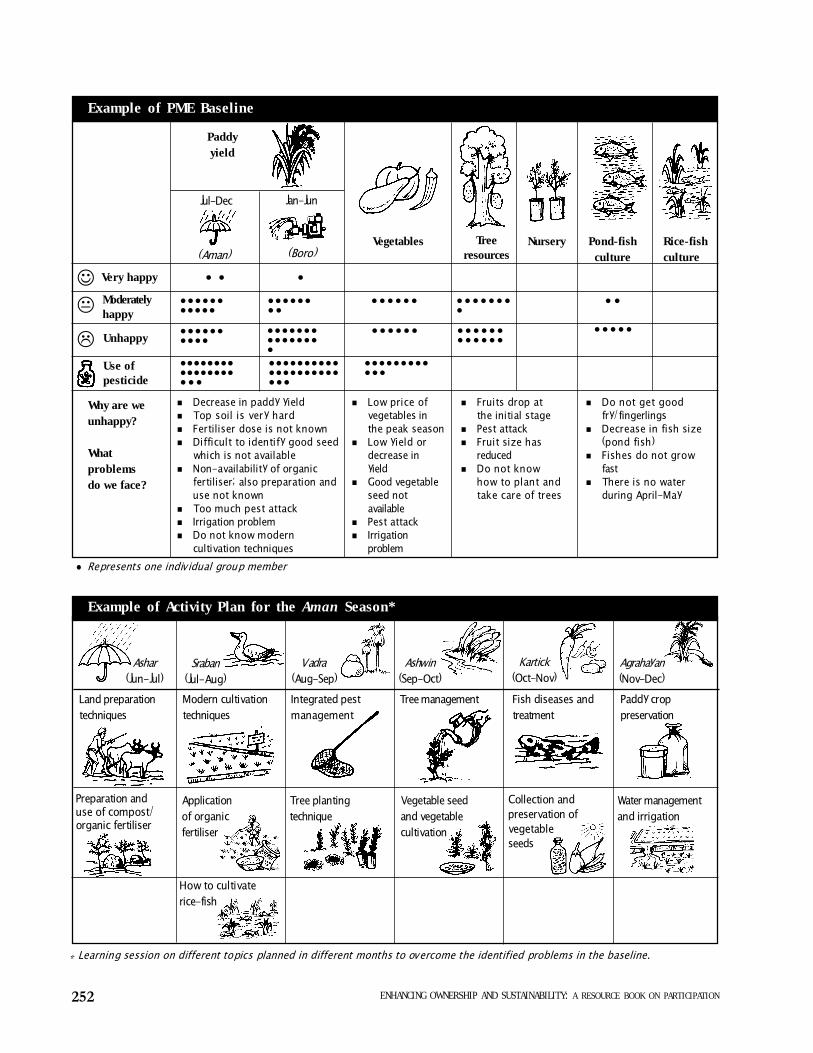
252 ENHANCING OWNERSHIP AND SUSTAINABILITY: A RESOURCE BOOK ON PARTICIPATION
Paddyyield
Jan-Jun
(Boro)
Jul-Dec
(Aman)Vegetables Tree
resourcesNursery Pond-fish
cultureRice-fishculture
Very happyJ l l l
ModeratelyhappyK llllll
llllllllllll l
UnhappyLllllllllll
Use ofpesticide
lllllllllllllllll l l
lllllllllllllll
lllllllllllllllllllllll
l l l l l l
l l l l l l
llllllllllll
l l l l l l ll
l l l l l ll l l l l l
l l
l l l l l
Why are weunhappy?
Whatproblemsdo we face?
n Decrease in paddy yieldn Top soil is very hardn Fertiliser dose is not knownn Difficult to identify good seed
which is not availablen Non-availability of organic
fertiliser; also preparation anduse not known
n Too much pest attackn Irrigation problemn Do not know modern
cultivation techniques
n Low price ofvegetables inthe peak season
n Low yield ordecrease inyield
n Good vegetableseed notavailable
n Pest attackn Irrigation
problem
n Fruits drop atthe initial stage
n Pest attackn Fruit size has
reducedn Do not know
how to plant andtake care of trees
n Do not get goodfry/fingerlings
n Decrease in fish size(pond fish)
n Fishes do not growfast
n There is no waterduring April-May
Example of PME Baseline
Example of Activity Plan for the Aman Season*
Ashar(Jun-Jul)
Sraban(Jul-Aug)
Vadra(Aug-Sep)
Ashwin(Sep-Oct)
Kartick(Oct-Nov)
Agrahayan(Nov-Dec)
Land preparationtechniques
Integrated pestmanagement
Modern cultivationtechniques
Tree management Fish diseases andtreatment
Paddy croppreservation
Preparation anduse of compost/organic fertiliser
Applicationof organicfertiliser
Tree plantingtechnique
Water managementand irrigation
Vegetable seedand vegetablecultivation
Collection andpreservation ofvegetableseeds
How to cultivaterice-fish
* Learning session on different topics planned in different months to overcome the identified problems in the baseline.
l Represents one individual group member

253PME Process Practised at the Field Level: Learning from the LIFE Project
Shortcomings and reliabilityn Qualitative aspects
The current PME design focuses mainly on changes in the status of farmers (evaluated as happy,moderately happy and unhappy) and does not provide detailed data on production, net returns andcost-benefit, etc. However, the PME results meet staff and project partners’ expectations for qualitativeand quantitative considerations as listed in the project logframe.
n Quantitative aspectsAn indepth socio-economic baseline is done to assess the present status thereby facilitating project mid-term and final evaluations. To satisfy the production and cost-benefit information of the logframe, theproject carries out a short sample survey at the end of each season. This also helps cross-check thePME outputs.
n ReliabilityThe participants themselves cross-check when the information is shared in the group. The quantitativesample survey creates scope for cross-checking outputs from the PME process. This ensures thereliability of information.
l l l l l l
l l l l l ll l l l l ll l
l l
l l l l l
l l l l l ll l l l l l
l l
l l l l l l l
l l l l l ll l l l l ll l
l l l l
l l l l l
l l l
n Seed was not goodn Old paddy seedlingsn Crop management delayedn Too much pest attackn Fertiliser could not be
applied in time
n Too much pestattack ineggplant
n Seed was notgood (poorgermination)
n Scarcity of water
n Tree seedlingsdid not survive
n High moisture inthe soil
n Poor waterquality
n Fish growthwas unsatis-factory
l l l l
l l l l
l l
l l l l l ll l
l l l l
n Fishescaped
n Fish size issmall
n Rice yieldwas poordue topest attack
Paddyyield
Jan-Jun
(Boro)
Jul-Dec
(Aman)Vegetables Tree
resourcesNursery Pond-fish
cultureRice-fishculture
Very happyJModeratelyhappyK
UnhappyLUse ofpesticide
Why are weunhappy?
Whatproblemsdo we face?
Example of PME at the end of Aman Season
l Represents one individual group member
254 ENHANCING OWNERSHIP AND SUSTAINABILITY: A RESOURCE BOOK ON PARTICIPATION
Lessons Learned
Participants leveln Builds farmers’ confidence and enhances knowledge of and ability to use PME tools.n Improves data reliability.n Enhances problem identification skills.n Through increased sharing, involvement of participants in different project activities increases.n Ensures active participation.n Creates team spirit and builds group dynamism.
Staff leveln Project staff need good facilitation skills and technical knowledge.n Staff are able to identify community problems and plan to address those.n Analytical skills of staff increases.n Resistance is often encountered from staff initially, due to lack of clear understanding of the value of
the PME process. The attitude changes when the benefit of the process is realised.
Tools and indicatorsn Identification of appropriate tools and indicators is not easy. Moreover indicators identified by the
project staff are often not acceptable to the participants.n Tools need to be modified continuously.n Tactile tools are more acceptable and effective than visual tools.
Processn PME design should be flexible and adaptive.n During the rainy season, it is difficult to find a comfortable place to conduct the PME session.n Adoption of the process in the initial stage takes considerable time.n It helps to develop analytical skills.n Frequent review is required to strengthen the PME process.n PME enables reflection on the extension process and management.n PME creates opportunities to check reliability of the information.n Institutionalising the PME process takes time. The process has not yet been fully institutionalised
particularly at the farmers’ level; appropriate follow-up mechanisms could not be established. Yet, thefield staff consider the “go slow strategy” to be good for beginners as it takes time to win the confidenceof the participants and to establish a good process.
The PME process follows the “apply-learn-apply” mode andcontributes to the extension process of the project. PME creates anopportunity for interactive learning as it is designed and practised byand for the participants, according to their conditions and needs. Theproject staff also benefits through implementation exchange. They canunderstand both the needs of the participants and the effectiveness ofextension activities, leading to a more farmer-led extension approach.
Prepared by:Jagannath Kumar Dutta
RESOURCE BOOK PRODUCED IN A PARTICIPATORY WRITESHOP ORGANISED
BY THE International Fund for Agricultural Development(IFAD), Asian NGO Coalition for Agrarian Reform andRural Development (ANGOC), Centre on IntegratedRural Development for Asia and the Pacific (CIRDAP),South East Asian Rural Social Leadership Institute(SEARSOLIN), MYRADA and International Instituteof Rural Reconstruction (IIRR).
255Building Participation into Benefit-Cost Analysis
Building Participation intoBenefit-Cost Analysis
roject benefits and costs can be calculated at the aggregate level, using a full-fledged benefit-costanalysis (BCA), or at the disaggregated level of project activities (to choose between severalalternative options). But the latter is hardly ever done, and the former is usually done in an isolated
and non-participatory manner. Yet, a participatory study of project benefits and costs can yield usefulinformation from which the entire project team can benefit. To exploit its full potential, however, projectmanagement and project economists need to address the analysis differently.
Participation in the analysis of project benefits and costs can be increased in two ways: by discussing andpresenting the aggregate BCA to project (design or implementation) team members; and by discussing thepotential costs and benefits of different (technical or institutional) options with communities.
P
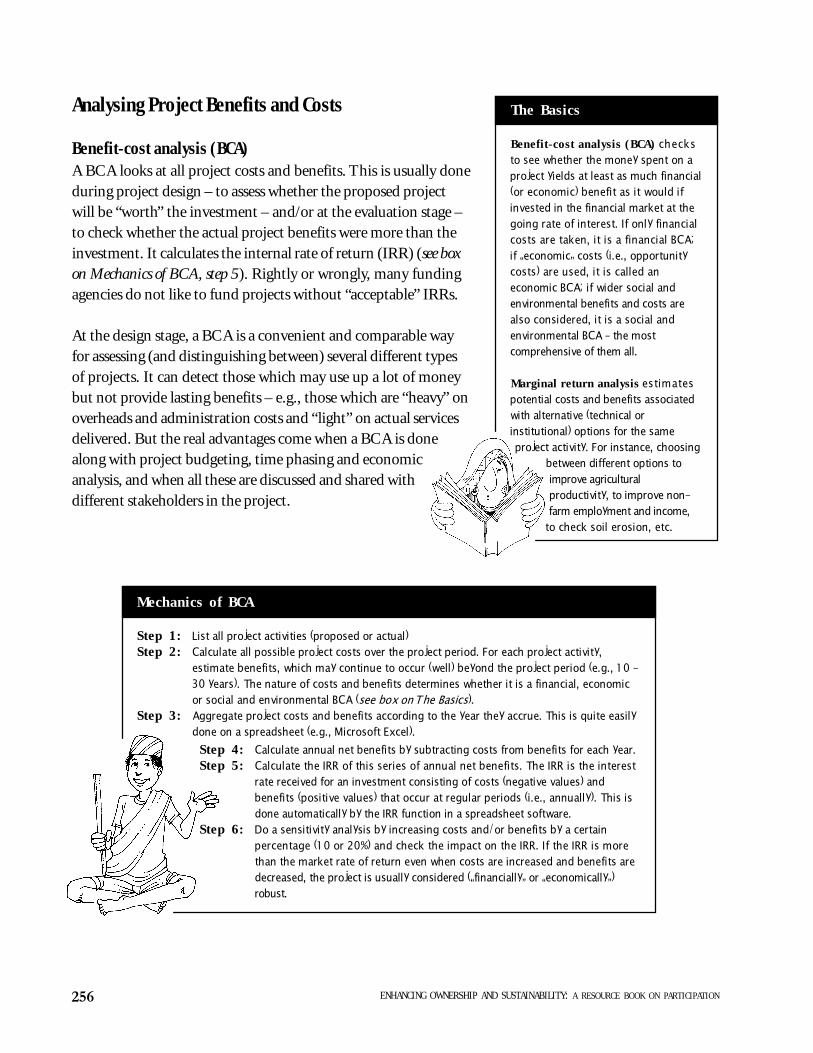
256 ENHANCING OWNERSHIP AND SUSTAINABILITY: A RESOURCE BOOK ON PARTICIPATION
Analysing Project Benefits and Costs
Benefit-cost analysis (BCA)A BCA looks at all project costs and benefits. This is usually doneduring project design – to assess whether the proposed projectwill be “worth” the investment – and/or at the evaluation stage –to check whether the actual project benefits were more than theinvestment. It calculates the internal rate of return (IRR) (see boxon Mechanics of BCA, step 5). Rightly or wrongly, many fundingagencies do not like to fund projects without “acceptable” IRRs.
At the design stage, a BCA is a convenient and comparable wayfor assessing (and distinguishing between) several different typesof projects. It can detect those which may use up a lot of moneybut not provide lasting benefits – e.g., those which are “heavy” onoverheads and administration costs and “light” on actual servicesdelivered. But the real advantages come when a BCA is donealong with project budgeting, time phasing and economicanalysis, and when all these are discussed and shared withdifferent stakeholders in the project.
The Basics
Benefit-cost analysis (BCA) checksto see whether the money spent on aproject yields at least as much financial(or economic) benefit as it would ifinvested in the financial market at thegoing rate of interest. If only financialcosts are taken, it is a financial BCA;if �economic� costs (i.e., opportunitycosts) are used, it is called aneconomic BCA; if wider social andenvironmental benefits and costs arealso considered, it is a social andenvironmental BCA � the mostcomprehensive of them all.
Marginal return analysis estimatespotential costs and benefits associatedwith alternative (technical orinstitutional) options for the sameproject activity. For instance, choosing
between different options toimprove agriculturalproductivity, to improve non-farm employment and income,
to check soil erosion, etc.
Mechanics of BCA
Step 1: List all project activities (proposed or actual)Step 2: Calculate all possible project costs over the project period. For each project activity,
estimate benefits, which may continue to occur (well) beyond the project period (e.g., 10 -30 years). The nature of costs and benefits determines whether it is a financial, economicor social and environmental BCA (see box on The Basics).
Step 3: Aggregate project costs and benefits according to the year they accrue. This is quite easilydone on a spreadsheet (e.g., Microsoft Excel).
Step 4: Calculate annual net benefits by subtracting costs from benefits for each year.Step 5: Calculate the IRR of this series of annual net benefits. The IRR is the interest
rate received for an investment consisting of costs (negative values) andbenefits (positive values) that occur at regular periods (i.e., annually). This isdone automatically by the IRR function in a spreadsheet software.
Step 6: Do a sensitivity analysis by increasing costs and/or benefits by a certainpercentage (10 or 20%) and check the impact on the IRR. If the IRR is morethan the market rate of return even when costs are increased and benefits aredecreased, the project is usually considered (�financially� or �economically�)robust.
257Building Participation into Benefit-Cost Analysis
Marginal Return AnalysisAt a more disaggregated level, benefits and costs can be estimatedfor individual project activities, to compare and choose betweenalternative options. This analysis calculates the (potential)marginal rate of return from each alternative option, which isthen added to the social, institutional and technical features of theoption, to permit a more informed choice. Project communitiescan be used as a rich source of information on potential costs andbenefits of each option, and the results can also be shared withthem, to aid participatory decision-making.
How to Make BCA More Participatory
Suggestions for project management
Project designn Involve the economist from the start. It is important to involve the economist from the start of
project design, so that the details and logic of project activities (and their phasing) are clear to her/him.Bringing in the economist at the end can increase information demands on other project members, or,worse, result in a “superficial” BCA with no learning for the project design team.
Such learning could include the following:– deliberate inquiry into the economic dimensions of project components may unearth
contradictions, incompletely considered time lines, mismatches between budget allocations andplanned activity, etc.;
– if the project budget and BCA do not reflect all project components, activities may not translateinto outputs;
Limitations of BCA
n Tends to focus on tangible and monetary benefits and costs: Financial and even economic BCA (i.e.,opportunity cost calculations) are easier to do than social and environmental BCA which calculatesnon-tangible returns to project investment such as capacity-building and �primary� goods likeeducation, health and environmental improvement. Hence, these are often left out ofcalculations, especially if the IRR is acceptable with just the major tangible project benefits.
n Biased against projects where benefits occur later. Because discounting reduces the value ofbenefits that come later, the BCA is biased against projects where costs are incurred quicklyand where benefits take time � such as capacity-building projects, or projects aiming atattitudinal and institutional change.
n Coverage and quality can vary. BCA can be done in �quick and dirty� ways, with heroicassumptions supporting superficial analysis of project benefits and costs. Also, the nature ofbenefits and costs included in the analysis and the extent of their measurement tend to varyaccording to the capability and inclination of the economist.
Benefit-Cost Calculations forBeneficiary Decision-Making
As a part of participatory projectdiagnosis and formulation, an engineerand an economist on an irrigationproject in Guyana worked out the costsand benefits of two alternativeengineering options: only to rehabilitateexisting irrigation channels or to addnew ones also. When presented to thebeneficiary community, it chose thesecond one because of reducedtransport costs. As itturned out, this optionhad the best marginal rateof return.
258 ENHANCING OWNERSHIP AND SUSTAINABILITY: A RESOURCE BOOK ON PARTICIPATION
– many social, technical and institutional problems have aneconomic dimension to them, and many community-levelactions are also driven (and hence constrained) by economicforces. An economic perspective on even seemingly non-economic issues could therefore be useful during teamdiscussions to plan project activities.
n Discuss the BCA with the entire project team. Rather than leavethe economist to produce the “numbers”, the BCA should bediscussed with members of the project (design or implementation)team. This ensures that each project component is understoodclearly by members of the (inter-disciplinary) project team.
n Coordinate the BCA, the budget and the economic analysis.Since all three use the same information, asking the same economist to do all three will save time andalso reduce the risk of communication gaps.
Drip Irrigation in Rajasthan
Project implementationn Assess potential benefits and costs of alternative options. Although engineers can produce cost
estimates of technical options (say, for soil and water conservation measures or irrigation channelroutes), it is useful to exploit the economists’ training and understanding of these potential costs andbenefits. Not only will this ensure that all possible costs and benefits are included, but also that themost appropriate (of several possible) methods has been used to value them.
n Collect economic information in project monitoring and evaluation. If the necessary economicinformation is not collected systematically during the project period, several benefits may not be
Strengths of BCA in Project Design
When farmers removed dripirrigation lines from their fieldsafter two years of use, they werecalled �irrational� and accused ofnot appreciating technologicaladvances in water conservation. Buton inquiry, they explained that thecost of maintaining the drip systemhad simply turned out to bemore than the benefit - aneconomic explanationbehind the manner inwhich technology was used.
n Lists project costs and benefits in one place. The budget and BCA provide two complementary ways ofviewing all the different aspects of a project, including administrative overheads, financing routes, capacity-
building budgets, specific project activities and contributions from other partners. It also brings variousproject components together, grounding them in cost and time lines which are important considerations of
any project. When done in an open and participatory manner, it allows design team members to see how theinstitutional, social and technical features of a project fit together, especially across project phases.
n Clarifies detail. When the project design team is asked to specify time lines and cost details for proposedproject activities, it can make them think a lot deeper about these issues. Often, contradictory assumptionsabout the same issue surface among design team members, prompting useful discussions.
n Provides a clear understanding of cash flows. Costs are important to any project. And, especially whenfunds have to move from one country to another, and at different periods of time, it is important to see howmuch has to move from where, when, how and why. And, so long as banks give interest, money will changevalue over time and it is important to see how this affects project funding.
If done well and in conjunction with project budgeting, time-phasing and economic analysis, the major strengths ofBCA are the following.
259Building Participation into Benefit-Cost Analysis
evaluated by the end-of-project BCA. If so,additional resources may have to be spent tocollect more information, or the BCA may endup being superficial for want of adequateinformation.
n Re-assess benefit-cost situations annually.Replacing assumed annual costs and benefits withactual figures can help assess project progressconstantly, and can help suggest necessarycorrective action.
Project evaluationn Provide all possible information. Complete and up-to-date monitoring and evaluation (M&E)
information about different aspects of project implementation is a considerable help to the economist.Otherwise, the economist has to spend more time chasing information scattered across project officesand files – or worse, in the heads of project team members.
Suggestions for Project Economists
Project designn Discuss issues with other team members. A pre-project economic appraisal is not easy. Secondary
statistics and fieldwork “numbers” need to be interpreted, to gain insights into their causes. Discussingthese may help to clarify the nature of project action – or, in the case of post-project evaluations, eventhe lack of it!
n Discuss each project component thoroughly. Instead of making assumptions about project activitiesand implementation (which may not be always be true) discuss each component with the concernedmember of the design or implementation team. Often, this brings out details that team members mayalready be very familiar with but the economist is unaware of them!
Engineering Costs Versus Economic Costs
Engineers estimate the costs of project structures (e.g.,check dams, school buildings, wells) differently fromeconomists. They either use a fixed cost norm,which sometimes aggregates material and labourcosts, or use only direct (financial) costs.Economists, in contrast, detail all possible costs anduse opportunity costs rather than financial costs.Using an economic perspective and fresh informationcan deal with problems like the minimum wage beinghigher than the local wage, of depreciation ratesbeing different for various components, and of localmaterials being cheaper than �standard� materials.
260 ENHANCING OWNERSHIP AND SUSTAINABILITY: A RESOURCE BOOK ON PARTICIPATION
Timber Versus Non-Timber Benefits fromForests
Although many plantations aim attimber benefits, the fact is thathigh returns 10 or 12 years laterhave a relatively low value aftertime discounting (i.e., Rs. 1million after 10 years is worth justRs. 385,000 today, if discountedat 10%). Instead, it may be notedthat revenues from selling (orcharging for cutting) the grass thatgrows on protected plantations andthe revenues from non-timberforest products comprise the bulkof the present value of forests.
n Analyse even intangible benefits and costs. Listing all potential benefits and costs – whethermeasurable or not – can be useful, if not for the full-fledged BCA, at least for informing project teammembers. Measure all components as fully as possible; today there are a host of valuation techniques toassess social (“soft”) and environmental benefits and costs. Where full evaluation is difficult, cost-effectiveness is a useful option. But if monetary values cannot be estimated for all costs and benefits,make a point of listing these non-monetary costs and benefits in the BCA Report.
n Get first-hand information from the field. Rather than simply asking project team members,government officials or NGO staff, go to the field as much as possible to gain first-hand knowledgeabout different project components. Each project is different and past experience may not always fit thenew case. Combining this information with past knowledge makes analysis easier, more accurate, andhence more meaningful.
n Present the BCA, economic analysis and budget to the entireproject team. Discussing the details of the finished analysis withthe team helps check whether or not different project components'hang together'. If not, more time may have to be spent sorting outcontradictions and problems which are pointed out, one by one, asother team members find time to read and grasp the budget andBCA. Getting project team approval means that they understandand agree with the results - and saves confusion later.
n Write a report. A BCA usually ends up just as a technicalannex in a project proposal document, often leaving out theassumptions made in the analysis. Specifying these details ina short report, written simply and clearly, helps other economists(e.g., doing the BCA at the end of the project) and projectmanagers understand the logic underlying the figures.
Project Implementationn Discuss costs and benefits with the community. When working
out economic benefits and costs for alternative technical options(i.e., their marginal rates of return), it is important to consult thecommunity. Such local information is vital to making realistic andaccurate estimates of the benefits and costs of alternative options.But it is equally important to share the results of these calculationswith the community, to enable them to make informed choices.
n Plan for participatory information collection. Keeping in mindthe need to do a benefit-cost analysis at the end of the project,design an economic information component for the project's
MPA and EconomicInformation
The methodology for participatoryassessments (MPA) [see topic onEnhancing the �Assessment� inParticipatory Assessments on page179] can be useful in collecting the
required economic informationin a participatory manner andon a regular basis. Suchinformation can include
income from agriculture,animal husbandry, non-farmactivities, forestry, etc.
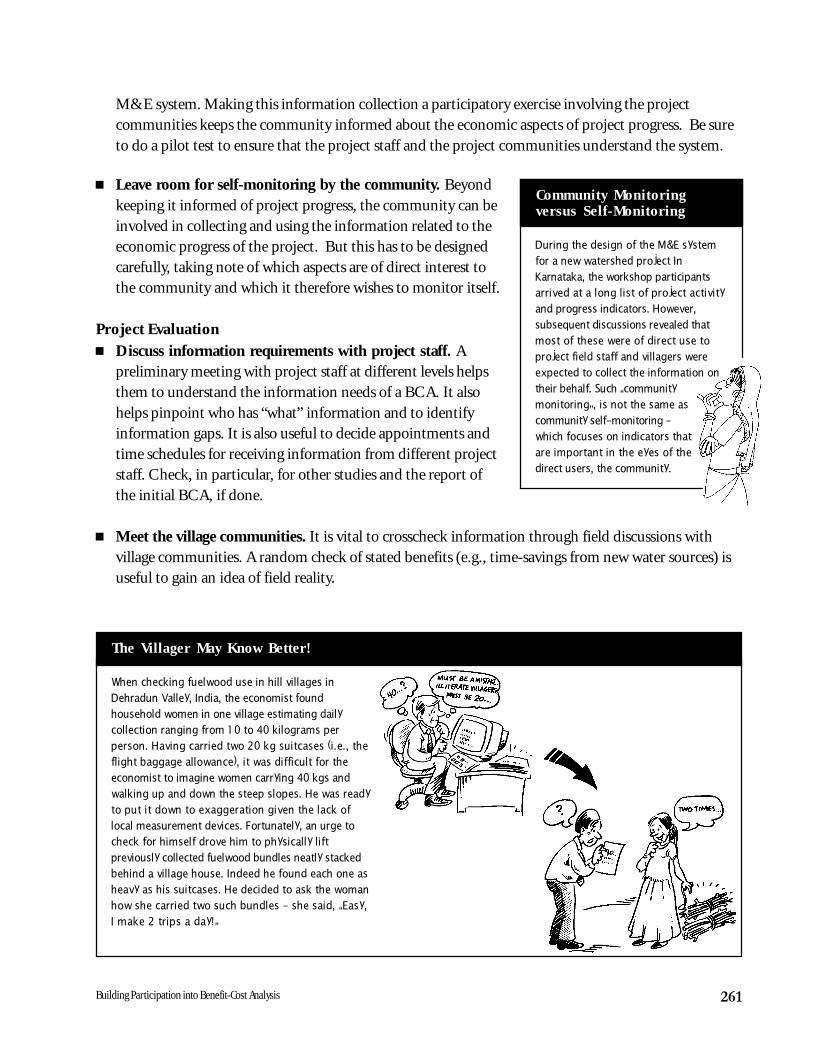
261Building Participation into Benefit-Cost Analysis
M&E system. Making this information collection a participatory exercise involving the projectcommunities keeps the community informed about the economic aspects of project progress. Be sureto do a pilot test to ensure that the project staff and the project communities understand the system.
n Leave room for self-monitoring by the community. Beyondkeeping it informed of project progress, the community can beinvolved in collecting and using the information related to theeconomic progress of the project. But this has to be designedcarefully, taking note of which aspects are of direct interest tothe community and which it therefore wishes to monitor itself.
Project Evaluationn Discuss information requirements with project staff. A
preliminary meeting with project staff at different levels helpsthem to understand the information needs of a BCA. It alsohelps pinpoint who has “what” information and to identifyinformation gaps. It is also useful to decide appointments andtime schedules for receiving information from different projectstaff. Check, in particular, for other studies and the report ofthe initial BCA, if done.
n Meet the village communities. It is vital to crosscheck information through field discussions withvillage communities. A random check of stated benefits (e.g., time-savings from new water sources) isuseful to gain an idea of field reality.
The Villager May Know Better!
When checking fuelwood use in hill villages inDehradun Valley, India, the economist foundhousehold women in one village estimating dailycollection ranging from 10 to 40 kilograms perperson. Having carried two 20 kg suitcases (i.e., theflight baggage allowance), it was difficult for theeconomist to imagine women carrying 40 kgs andwalking up and down the steep slopes. He was readyto put it down to exaggeration given the lack oflocal measurement devices. Fortunately, an urge tocheck for himself drove him to physically liftpreviously collected fuelwood bundles neatly stackedbehind a village house. Indeed he found each one asheavy as his suitcases. He decided to ask the womanhow she carried two such bundles - she said, �Easy,I make 2 trips a day!�
Community Monitoringversus Self-Monitoring
During the design of the M&E systemfor a new watershed project InKarnataka, the workshop participantsarrived at a long list of project activityand progress indicators. However,subsequent discussions revealed thatmost of these were of direct use toproject field staff and villagers wereexpected to collect the information ontheir behalf. Such �communitymonitoring�, is not the same ascommunity self-monitoring �which focuses on indicators thatare important in the eyes of thedirect users, the community.

262 ENHANCING OWNERSHIP AND SUSTAINABILITY: A RESOURCE BOOK ON PARTICIPATION
n Note intangible benefits. Capacity-building and empowerment of village communities are difficult tocheck using conventional input-output M&E information. While most BCA overlook these aspects ofproject impact, it is important to list them in the BCA Report, even if monetary values cannot beattached to them.
n Present and discuss the results. Presenting findings to project staff is useful, not just to clarify issuesand assumptions, but also to enable project staff to better understand the process and the emergingfindings.
n Write clear reports. A thorough, clear and well-written report can be of use not just to projectmanagement, but also to programme managers interested in learning lessons from the assessed project.
Prepared by:A. J. James
RESOURCE BOOK PRODUCED IN A PARTICIPATORY WRITESHOP ORGANISED
BY THE International Fund for Agricultural Development(IFAD), Asian NGO Coalition for Agrarian Reform andRural Development (ANGOC), Centre on IntegratedRural Development for Asia and the Pacific (CIRDAP),South East Asian Rural Social Leadership Institute(SEARSOLIN), MYRADA and International Instituteof Rural Reconstruction (IIRR).