Embed Size (px)
Citation preview

1/20
PARCO CO., LTD.PARCO CO., LTD.
Investor PresentationInvestor Presentation
FY2006 First Half ResultsFY2006 First Half Results
(March 1, 2006(March 1, 2006——August 31, 2006)August 31, 2006)

2/20
Presentation Contents
1. Overview of FY2006 first half results and full-year forecasts
2. Overview of sales in FY2006 first half
3. Update on progress of five-year medium-term management plan

3/20
1. Overview of FY2006 first half results and full-year forecasts

4/20■ FY2006 H1: Consolidated performance
○ Net sales and income both up year-on-year. Increased revenue and income.
FY2006 H1 FY2005 H1 Change: % Change: yen
Change: yen
126,301 2.4%
13.4%
14.7%
16.4%
4,648
2,9913,090
624
4,526 667
1,023
1,093
Interim net income 2,572 2,210 362 2,100 472
Initial forecasts
Net sales 129,391 126,400
Operating income 5,273 4,250
Ordinary income 5,193 4,100
Unit: Million yen
End of FY2006 H1 End of FY2005 Change: %
Change: yen
0.6%
-
(0.4%)
1,059
-
(161)Interest-bearing debt 38,722 38,883
Equity ratio 37.6% 36.7%Market price-based equity ratio 57.3% 57.7%
Debt service coverage ratio 3.5 years 3.2 yearsInterest coverage ratio 19.4 16.6
Total assets 183,440 182,381
Net assets 69,339 66,975
Note: Due to the transfer of its shares on September 5, 2005, HARLEY-DAVIDSON CITY CO., LTD. is included only in the income statements for FY2005 H1.
Unit: Million yen

5/20■ FY2006 H1: Consolidated results by segment○ Shopping Complex Business and Space Engineering and Management Business performing well
FY2006 H1 FY 2005 H1 Change
Net sales 120,868 118,321 2,546Operating income 4,644 4,062 582
Operating income 342 235 107
Operating income 243 92 151
Operating income 49 102 (53)
Operating income 5,280 4,493 787
Operating income (7) 155 (163)
Operating income 5,273 4,648 624
Net sales 140,854 137,114 3,740
Net sales (10,479) (9,926) (552)Eliminations or corporate
Subtotal
Net sales 1,173 1,235 (61)Other business
Shopping complex business
Net sales 8,135 8,033 101
Net sales 10,677 9,524 1,153
Net sales 130,375 127,187 3,187Total
Space engineering and management business
Retail business
Unit: Million yen■ Shopping Complex BusinessSales increased due to remodeling carried out mainly at flagship stores and the changing of the name of PARCO CARD to achieve increased brand identification
■ Retail BusinessNEUVE A CO., LTD. continued its scrap and build policy, opening 7 new stores and closing 3 existing ones. It now has 100 stores spanning 5 sectors
■ Space Engineering and Management BusinessSales were strong at PARCO SPACE SYSTEMS CO., LTD. due to more orders from new customers and increased remodeling of commercial facilities both inside and outside the PARCO group
■ Other BusinessPARCO CITY CO., LTD. increased its non-PARCO group commercial facility clients, and strongly increased income driven by Internet business such as website creation
Note: Figures for net sales by segment include operating revenue.

6/20■ FY2006 H1: Non-consolidated performance; Dividends
○ Net sales and income both up year-on-year. Non-consolidated revenue and income also increased.
Unit: Million yen
FY2006 H1 FY2005 H1 Change: % Initial forecasts
Change: yen
117,234 2.1%
14.4%
18.6%
43.5%
4,017
2,391117,300
3,850
3,798 3,600
744
903
1,880 356Net income 2,236 1,558 678
Change: yen
Net sales 119,691 2,457Operating income 4,594 576
Ordinary income 4,503 705
End of FY2006 H1 End of FY2005 Change:%
Change: yen
0.4%
-
Interest-bearing debt 44,222 44,383 (0.4%) (161)
759
-
Equity ratio 38.4% 37.7%
Total assets 181,251 180,492
Net assets 69,640 68,014
■ Dividends
○ Interim dividend per share up ¥1 to ¥6. Annual dividend of ¥12 planned.

■ FY2006 H1: Consolidated/Non-consolidated Results and Full-year forecasts
7/20
Unit: Million yen
ConsolidatedFY2006
(ending Feb. 2007)revised forecasts
FY2005(ended Feb. 2006)
results
Change:%
Change: yen
Initial forecasts
Change:%
1.2% 1.1%
4.4%
5.6%
5.7%
4.6%
5.9%
6.1%
262,600
9,100
8,900
4,020
3,091
414
520
243
262,408
9,085
8,879
4,006
Change: yen
Net sales 2,900
Operating income
Ordinary income
Net income 4,250 230
400
500
265,500
9,500
9,400
○ Consolidated and non-consolidated net sales and income forecasts revised upwards in line with strong first half performance
Unit: Million yen
Non-consolidatedFY2006
(ending Feb. 2007)revised forecasts
FY2005(ended Feb. 2006)
results
Change:%
Change: yen
Initial forecasts
Change:%
1.1% 1.0%
5.6%
7.2%
0.9%
11.0%
12.0%
Change: yen
14.8%
2,637
842
880
444
Net sales 245,200 242,562 242,700
7,657 8,050
7,650
3,420
7,319
3,005
2,500
Operating income 8,500 450
Ordinary income 8,200 550
Net income3,450 30

8/20
Unit: Million yen
■ FY2006 H1: Sales, general and administrative expenses; Depreciation and amortization expenses; Investment
Consolidated Unit: Billion yen
Amount Change: %
Change: yen Amount Change:
%
(1.2%) (17.6%)
Change: %
(17.9%)
Change: yen
H1 results Total SG&A 14,510
(1.8%)
Change: %
1.0%
2.3%
(174) (0.5) 2.4CapexH1 results
Full-year forecasts Capex
Amount
7.1
Change: yen
(1.5)
Of which, depreciation and amortization
1,907 (35)
Of which, depreciation and amortization
4,036 92
Amount Change: yen
Full-year forecasts Total SG&A 30,689 308
Non-consolidated
(22.2%)
Change: %
(22.1%)
Change: %
(9.4%)
(2.4%)
Change: %
(11.2%)
(3.4%)
Change: %
Full-year forecasts
H1 results
Capex
Capex
6.4
Amount
2.6
Amount
(1.8)
Change: yen
(0.7)
Change: yen
(386)3,730Of which, depreciation and amortization
(226)1,802Of which, depreciation and amortization
Change: yen
Amount
(571)23,266Total SG&AFull-year forecasts
H1 results (391)11,091Total SG&A
Change: yenAmount
Unit: Million yen Unit: Billion yen

9/20
2. Overview of sales in FY2006 first half

10/20■ FY2006 H1 results: Tenant sales by store (slide 1)
10-1/20
○ Year-on-year growth of 2.2%, driven by flagship stores12 stores achieved year-on-year increases
Yellow highlights indicate flagship stores Unit: Million yen
FY2006 H1FY 2005 full-
year
Trend Change: %
3.8%
(4.6%)
10.0%
3.7%
12.1%
(1.1%)
6.4%
(0.9%)
0.8%
Net sales Change: %
Sapporo 7,094 (5.1%)
Utsunomiya 4,010 (8.3%)
Shin-Tokorozawa 4,696 3.6%
Ikebukuro 16,518 7.4%
Shibuya 10,626 10.1%
Hibarigaoka 4,466 3.2%
Kichijoji 5,246 3.3%
Chofu 8,695 (0.2%)
Tsudanuma 5,361 6.6%
Flagship store performance: Net sales up 3.5% year-on-year● Remodeling this fiscal year at Shibuya PARCO, Ikebukuro PARCO and Hiroshima PARCO and theme-based remodeling this calendar year helped us to win market support, with sales continuing to increase in the period as a result● Systematic remodeling is being carried out annually atNagoya PARCO. Renewal of men’s and other fashion continued and the restaurant and services lineup was expanded. PARCO’s lifestyle proposals, which mainly target young people, are making steady progress, leading to further sales increases ● Sapporo PARCO, despite the inevitable rebound following the opening of the new building in March 2005, is on a recovery trend, with sales as a percentage of the previous comparable period at 93.3% for the first quarter of the year and rising to 96.5% for the first half. Remodeling of the floor area around the first floor entrance was carried out in September 2006, with future plans to strengthen the connection between the main building and the new building

11/2010-2/20■ FY2006 H1 results: Tenant sales by store (slide 2)
Other store performance: Net sales up 0.1% year-on-year● Tsudanuma PARCO and Hibarigaoka PARCO have been carrying out building frame reinforcement following the introduction as part of the store grouping policy of a head office-led system for equipping stores with the capacity to attract large numbers of customers. Both stores achieved major increases● Otsu PARCO leveraged its tenth anniversary to achieve clear improvements, while Shin-Tokorozawa PARCO, Kichijoji PARCO, Atsugi PARCO, Matsumoto PARCO and ShinsaibashiPARCO, which all performed well last year, continued to increase sales driven by new merchandising proposals and sales plans● In contrast, Utsunomiya PARCO, Kumamoto PARCO and Chiba PARCO continued to experience difficulties due to the impact of nearby competitors and other factors
Yellow highlights indicate flagship storesUnit: Million yen
FY2006 H1FY 2005 full-
year
Trend Change: %
(7.9%)
7.4%
4.3%
4.0%
(1.2%)
8.2%
5.4%
(5.2%)
(8.3%)
Gifu 974 (13.6%) (15.5%)
2.5%
Net sales Change: %
Chiba 4,630 (5.2%)
Atsugi 2,255 3.3%
Matsumoto 4,433 2.7%
Nagoya 18,990 1.3%
Otsu 3,993 1.3%
Shinsaibashi 866 1.4%
Hiroshima 8,790 5.7%
Oita 2,302 (1.3%)
Kumamoto 2,923 (6.5%)
Total 116,877 2.2%

12/2011/20■ FY2006 H1 Sales comparisons by item category
○Womenswear, personal items such as shoes and bags performed well
・In clothing, womenswear sales remained strong throughout the first half period. Hit products emerged for coats in spring and resort-style wear in summer, with higher than average sales of autumn-colored summer fabrics after the summer sale season ended. Personal items sales were strong, with a trend for total fashion coordination and hit products in wedge-sole sandals, leather tote bags and others
・In menswear, sales were slightly lower due to the impact of remodeling closures, but including the menswear portion of general clothing, sales increased 0.6%
・In general merchandise, sales recovered after the decline of the previous year, with weaker sales of books and CDs covered by higher sales of home appliances and lifestyle goods
・In foods, sales increased at each store as PARCO gained market presence, aided by factors such as the total remodeling of Shin-Tokorozawa PARCO in 2004 and strong sales of summer gifts at Hibarigaoka PARCO
Change in %Category and item
3.4%Womenswear
Menswear
Sportswear
Kimono
Childrenswear
General clothing 8.8%
Shoes 6.5%
Accessories 6.0%Cosmetics (1.3%)
Personal items 2.7%General merchandise 1.1%Foods 2.4%Restaurants 1.1%
Bags 8.7%
(0.1%)(11.4%)
9.2%(1.4%)
Clothing 2.5%
Other 4.3%
Note: All comparisons are with the first half of the previous year
FY2006 H1 sales composition
Clothing 46.7%
General merchandise 18.1%
Other 10.3%
Foods 4.5%
Restaurants 5.3%
Personalitems 15.2%
Average spend per customer up 3.7%Paying customer numbers down 1.3%
Note: Comparisons (with the previous first half period) are based on integrated store sales. Integrated store sales indicates overall sales strength of stores, as it includes tenant sales as well as the sales of PARCO Theater and fixed rent tenants.

13/20■ FY2006 H1 Store remodeling○ Active approach has seen 24,000m2 of remodeling implemented of 50,000m2
planned for year
12/20
Remodeling status FY2006 H1Scale of remodeling: 224 sections, approximately 24,000 m2 (including 93 new store sections)Effect of remodeling: Sales up 19.1% in same zone comparison■ Total store overview as of end of August 2006: 18 stores, 2,470 tenants,
sales area of 388,000m2
■ Key remodeling projects implementedNagoya: 36 sections, 3,750m2 including womenswear, menswear, restaurants, personal items, etc.
Same zone sales up 25.9%Hiroshima: 44 sections, 3,400m2 including total remodeling of 2 menswear floors and addition of
beauty zone in B1 floor of main building. Same zone sales up 15.1%
Ikebukuro: 32 sections, 2,200m2 including womenswear and personal items sections in basement of main building. Same zone sales up 38.3%
Shibuya: 19 sections, 1,700m2, based on womenswear in PART 1 and menswear and general merchandise in PART 3.Same zone sales up 37.8%
Nagoya PARCO Menswear floor
Hiroshima PARCO beauty zoneNote: All comparisons are with the first half of the previous year

14/2013/20■ FY2006 H1 PARCO Card○ Changed name and design of PARCO Card in March 2006, aiming to boost number of new cardholders.
-Increasing brand awareness through use of simple name: PARCO Card
■ Supported sales plan through core customer strategy under which name and design of card was revised. Boosted status appeal with introduction of special PARCO Card Class S with priority services for PEC continuous members.
■ FY2006 H1: PARCO Card holders and transactionsTotal transaction amountUp 8.1%. 13.4% of total store sales made with PARCO Card (up 0.8 percentage points)
Card holders (as of end August)
Approximately 1,370,000New applications up 31.9%
■ Main sales eventsSpring Card fair (5% off) 3/9~4/16HAPPY 5 DAYS SALE (5% off, etc.) 5/25~29HAPPY! HAPPY! Campaign 5/30~6/25(Double points (triple for Class S) + prize draws)
PARCO Card: Class S
Twelve months of special priority services for cardholders making more than 200,000 yen of purchases in a one-year period.
Note: All comparisons are with the first half of the previous year

15/20■ FY2006 H1 Entertainment business overview
As of end August 2006 Number of stores Sales increase
TiCTAC 35 20.2%
18.7%
2.8%
2.5%
118.4%
11.8%
POKER FACE 20
Total all stores 100
COLLECTORS 16
ROSEMARY 22
ANNABEILLE 7
Net sales: Up 11.8%including an 8.0% increase at existing stores
○ Store network expanded to 100Strong sales at existing stores boosted by new store openings
○ Overall entertainment business sales in line with previous year, supported by good results in publishing
■ New stores opened during first half3/17 Kohoku Tokyu Shopping Center: 2 stores 4/20 Kinshicho olinas: 3 stores6/24 Horie kNOT: 2 stores.Also: Remodeled 8 stores; closed 3 stores
Hiroyuki EharaKunan no Norikoekata(Overcoming hardship)
■ Although PARCO Theater was closed three months for remodeling, any decline in sales was minimized through hosting external and regional events, and new and backlist publishing hits
→ Minimal overall impact from temporary closure of PARCO Theater, with entertainment business sales reaching 99.9% of the previous comparable period.
「POKER FACE (eyewear)」
Operating in PARCO facilities: 51%Operating in other facilities: 49%
NEUVE A CO., LTD.
Le Theatre GINZAHymne À L’amour
Note: All comparisons are with the first half of the previous year
14/20

16/2015/20
3. Update on progress of five-year medium-term management plan
Five-year medium-term management plan (FY2005 – FY2009)(1) Strengthening shopping complex management and development capabilities
1-1: Undertake strategic grouping of stores1-2: Concentrate store development in major urban centers
(2) Entering new business arenas2-1: Expand and enhance property management operations2-2: Engage in new development schemes
(3) Deepening and broadening peripheral business3-1: Expand content-based business in entertainment/other arenas3-2: Strengthen PARCO Space Systems through existing and new operations3-3: Grow NEUVE A business through active expansion of store network
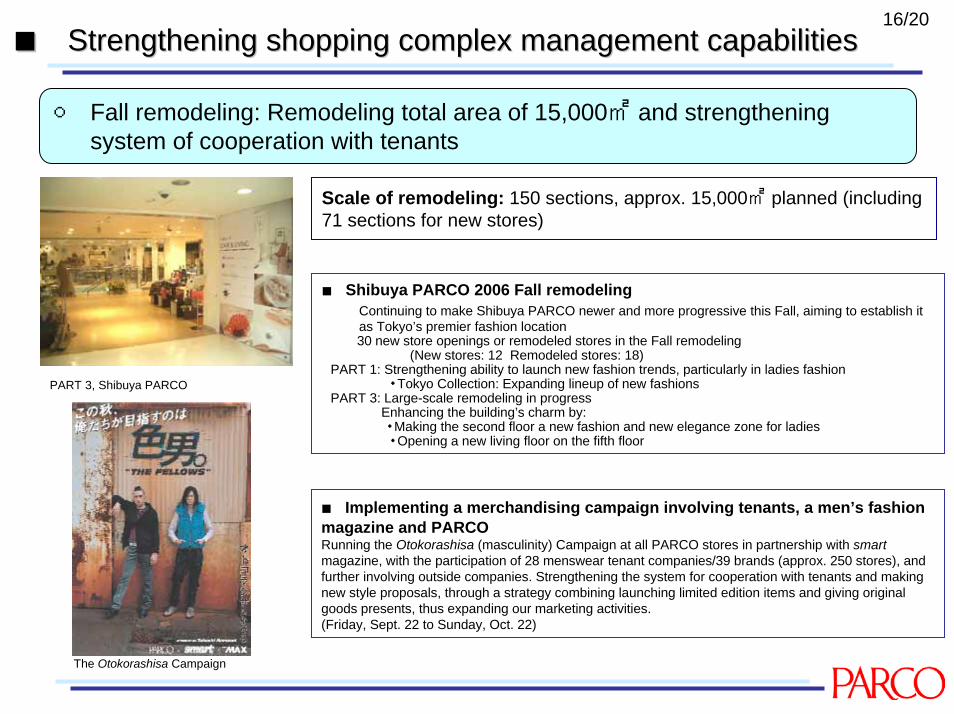
17/2016/20■■ Strengthening shopping complex management capabilitiesStrengthening shopping complex management capabilities
○ Fall remodeling: Remodeling total area of 15,000㎡ and strengthening system of cooperation with tenants
■ Shibuya PARCO 2006 Fall remodelingContinuing to make Shibuya PARCO newer and more progressive this Fall, aiming to establish it as Tokyo’s premier fashion location30 new store openings or remodeled stores in the Fall remodeling
(New stores: 12 Remodeled stores: 18) PART 1: Strengthening ability to launch new fashion trends, particularly in ladies fashion
・ Tokyo Collection: Expanding lineup of new fashionsPART 3: Large-scale remodeling in progress
Enhancing the building’s charm by: ・ Making the second floor a new fashion and new elegance zone for ladies・ Opening a new living floor on the fifth floor
Scale of remodeling: 150 sections, approx. 15,000㎡ planned (including 71 sections for new stores)
PART 3, Shibuya PARCO
■ Implementing a merchandising campaign involving tenants, a men’s fashion magazine and PARCORunning the Otokorashisa (masculinity) Campaign at all PARCO stores in partnership with smartmagazine, with the participation of 28 menswear tenant companies/39 brands (approx. 250 stores), and further involving outside companies. Strengthening the system for cooperation with tenants and making new style proposals, through a strategy combining launching limited edition items and giving original goods presents, thus expanding our marketing activities.(Friday, Sept. 22 to Sunday, Oct. 22)
The Otokorashisa Campaign

18/20■ Strengthening shopping complex development capabilitiesStrengthening shopping complex development capabilities
17/20
Began the Shizuoka PARCO campaign for targeted opening in Spring 2007
Scheduled opening
Fall 2007
Building type
7 floors + 1 basement level
Floor area approx. 65,000㎡■ Shizuoka PARCOSituated in heart of Shizuoka City’s retail and business district. Linkage with improved Shizuoka Japan Rail Station square should substantially boost overall commercial vitality of area
Launching of opening campaign ahead of store opening in Spring 2007, through measures such as holding of a performance of PARCO Theater musical in Shizuoka, recruitment of models for Shizuoka PARCO’s new year advertisement to be shot by well-known photographer Kishin Shinoyama, and recruitment of PARCO special correspondent reporters.
Scheduled opening Spring 2007
Building type 8 floors + 1 basement level
Floor area approx. 30,000㎡
Urawa PARCO (provisional name) One of our largest stores and a new type of development for PARCO, combining public facilities, a major supermarket area and a cinema complex.
Scheduled opening
Spring 2008
Building type
9 floors + 1 basement level
Floor area approx. 24,000㎡
Situated in front of the railway station in Sendai, the Tohoku region’s largest city. A full-scale development that includes office space
Sendai PARCO (provisional name)
※ Pictures are indicative illustrations. Actual building designs may vary.

19/20
□ Overseas business
□ New business
■Straits Parco Retail Management Pte Ltd (SPRM)
TiCTAC (watches)
■ NEUVE A CO., LTD.○ 8 stores to open and 2 stores to be remodeled in the second half
■ PARCO (Singapore) Pte Ltd
Contract signed and operations underway for pre-opening management (planning/tenant leasing) and post-opening management (administration/operation) of the commercial section of “CENTRAL”, a multi-building facility directly connected to the ClarkeQuay MRT station combining retail, office and residential space (SOHO)
■Buildings already opened in the second half ■ Planned openings 9/14 Kichijoji PARCO TiCTAC Nov.: 5 openings scheduled 9/28 LAZONA Kawasaki Collectors including Kanazawa FORUS 10/4 M-INT KOBE TiCTAC H2 Total: 8 store openings scheduled
○ In progress to begin property management operations in Spring 2007
■ Entering new business arenas/Deepening and broadening peripheral business
As part of our concentration of overseas businesses at PARCO (Singapore) Pte Ltd, the advisory contract held by SPRM for the Bugis Junction multi-functional shopping complex in Singapore will be cancelled, with compensation received through a one-off payment for the period up to contract expirationCentral
□ Retail business
Opening scheduled for Spring 2007. Targeted at suburban families, a shopping complex offering comprehensive range of lifestyle facilities ranging from fashion stores to a major home appliance and DIY center and a cinema complex. Pre- and post-opening management support currently underway
Kohoku Newtown Center Kita SC(Provisional name)
○ OMA contract signed for “CENTRAL” in Singapore (scheduled to start operations in Dec. 2006)
■ Kohoku Newtown Center Kita SC (Provisional Name)
Note: Pictures are indicative illustrations. Actual building designs may vary.
18/20

20/20■ FiveFive--year mediumyear medium--term management plan (2005term management plan (2005--2009) progress2009) progress
19/20
○ Currently on track to achieving our FY2009 management targets
FY2004 FY2009 FY2005Results
262,408
8,8794,006
6.2%
Results257,625
8,0791,742
3.0%
Unit: Million yen
FY2006Target Change Target
+42,375 265,500
+3,921+4,258
+5.2%
9,4004,250
-%
Net sales 300,000
Ordinary income 12,000Net income 6,000
ROE 8.2%
■ Management indices (Consolidated FY2009)
257,625
2,504
25,729
15,321236,456
FY2004Results Target Change
+42,375
+110
-1,477
+3,491+40,362
262,408
2,579
21,985
15,946242,675
FY2005Results
300,000Consolidated total (After eliminations)
18,812Retail Business
2,614Other Business
24,252Space Engineering and Management Business
276,819Shopping Complex Business
FY2009
Unit: Million yen
■ Sales targets by segment

21/20
http://www.parco.co.jp/
Statements in this presentation that are not historical fact, such as forecasts, are forward-looking statements, based on information available as of October 6, 2006, and are subject to a number of risks and uncertainties. Actual results may be materially different.
All rights to this material remain with PARCO or its authorized third parties. Unauthorized copying, dissemination, adaptation or distribution of this material is prohibited, as is any use of this material outside the scope of private use as defined under copyright laws.