Embed Size (px)
Citation preview
Paratransit Mesoeconomy: Control Measures from the Supply Side?
Ofentse Hlulani Mokwena IISES 5th Economics and Finance Conference
OUTLINE
Broad Objective Bridge the gap between macroeconomic indicators and microeconomic measures
of transportation.
Narrow Objective
This paper is an experimental exploration of statistical relationships between selected macroeconomic indicators (SMIs) and the national minibus economy
Presentation 1 Brief Review of Minibus Taxi Market 2 Problem Area 3 Conceptualizing the Minibus Transportation Economy 4 Research Method and Analysis 5 General Conclusions
2
1.1 REVIEW OF MINIBUS TAXI MARKET
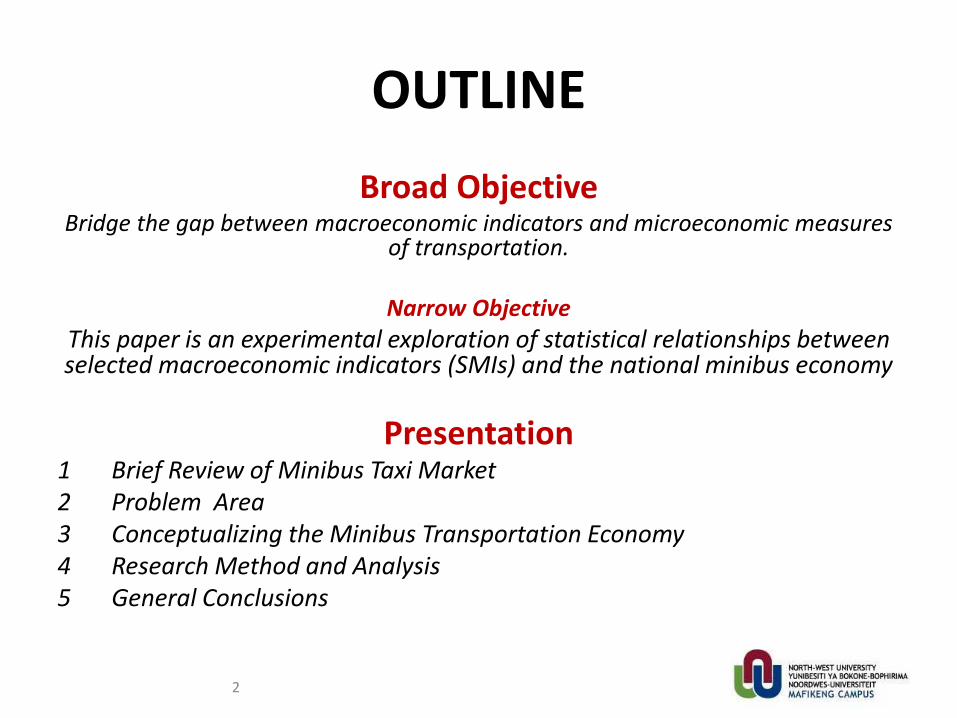
1. The analysis of transportation systems has evolved from microeconomic principles and applied in spatial, temporal, engineering, investment and project evaluative contexts.
3 Spatial Analysis- Bid-Rent
Theory
Transport Activities (Krygsman,2005)
1.2 REVIEW OF MINIBUS TAXI MARKET
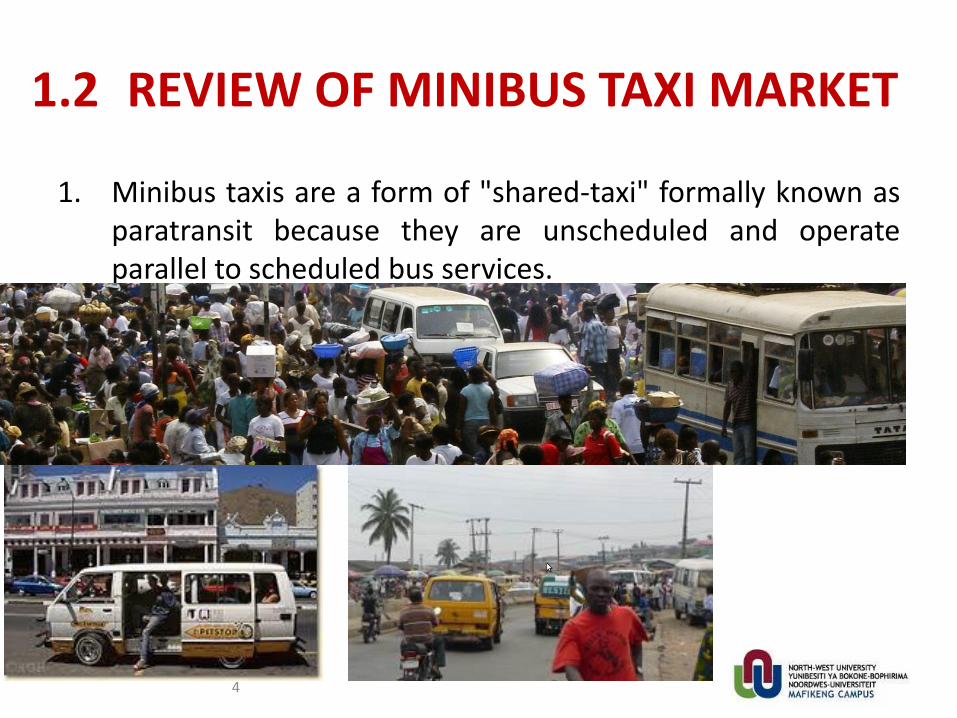
1. Minibus taxis are a form of "shared-taxi" formally known as paratransit because they are unscheduled and operate parallel to scheduled bus services.
4
1.3 REVIEW OF MINIBUS TAXI MARKET
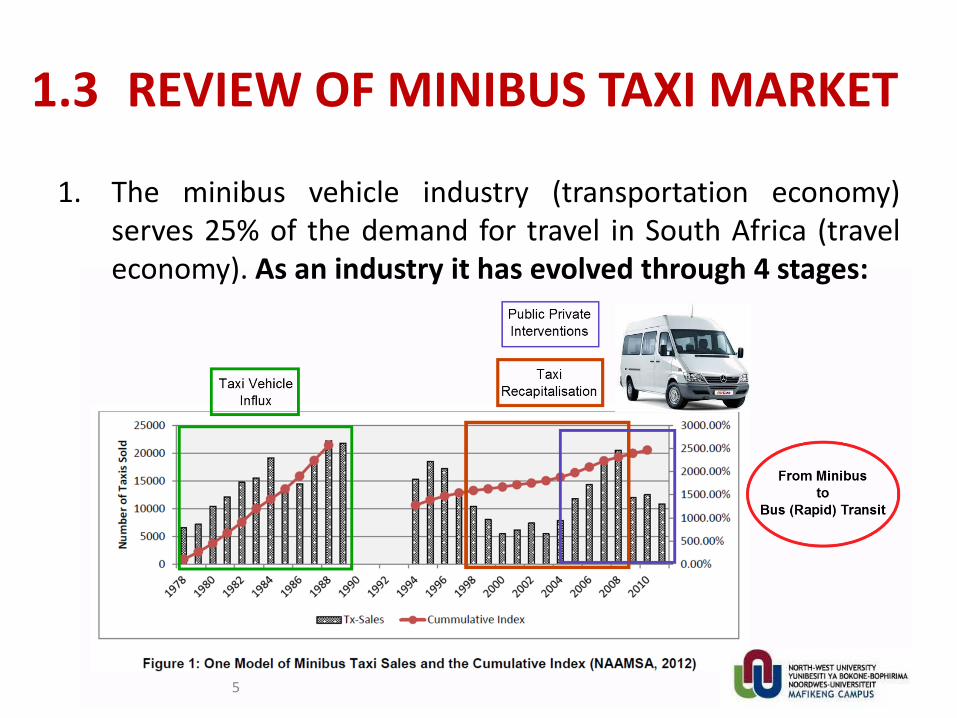
1. The minibus vehicle industry (transportation economy) serves 25% of the demand for travel in South Africa (travel economy). As an industry it has evolved through 4 stages:
5
1.4 REVIEW OF MINIBUS TAXI MARKET
1. Minibus taxi operators are individual entrepreneurs, serving their own interests fuelled by the need to accumulate capital (Khosa, 1994) .
2. The degree to which travel services are produced is regulated administratively—rather than economically .
3. Recent vehicle production programmes incentivise the local production of minibus taxi vehicles for the Southern African market (Lamprecht, 2012; Ensor, 2012).
6
1.4 REVIEW OF MINIBUS TAXI MARKET
1. The People-carrier Automotive Investment Scheme (P-AIS) is one such incentive by the Department of Trade and Industry (DTI). The P-AIS is
"designed to stimulate a growth path for the people-carrier vehicle industry through investment in new
and/or replacement models and components that will result in new employment, retention of current
employment, and/or strengthen the automotive vehicles value chain‟ (DTI, 2013).
7
2.1 KEY PROBLEM AREA
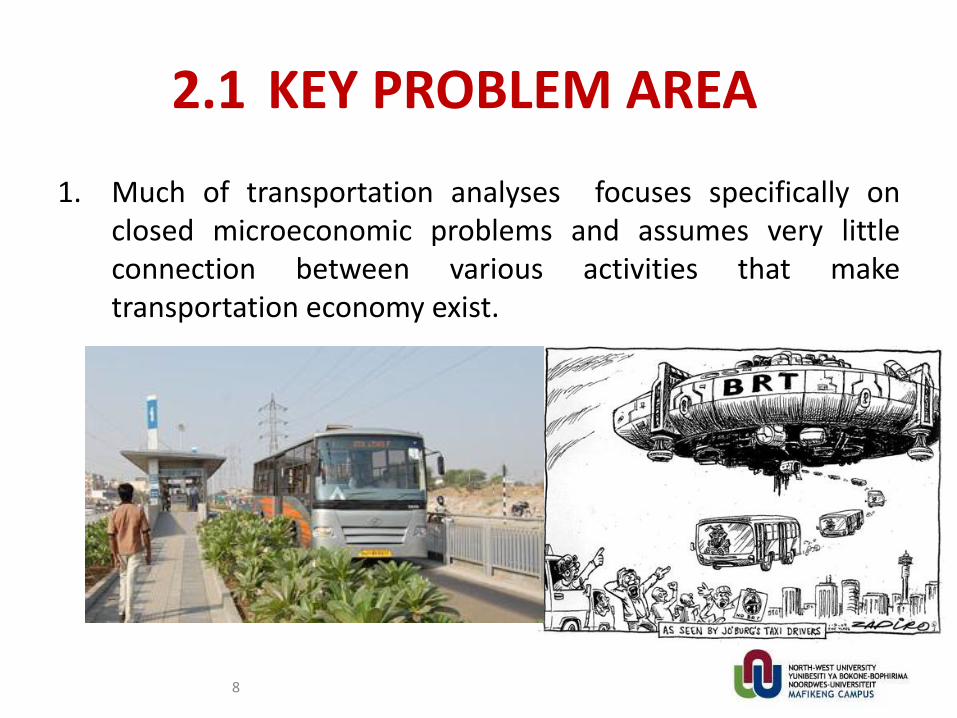
1. Much of transportation analyses focuses specifically on closed microeconomic problems and assumes very little connection between various activities that make transportation economy exist.
8
2.2 KEY PROBLEM AREA
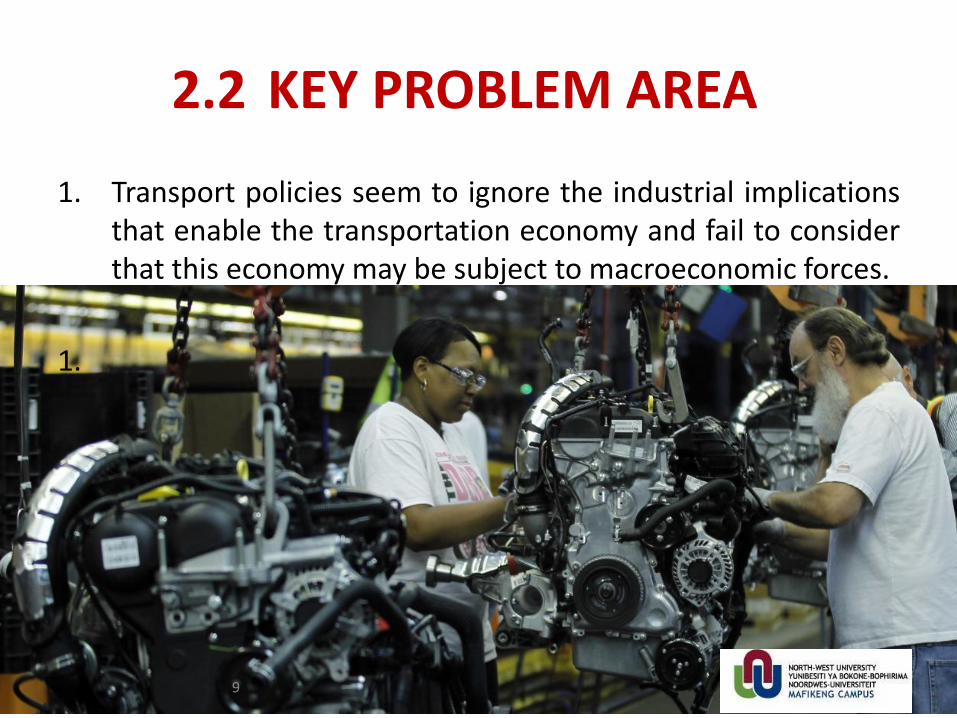
1. Transport policies seem to ignore the industrial implications that enable the transportation economy and fail to consider that this economy may be subject to macroeconomic forces.
1.
9
3.1 CONCEPTUAL FRAMEWORK
10
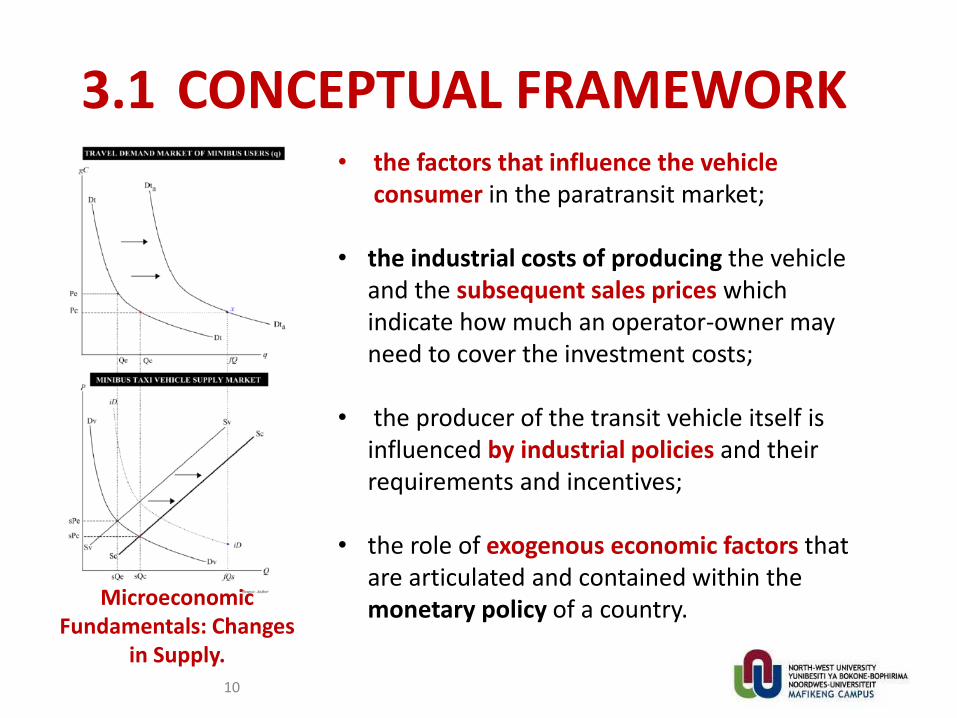
Microeconomic Fundamentals: Changes
in Supply.
• the factors that influence the vehicle consumer in the paratransit market;
• the industrial costs of producing the vehicle and the subsequent sales prices which indicate how much an operator-owner may need to cover the investment costs;
• the producer of the transit vehicle itself is influenced by industrial policies and their requirements and incentives;
• the role of exogenous economic factors that are articulated and contained within the monetary policy of a country.
3.2 CONCEPTUAL FRAMEWORK
11
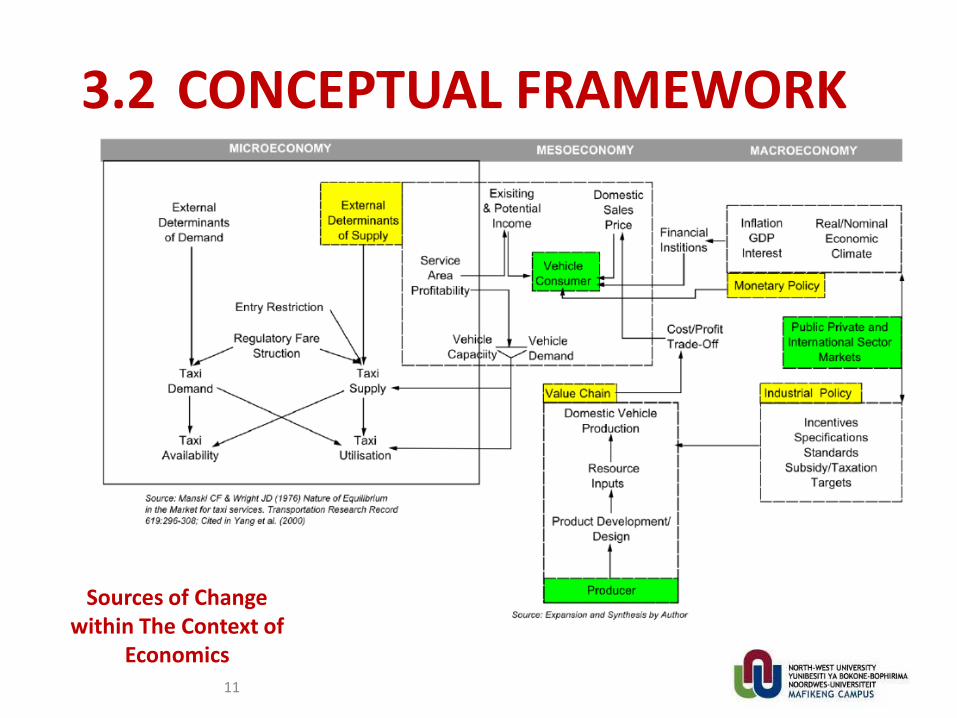
Sources of Change within The Context of
Economics
4.1 SOURCES OF DATA
12
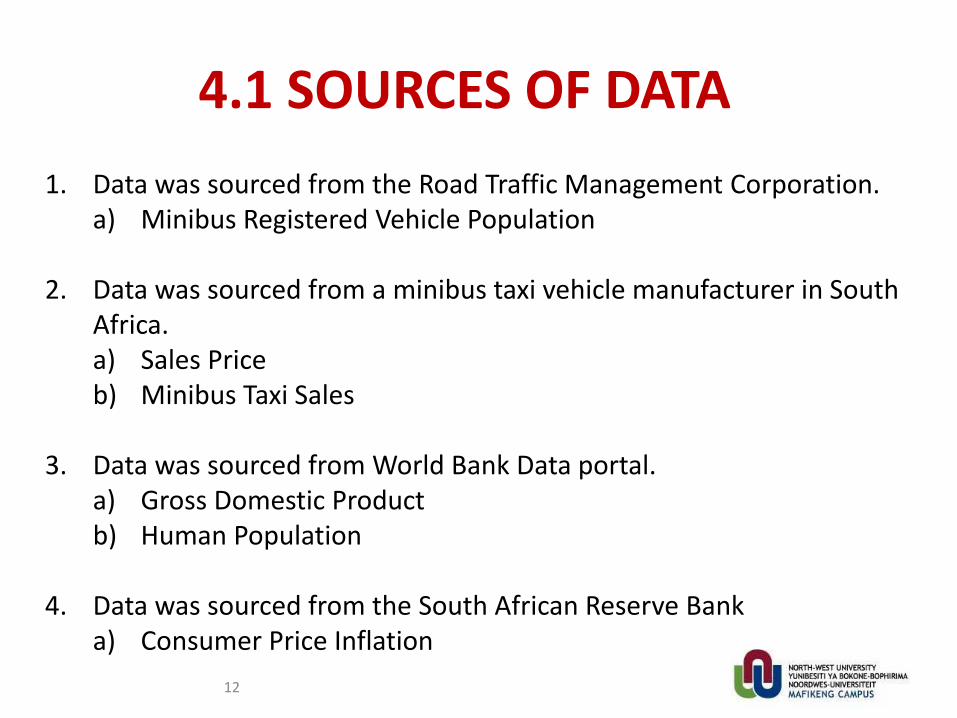
1. Data was sourced from the Road Traffic Management Corporation. a) Minibus Registered Vehicle Population
2. Data was sourced from a minibus taxi vehicle manufacturer in South Africa. a) Sales Price b) Minibus Taxi Sales
3. Data was sourced from World Bank Data portal.
a) Gross Domestic Product b) Human Population
4. Data was sourced from the South African Reserve Bank
a) Consumer Price Inflation
4.2 METHODS
13
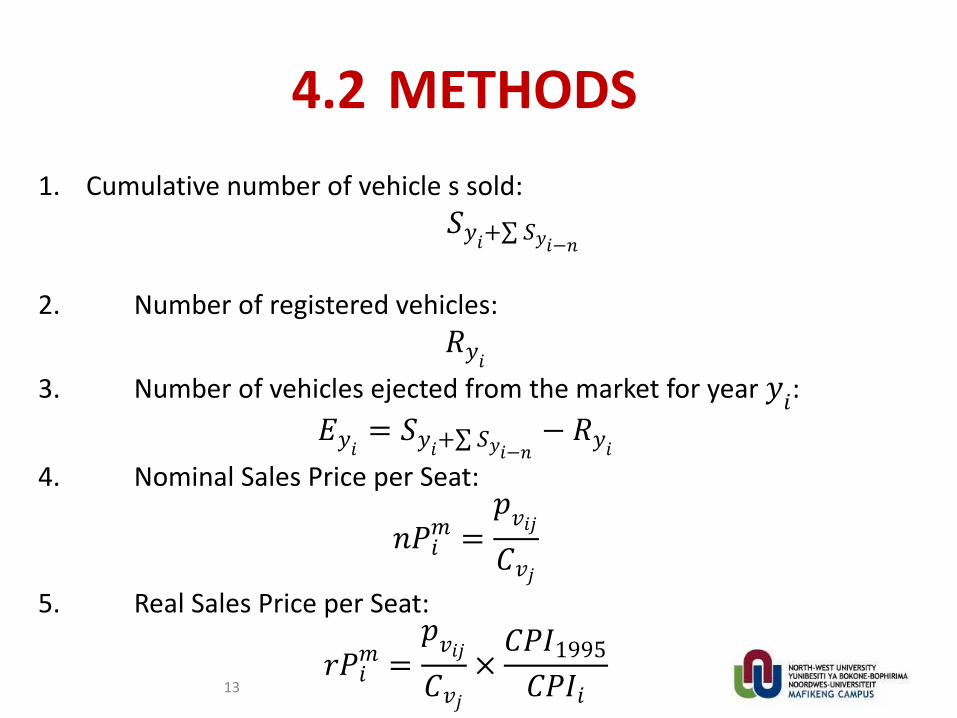
1. Cumulative number of vehicle s sold:
𝑆𝑦𝑖+ 𝑆𝑦𝑖−𝑛
2. Number of registered vehicles:
𝑅𝑦𝑖
3. Number of vehicles ejected from the market for year 𝑦𝑖:
𝐸𝑦𝑖 = 𝑆𝑦𝑖+ 𝑆𝑦𝑖−𝑛− 𝑅𝑦𝑖
4. Nominal Sales Price per Seat:
𝑛𝑃𝑖𝑚 =
𝑝𝑣𝑖𝑗𝐶𝑣𝑗
5. Real Sales Price per Seat:
𝑟𝑃𝑖𝑚 =
𝑝𝑣𝑖𝑗𝐶𝑣𝑗
×𝐶𝑃𝐼1995𝐶𝑃𝐼𝑖
4.3 DATA ANALYSIS: ejections
14
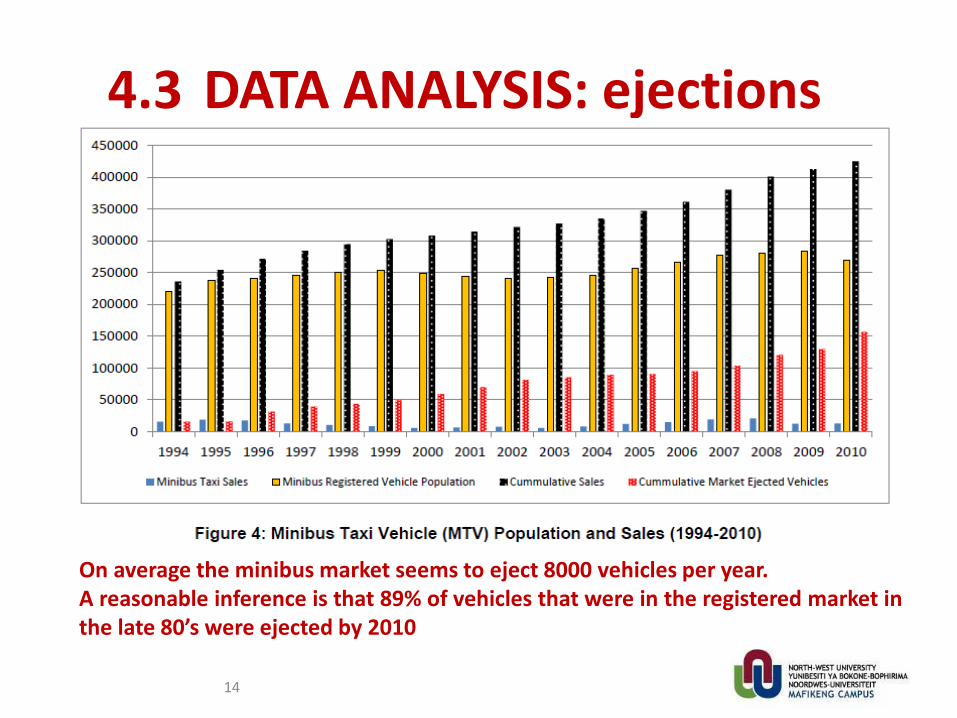
On average the minibus market seems to eject 8000 vehicles per year. A reasonable inference is that 89% of vehicles that were in the registered market in the late 80’s were ejected by 2010
4.4 DATA ANALYSIS: real & nominal
15
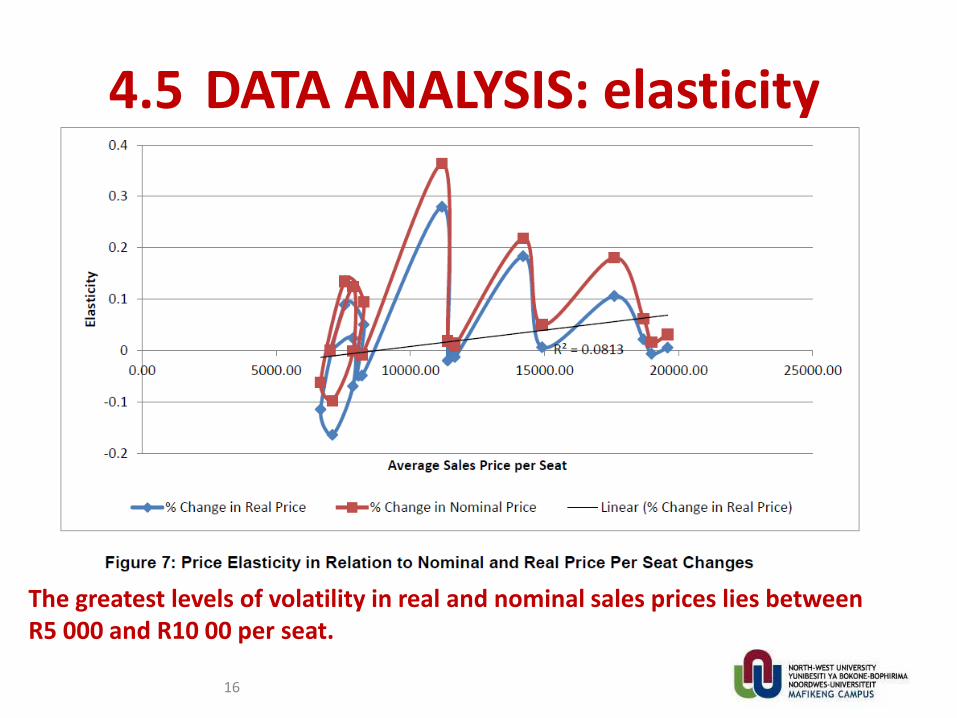
4.5 DATA ANALYSIS: elasticity
16
The greatest levels of volatility in real and nominal sales prices lies between R5 000 and R10 00 per seat.
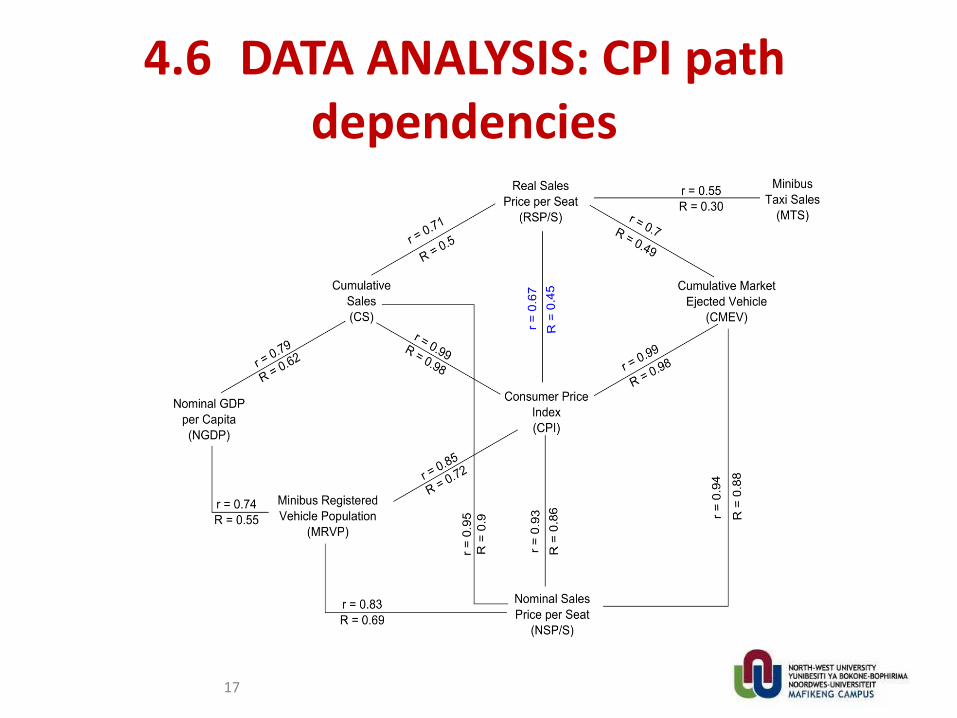
4.6 DATA ANALYSIS: CPI path dependencies
17
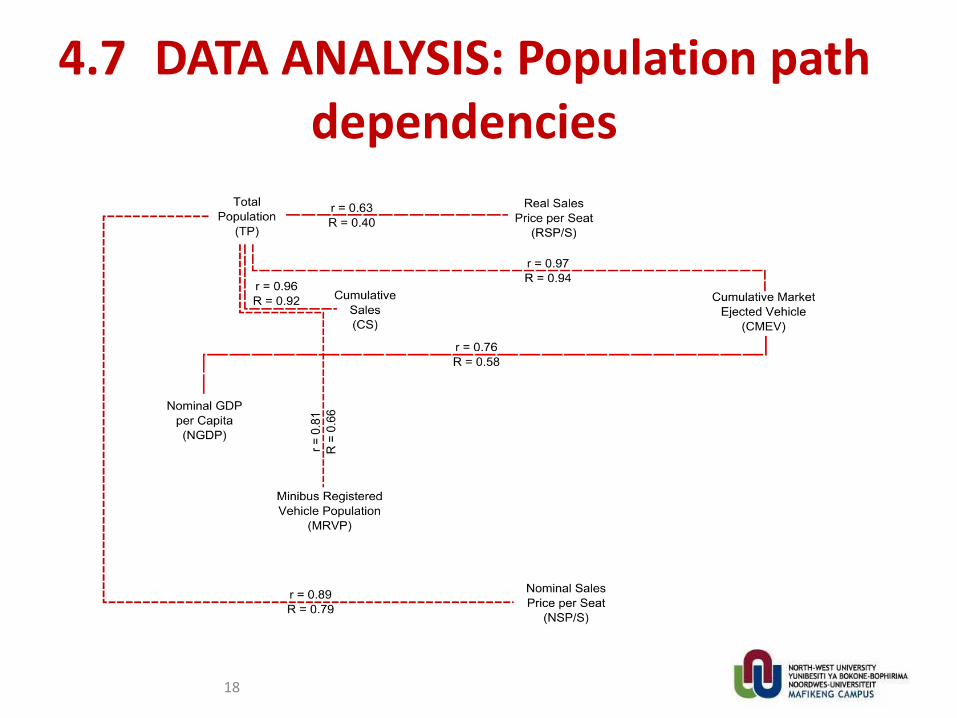
4.7 DATA ANALYSIS: Population path dependencies
18
6 GENERAL CONCLUSIONS
• Macroeconomic indicators are shown to relate significantly with the minibus transportation economy, and travel economy at large.
• The relationships are found to be path dependent and dynamic over time—making it an interesting avenue of research in the mesoeconomic domain.
• This paper, however, lacks a structured and consistent dataset for an accurate estimation of travel economies over the same period.
• From a policy making point of view, setting a mesoeconomic agenda to identify and address industrial policy and travel policy mismatches is crucial if effective implementation is sought.
• This is a global phenomenon taking place in most developing countries, intimating an unique avenue of research.
19