Embed Size (px)
Citation preview

PAEA RESEARCH
Program Report 35By the Numbers | Data from the 2019 Program Survey

COPYRIGHT © 2020 by the Physician Assistant Education Association
This report is distributed under the terms of the Creative Commons Attribution–NonCommercial–ShareAlike 4.0 International license. A reference copy of this license may be found at http://creativecommons.org/licenses/by-nc-sa/4.0/.
Acknowledgements
PAEA acknowledges the Research Mission Advancement Commission (RMAC) and its current chair, Richard Dehn, MPA, PA-C, for their review and guidance. The PAEA Research Team was responsible for the development and administration of the survey as well as for the preparation of this report. For any questions regarding the contents of this report, please contact [email protected].
Ryan Chitwood, MS, Research & Data Analyst, PAEACynthia X. Yuen, MA, Director of Research & Data Analysis, PAEADominique Frias, Research Coordinator, PAEADave Keahey, MSPH, PA-C, Chief Policy & Research Officer, PAEA
The PAEA RMAC and Research Team would like to thank the program directors, faculty, and staff who provided these data. Also, many thanks to Editorial Director Elizabeth Alesbury for her editing contributions.
Recommended Citation
Physician Assistant Education Association, By the Numbers: Program Report 35: Data from the 2019 Program Survey, Washington, DC: PAEA; 2020. doi: 10.17538/PR35.2020

i | PROGRAM REPORT 35 | TAblE of ConTEnTS
TABLE OF CONTENTSINTRODUCTION . . . . . . . . . . . . . . . . . . . . . . . . . . . . . . . . . . . . . . . . . . . . . . . . . . . . . . . . . . . . . . . . . . . . . . . . . . . . . . . . 1
METHODS . . . . . . . . . . . . . . . . . . . . . . . . . . . . . . . . . . . . . . . . . . . . . . . . . . . . . . . . . . . . . . . . . . . . . . . . . . . . . . . . . . . . . . . . . 1
The Survey Instrument . . . . . . . . . . . . . . . . . . . . . . . . . . . . . . . . . . . . . . . . . . . . . . . . . . . . . . . . . . . . . . . . . . . . . . 1
Survey Administration . . . . . . . . . . . . . . . . . . . . . . . . . . . . . . . . . . . . . . . . . . . . . . . . . . . . . . . . . . . . . . . . . . . . . . 2
Data Cleaning & Analysis . . . . . . . . . . . . . . . . . . . . . . . . . . . . . . . . . . . . . . . . . . . . . . . . . . . . . . . . . . . . . . . . . . 2
Report Enhancements . . . . . . . . . . . . . . . . . . . . . . . . . . . . . . . . . . . . . . . . . . . . . . . . . . . . . . . . . . . . . . . . . . . . . . . 2
Limitations . . . . . . . . . . . . . . . . . . . . . . . . . . . . . . . . . . . . . . . . . . . . . . . . . . . . . . . . . . . . . . . . . . . . . . . . . . . . . . . . . . . . 3
Questions & Data Requests . . . . . . . . . . . . . . . . . . . . . . . . . . . . . . . . . . . . . . . . . . . . . . . . . . . . . . . . . . . . . . . . 3
SECTION 1. GENERAL INFORMATION . . . . . . . . . . . . . . . . . . . . . . . . . . . . . . . . . . . . . . . . . . . . . . . 4
Academic Terms & Schedules . . . . . . . . . . . . . . . . . . . . . . . . . . . . . . . . . . . . . . . . . . . . . . . . . . . . . . . . . . . . . 6
Admissions . . . . . . . . . . . . . . . . . . . . . . . . . . . . . . . . . . . . . . . . . . . . . . . . . . . . . . . . . . . . . . . . . . . . . . . . . . . . . . . . . . . . 8
Credentials . . . . . . . . . . . . . . . . . . . . . . . . . . . . . . . . . . . . . . . . . . . . . . . . . . . . . . . . . . . . . . . . . . . . . . . . . . . . . . . . . . . . 8
Pre-Professional Phase . . . . . . . . . . . . . . . . . . . . . . . . . . . . . . . . . . . . . . . . . . . . . . . . . . . . . . . . . . . . . . . . . . . . . . 9
SECTION 2. FINANCIAL INFORMATION . . . . . . . . . . . . . . . . . . . . . . . . . . . . . . . . . . . . . . . . . . . .10
Program Budgets . . . . . . . . . . . . . . . . . . . . . . . . . . . . . . . . . . . . . . . . . . . . . . . . . . . . . . . . . . . . . . . . . . . . . . . . . . . .10
Program Expenses . . . . . . . . . . . . . . . . . . . . . . . . . . . . . . . . . . . . . . . . . . . . . . . . . . . . . . . . . . . . . . . . . . . . . . . . . .15
Payment for Clinical Sites . . . . . . . . . . . . . . . . . . . . . . . . . . . . . . . . . . . . . . . . . . . . . . . . . . . . . . . . . . . . . . . . 20
Tuition, Student Fees, and Incidental Costs . . . . . . . . . . . . . . . . . . . . . . . . . . . . . . . . . . . . . . . . . . 22
SECTION 3. PROGRAM PERSONNEL . . . . . . . . . . . . . . . . . . . . . . . . . . . . . . . . . . . . . . . . . . . . . . . . 27
Recruitment and Retention . . . . . . . . . . . . . . . . . . . . . . . . . . . . . . . . . . . . . . . . . . . . . . . . . . . . . . . . . . . . . . . 28
Student-to-Faculty Ratio . . . . . . . . . . . . . . . . . . . . . . . . . . . . . . . . . . . . . . . . . . . . . . . . . . . . . . . . . . . . . . . . . . 29
SECTION 4. STUDENTS . . . . . . . . . . . . . . . . . . . . . . . . . . . . . . . . . . . . . . . . . . . . . . . . . . . . . . . . . . . . . . . . . . . 32
Capacity & Enrollment . . . . . . . . . . . . . . . . . . . . . . . . . . . . . . . . . . . . . . . . . . . . . . . . . . . . . . . . . . . . . . . . . . . . . 32
First-Year Class . . . . . . . . . . . . . . . . . . . . . . . . . . . . . . . . . . . . . . . . . . . . . . . . . . . . . . . . . . . . . . . . . . . . . . . . . . . . . 34
First-Year Class Demographics . . . . . . . . . . . . . . . . . . . . . . . . . . . . . . . . . . . . . . . . . . . . . . . . . . . . . . . . . . 35
2019 Cohort . . . . . . . . . . . . . . . . . . . . . . . . . . . . . . . . . . . . . . . . . . . . . . . . . . . . . . . . . . . . . . . . . . . . . . . . . . . . . . . . . . 37
2019 Cohort Demographics . . . . . . . . . . . . . . . . . . . . . . . . . . . . . . . . . . . . . . . . . . . . . . . . . . . . . . . . . . . . . . . 39
BY THE NUMBERSPROGRAM REPORT 35:DATA FROM THE 2019 PROGRAM SURVEY

ii | PROGRAM REPORT 35 | liST of TAblES
LiST OF TABLESTable 1. Sponsoring Institution Attributes . . . . . . . . . . . . . . . . . . . . . . . . . . . . . . . . . . . . . . 4
Table 2. Geographic Distribution of Programs . . . . . . . . . . . . . . . . . . . . . . . . . . . . . . . . . . 6
Table 3. Academic Terms . . . . . . . . . . . . . . . . . . . . . . . . . . . . . . . . . . . . . . . . . . . . . . . . . . . . . 6
Table 4. Credits Required for Completion by Academic Term . . . . . . . . . . . . . . . . . . . . . 7
Table 5. Program Length (Weeks) . . . . . . . . . . . . . . . . . . . . . . . . . . . . . . . . . . . . . . . . . . . . . 7
Table 6. Total Program Length (Months) . . . . . . . . . . . . . . . . . . . . . . . . . . . . . . . . . . . . . . . . 7
Table 7. Admissions . . . . . . . . . . . . . . . . . . . . . . . . . . . . . . . . . . . . . . . . . . . . . . . . . . . . . . . . . . 8
Table 8. Use of CASPA in Admissions . . . . . . . . . . . . . . . . . . . . . . . . . . . . . . . . . . . . . . . . . . 8
Table 9. Credentials Awarded to PA Graduates . . . . . . . . . . . . . . . . . . . . . . . . . . . . . . . . . . 8
Table 10. Primary Credential Awarded to PA Graduates . . . . . . . . . . . . . . . . . . . . . . . . . . 9
Table 11. Type of Master’s Degree Awarded to PA Graduates . . . . . . . . . . . . . . . . . . . . . 9
Table 12. Program Models for the Pre-Professional Phase . . . . . . . . . . . . . . . . . . . . . . . . 9
Table 13. Fiscal Year Definitions . . . . . . . . . . . . . . . . . . . . . . . . . . . . . . . . . . . . . . . . . . . . . . 10
Table 14. Sources of Programs’ Financial Support ($) . . . . . . . . . . . . . . . . . . . . . . . . . . . 11
Table 15. Sources of Financial Support Among Public and Private Programs ($) . . . . 11
Table 16. Sources of Financial Support by Average Class Size ($) . . . . . . . . . . . . . . . . . 12
Table 17. Sources of Financial Support by Average Class Size Among Public and Private Programs ($) . . . . . . . . . . . . . . . . . . . . . . . . . . . . . . . . . . . . . . . . . . . . . . . . 13
Table 18. Sources of Financial Support by Academic Health Center Status ($) . . . . . . 14
Table 19. Sources of Financial Support by Administrative Housing ($) . . . . . . . . . . . . . 15
Table 20. PA Program Expenses ($) . . . . . . . . . . . . . . . . . . . . . . . . . . . . . . . . . . . . . . . . . . . 16
Table 21. Program Expenses Among Private and Public Programs ($) . . . . . . . . . . . . . 17
Table 22. Program Expenses by Academic Health Center Status ($) . . . . . . . . . . . . . . 18
Table 23. Payment for Clinical Sites by Geographic Location . . . . . . . . . . . . . . . . . . . . . 21
Table 24. Recipients of Clinical Rotation Payments . . . . . . . . . . . . . . . . . . . . . . . . . . . . . 21
Table 25. Average Cost per Student Per Week for Clinical Sites Paid by Programs ($) 21
Table 26. Students’ Out-of-Pocket Expenses for Remote Clinical Sites ($) . . . . . . . . . . 22
Table 27. Tuition ($) . . . . . . . . . . . . . . . . . . . . . . . . . . . . . . . . . . . . . . . . . . . . . . . . . . . . . . . . . 22
Table 28. Trends in Average PA School Tuition, 2013–2019 . . . . . . . . . . . . . . . . . . . . . . 23
Table 29. Itemized Student Fees Collected by the Institution/Program ($) . . . . . . . . . 24
Table 30. Itemized Student Fees Collected by the Institution/Program Among Public and Private Programs ($) . . . . . . . . . . . . . . . . . . . . . . . . . . . . . . . . . . . . . . 25
Table 31. Itemized Student Fees Collected by the Institution/Program by Academic Health Center Status ($) . . . . . . . . . . . . . . . . . . . . . . . . . . . . . . . . . . . 26
Table 32. Full-Time Faculty Headcounts . . . . . . . . . . . . . . . . . . . . . . . . . . . . . . . . . . . . . . . 27
Table 33. Part-Time Faculty and Guest Lecturers . . . . . . . . . . . . . . . . . . . . . . . . . . . . . . . 27
Table 34. Percentage of Didactic Curriculum Taught by Core Faculty (%) . . . . . . . . . . 27
Table 35. Capacity, Filled, and Vacant FTE . . . . . . . . . . . . . . . . . . . . . . . . . . . . . . . . . . . . . 28
Table 36. Open Positions . . . . . . . . . . . . . . . . . . . . . . . . . . . . . . . . . . . . . . . . . . . . . . . . . . . . 29

iii | PROGRAM REPORT 35 | liST of TAblES
Table 37. Barriers to Hiring New Faculty (%) . . . . . . . . . . . . . . . . . . . . . . . . . . . . . . . . . . . . 29
Table 38. Reasons for Faculty Departures . . . . . . . . . . . . . . . . . . . . . . . . . . . . . . . . . . . . . 29
Table 39. Student-to-Faculty Ratio: Full-Time Faculty Headcount . . . . . . . . . . . . . . . . . 30
Table 40. Student-to-Faculty Ratio: FTE . . . . . . . . . . . . . . . . . . . . . . . . . . . . . . . . . . . . . . . 31
Table 41. Status of Inaugural Classes in Provisionally Accredited Programs . . . . . . . . 32
Table 42. Student Maximum Capacity and Current Enrollment . . . . . . . . . . . . . . . . . . . 32
Table 43. Day-One Enrollment of Most Recently Admitted Class . . . . . . . . . . . . . . . . . 33
Table 44. Exams Required for Admission . . . . . . . . . . . . . . . . . . . . . . . . . . . . . . . . . . . . . . 34
Table 45. First-Year Class: GRE Scores. . . . . . . . . . . . . . . . . . . . . . . . . . . . . . . . . . . . . . . . . 34
Table 46. First-Year Class: Undergraduate Grade-Point Averages . . . . . . . . . . . . . . . . 34
Table 47. First-Year Class: Health Care Experience Hours . . . . . . . . . . . . . . . . . . . . . . . . 34
Table 48. First-Year Class: Programs with Missing Demographic Information . . . . . . 36
Table 49. First-Year Class: Gender . . . . . . . . . . . . . . . . . . . . . . . . . . . . . . . . . . . . . . . . . . . . 36
Table 50. First-Year Class: Ethnicity . . . . . . . . . . . . . . . . . . . . . . . . . . . . . . . . . . . . . . . . . . . 36
Table 51. First-Year Class: Race . . . . . . . . . . . . . . . . . . . . . . . . . . . . . . . . . . . . . . . . . . . . . . . 36
Table 52. First-Year Class: Age . . . . . . . . . . . . . . . . . . . . . . . . . . . . . . . . . . . . . . . . . . . . . . . 36
Table 53. 2019 Cohort: Percent Receiving Federal Financial Aid (%) . . . . . . . . . . . . . . 38
Table 54. 2019 Cohort: Enrollment at Matriculation . . . . . . . . . . . . . . . . . . . . . . . . . . . . . 38
Table 55. 2019 Cohort: Student Status at Graduation . . . . . . . . . . . . . . . . . . . . . . . . . . . 38
Table 56. 2019 Cohort: Programs with Missing Demographic Information . . . . . . . . . 40
Table 57A. 2019 Cohort: Gender by Student Status . . . . . . . . . . . . . . . . . . . . . . . . . . . . . 40
Table 57B. 2019 Cohort: Student Status by Gender (%) . . . . . . . . . . . . . . . . . . . . . . . . . . 41
Table 58A. 2019 Cohort: Ethnicity by Student Status . . . . . . . . . . . . . . . . . . . . . . . . . . . . 41
Table 58B. 2019 Cohort: Student Status by Ethnicity (%) . . . . . . . . . . . . . . . . . . . . . . . . . 42
Table 59A. A 2019 Cohort: Race by Student Status . . . . . . . . . . . . . . . . . . . . . . . . . . . . . 42
Table 59B. 2019 Cohort: Student Status by Race (%) . . . . . . . . . . . . . . . . . . . . . . . . . . . . 44
iV | PROGRAM REPORT 35 | liST of figuRES
LiST OF FiGURESFigure 1. Cumulative Total Number of Programs Since 1965 . . . . . . . . . . . . . . . . . . . . . . 4
Figure 2. U.S. Census Bureau Regions and Divisions . . . . . . . . . . . . . . . . . . . . . . . . . . . . 5
Figure 3. Satellite Campuses . . . . . . . . . . . . . . . . . . . . . . . . . . . . . . . . . . . . . . . . . . . . . . . . . 6
Figure 4. Program Start and End Months . . . . . . . . . . . . . . . . . . . . . . . . . . . . . . . . . . . . . . . 7
Figure 5. Total Program Length (Months) . . . . . . . . . . . . . . . . . . . . . . . . . . . . . . . . . . . . . . . 7
Figure 6. Programs with a Pre-Professional Phase . . . . . . . . . . . . . . . . . . . . . . . . . . . . . . . 9
Figure 7. Trends in Payment for Clinical Sites, 2012–2019 . . . . . . . . . . . . . . . . . . . . . . . . 20
Figure 8. Program Payment for Clinical Sites . . . . . . . . . . . . . . . . . . . . . . . . . . . . . . . . . . . 20
Figure 9. Payment to Clinical Sites Among Public & Private Programs . . . . . . . . . . . . . 20
Figure 10. Differences in Rates of Payment to Clinical Sites by Academic Health Center Status . . . . . . . . . . . . . . . . . . . . . . . . . . . . . . . . . . 20
Figure 11. Student Placements at Remote Clinical Sites . . . . . . . . . . . . . . . . . . . . . . . . . 22
Figure 12. Student Placements at Remote Clinical Sites Among Public and Private Programs . . . . . . . . . . . . . . . . . . . . . . . . . . . . . . . . . . . . . . . . . . . . . 22
Figure 13. Student Placements at Remote Clinical Sites by Academic Health Center Status . . . . . . . . . . . . . . . . . . . . . . . . . . . . . . . . . . . . . . . . . . . . . . . . . . . . 22
Figure 14. Trends in Average PA School Tuition, 2013–2019 . . . . . . . . . . . . . . . . . . . . . . 23
Figure 15. Full-Time Faculty Assignments . . . . . . . . . . . . . . . . . . . . . . . . . . . . . . . . . . . . . 27
Figure 16. Programs with Vacant FTEs . . . . . . . . . . . . . . . . . . . . . . . . . . . . . . . . . . . . . . . . 28
Figure 17. Enrolled Cohorts . . . . . . . . . . . . . . . . . . . . . . . . . . . . . . . . . . . . . . . . . . . . . . . . . . 32
Figure 18. Average Program Enrollment and Capacity, 1985-2019 . . . . . . . . . . . . . . . . 33
Figure 19. Total First-Year and Graduating Students, 1985-2019 . . . . . . . . . . . . . . . . . . 33
Figure 20. Average First-Year and Graduating Class Sizes 1985-2019 . . . . . . . . . . . . . 33
1 | PROGRAM REPORT 35 | METHoDS
METHODSThe Survey instruments
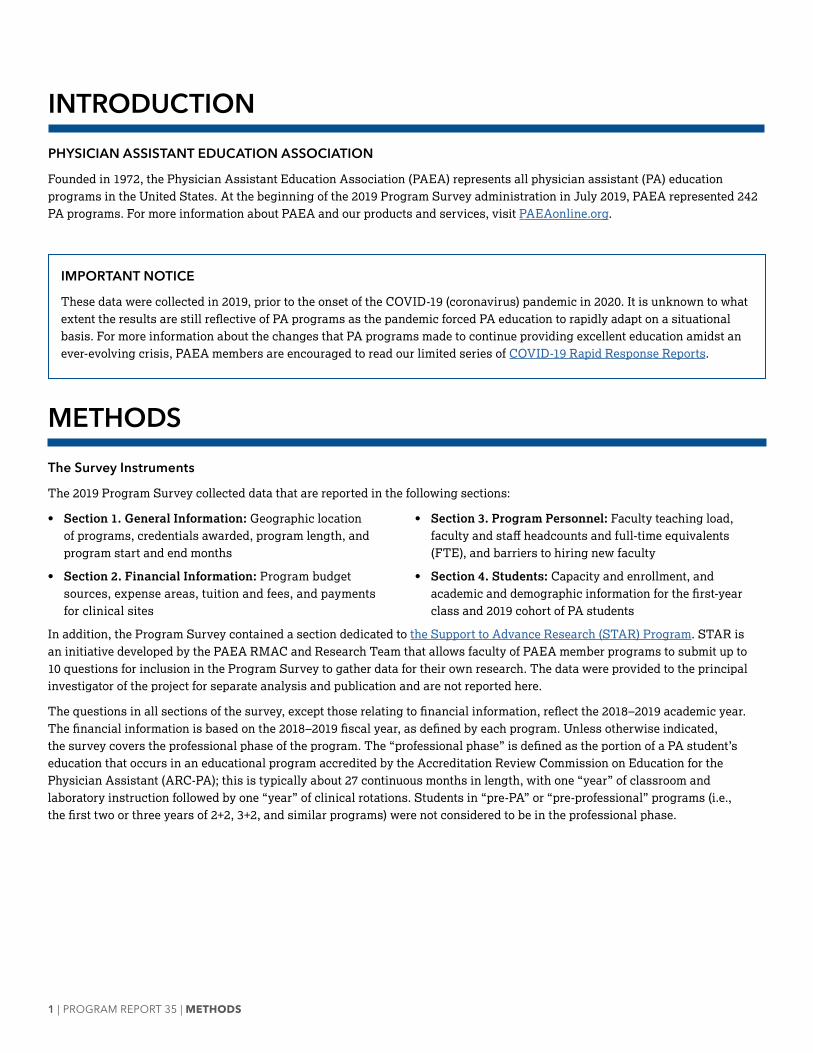
The 2019 Program Survey collected data that are reported in the following sections:
• Section 1. General Information: Geographic location of programs, credentials awarded, program length, and program start and end months
• Section 2. Financial Information: Program budget sources, expense areas, tuition and fees, and payments for clinical sites
• Section 3. Program Personnel: Faculty teaching load, faculty and staff headcounts and full-time equivalents (FTE), and barriers to hiring new faculty
• Section 4. Students: Capacity and enrollment, and academic and demographic information for the first-year class and 2019 cohort of PA students
In addition, the Program Survey contained a section dedicated to the Support to Advance Research (STAR) Program. STAR is an initiative developed by the PAEA RMAC and Research Team that allows faculty of PAEA member programs to submit up to 10 questions for inclusion in the Program Survey to gather data for their own research. The data were provided to the principal investigator of the project for separate analysis and publication and are not reported here.
The questions in all sections of the survey, except those relating to financial information, reflect the 2018–2019 academic year. The financial information is based on the 2018–2019 fiscal year, as defined by each program. Unless otherwise indicated, the survey covers the professional phase of the program. The “professional phase” is defined as the portion of a PA student’s education that occurs in an educational program accredited by the Accreditation Review Commission on Education for the Physician Assistant (ARC-PA); this is typically about 27 continuous months in length, with one “year” of classroom and laboratory instruction followed by one “year” of clinical rotations. Students in “pre-PA” or “pre-professional” programs (i.e., the first two or three years of 2+2, 3+2, and similar programs) were not considered to be in the professional phase.
iMPORTANT NOTiCE
These data were collected in 2019, prior to the onset of the COVID-19 (coronavirus) pandemic in 2020. It is unknown to what extent the results are still reflective of PA programs as the pandemic forced PA education to rapidly adapt on a situational basis. For more information about the changes that PA programs made to continue providing excellent education amidst an ever-evolving crisis, PAEA members are encouraged to read our limited series of COVID-19 Rapid Response Reports.
iNTRODUCTiONPHYSiCiAN ASSiSTANT EDUCATiON ASSOCiATiON
Founded in 1972, the Physician Assistant Education Association (PAEA) represents all physician assistant (PA) education programs in the United States. At the beginning of the 2019 Program Survey administration in July 2019, PAEA represented 242 PA programs. For more information about PAEA and our products and services, visit PAEAonline.org.

2 | PROGRAM REPORT 35 | METHoDS
Survey Administration
The 2019 Program Survey was sent to the program directors of PAEA’s 242 member programs in July 2019. The PAEA Research Team sent email reminders to non-respondents and conducted follow-up calls until the survey closed in December 2019. The survey yielded an overall response rate of 97.1% based on the 235 respondents; however, the response rate varies for individual items.
Data Cleaning & Analysis
Responses were checked for logical consistency and examined for extreme values and possible errors. In cases of obvious misinterpretations or inconsistencies in the responses to specific items, respondents were contacted for clarification. Responses that fell outside of reasonable parameters (e.g., total annual program budgets of $1,000) were not included in the analyses. Some reasonably plausible outliers were retained in some statistics, particularly in those presenting financial data. When interpreting financial statistics, readers are advised to rely primarily on medians and trimmed means, which are less susceptible to outlier influence then arithmetic means and are more useful for comparisons across time and between programs within the same year.
In general, analyses of the data consisted of calculating descriptive statistics on the variables of interest — percentage, minimum (Min) and maximum (Max) values; arithmetic mean (M ); standard deviation (SD); median (Mdn); and 10th, 25th, 50th, 75th, and 90th percentiles (P10, P25, P50, P75, P90). Tables describing financial information also include a 10% trimmed mean (M (T)), the mean when the bottom and top 10% of responses are excluded. For some tables and figures, percentages will not equal 100% due to rounding or when multiple responses were allowed. Total columns on tables and figures are designated by n. Exact financial data were not reported if there were fewer than five respondents. Any other notations not described here are defined in the body of the report.
Report Enhancements
While PAEA aims to maintain as much consistency as possible in data collection and reporting, some changes are made each year to improve data quality and to add clarity or additional information to the results that have been Program Report fixtures for years.
For the third year, this report includes information on the proportion of programs that did not report demographic information for their first-year class (Table 48) and their 2019 cohort (Table 56). The consolidation of statistics on missing student demographic data was a necessary inclusion due to this recurring problem, which has potentially adverse effects for the PA profession as a whole and for PA education, specifically. Diversity is a core aspect of the PAEA mission and one of the dominant themes of the PAEA Strategic Plan. When programs do not report student demographic information — either because they did not collect this information or chose not to provide it — critical information about the national PA student body is lost. This not only limits the Research Team’s reporting and capacity for empirical research on the PA student body, but it also weakens the data that PAEA’s Government Relations Team uses to advocate for debt relief and the support of PA education in state and federal policy. While the PAEA Research Team is exploring methods for improving these data and making collecting them less onerous, programs are encouraged to prioritize the accurate collection and tracking of student demographic information to ensure the most reliable data are available for the profession.

3 | PROGRAM REPORT 35 | METHoDS
Limitations
As previously noted, impacts of the COVID-19 pandemic may significantly limit the generalizability of this report.
For the first time in 10 years, PAEA’s annual Program Survey did not achieve a 100% response rate; therefore, this report does not contain complete coverage of all PAEA member programs at the time of survey administration. Still, the high response rate of 97.1% does ensure that the results presented here are broadly representative of the entire landscape of PA programs in the United States. Cognizant that a 100% response rate was not going to be possible this year, the PAEA Research Team investigated whether non-responding and responding programs differed based on certain program characteristics, such as institution type and Academic Health Center status. Fortunately, no clear patterns were identified, but this analysis revealed inconsistencies in reported program characteristics over the years.
As with any survey, all data presented in this and prior reports are self-reported by programs and may vary in response rate and accuracy; thus, yearly fluctuations in the data do occur. For example, some programs reported changing public/private statuses where no record could be found in changes at the institutional level. Additionally, in questions addressing student demographics, some programs only reported headcounts of students belonging to a non-majority demographic group (e.g., in response to the question about first-year students’ ethnicities, a program might report two Hispanic students but no non-Hispanic students). If substantial changes in any data occur in a particular year, PAEA recommends waiting until the following year’s report is released before taking any permanent actions in your program, in order to identify whether the change was unique to that year (e.g., due to response rate or random fluctuation).
Questions & Data Requests
The data from the 2019 Program Survey, as well as custom reports using these data, are available upon request. For more information, refer to PAEA’s Data Request & Sharing Policies. Please direct inquiries regarding data requests or this report to the Research Team at [email protected].

4 | PROGRAM REPORT 35 | SECTion 1. gEnERAl infoRMATion
SECTiON 1. GENERAL iNFORMATiON
Year
242
0
25
50
75
100
125
150
175
200
225
250
1960 1970 1980 1990 2000 2010 2020
Prog
ram
s
FiGURE 1. CUMULATiVE TOTAL NUMBER OF PROGRAMS SiNCE 1965
TABLE 1. SPONSORiNG iNSTiTUTiON ATTRiBUTES
n %Type of institution
Private, non-profit 145 61.7Public 69 29.4Private, for-profit 13 5.5Public/private hybrid 7 3.0Military 1 0.4
Academic Health Center statusNon-AHC 171 72.8AHC 64 27.2
Administrative housingSchool of Allied Health/Health Professions/Health Sciences 130 55.3Department of PA Studies/PA Program 41 17.4College/School of Medicine 37 15.7College of Graduate and Professional Studies 10 4.3College of Arts and Sciences 8 3.4Other health discipline (e.g., Nursing, Pharmacy, Podiatry, etc.) 5 2.1Science department 4 1.7
Total 235 100.0

5 | PROGRAM REPORT 35 | SECTion 1. gEnERAl infoRMATion
FiGURE 2. U.S. CENSUS BUREAU REGiONS AND DiViSiONS
PACIFIC EAST NORTH CENTRAL
NEW ENGLAND
WEST SOUTH CENTRAL
MIDDLE ATLANTIC
MOUNTAIN WEST NORTH CENTRAL
SOUTH ATLANTIC
EAST SOUTH CENTRAL
WEST
MIDWEST
SOUTH
NORTHEAST
REgion 1 NORTHEASTDiViSion 1 NEW ENGLANDConnecticut (6)Maine (1)Massachusetts (8)New Hampshire (2)Rhode Island (2)Vermont (0)
DiViSion 2 MIDDLE ATLANTICNew Jersey (3)New York (23)Pennsylvania (21)
REgion 2 MIDWESTDiViSion 3 EAST NORTH CENTRALIllinois (5)Indiana (8)Michigan (5)Ohio (12)Wisconsin (5)
DiViSion 4 WEST NORTH CENTRALIowa (3)Kansas (1)Minnesota (3)Missouri (4)Nebraska (4)North Dakota (1)South Dakota (1)
REgion 3 SOUTHDiViSion 5 SOUTH ATLANTICDelaware (0)District of Columbia (1)Florida (16)Georgia (5)Maryland (3) North Carolina (10)South Carolina (5)Virginia (8)West Virginia (3)
DiViSion 6 EAST SOUTH CENTRALAlabama (3)Kentucky (3)Mississippi (1)Tennessee (8)
DiViSion 7 WEST SOUTH CENTRALArkansas (2)Louisiana (3)Oklahoma (3)Texas (9)
REgion 4 WESTDiViSion 8 MOUNTAINArizona (3)Colorado (4)Idaho (1)Montana (1)Nevada (2)New Mexico (2)Utah (2)Wyoming (0)
DiViSion 9 PACIFICAlaska (0)California (15)Hawaii (0)Oregon (2)Washington (2)
Note: Numbers in parentheses indicate the number of PAEA member programs in each state.

6 | PROGRAM REPORT 35 | SECTion 1. gEnERAl infoRMATion
20 programs operated a total of 24 satellite campuses. Of those programs with satellite campuses, 3 (15.0%) had separate admissions processes.
TABLE 2. GEOGRAPHiC DiSTRiBUTiON OF PROGRAMS
n %Northeast Region
New England Division 19 8.1Middle Atlantic Division 47 20.0Subtotal 66 28.1
Midwest RegionEast North Central Division 35 14.9West North Central Division 17 7.2Subtotal 52 22.1
South RegionSouth Atlantic Division 51 21.7East South Central Division 15 6.4West South Central Division 17 7.2Subtotal 83 35.3
West RegionMountain Division 15 6.4Pacific Division 19 8.1Subtotal 34 14.5
Total 235 100.0
TABLE 3. ACADEMiC TERMS
n %Semesters 188 80.0Trimesters 20 8.5Quarters 20 8.5Other 7 3.0Total 235 100.0
Do not have satellite campuses
Have satellite campuses
8.5%
91.5%
FiGURE 3. SATELLiTE CAMPUSES
ACADEMiC TERMS & SCHEDULES

7 | PROGRAM REPORT 35 | SECTion 1. gEnERAl infoRMATion
FiGURE 4. PROGRAM START AND END MONTHS
FiGURE 5. TOTAL PROGRAM LENGTH (MONTHS)
TABLE 4. CREDiTS REQUiRED FOR COMPLETiON BY ACADEMiC TERM
n Min Max M SD MdnSemesters 186 54.0 154.0 108.6 16.3 108.0Trimesters 20 82.0 161.5 110.7 17.8 110.3Quarters 20 105.0 182.0 149.8 22.1 151.0Other 7 91.0 165.0 118.9 23.0 116.0Overall 233 54.0 182.0 112.7 20.6 111.0
TABLE 6. TOTAL PROGRAM LENGTH (MONTHS)
n Min Max M SD MdnPA program length 235 24.0 36.0 26.7 2.3 27.0
TABLE 5. PROGRAM LENGTH (WEEKS)
n Min Max M SD P10 P25P50
(Mdn) P75 P90Didactic phase 233 26.0 94.0 57.8 9.6 50.0 52.0 55.0 64.0 70.0Clinical phase 234 24.0 105.0 53.2 8.4 47.0 49.0 52.0 55.0 64.0Vacation 234 2.0 33.0 9.5 4.8 5.0 6.0 8.0 11.0 15.0
Note: The length of didactic and clinical phases did not exclude vacations or other time off.
Start month
End month
0
5
10
15
20
25
30
DecemberNovemberOctoberSeptemberAugustJulyJuneMayAprilMarchFebruaryJanuaryMonth
Prog
ram
s (%
)
0
5
10
15
20
25
30
35
40
24 25 26 27 28 29 30 31 32 33 34 35 36Program length (months)
Prog
ram
s (%
) 26.4
3.86.8
35.7
16.2
2.6 3.80.0 0.4 0.4 0.4 0.4
3.0
77 programs (32.8%) offered clinical experiences during the didactic phase. On average, these programs offered clinical experiences on 15.3 days (Min = 1.0, Max = 120.0, SD = 18.1, Mdn = 10.0).

8 | PROGRAM REPORT 35 | SECTion 1. gEnERAl infoRMATion
91.0% of programs reported using CASPA to admit some or all students.
Programs were asked to report how many students were admitted during the graduate, professional phase of the 2018–2019 academic year from three categories:
• Admitted from undergraduate, pre-professional track to the graduate phase
• Direct program admission (not through CASPA) to the graduate phase
• CASPA applicant to the graduate phase (not part of undergraduate, pre-professional track)
CREDENTiALS
ADMiSSiONS
TABLE 7. ADMiSSiONS
n (P) n (S) M SD P10 P25P50
(Mdn) P75 P90
Mean % of
AdmissionsCASPA applicants to the graduate phase (not part of undergraduate, pre-professional track) 214 11,193 52.3 99.0 25.0 30.0 40.0 57.8 75.7 96.4
Direct program admission (not through CASPA) to the graduate phase 20 553 27.7 47.0 1.0 4.8 10.5 34.5 46.0 43.9Admitted from undergraduate, pre-professional track to the graduate phase 38 910 23.9 22.0 2.0 5.0 18.5 35.8 52.0 52.5
Note: “n (P)” refers to the number of reporting programs. “n (S)” refers to the number of students reported by the programs. “Mean % of admissions” represents the average percentage of admissions for that category for programs that reported admissions from that category.
TABLE 8. USE OF CASPA iN ADMiSSiONS
n %All students were admitted through CASPA 182 77.4Some but not all students were admitted through CASPA 32 13.6No students were admitted through CASPA 21 8.9No students were admitted in the 2018-2019 academic year 0 0.0Total 235 100.0
TABLE 9. CREDENTiALS AWARDED TO PA GRADUATES
n %Certificate of Completion 15 6.4Associate degree 1 0.4Baccalaureate degree 10 4.3Master's degree 232 98.7Master's degree plus Master of Public Health (MPH) 9 3.8Other 1 0.4Total 235 -
Note: Programs were asked to select all credentials awarded to their PA graduates. Percentages will sum to more than 100% because programs could select multiple credentials.

9 | PROGRAM REPORT 35 | SECTion 1. gEnERAl infoRMATion
35 programs (14.9%) reported having a pre-professional phase. These programs reported admitting a total of 1,248 pre-professional students (Min = 2, Max = 127, M = 39.0, SD = 27.5, Mdn = 39.0) in the 2018–2019 academic year.
PRE-PROFESSiONAL PHASE
TABLE 12. PROGRAM MODELS FOR THE PRE-PROFESSiONAL PHASE
n %3+2 20 57.13+3 4 11.44+2 4 11.42+3 3 8.6Other 4 11.4Total 35 100.0
TABLE 10. PRiMARY CREDENTiAL AWARDED TO PA GRADUATES
n %Certificate of Completion 0 0.0Associate degree 0 0.0Baccalaureate degree 1 3.4Master's degree (not Master of Public Health) 26 89.7Master of Public Health (MPH) as part of a dual master's degree program 1 3.4Doctorate degree 0 0.0Other 1 3.4Total 29 100.0Note: Programs that selected more than one credential awarded to PA graduates were asked to indicate which was their program’s primary credential.
TABLE 11. TYPE OF MASTER’S DEGREE AWARDED TO PA GRADUATES
n %MPAS: Master of Physician Assistant Studies 77 33.8MSPAS: Master of Science in Physician Assistant Studies 41 18.0MS: Master of Science 33 14.5MMS/MMSc: Master of Medical Science 30 13.2MSPA: Master of Science Physician Assistant 10 4.4MHS: Master of Health Science 9 3.9MPA: Master of Physician Assistant 7 3.1MPAP: Master of Physician Assistant Practice 4 1.8MSHS: Master of Science in Health Science 4 1.8MSM: Master of Science in Medicine 3 1.3Other master's degree 10 4.4Total 228 100.0
Do not have pre-professional phase
Have pre-professional phase
85.1%
14.9%
FiGURE 6. PROGRAMS WiTH A PRE-PROFESSiONAL PHASE

10 | PROGRAM REPORT 35 | SECTion 2. finAnCiAl infoRMATion
SECTiON 2. FiNANCiAL iNFORMATiONPrograms were asked to supply their financial information for the 2018–2019 fiscal year, as defined by the program, rather than the 2018–2019 academic year. All data were collected in 2019, prior to the onset of the COVID-19 pandemic. Therefore, it is unknown to what extent this information is still reflective of PA program finances. PAEA members are encouraged to read our limited series of COVID-19 Rapid Response Reports for information on how the pandemic impacted PA program finances.
Missing values, obvious and extreme outliers, and reports of $0 were excluded prior to analysis.
Throughout this section:
• “% reporting” refers to the proportion of responding programs that provided a dollar amount for a budget source, expense, or fee, divided by the total number of programs that provided dollar amounts for at least one budget source, expense, or fee. These numerators exclude programs that were unable to provide dollar amounts for that specific category.
• “n” refers to the number of programs that reported a dollar amount.
• “M (T)” refers to the 10% trimmed mean, or the mean when the top and bottom 10% of values are excluded. When interpreting financial statistics, readers are advised to rely primarily on medians and trimmed means, which are less susceptible to outlier influence then arithmetic means and are more useful for comparisons across time and between programs within the same year.
TABLE 13. FiSCAL YEAR DEFiNiTiONS
n %July 1 – June 30 174 74.0June 1 – May 31 29 12.3September 1 – August 31 14 6.0January 1 – December 31 8 3.4October 1 – September 30 7 3.0Other 3 1.3Total 235 100.0
PROGRAM BUDGET
Programs were asked to indicate all funding sources for their 2018–2019 fiscal year operations budgets, excluding in-kind contributions, from a list of 11 sources. Programs could provide up to five “Other” sources, which were recoded into existing categories when possible. Programs were then asked to report the dollar amount of funding received from each selected source. “Total budget” refers to the sum of each program’s itemized budget sources. Programs that reported total budgets of under $120,000 were excluded. A total of 229 programs reported dollar amounts. “Mean % of budget” was calculated by dividing each program’s amount of financial support from each source by the program’s total budget, then taking the average percentage across reporting programs. The percentages do not sum to 100% because not all programs reported receiving financial support from each source.

11 | PROGRAM REPORT 35 | SECTion 2. finAnCiAl infoRMATion
TABLE 14. SOURCES OF PROGRAMS’ FiNANCiAL SUPPORT ($)
% Reporting n M M (T) SD P10 P25 P50 (Mdn) P75 P90
Mean % of
BudgetBudgeted funds from sponsoring institution 74.7 171 1,420,862 1,192,967 1,403,381 152,188 304,218 1,186,000 1,885,100 2,932,956 83.1
Clinical practice income 3.9 9 67,085 67,085 78,800 13,730 34,872 49,206 62,196 113,493 2.5Endowment 7.4 17 229,043 55,108 732,726 3,303 8,200 31,899 94,680 138,729 4.7Federal grant/contract 8.7 20 152,227 122,214 167,036 9,350 34,908 84,834 210,008 322,534 6.6Private donations and gifts 9.2 21 49,927 36,624 68,001 1,989 7,100 13,750 50,000 127,109 3.1Private foundation 2.6 6 160,857 160,857 131,111 25,500 47,500 147,533 273,767 309,537 13.0State appropriations 8.7 20 731,948 687,954 526,034 215,282 400,684 615,504 1,009,952 1,343,979 47.2State grant/contract 3.9 9 95,235 95,235 53,918 26,281 75,000 96,000 120,000 163,961 4.1Tuition and fees received directly by the program 43.2 99 2,218,583 1,852,754 2,268,203 72,864 318,151 1,784,813 3,111,349 5,023,057 71.8
Other 3.1 7 656,566 656,566 1,041,319 20,903 30,426 400,000 594,345 1,600,612 33.6Total budget - 229 2,149,697 1,831,535 1,894,131 305,887 1,030,000 ,663,794 2,802,459 4,163,458 100.0
TABLE 15. SOURCES OF FiNANCiAL SUPPORT AMONG PUBLiC AND PRiVATE PROGRAMS ($)
% Reporting n M M (T) SD P10 P25 P50 (Mdn) P75 P90
Mean % of
BudgetPublic
Budgeted funds from sponsoring institution 74.6 50 991,794 925,196 756,126 119,472 259,436 944,802 1,502,313 1,981,500 69.8
Clinical practice income 11.9 8 66,174 66,174 84,190 13,514 29,695 42,517 53,897 124,537 2.7Endowment 10.4 7 451,625 451,625 1,152,947 2,152 3,236 25,891 30,950 1,245,573 7.7Federal grant/contract 10.4 7 144,100 144,100 110,964 29,926 48,272 150,420 215,928 272,454 6.6Private donations and gifts 11.9 8 13,968 13,968 14,761 3,120 6,226 9,950 14,563 26,420 0.5
State appropriations 29.9 20 731,948 687,954 526,034 215,282 400,684 615,504 1,009,952 1,343,979 47.2Tuition and fees received directly by the program 55.2 37 1,476,990 1,067,975 2,004,816 62,193 215,280 730,479 2,064,000 3,041,043 55.5
Total budget - 67 1,867,661 1,594,365 1,595,582 607,432 1,064,189 1,421,678 2,159,932 3,117,421 100.0Private
Budgeted funds from sponsoring institution 76.0 117 1,596,615 1,334,786 1,579,185 157,400 325,000 1,299,256 2,059,032 3,175,220 88.1
Endowment 6.5 10 73,235 71,023 52,618 7,865 28,106 82,550 108,255 128,432 2.5Federal grant/contract 7.8 12 169,361 138,310 197,745 12,000 42,272 84,834 220,471 421,682 7.1Private donations and gifts 8.4 13 72,056 62,357 78,659 2,040 9,700 44,667 122,657 164,029 4.8
State grant/contract 4.5 7 84,987 84,987 48,979 25,062 51,250 96,000 108,000 135,600 3.0Tuition and fees received directly by the program 38.3 59 2,696,647 2,389,763 2,357,907 76,590 906,270 2,293,000 3,611,266 5,456,365 80.5
Total budget - 154 2,298,518 1,970,752 2,030,053 263,396 1,030,500 1,787,600 3,014,123 4,639,976 100.0
Note: Sources with fewer than 5 programs reporting dollar amounts were excluded.
12 | PROGRAM REPORT 35 | SECTion 2. finAnCiAl infoRMATion
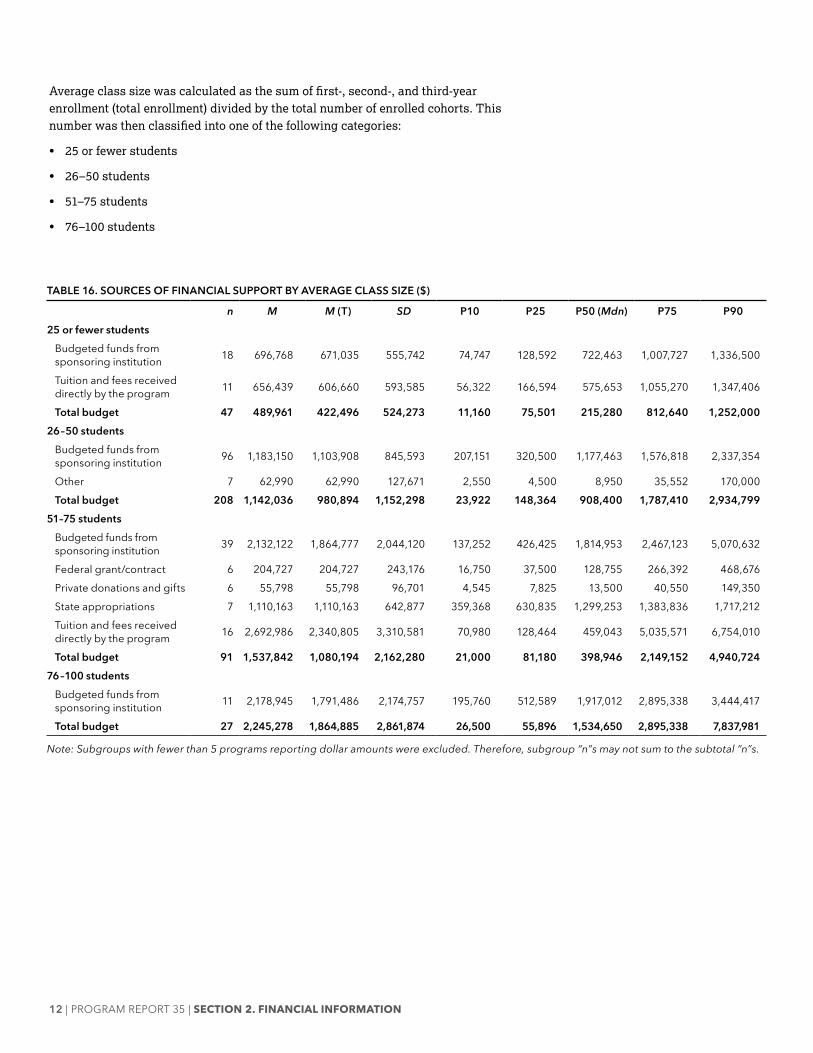
Average class size was calculated as the sum of first-, second-, and third-year enrollment (total enrollment) divided by the total number of enrolled cohorts. This number was then classified into one of the following categories:
• 25 or fewer students
• 26–50 students
• 51–75 students
• 76–100 students
TABLE 16. SOURCES OF FiNANCiAL SUPPORT BY AVERAGE CLASS SiZE ($)
n M M (T) SD P10 P25 P50 (Mdn) P75 P9025 or fewer students
Budgeted funds from sponsoring institution 18 696,768 671,035 555,742 74,747 128,592 722,463 1,007,727 1,336,500
Tuition and fees received directly by the program 11 656,439 606,660 593,585 56,322 166,594 575,653 1,055,270 1,347,406
Total budget 47 489,961 422,496 524,273 11,160 75,501 215,280 812,640 1,252,000 26–50 students
Budgeted funds from sponsoring institution 96 1,183,150 1,103,908 845,593 207,151 320,500 1,177,463 1,576,818 2,337,354
Other 7 62,990 62,990 127,671 2,550 4,500 8,950 35,552 170,000 Total budget 208 1,142,036 980,894 1,152,298 23,922 148,364 908,400 1,787,410 2,934,799
51–75 studentsBudgeted funds from sponsoring institution 39 2,132,122 1,864,777 2,044,120 137,252 426,425 1,814,953 2,467,123 5,070,632
Federal grant/contract 6 204,727 204,727 243,176 16,750 37,500 128,755 266,392 468,676 Private donations and gifts 6 55,798 55,798 96,701 4,545 7,825 13,500 40,550 149,350 State appropriations 7 1,110,163 1,110,163 642,877 359,368 630,835 1,299,253 1,383,836 1,717,212 Tuition and fees received directly by the program 16 2,692,986 2,340,805 3,310,581 70,980 128,464 459,043 5,035,571 6,754,010
Total budget 91 1,537,842 1,080,194 2,162,280 21,000 81,180 398,946 2,149,152 4,940,724 76–100 students
Budgeted funds from sponsoring institution 11 2,178,945 1,791,486 2,174,757 195,760 512,589 1,917,012 2,895,338 3,444,417
Total budget 27 2,245,278 1,864,885 2,861,874 26,500 55,896 1,534,650 2,895,338 7,837,981
Note: Subgroups with fewer than 5 programs reporting dollar amounts were excluded. Therefore, subgroup “n”s may not sum to the subtotal “n”s.

13 | PROGRAM REPORT 35 | SECTion 2. finAnCiAl infoRMATion
TABLE 17. SOURCES OF FiNANCiAL SUPPORT BY AVERAGE CLASS SiZE AMONG PUBLiC AND PRiVATE PROGRAMS ($)
n M M (T) SD P10 P25 P50 (Mdn) P75 P90Public
Budgeted funds from sponsoring institution25 or fewer students 8 525,141 525,141 417,106 17,641 92,264 644,659 852,152 957,00026 – 50 students 30 1,039,454 1,018,693 626,579 195,564 445,257 1,094,256 1,502,313 1,785,51451 – 75 students 10 1,056,475 1,026,332 876,240 144,862 313,485 918,353 1,760,309 2,170,593Subtotal 50 991,794 925,196 756,126 119,472 259,436 944,802 1,502,313 1,981,500
Tuition and fees received directly by the program25 or fewer students 5 503,134 503,134 492,808 156,856 215,280 276,830 575,653 1,028,26126 – 50 students 23 1,188,149 1,106,697 1,024,677 49,386 334,690 1,059,598 1,924,407 2,477,17051 – 75 students 6 2,304,326 2,304,326 3,378,959 129,368 194,050 297,111 3,812,252 6,486,500Subtotal 37 1,476,990 1,067,975 2,004,816 62,193 215,280 730,479 2,064,000 3,041,043
Total budget25 or fewer students 24 389,093 349,655 396,064 5,070 25,708 225,547 644,494 972,12326 – 50 students 76 852,089 756,183 799,363 30,950 151,746 714,353 1,379,682 2,006,37851 – 75 students 40 832,998 495,856 1,524,927 9,710 34,371 267,107 1,307,944 2,143,86676 – 100 students 6 1,531,260 1,531,260 1,621,956 24,325 71,817 1,314,206 2,907,725 3,255,250Subtotal 67 851,247 625,431 1,233,756 14,849 61,098 393,557 1,222,502 2,095,418
PrivateBudgeted funds from sponsoring institution
25 or fewer students 10 834,069 804,942 633,195 118,893 205,983 894,421 1,187,608 1,670,01626 – 50 students 64 1,215,864 1,130,909 906,109 213,052 305,609 1,178,727 1,705,024 2,452,20451 – 75 students 29 2,503,035 2,268,911 2,206,404 137,252 1,496,419 1,904,900 3,249,689 5,612,191Subtotal 117 1,596,615 1,334,786 1,579,185 157,400 325,000 1,299,256 2,059,032 3,175,220
Tuition and fees received directly by the program25 or fewer students 6 784,193 784,193 683,601 39,661 232,242 770,270 1,205,690 1,542,64726 – 50 students 35 2,459,651 2,467,560 1,402,699 203,074 1,672,385 2,557,500 3,336,759 4,188,92051 – 75 students 8 3,217,314 3,217,314 3,774,299 54,850 77,470 2,274,373 5,294,469 6,936,31376 – 100 students 5 6,093,616 6,093,616 3,477,101 2,287,282 2,699,162 8,052,424 8,099,731 9,002,332Subtotal 59 2,696,647 2,389,763 2,357,907 76,590 906,270 2,293,000 3,611,266 5,456,365
Total budget25 or fewer students 23 595,215 533,272 622,923 27,673 95,340 195,066 1,069,670 1,593,48126 – 50 students 129 1,285,546 1,128,957 1,287,169 18,884 127,109 1,119,650 2,100,000 3,196,61351 – 75 students 48 2,147,853 1,780,876 2,471,789 66,910 154,732 1,602,136 3,158,461 5,532,69276 – 100 students 20 2,559,797 2,091,183 3,168,365 27,250 65,131 1,725,831 2,876,529 8,057,155Subtotal 147 1,525,741 1,172,919 1,869,813 29,789 126,582 1,073,814 2,203,920 3,617,015
All programsBudgeted funds from sponsoring institution
25 or fewer students 18 696,768 671,035 555,742 74,747 128,592 722,463 1,007,727 1,336,50026 – 50 students 94 1,159,563 1,084,035 827,914 204,904 311,500 1,170,857 1,571,780 2,283,30551 – 75 students 39 2,132,122 1,864,777 2,044,120 137,252 426,425 1,814,953 2,467,123 5,070,63276 – 100 students 10 2,372,939 1,985,546 2,189,773 191,184 973,294 2,066,346 2,914,147 3,869,477Subtotal 167 1,415,531 1,186,805 1,410,188 151,335 304,218 1,180,730 1,885,100 2,887,814

14 | PROGRAM REPORT 35 | SECTion 2. finAnCiAl infoRMATion
TABLE 18. SOURCES OF FiNANCiAL SUPPORT BY ACADEMiC HEALTH CENTER STATUS ($)
% Reporting n M M (T) SD P10 P25 P50 (Mdn) P75 P90
Mean % of
BudgetAcademic Health Center
Budgeted funds from sponsoring institution 63.5 40 1,693,772 1,331,451 1,894,080 148,955 656,836 1,328,168 1,855,693 3,011,027 71.5
Clinical practice income 12.7 8 67,696 67,696 84,218 13,514 29,695 42,517 56,939 133,056 2.6Endowment 14.3 9 397,399 397,399 1,002,104 4,083 30,000 75,000 112,780 740,676 6.3Federal grant/contract 11.1 7 246,320 246,320 229,781 48,000 74,775 150,420 373,135 521,031 5.2Private donations and gifts 15.9 10 51,187 32,322 78,498 6,690 9,925 15,375 43,741 135,421 0.8State appropriations 23.8 15 674,789 666,398 467,867 112,626 349,473 527,235 1,030,831 1,320,110 49.1Tuition and fees received directly by the program 58.7 37 2,516,964 2,158,799 2,669,426 45,693 330,008 1,858,560 3,630,847 6,333,971 66.0
Total budget - 63 2,820,847 2,393,114 2,488,724 719,088 1,234,481 1,832,831 3,291,698 7,181,141 100.0Non-Academic Health Center
Budgeted funds from sponsoring institution 79.4 131 1,337,531 1,151,048 1,212,146 153,937 291,310 1,176,724 1,885,100 2,857,720 86.6
Endowment 4.8 8 39,643 39,643 45,384 3,370 7,043 25,446 47,594 103,776 2.8Federal grant/contract 7.9 13 101,561 93,610 99,154 4,800 20,000 63,821 184,354 237,503 7.3Private donations and gifts 6.7 11 48,782 40,316 60,824 1,800 2,797 13,500 80,237 127,109 5.3Private foundation 3.6 6 160,857 160,857 131,111 25,500 47,500 147,533 273,767 309,537 13.0State appropriations 3.0 5 903,426 903,426 706,558 452,240 468,575 719,591 745,070 1,583,554 41.5State grant/contract 3.6 6 87,286 87,286 60,874 24,453 39,375 85,500 114,000 151,904 5.2Tuition and fees received directly by the program 37.6 62 2,040,517 1,735,216 1,993,410 80,088 328,109 1,718,986 2,916,644 3,955,883 75.2
Total budget - 165 1,878,615 1,664,151 1,550,613 245,516 923,555 1,549,570 2,472,863 3,612,903 100.0
Note: Sources with fewer than 5 programs reporting dollar amounts were excluded.
TABLE 17. SOURCES OF FiNANCiAL SUPPORT BY AVERAGE CLASS SiZE AMONG PUBLiC AND PRiVATE PROGRAMS ($) (continued)
n M M (T) SD P10 P25 P50 (Mdn) P75 P90Tuition and fees received directly by the program
25 or fewer students 11 656,439 606,660 593,585 56,322 166,594 575,653 1,055,270 1,347,40626 – 50 students 58 1,955,435 1,888,540 1,404,474 111,397 592,114 1,929,280 3,003,774 3,713,93151 – 75 students 14 2,826,033 2,437,331 3,504,525 65,788 101,537 297,111 5,160,714 7,252,40676 – 100 students 7 4,702,697 4,702,697 3,766,791 1,214,876 2,222,674 2,699,162 8,076,078 8,701,465Subtotal 96 2,226,571 1,848,515 2,296,416 69,660 298,928 1,761,350 3,197,218 5,098,143
Total budget25 or fewer students 47 489,961 422,496 524,273 11,160 75,501 215,280 812,640 1,252,00026 – 50 students 205 1,124,850 958,096 1,148,272 22,844 142,197 858,101 1,764,429 2,912,51351 – 75 students 88 1,550,191 1,115,332 2,185,555 26,510 82,570 375,898 2,145,848 4,950,40776 – 100 students 26 2,322,442 1,938,789 2,889,764 26,250 46,660 1,725,831 2,914,147 7,873,722Subtotal 214 1,264,130 930,841 1,683,089 21,084 115,317 652,488 1,800,180 3,141,280
Note: Subgroups with fewer than 5 programs reporting dollar amounts were excluded. Therefore, subgroup “n”s may not sum to the subtotal “n”s.

15 | PROGRAM REPORT 35 | SECTion 2. finAnCiAl infoRMATion
PROGRAM EXPENSES
Programs were asked to report their total, non-itemized expenses for the 2018–2019 fiscal year. In addition, programs were asked to indicate itemized expenses incurred during the 2018–2019 fiscal year, from a list of 22 expense categories. Programs were then asked to report dollar amounts for each selected category. Programs could provide up to five “Other” sources, which were recoded into existing categories when possible. A total of 234 programs reported dollar amounts. “Total expenses” refers to the sum of each program’s itemized expenses.
TABLE 19. SOURCES OF FiNANCiAL SUPPORT BY ADMiNiSTRATiVE HOUSiNG ($)
n M M (T) SD P10 P25 P50 (Mdn) P75 P90
Mean % of
BudgetCollege of Arts and Sciences
Budgeted funds from sponsoring institution 7 708,680 708,680 588,672 121,701 209,139 644,991 1,239,993 1,346,516 79.6
Total budget 8 556,574 511,943 622,534 1,518 76,169 209,139 1,210,362 1,415,741 100.0College of Graduate and Professional Studies
Budgeted funds from sponsoring institution 7 1,583,596 1,583,596 1,165,240 267,028 751,400 1,593,745 2,085,484 2,794,348 74.0
Tuition and fees received directly by the program 6 1,675,982 1,675,982 1,515,022 197,184 548,820 1,369,603 2,586,522 3,461,160 73.6
Total budget 10 1,105,698 909,904 1,254,693 20,431 115,768 392,805 1,669,050 3,022,171 100.0College/School of Medicine
Budgeted funds from sponsoring institution 24 1,788,636 1,457,837 2,026,037 116,201 542,438 1,283,984 2,476,796 3,372,852 65.8
Tuition and fees received directly by the program 23 2,657,906 2,343,815 2,312,099 61,581 1,009,374 2,162,115 3,487,911 4,868,200 70.8
Total budget 37 1,273,849 892,140 1,881,472 10,200 49,375 375,632 1,862,400 3,331,105 100.0Department of PA Studies/PA Program
Budgeted funds from sponsoring institution 28 1,638,704 1,329,160 1,812,764 191,342 347,246 1,300,438 1,807,608 3,469,616 90.2
Tuition and fees received directly by the program 16 2,497,567 2,456,790 1,951,252 77,329 989,015 2,245,704 3,815,544 5,333,369 83.5
Total budget 40 1,693,253 1,378,420 1,846,770 75,466 233,861 1,300,438 2,083,214 4,690,323 100.0School of Allied Health/Health Professions/ Health Sciences
Budgeted funds from sponsoring institution 98 1,310,504 1,150,945 1,154,090 153,412 302,827 1,170,857 1,894,616 2,542,752 85.0
Tuition and fees received directly by the program 47 2,020,316 1,566,347 2,382,892 108,584 297,111 1,347,406 2,909,760 4,080,962 69.9
Total budget 125 1,204,935 920,452 1,566,507 25,446 141,445 719,927 1,759,649 2,909,760 100.0
Note: Sources with fewer than 5 programs reporting dollar amounts were excluded.

16 | PROGRAM REPORT 35 | SECTion 2. finAnCiAl infoRMATion
TABLE 20. PROGRAM EXPENSES ($)
% Reporting n M M (T) SD P10 P25
P50 (Mdn) P75 P90
ARC-PA/Accreditation 85.2 195 16,249 15,453 5,810 15,000 15,000 15,000 15,000 22,500 Building expenses (e.g., lease, rent, furniture, renovations) 31.9 73 129,980 79,806 213,946 1,093 4,527 29,566 136,256 392,040
Education equipment/texts (not including simulation products) 75.1 172 20,023 12,570 34,395 1,000 2,499 7,647 23,725 45,900
Events (e.g., whitecoat, graduation) 82.1 188 9,793 7,305 12,094 1,000 2,223 5,332 11,341 24,860 Exams/testing (e.g., PACKRAT/EOR) 81.2 186 15,069 11,425 21,070 2,710 6,030 10,000 15,965 28,775 Faculty development (e.g., conferences, coursework, advanced degree)
93.0 213 20,172 17,520 18,563 5,080 9,788 16,000 25,000 39,818
Faculty fringe benefits 67.7 155 252,528 236,687 170,751 48,918 145,074 231,604 325,108 463,977 Faculty salaries (excluding fringe benefits) 94.3 216 909,758 863,031 414,036 498,500 611,265 835,682 1,081,657 1,436,072
Institution tax 16.6 38 862,053 645,054 1,209,335 900 53,458 280,677 1,115,143 2,232,500 IT (e.g., hardware, databases, clinical tracking, other software) 75.1 172 21,454 17,201 22,870 3,173 6,980 13,571 27,002 53,283
Laboratory supplies 85.6 196 20,800 14,798 31,436 1,350 4,742 10,000 23,800 51,000 Marketing and student recruitment 48.9 112 6,903 5,273 9,097 500 1,059 3,752 10,000 19,661 Office expenses (e.g., supplies, printing) 92.6 212 12,977 8,916 18,695 2,000 3,200 7,026 14,161 29,907
Payment for didactic instruction not included in faculty salaries 76.0 174 57,651 41,886 73,932 3,054 8,550 35,300 75,000 139,208
Payment for student housing and travel to remote clinical training sites 18.3 42 43,602 32,951 59,580 3,839 9,108 17,725 63,938 109,028
Payment for supervised clinical practice (sites and/or clinical preceptors)
41.0 94 200,811 147,644 268,346 14,300 32,985 121,450 278,250 380,694
Program membership/association fees and dues (including PAEA) 89.5 205 10,094 8,526 8,357 4,100 4,380 6,500 12,885 21,236
Simulation activities (excluding capital and standardized patients) 34.5 79 29,400 18,855 47,194 940 5,000 11,940 31,857 71,280
Staff fringe benefits 69.4 159 70,600 50,140 106,510 10,094 20,173 40,000 79,939 151,528 Staff salaries (excluding fringe benefits) 91.3 209 179,043 150,321 184,047 44,840 86,450 133,181 218,703 327,893
Standardized patients 60.3 138 12,338 10,157 12,678 2,129 4,340 7,040 17,375 27,748 Travel (not faculty development) 71.2 163 16,066 9,591 28,941 1,000 2,475 7,341 15,484 29,927 Other 27.9 64 266,016 104,472 673,488 4,579 13,767 58,425 190,627 457,536 Total expenses 100.0 229 1,789,793 1,573,290 1,336,477 725,285 1,091,685 1,497,398 2,024,248 3,147,430
Note: Sources with fewer than 5 programs reporting dollar amounts were excluded.
The average institutional fringe rate for faculty salaries was 25.2% (n = 220, SD = 11.9, Mdn = 27.0).

17 | PROGRAM REPORT 35 | SECTion 2. finAnCiAl infoRMATion
TABLE 21. PROGRAM EXPENSES AMONG PRiVATE AND PUBLiC PROGRAMS ($)
% Reporting n M M (T) SD P10 P25
P50 (Mdn) P75 P90
PublicARC-PA/Accreditation 82.4 56 16,429 15,400 6,514 15,000 15,000 15,000 15,000 22,500 Building expenses (e.g., lease, rent, furniture, renovations) 20.6 14 198,671 153,330 322,519 5,122 6,029 58,015 162,767 745,202
Education equipment/texts (not including simulation products) 77.9 53 21,375 12,474 39,217 800 2,000 7,413 28,138 42,355
Events (e.g., whitecoat, graduation) 82.4 56 8,033 5,779 10,417 1,000 2,000 5,000 8,410 19,291 Exams/testing (e.g., PACKRAT/EOR) 77.9 53 13,391 10,661 13,705 2,720 7,210 10,000 13,458 23,740 Faculty development (e.g., conferences, coursework, advanced degree) 91.2 62 20,117 16,728 24,149 6,373 9,850 15,171 23,901 34,600
Faculty fringe benefits 63.2 43 263,142 245,322 166,109 109,447 148,684 235,131 355,058 464,760 Faculty salaries (excluding fringe benefits) 98.5 67 890,173 827,607 506,101 455,967 553,741 734,098 1,090,314 1,454,295
Institution tax 19.1 13 230,983 173,957 320,144 294 19,066 100,000 241,375 609,647 IT (e.g., hardware, databases, clinical tracking, other software) 77.9 53 19,104 13,650 23,943 2,564 5,000 10,565 23,300 34,328
Laboratory supplies 82.4 56 19,890 11,116 44,538 459 2,500 6,850 17,179 48,749 Marketing and student recruitment 45.6 31 4,895 4,085 5,195 290 1,100 2,397 7,125 11,519 Office expenses (e.g., supplies, printing) 88.2 60 16,084 10,058 26,135 2,000 3,000 7,312 15,362 30,307
Payment for didactic instruction not included in faculty salaries 63.2 43 38,979 31,428 45,497 2,000 5,142 22,465 56,451 107,400
Payment for student housing and travel to remote clinical training sites 10.3 7 50,178 50,178 50,065 5,800 10,694 22,000 88,294 108,507
Payment for supervised clinical practice (sites and/or clinical preceptors) 13.2 9 161,647 161,647 160,394 43,000 54,700 59,999 300,000 347,320
Program membership/association fees and dues (including PAEA) 91.2 62 8,944 7,231 8,430 4,100 4,275 4,795 10,559 19,900
Simulation activities (excluding capital and standardized patients) 29.4 20 38,665 20,197 68,686 2,290 5,054 8,750 40,500 87,864
Staff fringe benefits 70.6 48 90,741 49,878 169,865 15,695 18,168 35,467 75,910 155,230 Staff salaries (excluding fringe benefits) 95.6 65 190,763 142,071 267,170 34,663 61,923 120,349 230,856 341,589 Standardized patients 58.8 40 11,273 8,551 12,084 2,895 5,000 7,191 13,020 24,673 Travel (not faculty development) 69.1 47 14,978 8,188 32,394 1,000 2,000 5,122 13,899 27,178 Other 20.6 14 207,397 74,531 524,176 1,672 9,946 38,689 161,038 204,330 Total expenses 100.0 68 1,618,639 1,425,746 1,237,433 693,991 1,008,114 1,336,278 1,927,785 2,421,204
PrivateARC-PA/Accreditation 85.6 131 16,210 15,526 5,676 15,000 15,000 15,000 15,000 22,500 Building expenses (e.g., lease, rent, furniture, renovations) 35.3 54 100,494 61,365 173,755 756 2,954 24,500 103,293 305,587
Education equipment/texts (not including simulation products) 72.5 111 18,128 11,752 30,882 1,178 2,799 7,125 20,173 45,000
Events (e.g., whitecoat, graduation) 83.0 127 10,728 8,179 12,897 1,000 2,322 6,215 14,938 25,227 Exams/testing (e.g., PACKRAT/EOR) 82.4 126 16,150 12,069 23,886 2,916 6,445 10,075 17,652 30,305 Faculty development (e.g., conferences, coursework, advanced degree) 93.5 143 19,831 17,559 15,755 5,000 8,817 16,000 25,197 40,319
Faculty fringe benefits 69.3 106 246,264 228,907 175,505 45,022 132,358 214,433 315,553 462,774 Faculty salaries (excluding fringe benefits) 92.8 142 916,774 874,715 373,799 546,003 634,588 860,132 1,078,201 1,433,557
Institution tax 15.7 24 1,239,799 1,024,873 1,375,837 24,164 182,995 754,664 1,937,321 2,679,566 IT (e.g., hardware, databases, clinical tracking, other software) 73.9 113 22,541 18,903 22,525 3,568 8,004 14,997 30,000 53,019
18 | PROGRAM REPORT 35 | SECTion 2. finAnCiAl infoRMATion
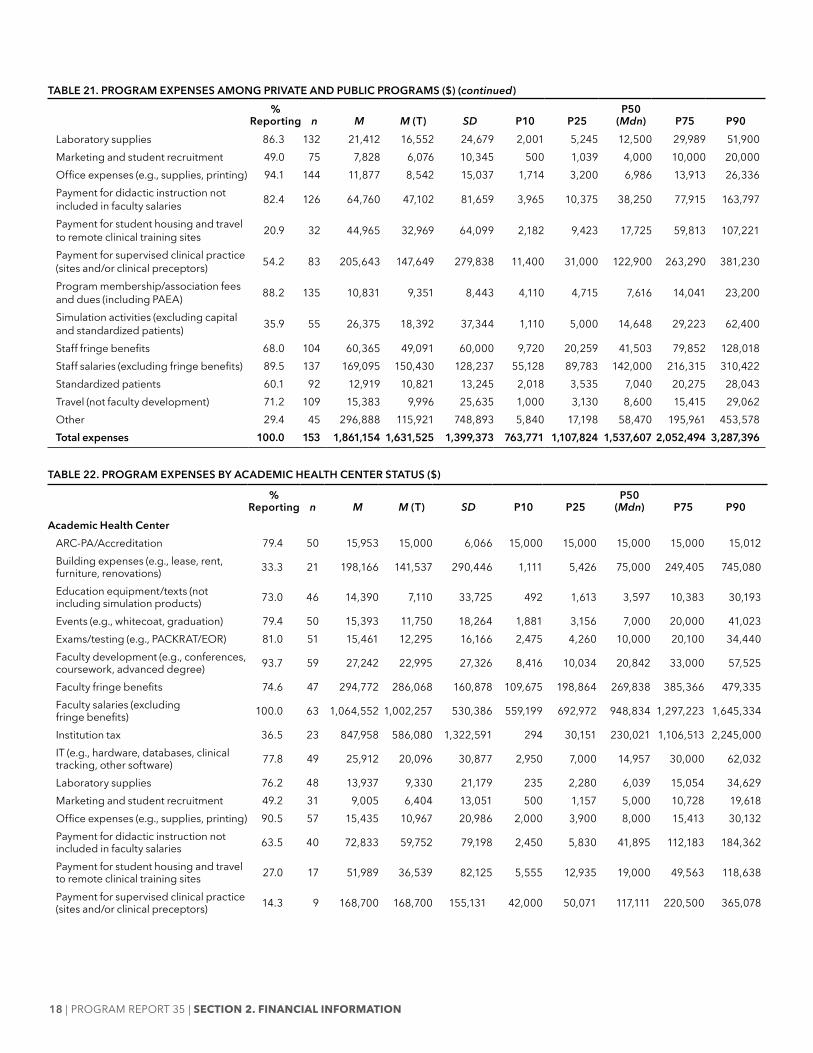
TABLE 21. PROGRAM EXPENSES AMONG PRiVATE AND PUBLiC PROGRAMS ($) (continued)%
Reporting n M M (T) SD P10 P25P50
(Mdn) P75 P90Laboratory supplies 86.3 132 21,412 16,552 24,679 2,001 5,245 12,500 29,989 51,900 Marketing and student recruitment 49.0 75 7,828 6,076 10,345 500 1,039 4,000 10,000 20,000 Office expenses (e.g., supplies, printing) 94.1 144 11,877 8,542 15,037 1,714 3,200 6,986 13,913 26,336 Payment for didactic instruction not included in faculty salaries 82.4 126 64,760 47,102 81,659 3,965 10,375 38,250 77,915 163,797
Payment for student housing and travel to remote clinical training sites 20.9 32 44,965 32,969 64,099 2,182 9,423 17,725 59,813 107,221
Payment for supervised clinical practice (sites and/or clinical preceptors) 54.2 83 205,643 147,649 279,838 11,400 31,000 122,900 263,290 381,230
Program membership/association fees and dues (including PAEA) 88.2 135 10,831 9,351 8,443 4,110 4,715 7,616 14,041 23,200
Simulation activities (excluding capital and standardized patients) 35.9 55 26,375 18,392 37,344 1,110 5,000 14,648 29,223 62,400
Staff fringe benefits 68.0 104 60,365 49,091 60,000 9,720 20,259 41,503 79,852 128,018 Staff salaries (excluding fringe benefits) 89.5 137 169,095 150,430 128,237 55,128 89,783 142,000 216,315 310,422 Standardized patients 60.1 92 12,919 10,821 13,245 2,018 3,535 7,040 20,275 28,043 Travel (not faculty development) 71.2 109 15,383 9,996 25,635 1,000 3,130 8,600 15,415 29,062 Other 29.4 45 296,888 115,921 748,893 5,840 17,198 58,470 195,961 453,578 Total expenses 100.0 153 1,861,154 1,631,525 1,399,373 763,771 1,107,824 1,537,607 2,052,494 3,287,396
TABLE 22. PROGRAM EXPENSES BY ACADEMiC HEALTH CENTER STATUS ($)
% Reporting n M M (T) SD P10 P25
P50 (Mdn) P75 P90
Academic Health CenterARC-PA/Accreditation 79.4 50 15,953 15,000 6,066 15,000 15,000 15,000 15,000 15,012 Building expenses (e.g., lease, rent, furniture, renovations) 33.3 21 198,166 141,537 290,446 1,111 5,426 75,000 249,405 745,080
Education equipment/texts (not including simulation products) 73.0 46 14,390 7,110 33,725 492 1,613 3,597 10,383 30,193
Events (e.g., whitecoat, graduation) 79.4 50 15,393 11,750 18,264 1,881 3,156 7,000 20,000 41,023 Exams/testing (e.g., PACKRAT/EOR) 81.0 51 15,461 12,295 16,166 2,475 4,260 10,000 20,100 34,440 Faculty development (e.g., conferences, coursework, advanced degree) 93.7 59 27,242 22,995 27,326 8,416 10,034 20,842 33,000 57,525
Faculty fringe benefits 74.6 47 294,772 286,068 160,878 109,675 198,864 269,838 385,366 479,335 Faculty salaries (excluding fringe benefits) 100.0 63 1,064,552 1,002,257 530,386 559,199 692,972 948,834 1,297,223 1,645,334
Institution tax 36.5 23 847,958 586,080 1,322,591 294 30,151 230,021 1,106,513 2,245,000 IT (e.g., hardware, databases, clinical tracking, other software) 77.8 49 25,912 20,096 30,877 2,950 7,000 14,957 30,000 62,032
Laboratory supplies 76.2 48 13,937 9,330 21,179 235 2,280 6,039 15,054 34,629 Marketing and student recruitment 49.2 31 9,005 6,404 13,051 500 1,157 5,000 10,728 19,618 Office expenses (e.g., supplies, printing) 90.5 57 15,435 10,967 20,986 2,000 3,900 8,000 15,413 30,132 Payment for didactic instruction not included in faculty salaries 63.5 40 72,833 59,752 79,198 2,450 5,830 41,895 112,183 184,362
Payment for student housing and travel to remote clinical training sites 27.0 17 51,989 36,539 82,125 5,555 12,935 19,000 49,563 118,638
Payment for supervised clinical practice (sites and/or clinical preceptors) 14.3 9 168,700 168,700 155,131 42,000 50,071 117,111 220,500 365,078

19 | PROGRAM REPORT 35 | SECTion 2. finAnCiAl infoRMATion
TABLE 22. PROGRAM EXPENSES BY ACADEMiC HEALTH CENTER STATUS ($) (continued)%
Reporting n M M (T) SD P10 P25P50
(Mdn) P75 P90Program membership/association fees and dues (including PAEA) 85.7 54 9,543 7,982 8,413 4,000 4,275 5,014 10,750 20,608
Simulation activities (excluding capital and standardized patients) 41.3 26 50,355 38,032 72,165 575 4,863 18,844 53,552 159,447
Staff fringe benefits 76.2 48 109,916 70,654 168,659 20,125 30,993 56,687 103,157 171,013 Staff salaries (excluding fringe benefits) 95.2 60 243,613 192,120 282,045 46,886 108,476 179,055 275,586 447,087 Standardized patients 55.6 35 18,705 16,124 18,277 3,000 5,000 13,320 24,908 41,200 Travel (not faculty development) 66.7 42 21,244 13,423 36,064 615 3,075 8,083 24,926 49,769 Other 39.7 25 502,701 289,069 1,024,437 3,007 18,998 102,318 205,589 1,941,761 Total expenses 100.0 63 2,435,799 2,048,406 1,971,845 882,004 1,213,668 1,857,320 2,677,553 4,615,400
Non-Academic Health CenterARC-PA/Accreditation 87.3 145 16,351 15,681 5,737 15,000 15,000 15,000 15,000 22,500 Building expenses (e.g., lease, rent, furniture, renovations) 31.3 52 102,443 64,267 169,856 1,065 4,414 27,283 107,793 305,596
Education equipment/texts (not including simulation products) 75.9 126 22,079 14,968 34,539 1,347 3,318 9,900 26,404 49,007
Events (e.g., whitecoat, graduation) 83.1 138 7,764 6,382 8,047 1,000 2,199 5,000 10,464 17,150 Exams/testing (e.g., PACKRAT/EOR) 81.3 135 14,921 11,164 22,701 2,899 6,490 10,000 14,875 27,037 Faculty development (e.g., conferences, coursework, advanced degree) 92.8 154 17,463 15,862 12,952 4,206 8,141 15,000 22,616 35,739
Faculty fringe benefits 65.1 108 234,144 214,587 172,368 43,548 129,728 201,645 302,500 440,768 Faculty salaries (excluding fringe benefits) 92.2 153 846,020 809,714 337,212 491,800 600,000 782,899 1,021,600 1,299,814
Institution tax 9.0 15 883,665 731,241 1,056,176 27,034 125,359 476,170 1,315,638 2,037,314 IT (e.g., hardware, databases, clinical tracking, other software) 74.1 123 19,678 16,537 18,623 3,206 7,025 13,417 24,289 46,635
Laboratory supplies 89.2 148 23,025 16,846 33,869 2,000 5,202 11,922 30,178 53,800 Marketing and student recruitment 48.8 81 6,098 4,838 6,969 500 1,078 3,500 8,542 19,666 Office expenses (e.g., supplies, printing) 93.4 155 12,073 8,315 17,767 1,880 3,082 7,000 13,942 25,000
Payment for didactic instruction not included in faculty salaries 80.7 134 53,119 37,374 71,977 3,724 9,304 34,250 65,000 121,671
Payment for student housing and travel to remote clinical training sites 15.1 25 37,899 33,520 38,524 2,728 8,950 16,950 66,000 89,835
Payment for supervised clinical practice (sites and/or clinical preceptors)
51.2 85 204,211 147,565 278,048 14,400 30,000 122,900 279,000 380,158
Program membership/association fees and dues (including PAEA) 91.0 151 10,291 8,726 8,356 4,110 4,500 6,635 12,943 21,659
Simulation activities (excluding capital and standardized patients) 31.9 53 19,120 14,596 22,582 1,055 5,000 10,000 27,000 45,032
Staff fringe benefits 66.9 111 53,599 41,754 56,343 10,000 17,147 35,000 67,497 113,073 Staff salaries (excluding fringe benefits) 89.8 149 153,041 136,884 116,287 44,840 76,700 125,000 195,596 293,859 Standardized patients 62.0 103 10,174 8,789 9,267 2,000 3,937 6,000 14,772 24,725 Travel (not faculty development) 72.9 121 14,269 8,840 25,956 1,000 2,241 7,000 14,398 26,180 Other 23.5 39 114,295 83,168 169,392 6,680 12,364 34,093 129,036 354,775 Total expenses 100.0 166 1,544,622 1,430,341 887,320 704,811 1,030,284 1,364,291 1,817,769 2,806,082
20 | PROGRAM REPORT 35 | SECTion 2. finAnCiAl infoRMATion
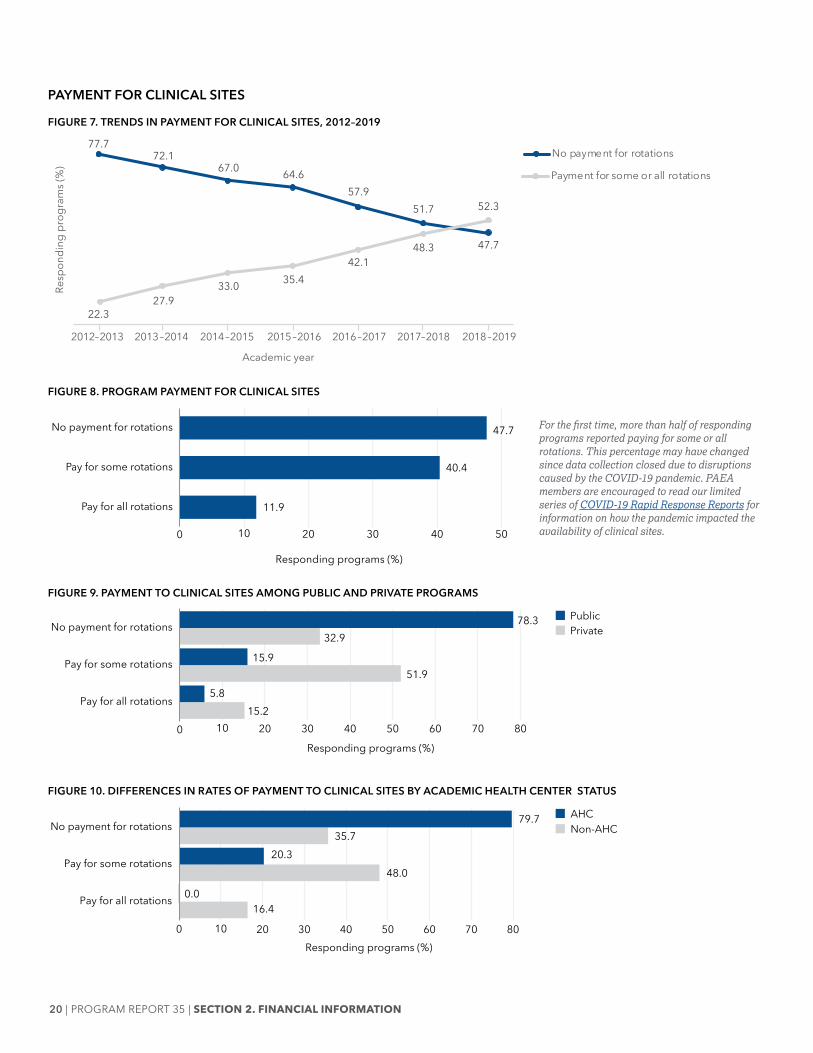
PAYMENT FOR CLiNiCAL SiTES
For the first time, more than half of responding programs reported paying for some or all rotations. This percentage may have changed since data collection closed due to disruptions caused by the COVID-19 pandemic. PAEA members are encouraged to read our limited series of COVID-19 Rapid Response Reports for information on how the pandemic impacted the availability of clinical sites.
77.772.1
67.0 64.657.9
51.7
47.7
22.327.9
33.0 35.442.1
48.3
52.3
2012–2013 2013–2014 2014–2015 2015–2016 2016–2017 2017–2018 2018–2019
No payment for rotations
Payment for some or all rotations
Resp
ondi
ng p
rogr
ams (
%)
Academic year
FiGURE 7. TRENDS iN PAYMENT FOR CLiNiCAL SiTES, 2012–2019
FiGURE 8. PROGRAM PAYMENT FOR CLiNiCAL SiTES
FiGURE 9. PAYMENT TO CLiNiCAL SiTES AMONG PUBLiC AND PRiVATE PROGRAMS
FiGURE 10. DiFFERENCES iN RATES OF PAYMENT TO CLiNiCAL SiTES BY ACADEMiC HEALTH CENTER STATUS
0 10 20 30 40 50
Pay for all rotations
Pay for some rotations
No payment for rotations
Responding programs (%)
11.9
40.4
47.7
0 10 20 30 40 50 60 70 80
Pay for all rotations
Pay for some rotations
No payment for rotations
80
PrivatePublic
5.815.2
15.951.9
78.332.9
Responding programs (%)
0 10 20 30 40 50 60 70 80
Pay for all rotations
Pay for some rotations
No payment for rotations
80
AHCNon-AHC
0.016.4
20.348.0
79.735.7
Responding programs (%)
21 | PROGRAM REPORT 35 | SECTion 2. finAnCiAl infoRMATion
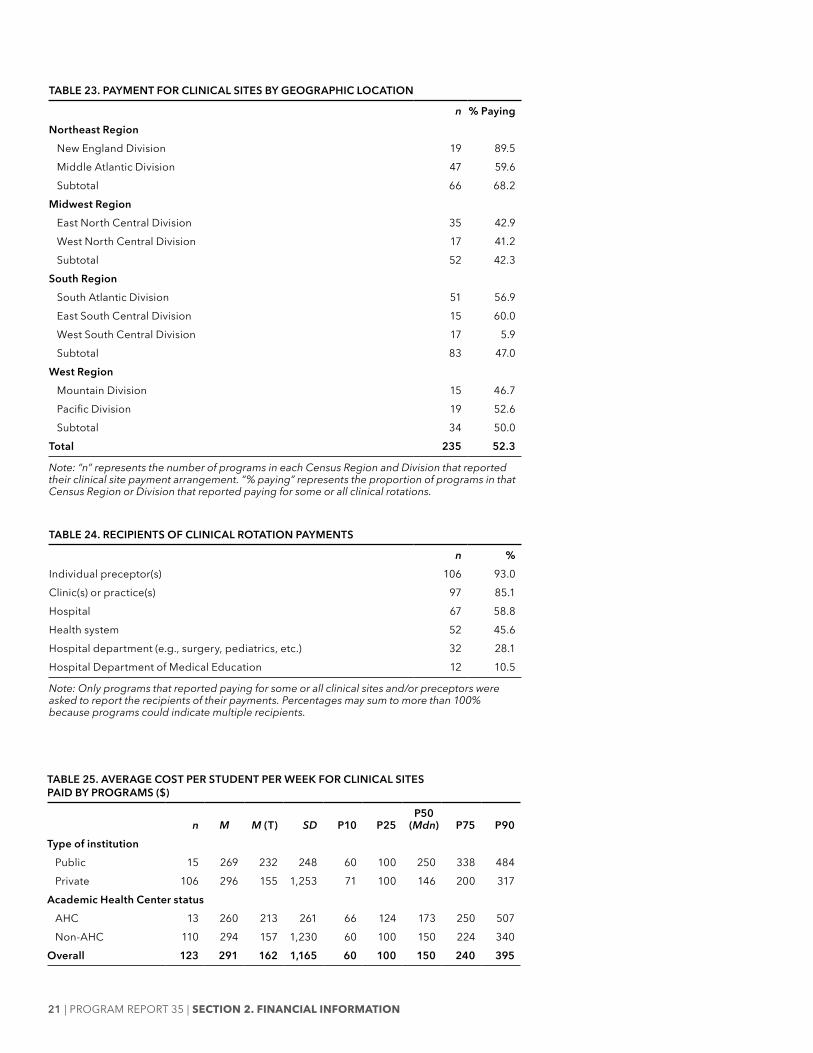
TABLE 23. PAYMENT FOR CLiNiCAL SiTES BY GEOGRAPHiC LOCATiON
n % PayingNortheast Region
New England Division 19 89.5Middle Atlantic Division 47 59.6Subtotal 66 68.2
Midwest RegionEast North Central Division 35 42.9West North Central Division 17 41.2Subtotal 52 42.3
South RegionSouth Atlantic Division 51 56.9East South Central Division 15 60.0West South Central Division 17 5.9Subtotal 83 47.0
West RegionMountain Division 15 46.7Pacific Division 19 52.6Subtotal 34 50.0
Total 235 52.3
Note: “n” represents the number of programs in each Census Region and Division that reported their clinical site payment arrangement. “% paying” represents the proportion of programs in that Census Region or Division that reported paying for some or all clinical rotations.
TABLE 24. RECiPiENTS OF CLiNiCAL ROTATiON PAYMENTS
n % Individual preceptor(s) 106 93.0Clinic(s) or practice(s) 97 85.1Hospital 67 58.8Health system 52 45.6Hospital department (e.g., surgery, pediatrics, etc.) 32 28.1Hospital Department of Medical Education 12 10.5
Note: Only programs that reported paying for some or all clinical sites and/or preceptors were asked to report the recipients of their payments. Percentages may sum to more than 100% because programs could indicate multiple recipients.
TABLE 25. AVERAGE COST PER STUDENT PER WEEK FOR CLiNiCAL SiTES PAiD BY PROGRAMS ($)
n M M (T) SD P10 P25P50
(Mdn) P75 P90Type of institution
Public 15 269 232 248 60 100 250 338 484 Private 106 296 155 1,253 71 100 146 200 317
Academic Health Center statusAHC 13 260 213 261 66 124 173 250 507 Non-AHC 110 294 157 1,230 60 100 150 224 340
Overall 123 291 162 1,165 60 100 150 240 395
22 | PROGRAM REPORT 35 | SECTion 2. finAnCiAl infoRMATion
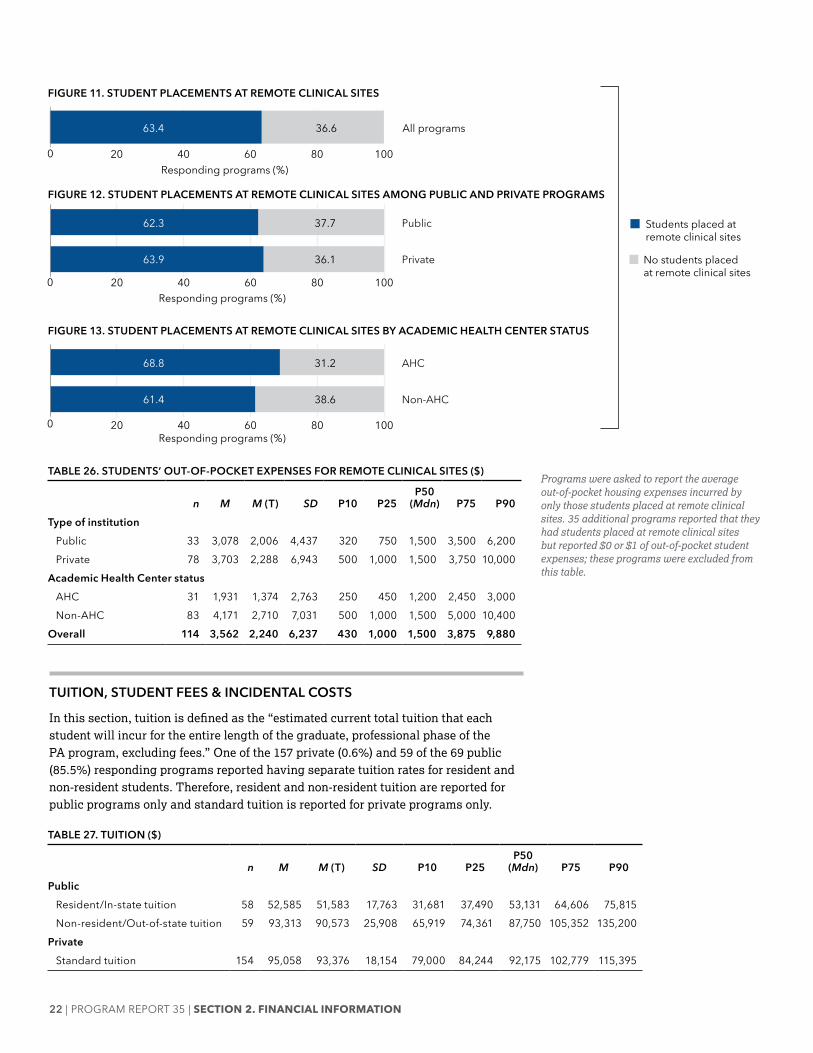
Programs were asked to report the average out-of-pocket housing expenses incurred by only those students placed at remote clinical sites. 35 additional programs reported that they had students placed at remote clinical sites but reported $0 or $1 of out-of-pocket student expenses; these programs were excluded from this table.
TUiTiON, STUDENT FEES & iNCiDENTAL COSTS
In this section, tuition is defined as the “estimated current total tuition that each student will incur for the entire length of the graduate, professional phase of the PA program, excluding fees.” One of the 157 private (0.6%) and 59 of the 69 public (85.5%) responding programs reported having separate tuition rates for resident and non-resident students. Therefore, resident and non-resident tuition are reported for public programs only and standard tuition is reported for private programs only.
20 40 60 80 1000
36.663.4
Responding programs (%)
All programs
0 20 40 60 80 100
37.762.3
36.163.9
Public
Private
Responding programs (%)
0 20 40 60 80 100
31.268.8
38.661.4
No students placed at remote clinical sites
Students placed at remote clinical sites
AHC
Non-AHC
Responding programs (%)
0 20 40 60 80 100
31.268.8
38.661.4
No students placed at remote clinical sites
Students placed at remote clinical sites
AHC
Non-AHC
Responding programs (%)
FiGURE 11. STUDENT PLACEMENTS AT REMOTE CLiNiCAL SiTES
FiGURE 12. STUDENT PLACEMENTS AT REMOTE CLiNiCAL SiTES AMONG PUBLiC AND PRiVATE PROGRAMS
FiGURE 13. STUDENT PLACEMENTS AT REMOTE CLiNiCAL SiTES BY ACADEMiC HEALTH CENTER STATUS
TABLE 26. STUDENTS’ OUT-OF-POCKET EXPENSES FOR REMOTE CLiNiCAL SiTES ($)
n M M (T) SD P10 P25P50
(Mdn) P75 P90Type of institution
Public 33 3,078 2,006 4,437 320 750 1,500 3,500 6,200 Private 78 3,703 2,288 6,943 500 1,000 1,500 3,750 10,000
Academic Health Center statusAHC 31 1,931 1,374 2,763 250 450 1,200 2,450 3,000 Non-AHC 83 4,171 2,710 7,031 500 1,000 1,500 5,000 10,400
Overall 114 3,562 2,240 6,237 430 1,000 1,500 3,875 9,880
TABLE 27. TUiTiON ($)
n M M (T) SD P10 P25P50
(Mdn) P75 P90Public
Resident/In-state tuition 58 52,585 51,583 17,763 31,681 37,490 53,131 64,606 75,815 Non-resident/Out-of-state tuition 59 93,313 90,573 25,908 65,919 74,361 87,750 105,352 135,200
PrivateStandard tuition 154 95,058 93,376 18,154 79,000 84,244 92,175 102,779 115,395

23 | PROGRAM REPORT 35 | SECTion 2. finAnCiAl infoRMATion
FiGURE 14. TRENDS iN AVERAGE PA SCHOOL TUiTiON, 2013–2019
TABLE 28. TRENDS iN AVERAGE PA SCHOOL TUiTiON, 2013–2019
2013–2014 2014–2015 2015–2016
n M ($) n M ($)%
increase n M ($)%
increasePublic
Resident/In-state tuition 58 38,794 56 40,918 5.5 60 43,550 6.4 Non-resident/Out-of-state tuition 58 68,311 56 74,607 9.2 60 78,214 4.8
PrivateStandard tuition 107 74,475 108 81,555 9.5 137 84,349 3.4
2016–2017 2017–2018 2018–2019
n M ($)%
increase n M ($)%
increase n M ($)%
increasePublic
Resident/In-state tuition 62 47,886 10.0 62 50,289 5.0 58 52,585 4.6 Non-resident/Out-of-state tuition 62 85,401 9.2 62 88,677 3.8 59 93,313 5.2
PrivateStandard tuition 144 87,160 3.3 160 91,630 5.1 154 95,058 3.7
Note: “% increase” represents the percentage of increase in tuition from the previous academic year.
40,000
60,000
80,000
100,000
2013–2014 2014–2015 2015–2016 2016–2017 2017–2018 2018–2019
Aver
age
tuiti
on ($
)
Academic year
Resident/In-state tuition(public programs only)
Non-resident/Out-of-state tuition(public programs only)
Standard tuition (private programs only)
38,794
74,475
68,311
52,585
95,058
93,313

24 | PROGRAM REPORT 35 | SECTion 2. finAnCiAl infoRMATion
TABLE 29. iTEMiZED STUDENT FEES COLLECTED BY THE iNSTiTUTiON/PROGRAM ($)%
Reporting n M M (T) SD P10 P25P50
(Mdn) P75 P90ACLS/BLS/PALS/POCUS/Simulation fees, etc. 44.4 60 299 276 187 148 191 245 350 527 Application and/or graduation fees 66.7 90 257 161 380 50 66 125 248 551 Association dues 31.1 42 177 108 302 46 75 100 141 271 Background check 57.0 77 113 99 87 38 50 91 150 230 Clinical fee(s) 26.7 36 2,842 2,478 3,350 90 333 1,200 4,600 8,650 Clinical site costs/transportation 21.5 29 1,812 1,577 1,880 196 500 1,200 2,500 5,000 Computer/IT/Software 59.3 80 1,067 966 844 155 424 930 1,511 2,016 Drug screening 44.4 60 72 63 52 30 40 50 90 122 Equipment (e.g., stethoscope, lab coat) 67.4 91 1,074 1,005 544 561 798 928 1,258 1,737 Fees for tests/assessments 29.6 40 519 341 859 89 245 308 466 699 Health services fees 31.9 43 2,244 1,626 2,921 230 320 945 3,062 5,780 Laboratory fee(s) 48.1 65 867 609 1,184 88 210 480 1,000 2,078 Liability insurance 22.2 30 271 140 648 15 41 118 233 399 Parking 34.1 46 351 294 365 50 95 243 503 700 Student services fee(s) 47.4 64 1,795 1,447 2,012 111 379 907 2,953 4,883 Textbooks 54.1 73 1,705 1,602 1,106 500 1,000 1,500 2,410 3,378 Other 40.7 55 4,369 3,122 6,390 173 550 2,044 5,880 10,316 Total fees - 135 7,978 7,153 6,523 1,608 3,314 6,395 10,958 15,624
135 programs (57.4%) provided detailed, itemized student fees collected by their institution or program. “Total fees” represents the sum of all fees reported by these programs.
25 | PROGRAM REPORT 35 | SECTion 2. finAnCiAl infoRMATion
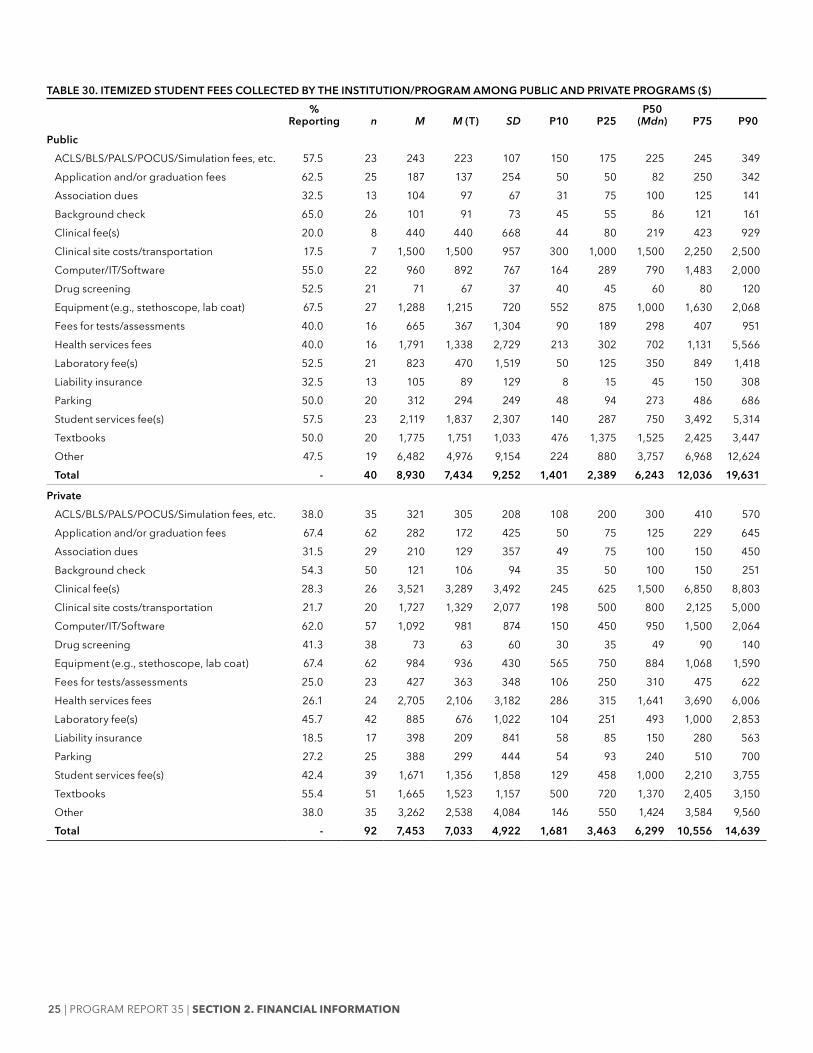
TABLE 30. iTEMiZED STUDENT FEES COLLECTED BY THE iNSTiTUTiON/PROGRAM AMONG PUBLiC AND PRiVATE PROGRAMS ($)%
Reporting n M M (T) SD P10 P25P50
(Mdn) P75 P90Public
ACLS/BLS/PALS/POCUS/Simulation fees, etc. 57.5 23 243 223 107 150 175 225 245 349 Application and/or graduation fees 62.5 25 187 137 254 50 50 82 250 342 Association dues 32.5 13 104 97 67 31 75 100 125 141 Background check 65.0 26 101 91 73 45 55 86 121 161 Clinical fee(s) 20.0 8 440 440 668 44 80 219 423 929 Clinical site costs/transportation 17.5 7 1,500 1,500 957 300 1,000 1,500 2,250 2,500 Computer/IT/Software 55.0 22 960 892 767 164 289 790 1,483 2,000 Drug screening 52.5 21 71 67 37 40 45 60 80 120 Equipment (e.g., stethoscope, lab coat) 67.5 27 1,288 1,215 720 552 875 1,000 1,630 2,068 Fees for tests/assessments 40.0 16 665 367 1,304 90 189 298 407 951 Health services fees 40.0 16 1,791 1,338 2,729 213 302 702 1,131 5,566 Laboratory fee(s) 52.5 21 823 470 1,519 50 125 350 849 1,418 Liability insurance 32.5 13 105 89 129 8 15 45 150 308 Parking 50.0 20 312 294 249 48 94 273 486 686 Student services fee(s) 57.5 23 2,119 1,837 2,307 140 287 750 3,492 5,314 Textbooks 50.0 20 1,775 1,751 1,033 476 1,375 1,525 2,425 3,447 Other 47.5 19 6,482 4,976 9,154 224 880 3,757 6,968 12,624 Total - 40 8,930 7,434 9,252 1,401 2,389 6,243 12,036 19,631
PrivateACLS/BLS/PALS/POCUS/Simulation fees, etc. 38.0 35 321 305 208 108 200 300 410 570 Application and/or graduation fees 67.4 62 282 172 425 50 75 125 229 645 Association dues 31.5 29 210 129 357 49 75 100 150 450 Background check 54.3 50 121 106 94 35 50 100 150 251 Clinical fee(s) 28.3 26 3,521 3,289 3,492 245 625 1,500 6,850 8,803 Clinical site costs/transportation 21.7 20 1,727 1,329 2,077 198 500 800 2,125 5,000 Computer/IT/Software 62.0 57 1,092 981 874 150 450 950 1,500 2,064 Drug screening 41.3 38 73 63 60 30 35 49 90 140 Equipment (e.g., stethoscope, lab coat) 67.4 62 984 936 430 565 750 884 1,068 1,590 Fees for tests/assessments 25.0 23 427 363 348 106 250 310 475 622 Health services fees 26.1 24 2,705 2,106 3,182 286 315 1,641 3,690 6,006 Laboratory fee(s) 45.7 42 885 676 1,022 104 251 493 1,000 2,853 Liability insurance 18.5 17 398 209 841 58 85 150 280 563 Parking 27.2 25 388 299 444 54 93 240 510 700 Student services fee(s) 42.4 39 1,671 1,356 1,858 129 458 1,000 2,210 3,755 Textbooks 55.4 51 1,665 1,523 1,157 500 720 1,370 2,405 3,150 Other 38.0 35 3,262 2,538 4,084 146 550 1,424 3,584 9,560 Total - 92 7,453 7,033 4,922 1,681 3,463 6,299 10,556 14,639

26 | PROGRAM REPORT 35 | SECTion 2. finAnCiAl infoRMATion
TABLE 31. iTEMiZED STUDENT FEES COLLECTED BY THE iNSTiTUTiON/PROGRAM BY ACADEMiC HEALTH CENTER STATUS ($)%
Reporting n M M (T) SD P10 P25P50
(Mdn) P75 P90Academic Health Center
ACLS/BLS/PALS/POCUS/Simulation fees, etc. 48.8 20 222 211 116 125 150 200 248 355 Application and/or graduation fees 53.7 22 251 185 309 50 50 108 353 536 Association dues 31.7 13 97 101 33 79 100 100 105 122 Background check 46.3 19 92 89 46 49 55 75 120 151 Clinical fee(s) 17.1 7 740 740 1,191 66 145 414 523 1,717 Clinical site costs/transportation 14.6 6 1,267 1,267 1,023 251 525 1,300 2,000 2,250 Computer/IT/Software 65.9 27 1,060 982 895 153 280 800 1,500 2,240 Drug screening 39.0 16 58 57 21 36 40 50 76 80 Equipment (e.g., stethoscope, lab coat) 53.7 22 1,251 1,155 707 609 861 1,000 1,520 1,970 Fees for tests/assessments 36.6 15 310 305 148 116 225 306 400 502 Health services fees 43.9 18 2,779 2,419 3,311 243 698 1,033 4,275 7,062 Laboratory fee(s) 51.2 21 486 375 565 50 86 350 525 950 Liability insurance 24.4 10 77 48 120 6 17 35 49 201 Parking 41.5 17 330 320 248 42 120 300 504 622 Student services fee(s) 68.3 28 1,784 1,460 2,216 118 197 845 2,612 5,210 Textbooks 41.5 17 1,707 1,698 1,093 464 1,000 1,550 2,000 3,453 Other 56.1 23 6,012 4,160 8,935 210 410 3,531 6,968 15,344 Total - 41 9,056 7,569 9,413 1,244 2,170 6,395 11,979 19,573
Non-Academic Health CenterACLS/BLS/PALS/POCUS/Simulation fees, etc. 42.6 40 337 314 204 159 229 290 424 600 Application and/or graduation fees 72.3 68 258 159 402 50 74 125 226 548 Association dues 30.9 29 214 134 358 44 75 100 150 450 Background check 61.7 58 120 106 96 34 50 100 150 252 Clinical fee(s) 30.9 29 3,350 3,122 3,515 98 420 1,200 7,000 8,771 Clinical site costs/transportation 24.5 23 1,954 1,666 2,039 260 500 1,200 2,500 5,000 Computer/IT/Software 56.4 53 1,070 979 826 204 450 950 1,500 2,000 Drug screening 46.8 44 77 67 59 30 39 50 100 146 Equipment (e.g., stethoscope, lab coat) 73.4 69 1,018 964 473 500 780 900 1,100 1,667 Fees for tests/assessments 26.6 25 645 433 1,068 80 250 350 480 1,340 Health services fees 26.6 25 1,859 1,340 2,607 232 300 553 2,859 3,983 Laboratory fee(s) 46.8 44 1,049 775 1,354 143 274 500 1,018 2,993 Liability insurance 21.3 20 368 194 777 65 89 150 290 535 Parking 30.9 29 363 285 423 50 93 230 500 700 Student services fee(s) 38.3 36 1,804 1,520 1,871 150 499 937 2,980 3,933 Textbooks 59.6 56 1,704 1,582 1,120 500 998 1,500 2,412 3,075 Other 34.0 32 3,188 2,709 3,323 179 675 1,760 4,819 9,021 Total - 94 7,508 7,152 4,739 2,109 3,762 6,362 10,621 14,355

27 | PROGRAM REPORT 35 | SECTion 3. PRogRAM PERSonnEl
SECTiON 3. PROGRAM PERSONNEL
TABLE 32. FULL-TiME FACULTY HEADCOUNTS
n (P) n (F) Min Max M SD P10 P25P50
(Mdn) P75 P90Assigned only or primarily to didactic phase 205 1,053 1 35 5.1 3.5 2.0 3.0 5.0 7.0 8.0
Assigned only or primarily to clinical phase 171 337 1 22 2.0 1.9 1.0 1.0 2.0 2.0 3.0
Assigned to both the didactic and clinical phases 167 599 1 25 3.6 3.9 1.0 1.0 2.0 4.5 8.0
All full-time faculty 235 1,989 3 45 8.5 4.7 5.0 6.0 8.0 10.0 12.0
Note: “n (P)” represents the number of reporting programs. “n (F)” represents the total faculty headcount across all reporting programs. Faculty with .5 or more FTE were considered to be full-time. Zeroes were excluded.
TABLE 33. PART-TiME FACULTY AND GUEST LECTURERS
n (P) n (F) Min Max M SD P10 P25P50
(Mdn) P75 P90Part-time faculty
Headcount 159 624 1 20 3.9 3.8 1.0 2.0 3.0 4.0 9.0FTE 156 138.1 0.1 7.5 0.9 0.9 0.2 0.3 0.7 1.1 1.5
Guest lecturersHeadcount 227 10,521 2 378 46.3 59.5 7.0 12.0 26.0 51.5 107.0
Note: “n (P)” represents the number of reporting programs. “n (F)” represents the total headcount or FTE across all reporting programs. Faculty with less than .5 FTE were considered to be part-time.
TABLE 34. PERCENTAGE OF DiDACTiC CURRiCULUM TAUGHT BY CORE FACULTY (%)
n Min Max M SD P10 P25P50
(Mdn) P75 P90Taught directly by core/principal faculty 231 11.0 100.0 70.1 18.6 45.0 60.0 75.0 81.5 90.0Taught by others but actively coordinated by core/principal faculty (e.g., arranging schedules, selecting topics, course mastering)
215 1.0 85.0 23.8 16.4 5.0 10.5 20.0 30.0 45.0
Taught directly by non-program personnel (e.g., faculty from biology department) with minimal input from core/principal faculty
133 1.0 53.0 13.4 11.8 5.0 5.0 10.0 18.0 30.0
Programs were asked to provide full-time faculty headcounts; however, some appear to have reported FTEs instead. Because full-time faculty were defined as those with .5 or greater FTE, any decimal under .5 was rounded down and any decimal .5 or above was rounded up to approximate a headcount of full-time faculty.
Assigned only or primarily to clinical phase
Assigned to both the didactic and clinical phases
Assigned only or primarily to didactic phase
16.9%
52.9%
30.1%
FiGURE 15. FULL-TiME FACULTY ASSiGNMENTS

28 | PROGRAM REPORT 35 | SECTion 3. PRogRAM PERSonnEl
TABLE 35. CAPACiTY, FiLLED, AND VACANT FTE
n (P) n (FTE) Min Max M SD P10 P25P50
(Mdn) P75 P90Capacity
Faculty 235 1,793.8 1.0 36.6 7.6 3.8 4.0 5.0 7.0 9.0 12.0Staff 235 801.9 1.0 22.1 3.4 2.3 1.4 2.0 3.0 4.0 6.0Program director 234 232.4 0.5 1.0 1.0 0.0 1.0 1.0 1.0 1.0 1.0Medical director 233 149.6 0.1 1.0 0.6 0.4 0.2 0.2 1.0 1.0 1.0
FilledFaculty 234 1,691.3 1.0 36.6 7.2 3.7 4.0 5.0 7.0 8.5 11.2Staff 233 776.4 1.0 22.1 3.3 2.4 1.0 2.0 3.0 4.0 5.9Program director 231 229.2 0.5 1.0 1.0 0.0 1.0 1.0 1.0 1.0 1.0Medical director 231 146.9 0.1 1.0 0.6 0.4 0.1 0.2 1.0 1.0 1.0
VacantFaculty 87 115.3 0.1 4.9 1.3 0.8 0.6 1.0 1.0 2.0 2.0Staff 31 31.5 0.5 2.0 1.0 0.4 0.5 1.0 1.0 1.0 1.0Program director 5 4.2 0.2 1.0 0.8 0.4 0.5 1.0 1.0 1.0 1.0Medical director 5 2.8 0.2 1.0 0.6 0.4 0.2 0.3 0.3 1.0 1.0
Note: “n (P)” represents the number of reporting programs. “n (FTE)” represents the total FTE across all reporting programs. Zeroes were excluded.
FiGURE 16. PROGRAMS WiTH VACANT FTEs
0 5 10 15 20 25
Medical director
Program director
Staff
Faculty
Programs with vacant FTEs (%)
1.2
1.2
7.5
20.9
RECRUiTMENT & RETENTiON
Data were collected in 2019, prior to the onset of the COVID-19 pandemic. Reports published by PAEA during the pandemic indicate that staffing was affected at many programs; these impacts are not captured in this report.

29 | PROGRAM REPORT 35 | SECTion 3. PRogRAM PERSonnEl
TABLE 37. BARRiERS TO HiRiNG NEW FACULTY (%)
nNot at All a Barrier
Slight Barrier
Moderate Barrier
Serious Barrier
Salary 196 10.2 25.5 37.2 27.0Lack of qualified candidates 196 12.2 26.0 37.2 24.5Candidates' lack of teaching experience 196 9.7 33.2 44.4 12.8Area cost of living 196 56.6 23.0 10.7 9.7Location 196 45.9 25.5 20.9 7.7Degree requirements 196 46.4 33.7 15.8 4.1Lifestyle 196 52.0 34.2 11.2 2.6
Note: Table rows are sorted from most serious barrier to least.
STUDENT-TO-FACULTY RATiO
Each program’s student-to-faculty ratio (SFR) was calculated in two ways. For Table 39, SFR was calculated by dividing each program’s total number of enrolled students by their full-time faculty headcount. For Table 40, SFR was calculated by dividing each program’s total number of enrolled students by the sum of their filled faculty, program director, and medical director FTEs.
TABLE 36. OPEN POSiTiONS
n (P) n (O) Max M SD P10 P25P50
(Mdn) P75 P90Faculty
New position 76 106 6 1.4 0.7 1.0 1.0 1.0 2.0 2.0Replacing existing position 144 252 7 1.8 1.1 1.0 1.0 1.0 2.0 3.0
All open positions 184 358 10 1.9 1.3 1.0 1.0 2.0 2.0 3.0Staff
New position 42 52 3 1.2 0.5 1.0 1.0 1.0 1.0 2.0Replacing existing position 83 114 5 1.4 0.7 1.0 1.0 1.0 2.0 2.0
All open positions 113 167 8 1.5 1.0 1.0 1.0 1.0 2.0 3.0
Note: “n (P)” represents the number of reporting programs. “n (O)” represents the total number of open positions available across all reporting programs. Zeroes were excluded.
TABLE 38. REASONS FOR FACULTY DEPARTURES
n (P) n (F) % (F)Job change: Return to clinical practice 62 81 30.9Personal reasons 39 48 18.3Job change: Accepted position at another PA program 36 42 16.0Job change: Other reason 29 35 13.4Retirement 27 32 12.2Dismissal due to performance issues 14 15 5.7Dismissal due to professionalism issues 5 6 2.3Medical/Disability/Death 3 3 1.1All faculty departures 139 262 100.0
Note: “n (P)” represents the number of reporting programs. “n (F)” represents the total number of faculty departures across all reporting programs. “% (F)” represents the percentage of all faculty departures that occurred for each reason.
196 (83.4%) programs reported seeking to hire new faculty or staff in the 2018–2019 academic year, before the COVID-19 pandemic. Some programs appear to have reported FTE instead of headcounts. All decimals were rounded up to the nearest integer to approximate headcounts.
140 (59.6%) programs reported that at least one faculty member had left in the 2018–2019 academic year.
Programs were asked to report the number of open faculty and staff positions first and then report the number of open faculty and staff positions that were either new or replacing existing positions separately. For some programs, the reported total number of open positions was not equal to the sum of new and replacement positions.
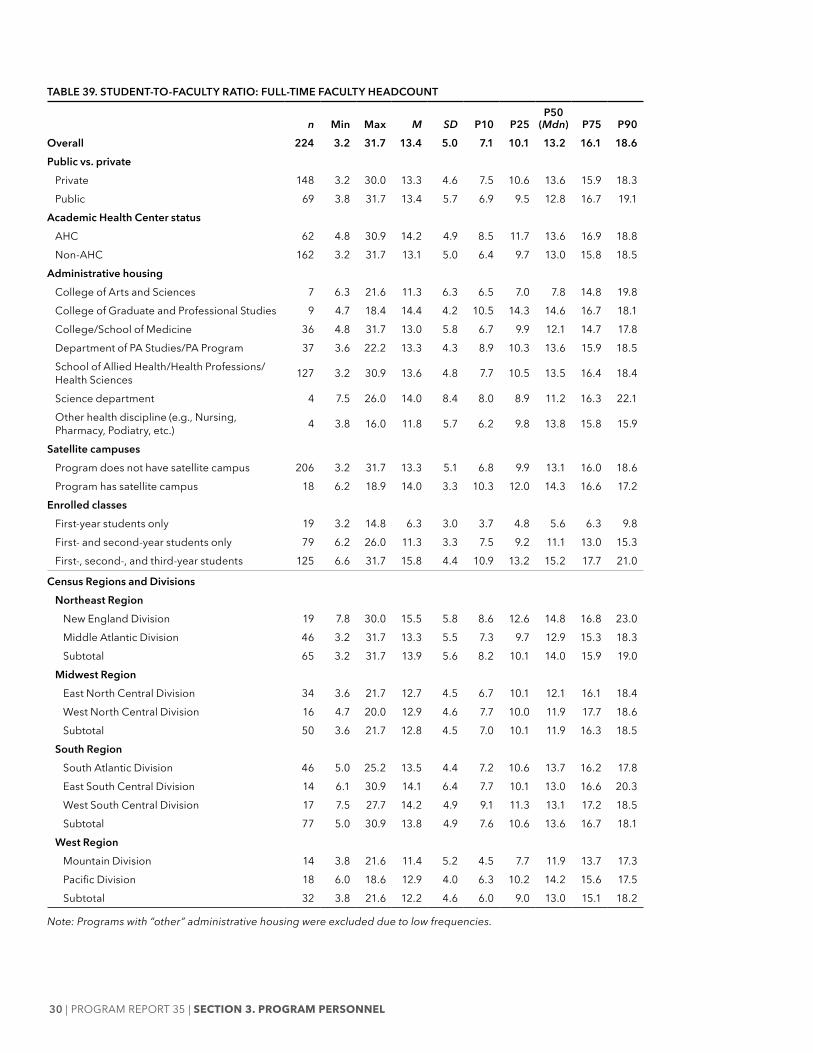
30 | PROGRAM REPORT 35 | SECTion 3. PRogRAM PERSonnEl
TABLE 39. STUDENT-TO-FACULTY RATiO: FULL-TiME FACULTY HEADCOUNT
n Min Max M SD P10 P25P50
(Mdn) P75 P90Overall 224 3.2 31.7 13.4 5.0 7.1 10.1 13.2 16.1 18.6Public vs. private
Private 148 3.2 30.0 13.3 4.6 7.5 10.6 13.6 15.9 18.3Public 69 3.8 31.7 13.4 5.7 6.9 9.5 12.8 16.7 19.1
Academic Health Center statusAHC 62 4.8 30.9 14.2 4.9 8.5 11.7 13.6 16.9 18.8Non-AHC 162 3.2 31.7 13.1 5.0 6.4 9.7 13.0 15.8 18.5
Administrative housingCollege of Arts and Sciences 7 6.3 21.6 11.3 6.3 6.5 7.0 7.8 14.8 19.8College of Graduate and Professional Studies 9 4.7 18.4 14.4 4.2 10.5 14.3 14.6 16.7 18.1College/School of Medicine 36 4.8 31.7 13.0 5.8 6.7 9.9 12.1 14.7 17.8Department of PA Studies/PA Program 37 3.6 22.2 13.3 4.3 8.9 10.3 13.6 15.9 18.5School of Allied Health/Health Professions/Health Sciences 127 3.2 30.9 13.6 4.8 7.7 10.5 13.5 16.4 18.4
Science department 4 7.5 26.0 14.0 8.4 8.0 8.9 11.2 16.3 22.1Other health discipline (e.g., Nursing, Pharmacy, Podiatry, etc.) 4 3.8 16.0 11.8 5.7 6.2 9.8 13.8 15.8 15.9
Satellite campusesProgram does not have satellite campus 206 3.2 31.7 13.3 5.1 6.8 9.9 13.1 16.0 18.6Program has satellite campus 18 6.2 18.9 14.0 3.3 10.3 12.0 14.3 16.6 17.2
Enrolled classesFirst-year students only 19 3.2 14.8 6.3 3.0 3.7 4.8 5.6 6.3 9.8First- and second-year students only 79 6.2 26.0 11.3 3.3 7.5 9.2 11.1 13.0 15.3First-, second-, and third-year students 125 6.6 31.7 15.8 4.4 10.9 13.2 15.2 17.7 21.0
Census Regions and DivisionsNortheast Region
New England Division 19 7.8 30.0 15.5 5.8 8.6 12.6 14.8 16.8 23.0Middle Atlantic Division 46 3.2 31.7 13.3 5.5 7.3 9.7 12.9 15.3 18.3Subtotal 65 3.2 31.7 13.9 5.6 8.2 10.1 14.0 15.9 19.0
Midwest RegionEast North Central Division 34 3.6 21.7 12.7 4.5 6.7 10.1 12.1 16.1 18.4West North Central Division 16 4.7 20.0 12.9 4.6 7.7 10.0 11.9 17.7 18.6Subtotal 50 3.6 21.7 12.8 4.5 7.0 10.1 11.9 16.3 18.5
South RegionSouth Atlantic Division 46 5.0 25.2 13.5 4.4 7.2 10.6 13.7 16.2 17.8East South Central Division 14 6.1 30.9 14.1 6.4 7.7 10.1 13.0 16.6 20.3West South Central Division 17 7.5 27.7 14.2 4.9 9.1 11.3 13.1 17.2 18.5Subtotal 77 5.0 30.9 13.8 4.9 7.6 10.6 13.6 16.7 18.1
West RegionMountain Division 14 3.8 21.6 11.4 5.2 4.5 7.7 11.9 13.7 17.3Pacific Division 18 6.0 18.6 12.9 4.0 6.3 10.2 14.2 15.6 17.5Subtotal 32 3.8 21.6 12.2 4.6 6.0 9.0 13.0 15.1 18.2
Note: Programs with “other” administrative housing were excluded due to low frequencies.

31 | PROGRAM REPORT 35 | SECTion 3. PRogRAM PERSonnEl
TABLE 40. STUDENT-TO-FACULTY RATiO: FTE
n Min Max M SD P10 P25P50
(Mdn) P75 P90Overall 223 2.5 25.0 12.3 4.6 6.3 9.1 12.1 15.3 18.2Public vs. private
Private 149 2.5 25.0 12.3 4.5 6.3 9.1 12.5 15.3 17.6Public 67 2.8 23.1 11.9 4.3 7.1 9.1 11.3 14.8 18.4
Academic Health Center statusAHC 60 3.4 24.4 12.9 4.4 7.4 9.8 12.6 15.4 18.5Non-AHC 163 2.5 25.0 12.0 4.6 5.8 8.9 12.0 15.2 17.8
Administrative housingCollege of Arts and Sciences 7 5.6 20.8 10.5 6.1 5.8 6.0 8.7 13.2 18.8College of Graduate and Professional Studies 9 3.7 16.7 12.3 3.7 9.4 11.4 13.3 14.0 14.7College/School of Medicine 36 3.4 25.0 11.6 4.6 6.5 9.3 10.9 14.1 18.3Department of PA Studies/PA Program 38 3.5 24.5 12.2 4.2 7.8 9.8 11.8 15.0 16.8School of Allied Health/Health Professions/Health Sciences 124 3.2 24.4 12.7 4.5 7.3 9.1 12.4 15.4 18.5
Science department 4 5.1 16.8 10.7 5.1 6.0 7.4 10.4 13.6 15.5Other health discipline (e.g., Nursing, Pharmacy, Podiatry, etc.) 5 2.5 16.7 10.1 7.0 2.7 2.8 12.5 16.0 16.4
Satellite campusesProgram does not have satellite campus 205 2.5 25.0 12.1 4.6 6.3 9.0 12.1 15.1 18.2Program has satellite campus 18 6.7 20.6 13.7 3.7 9.3 11.4 12.9 16.8 17.5
Enrolled classesFirst-year students only 20 2.5 12.8 5.5 2.9 3.2 3.6 4.6 6.0 9.2First- and second-year students only 79 5.1 16.8 10.3 2.9 6.9 8.2 9.7 11.9 14.9First-, second-, and third-year students 123 6.7 25.0 14.7 3.8 9.8 12.1 14.2 17.1 19.5
Census Regions and DivisionsNortheast Region
New England Division 19 6.3 25.0 14.0 4.6 8.9 11.0 12.8 16.2 19.8Middle Atlantic Division 46 3.2 19.6 12.0 4.0 6.7 9.1 12.0 15.3 17.1Subtotal 65 3.2 25.0 12.6 4.3 7.5 9.6 12.5 15.3 18.2
Midwest RegionEast North Central Division 35 2.5 21.3 11.9 4.6 6.8 8.9 11.6 15.7 17.8West North Central Division 16 3.7 22.8 11.8 4.9 7.5 8.4 10.5 14.7 17.7Subtotal 51 2.5 22.8 11.9 4.7 7.3 8.7 11.5 15.5 17.9
South RegionSouth Atlantic Division 46 3.9 24.4 12.4 4.2 6.8 9.7 12.4 14.8 17.3East South Central Division 12 4.8 24.5 13.6 6.8 6.2 8.5 13.0 17.7 23.8West South Central Division 17 5.1 23.1 13.4 4.5 8.3 11.3 13.4 15.1 19.5Subtotal 75 3.9 24.5 12.8 4.7 6.6 9.6 13.0 15.1 18.7
West RegionMountain Division 14 2.8 20.8 10.5 5.3 3.7 7.4 10.4 12.1 17.8Pacific Division 18 4.3 16.9 11.3 3.8 6.3 8.9 12.0 13.4 16.3Subtotal 32 2.8 20.8 11.0 4.5 4.6 8.3 10.9 13.3 16.6
Note: Programs with “other” administrative housing were excluded due to low frequencies.

32 | PROGRAM REPORT 35 | SECTion 4. STuDEnTS
SECTiON 4. STUDENTSCAPACiTY & ENROLLMENT
“Maximum capacity” refers to programs’ capacity as approved by ARC-PA. “Current enrollment” refers to enrollment at the time that programs responded to the survey, which does not necessarily reflect day-one student enrollment. For example, if a program has a third-year cohort for part of the academic year but survey administration does not coincide with that period, that program may report zero third-year enrollment. Therefore, discrepancies between capacity and enrollment do not necessarily reflect unfilled seats.
“First-year” students were defined as didactic-phase students, and “second-year” students as clinical-phase students. “Third-year” students were defined as “ end-of-clinical-phase students who, when present, may overlap with second-year clinical phase students; this may be typical in programs that are longer than two years.
TABLE 41. STATUS OF iNAUGURAL CLASSES iN PROViSiONALLY ACCREDiTED PROGRAMS
n % Graduated 34 54.0Enrolled in the second year 14 22.2Enrolled in the first year 11 17.5Not yet enrolled 2 3.2Enrolled in the third year 2 3.2Total 63 100.0
63 programs (26.8%) were provisionally accredited.
FiGURE 17. ENROLLED COHORTS
0 10 20 30 40 50 60
No enrolled students
First-, second-, and third-year students
First- and second-yearstudents only
First-year students only
Responding programs (%)
54.9
2.6
34.0
8.5
TABLE 42. STUDENT MAXiMUM CAPACiTY AND CURRENT ENROLLMENT
n (P) n (S) Min Max M SD P10 P25P50
(Mdn) P75 P90Maximum capacity
First-year (didactic phase) 234 11,299 16 240 48.3 24.5 26.0 32.0 42.0 59.8 76.4Second-year (clinical phase) 232 11,063 17 240 47.7 24.3 26.0 31.5 40.0 56.0 75.0Third-year (end-of-clinical phase) 151 6,979 10 100 46.2 18.1 30.0 35.0 42.0 54.0 70.0Total 234 29,341 16 560 125.4 62.9 60.0 86.0 120.0 150.0 194.7
Current enrollmentFirst-year (didactic phase) 225 10,439 15 213 46.4 23.1 25.4 30.0 40.0 57.0 75.0Second-year (clinical phase) 206 9,426 14 184 45.8 21.9 26.0 30.0 40.5 54.0 73.0Third-year (end-of-clinical phase) 117 4,762 1 91 40.7 16.4 23.6 30.0 38.0 49.0 60.0Total 226 24,627 15 468 109.0 57.6 45.5 65.5 104.0 141.0 175.0
Note: Zeroes were excluded. “n (P)” refers to the number of reporting programs. “n (S)” refers to the number of students reported by the programs.

33 | PROGRAM REPORT 35 | SECTion 4. STuDEnTS
Based on programs’ reports of their ARC-PA-approved first-year capacity and the day-one enrollment of their most recently admitted class, 61 programs reported a total of 345 unfilled seats (M = 5.7, SD = 6.6, Mdn = 3.0). This number differs from the difference of total first-year capacity reported in Table 42 and overall day-one enrollment because programs that reported greater day-one enrollment than capacity, or that reported first-year capacity but not day-one enrollment, were excluded.
020406080
100120140
1984–1985 2018–2019
Average capacity
Average enrollment
47.0
58.2
125.4
109.0
Academic year
Stud
ents
FiGURE 18. AVERAGE PROGRAM ENROLLMENT AND CAPACiTY, 1985–2019
TABLE 43. DAY-ONE ENROLLMENT OF MOST RECENTLY ADMiTTED CLASS
n (P) n (S) Min Max M SD P10 P25P50
(Mdn) P75 P90Type of institution
Private 154 7,461 16 125 48.4 21.0 28.3 32.0 42.0 60.0 77.0Public 69 2,992 16 136 43.4 20.2 24.0 30.0 40.0 50.0 65.0
Academic Health Center statusAHC 63 3,198 17 136 50.8 21.9 27.2 35.5 46.0 60.0 80.0Non-AHC 167 7,796 16 213 46.7 24.0 26.0 30.0 40.0 55.0 75.0
Overall 230 10,994 16 213 47.8 23.4 26.0 31.3 42.0 59.8 76.1
0
2,000
4,000
6,000
8,000
10,000
12,000 First-year students
Graduating students
1984–1985 2018–2019Academic year
1,036767
11,299
9,446
Stud
ents
20
30
40
50 Average first-year class sizeAverage graduating class size
1984–1985 2018–2019Academic year
Stud
ents
24.1
21.9
48.3
44.3
FiGURE 19. TOTAL FiRST-YEAR AND GRADUATiNG STUDENTS, 1985–2019
FiGURE 20. AVERAGE FiRST-YEAR AND GRADUATiNG CLASS SiZES 1985–2019
Note: Prior to 2016’s Program Report 31, the number of graduates depicted in this figure was calculated based on the size of the graduating cohort at matriculation. From 2016 onwards, the figure reports only those students who have or will graduate on time.
Note: Prior to 2016’s Program Report 31, the number of graduates depicted in this figure was calculated based on the size of the graduating cohort at matriculation. From 2016 onwards, the figure reports only those students who have or will graduate on time.
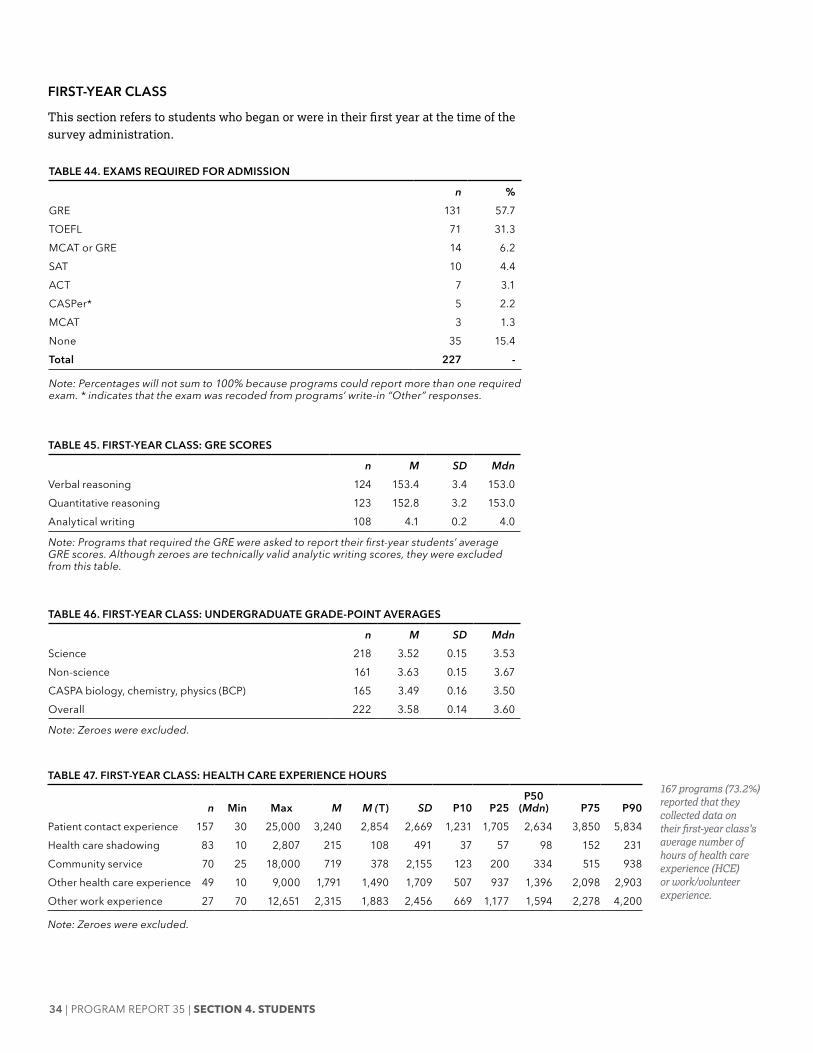
34 | PROGRAM REPORT 35 | SECTion 4. STuDEnTS
TABLE 44. EXAMS REQUiRED FOR ADMiSSiON
n % GRE 131 57.7TOEFL 71 31.3MCAT or GRE 14 6.2SAT 10 4.4ACT 7 3.1CASPer* 5 2.2MCAT 3 1.3None 35 15.4Total 227 -
Note: Percentages will not sum to 100% because programs could report more than one required exam. * indicates that the exam was recoded from programs’ write-in “Other” responses.
TABLE 45. FiRST-YEAR CLASS: GRE SCORES
n M SD MdnVerbal reasoning 124 153.4 3.4 153.0Quantitative reasoning 123 152.8 3.2 153.0Analytical writing 108 4.1 0.2 4.0
Note: Programs that required the GRE were asked to report their first-year students’ average GRE scores. Although zeroes are technically valid analytic writing scores, they were excluded from this table.
TABLE 46. FiRST-YEAR CLASS: UNDERGRADUATE GRADE-POiNT AVERAGES
n M SD MdnScience 218 3.52 0.15 3.53Non-science 161 3.63 0.15 3.67CASPA biology, chemistry, physics (BCP) 165 3.49 0.16 3.50Overall 222 3.58 0.14 3.60
Note: Zeroes were excluded.
TABLE 47. FiRST-YEAR CLASS: HEALTH CARE EXPERiENCE HOURS
n Min Max M M (T) SD P10 P25P50
(Mdn) P75 P90Patient contact experience 157 30 25,000 3,240 2,854 2,669 1,231 1,705 2,634 3,850 5,834Health care shadowing 83 10 2,807 215 108 491 37 57 98 152 231Community service 70 25 18,000 719 378 2,155 123 200 334 515 938Other health care experience 49 10 9,000 1,791 1,490 1,709 507 937 1,396 2,098 2,903Other work experience 27 70 12,651 2,315 1,883 2,456 669 1,177 1,594 2,278 4,200
Note: Zeroes were excluded.
167 programs (73.2%) reported that they collected data on their first-year class’s average number of hours of health care experience (HCE) or work/volunteer experience.
FiRST-YEAR CLASS
This section refers to students who began or were in their first year at the time of the survey administration.
35 | PROGRAM REPORT 35 | SECTion 4. STuDEnTS
FiRST-YEAR CLASS DEMOGRAPHiCS
This section details the enrollment of first-year PA students by demographic factors (i.e., gender, ethnicity, and race). Omissions and imprecisions in programs’ reporting of student demographic data make it difficult to provide a complete and accurate picture of the PA student body. This is also why cohort sample sizes differ across demographic tables. For example, programs that do not collect or have access to student race data may be reporting all students as “other” or “unknown” race. PAEA is exploring new ways to collect this information but would like to underscore the importance of member programs gathering and accurately reporting detailed student demographic data. Beginning with 2018’s Program Report 33, statistics in this section were calculated using a different method from prior years. Therefore, data in these tables will be very different from previous Program Reports. Please see “Report Enhancements” (p. 2) for more details.
A total of 229 programs (97.4%) reported having a first-year class enrolled in the 2018–2019 academic year and/or reported first-year demographic data. This is accounted for by the fact that a small number of provisionally accredited programs had not matriculated their first student cohort.
For Tables 49 - 51:
• “n (P)” refers to the number of programs reporting at least one student of that demographic (e.g., in Table 49, 225 programs reported having at least one female first-year student).
• “% (P)” refers to the proportion of programs reporting at least one student of that demographic, out of the 228 that either reported having a first-year class enrolled and/or reported first-year demographic data (e.g., in Table 49, 98.3% of the 228 programs with a first-year class reported having at least one female first-year student).
• “n (S)” refers to the number of students reported by the n (P) programs who belonged to each demographic (e.g., in Table 49, 225 programs reported a total of 7,833 female first-year students).
• “% (S)” refers to the proportion of all students reported across programs who belonged to each demographic (e.g., in Table 49, of the 10,846 reported first-year students, 72.2% were female).
• “Mean % (S)” refers to the average proportion of students belonging to each demographic among the n (P) reporting programs (e.g., in Table 49, of the 225 programs that reported at least one female student, an average of 73.8% of their students were female).
• M, SD, and Mdn were calculated using data from the n (P) reporting programs and were not reported when fewer than 5 programs reported data.

36 | PROGRAM REPORT 35 | SECTion 4. STuDEnTS
TABLE 48. FiRST-YEAR CLASS: PROGRAMS WiTH MiSSiNG DEMOGRAPHiC iNFORMATiON
n % Missing gender information 9 3.9Missing ethnicity information 21 9.2Missing race information 20 8.7
The percent of programs missing demographic information was calculated by dividing the number of programs that did not report demographic information, or reported all “Do not know,” by the 229 programs that reported having a first-year class enrolled and/or reported demographic data on their first-year students. Three programs reported that they had a first-year class enrolled but did not provide first-year student demographics.
Of the 214 programs that reported some ethnicity information (excluding those that only reported “Do not know”) for their first-year class, 46 (21.5%) reported no Hispanic students.
Of the 215 programs that reported some race information (excluding those that only reported “Other” or “Do not know”) for their first-year class, 6 (2.8%) reported no non-White students.
TABLE 49. FiRST-YEAR CLASS: GENDER
n (P) % (P) n (S) % (S)Mean % (S) M SD Mdn
Female 225 98.3 7,833 72.2 73.8 34.8 15.9 31.0Male 225 98.3 2,868 26.4 26.3 12.7 11.2 11.0Unknown gender 5 2.2 145 1.3 55.7 29.0 30.4 30.0Total 228 99.6 10,846 100.0 100.0 23.8 17.7 20.0
TABLE 50. FiRST-YEAR CLASS: ETHNiCiTY
n (P) % (P) n (S) % (S)Mean % (S) M SD Mdn
Hispanic, Latino, or Spanish in origin 168 73.4 814 7.6 10.0 4.8 6.2 3.0
Not Hispanic, Latino, or Spanish in origin 208 90.8 8,959 83.7 91.6 43.1 19.9 39.0
Unknown ethnicity 47 20.5 926 8.7 39.7 19.7 23.9 6.0Total 226 98.7 10,699 100.0 100.0 25.3 24.4 23.0
TABLE 51. FiRST-YEAR CLASS: RACE
n (P) % (P) n (S) % (S)Mean % (S) M SD Mdn
American Indian or Alaskan Native 36 15.7 57 0.5 3.3 1.6 1.4 1.0
Asian 190 83.0 1,064 9.9 11.2 5.6 4.9 4.0Black or African American 156 68.1 417 3.9 6.7 2.7 2.4 2.0Multiracial 74 32.3 238 2.2 7.3 3.2 4.3 2.0Native Hawaiian or Pacific Islander 21 9.2 177 1.6 14.0 8.4 18.3 1.0
White 205 89.5 7,473 69.4 77.5 36.5 18.3 32.0Other 81 35.4 335 3.1 8.2 4.1 4.3 2.0Unknown race 80 34.9 1,007 9.4 25.4 12.6 19.6 4.0Total 227 99.1 10,768 100.0 100.0 12.8 18.0 4.0
TABLE 52. FiRST-YEAR CLASS: AGE
n M SD MdnAverage age of first-year class 228 25.2 2.7 25.0Age of youngest matriculant 228 21.1 2.6 21.0Age of oldest matriculant 227 39.4 8.5 39.0

37 | PROGRAM REPORT 35 | SECTion 4. STuDEnTS
2019 COHORT
This section refers to the 2019 cohort, or the group of students who entered a PA program expecting to graduate in 2019. For most programs, this group of students matriculated in 2016. 213 programs (90.6%) reported that they had graduated or would be graduating a 2019 cohort of PA students.
For Tables 54 and 55:
• “n (P)” refers to the number of programs reporting at least one student of that status (e.g., in Table 55, 96 programs reported at least one student who was dismissed for academic reasons).
• “% (P)” refers to the proportion of programs reporting at least one student of that status, out of the 213 programs that reported graduating a 2019 cohort of students (e.g., in Table 55, of the 213 programs with a 2019 cohort, 45.1% reported at least one student who was dismissed for academic reasons).
• “n (S)” refers to the number of students of each status as reported by the n (P) programs (e.g., in Table 55, 96 programs reported 181 students who were dismissed for academic reasons).
• “% (S)” refers to the proportion of all students reported across programs of each status (e.g., in Table 55, of 10,121 total students, 1.8% were dismissed for academic reasons).
• “Mean % (S)” refers to the average proportion of students of each status among the n (P) reporting programs (e.g., in Table 55, of the 96 programs that reported at least one student who was dismissed for academic reasons, an average of 5.1% of their 2019 cohort was dismissed for academic reasons).
• M, SD, and Mdn are calculated using data from the n (P) reporting programs.
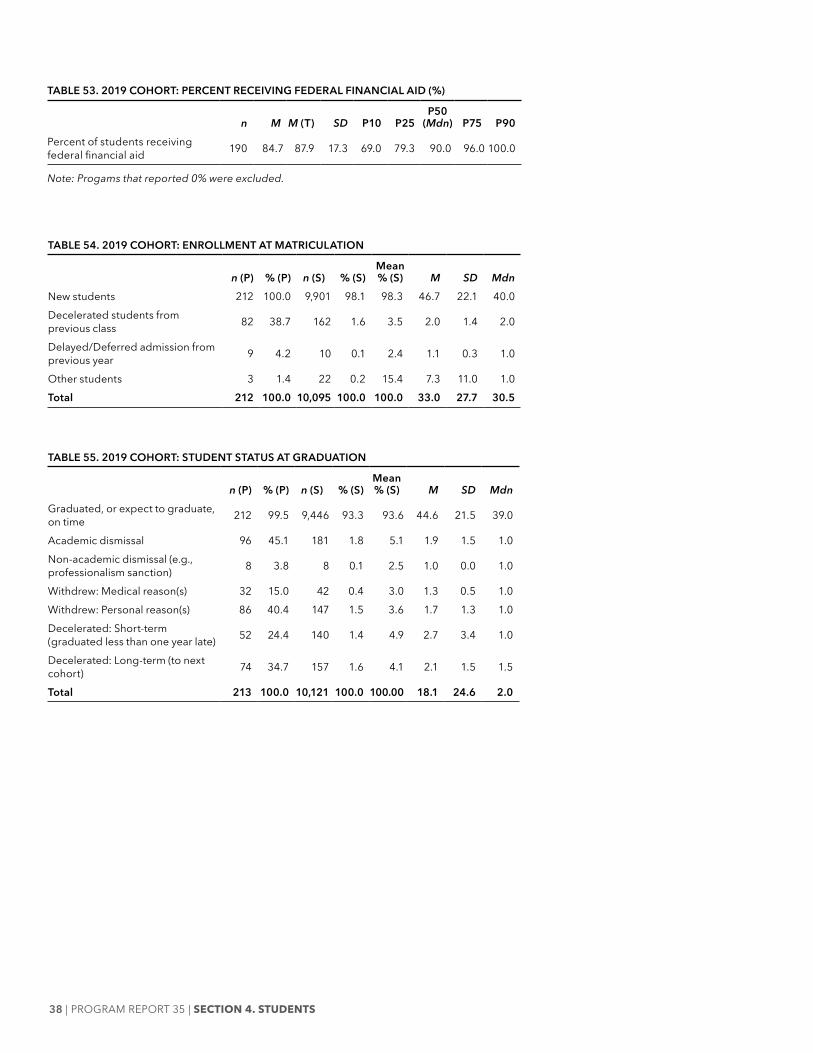
38 | PROGRAM REPORT 35 | SECTion 4. STuDEnTS
TABLE 54. 2019 COHORT: ENROLLMENT AT MATRiCULATiON
n (P) % (P) n (S) % (S)Mean % (S) M SD Mdn
New students 212 100.0 9,901 98.1 98.3 46.7 22.1 40.0Decelerated students from previous class 82 38.7 162 1.6 3.5 2.0 1.4 2.0
Delayed/Deferred admission from previous year 9 4.2 10 0.1 2.4 1.1 0.3 1.0
Other students 3 1.4 22 0.2 15.4 7.3 11.0 1.0Total 212 100.0 10,095 100.0 100.0 33.0 27.7 30.5
TABLE 55. 2019 COHORT: STUDENT STATUS AT GRADUATiON
n (P) % (P) n (S) % (S)Mean % (S) M SD Mdn
Graduated, or expect to graduate, on time 212 99.5 9,446 93.3 93.6 44.6 21.5 39.0
Academic dismissal 96 45.1 181 1.8 5.1 1.9 1.5 1.0Non-academic dismissal (e.g., professionalism sanction) 8 3.8 8 0.1 2.5 1.0 0.0 1.0
Withdrew: Medical reason(s) 32 15.0 42 0.4 3.0 1.3 0.5 1.0Withdrew: Personal reason(s) 86 40.4 147 1.5 3.6 1.7 1.3 1.0Decelerated: Short-term (graduated less than one year late) 52 24.4 140 1.4 4.9 2.7 3.4 1.0
Decelerated: Long-term (to next cohort) 74 34.7 157 1.6 4.1 2.1 1.5 1.5
Total 213 100.0 10,121 100.0 100.00 18.1 24.6 2.0
TABLE 53. 2019 COHORT: PERCENT RECEiViNG FEDERAL FiNANCiAL AiD (%)
n M M (T) SD P10 P25P50
(Mdn) P75 P90Percent of students receiving federal financial aid 190 84.7 87.9 17.3 69.0 79.3 90.0 96.0 100.0
Note: Progams that reported 0% were excluded.

39 | PROGRAM REPORT 35 | SECTion 4. STuDEnTS
2019 COHORT DEMOGRAPHiCS
The following section details the graduation, deceleration, and withdrawal status of the 2019 cohort of PA students by demographic factors (i.e., gender, ethnicity, and race). Omissions and imprecisions in programs’ reporting of student demographic data make it difficult to provide a complete and accurate picture of the PA student body. This is also why cohort sample sizes differ across demographic tables. For example, programs that do not collect or have access to student race data may be reporting all students as “other” or “unknown” race.
Demographic breakdowns are presented in two ways, in the “A” and “B” tables. The two types of tables present the same information in two different but complementary ways, giving further insight into the demographic makeup and statuses of the 2019 cohort.
In the “A” tables, we report student demographics by their status (i.e., graduation, dismissal, withdrawal, and deceleration rates). The “% (S)” column in the “A” tables can be interpreted as “Within each demographic category, what percentage of students had that status?” The “% (All S)” column of the “A” tables can be interpreted as “Of all students reported by demographics and status, how many students were of that demographic and status?” For example, Table 57A shows that, among female students, 97.6% graduated, and female graduates comprised 66.4% of all reported students in the 2019 cohort.
The “B” tables report student statuses by demographics. The interpretation of the percentages in the “B tables” is “Within each status, what percentage of students belonged to each demographic?” For example, Table 57B shows that 71.0% of all graduates in the 2019 cohort were female.
For all “A” tables:
• “n (P)” refers to the number of programs reporting at least one student of that demographic and status (e.g., in Table 57A, 70 programs reported at least one female student who was dismissed for academic reasons).
• “% (P)” refers to the proportion of programs reporting at least one student of that demographic and status, out of the 208 programs that reported graduating a 2019 cohort of students (e.g., in Table 57A, of the 208 programs with a 2019 cohort, 33.2% reported at least one female student who was dismissed for academic reasons).
• “n (S)” refers to the number of students of each demographic who had each status (e.g., in Table 57A, programs reported a total of 113 female students who were dismissed for academic reasons).
• “% (S)” refers to the proportion of all students within a demographic who had each status (e.g., in Table 57A, of 6,980 total female students, 1.6% were dismissed for academic reasons).
• “% (All S)” refers to the proportion of all students who belonged to a demographic and who had each status (e.g., in Table 57A, of 9,926 total students, 1.1% were female students who were dismissed for academic reasons).
• M, SD, and Mdn were calculated using data from the n (P) reporting programs and were not tabled when there were fewer than 5 reporting programs. Instead, they are labeled “NR.”

40 | PROGRAM REPORT 35 | SECTion 4. STuDEnTS
TABLE 57A. 2019 COHORT: GENDER BY STUDENT STATUS
n (P) % (P) n (S) % (S)%
(All S) M SD MdnFemale
Graduated, or expect to graduate, on time 206 97.6 6,585 94.3 66.4 32.0 14.7 28.0Academic dismissal 70 33.2 113 1.6 1.1 1.6 1.2 1.0Non-academic dismissal (e.g., professionalism sanction) 2 0.9 2 0.0 0.0 NR NR NRWithdrew: Medical reason(s) 16 7.6 17 0.2 0.2 1.1 0.3 1.0Withdrew: Personal reason(s) 66 31.3 90 1.3 0.9 1.4 0.7 1.0Decelerated: Short-term (graduated less than one year late) 43 20.4 81 1.2 0.8 1.9 1.3 1.0Decelerated: Long-term (to next cohort) 50 23.7 92 1.3 0.9 1.8 1.4 1.0Subtotal 207 98.1 6,980 100.0 70.3 33.7 15.6 30.0
MaleGraduated, or expect to graduate, on time 205 97.2 2,488 91.5 25.1 12.1 10.7 10.0Academic dismissal 47 22.3 52 1.9 0.5 1.1 0.4 1.0Non-academic dismissal (e.g., professionalism sanction) 6 2.8 6 0.2 0.1 1.0 0.0 1.0Withdrew: Medical reason(s) 9 4.3 9 0.3 0.1 1.0 0.0 1.0Withdrew: Personal reason(s) 38 18.0 52 1.9 0.5 1.4 1.1 1.0Decelerated: Short-term (graduated less than one year late) 25 11.8 50 1.8 0.5 2.0 2.7 1.0Decelerated: Long-term (to next cohort) 41 19.4 62 2.3 0.6 1.5 1.0 1.0Subtotal 205 97.2 2,719 100.0 27.4 13.3 12.0 11.0
Unknown genderGraduated, or expect to graduate, on time 5 2.4 200 89.7 2.0 40.0 13.1 42Academic dismissal 2 0.9 12 5.4 0.1 NR NR NRNon-academic dismissal (e.g., professionalism sanction) 0 0.0 0 0.0 0.0 NR NR NRWithdrew: Medical reason(s) 2 0.9 5 2.2 0.1 NR NR NRWithdrew: Personal reason(s) 0 0.0 0 0.0 0.0 NR NR NRDecelerated: Short-term (graduated less than one year late) 0 0.0 0 0.0 0.0 NR NR NRDecelerated: Long-term (to next cohort) 2 0.9 6 2.7 0.1 NR NR NRSubtotal 6 2.8 223 100.0 2.2 37.2 23.2 37.5
TotalGraduated, or expect to graduate, on time 211 100.0 9,273 93.5 93.5 43.9 20.5 39.0Academic dismissal 93 44.1 177 1.8 1.8 1.9 1.5 1.0Non-academic dismissal (e.g., professionalism sanction) 8 3.8 8 0.1 0.1 1.0 0.0 1.0Withdrew: Medical reason(s) 25 11.8 31 0.3 0.3 1.2 0.5 1.0Withdrew: Personal reason(s) 86 40.8 142 1.4 1.4 1.7 1.2 1.0Decelerated: Short-term (graduated less than one year late) 54 25.6 131 1.3 1.3 2.4 2.9 2.0Decelerated: Long-term (to next cohort) 73 34.6 160 1.6 1.6 2.2 1.8 1.0Total 211 100.0 9,922 100.0 100.0 47.0 22.4 41.0
TABLE 56. 2019 COHORT: PROGRAMS WiTH MiSSiNG DEMOGRAPHiC iNFORMATiON
n % Missing gender information 27 12.7Missing ethnicity information 37 17.4Missing race information 35 16.4
The percent of programs missing demographic information was calculated by dividing the number of programs that did not report demographic information, or reported all “Do not know,” by the 213 programs that reported that they would be graduating a 2019 cohort of students.

41 | PROGRAM REPORT 35 | SECTion 4. STuDEnTS
TABLE 58A. 2019 COHORT: ETHNiCiTY BY STUDENT STATUS
n (P) % (P) n (S) % (S)%
(All S) M SD MdnHispanic, Latino, or Spanish in origin
Graduated, or expect to graduate, on time 155 73.8 772 91.6 7.9 5.0 8.2 3.0Academic dismissal 14 6.7 18 2.1 0.2 1.3 0.6 1.0Non-academic dismissal (e.g., professionalism sanction) 0 0.0 0 0.0 0.0 NR NR NRWithdrew: Medical reason(s) 3 1.4 3 0.4 0.0 NR NR NRWithdrew: Personal reason(s) 15 7.1 17 2.0 0.2 1.1 0.5 1.0Decelerated: Short-term (graduated less than one year late) 7 3.3 12 1.4 0.1 1.7 1.3 1.0Decelerated: Long-term (to next cohort) 15 7.1 21 2.5 0.2 1.4 0.6 1.0Subtotal 160 76.2 843 100.0 8.6 5.3 8.4 3.0
Not Hispanic, Latino, or Spanish in originGraduated, or expect to graduate, on time 186 88.6 7,303 93.6 74.8 39.3 17.8 34.0Academic dismissal 73 34.8 131 1.7 1.3 1.8 1.3 1.0Non-academic dismissal (e.g., professionalism sanction) 7 3.3 7 0.1 0.1 1.0 0.0 1.0Withdrew: Medical reason(s) 21 10.0 25 0.3 0.3 1.2 0.4 1.0Withdrew: Personal reason(s) 70 33.3 110 1.4 1.1 1.6 1.2 1.0Decelerated: Short-term (graduated less than one year late) 41 19.5 100 1.3 1.0 2.4 2.7 2.0Decelerated: Long-term (to next cohort) 61 29.0 125 1.6 1.3 2.0 1.8 1.0Subtotal 195 92.9 7,801 100.0 79.9 40.0 20.4 36.0
Unknown ethnicityGraduated, or expect to graduate, on time 51 24.3 1,050 94.3 10.8 20.6 20.0 16.0Academic dismissal 11 5.2 24 2.2 0.2 2.2 2.7 1.0Non-academic dismissal (e.g., professionalism sanction) 0 0.0 0 0.0 0.0 NR NR NRWithdrew: Medical reason(s) 4 1.9 7 0.6 0.1 NR NR NRWithdrew: Personal reason(s) 6 2.9 10 0.9 0.1 1.7 1.0 1.0Decelerated: Short-term (graduated less than one year late) 7 3.3 10 0.9 0.1 1.4 0.8 1.0Decelerated: Long-term (to next cohort) 8 3.8 13 1.2 0.1 1.6 1.1 1.0Subtotal 62 29.5 1,114 100.0 11.4 18.0 20.4 7.5
TotalGraduated, or expect to graduate, on time 207 98.6 9,125 93.5 93.5 44.1 20.6 39.0Academic dismissal 91 43.3 173 1.8 1.8 1.9 1.6 1.0Non-academic dismissal (e.g., professionalism sanction) 7 3.3 7 0.1 0.1 1.0 0.0 1.0Withdrew: Medical reason(s) 28 13.3 35 0.4 0.4 1.3 0.5 1.0Withdrew: Personal reason(s) 81 38.6 137 1.4 1.4 1.7 1.2 1.0Decelerated: Short-term (graduated less than one year late) 50 23.8 122 1.3 1.3 2.4 3.0 1.5Decelerated: Long-term (to next cohort) 70 33.3 159 1.6 1.6 2.3 1.9 2.0Total 210 100.0 9,758 100.0 100.0 46.5 23.0 40.0
TABLE 57B. 2019 COHORT: STUDENT STATUS BY GENDER (%)
n (S) Female MaleUnknown Gender
Graduated, or expect to graduate, on time 9,273 71.0 26.8 2.2Academic dismissal 177 63.8 29.4 6.8Non-academic dismissal (e.g., professionalism sanction) 8 25.0 75.0 0.0Withdrew: Medical reason(s) 31 54.8 29.0 16.1Withdrew: Personal reason(s) 142 63.4 36.6 0.0Decelerated: Short-term (graduated less than one year late) 131 61.8 38.2 0.0Decelerated: Long-term (to next cohort) 160 57.5 38.8 3.8Total 9,922 70.3 27.4 2.2

42 | PROGRAM REPORT 35 | SECTion 4. STuDEnTS
TABLE 58B. 2019 COHORT: STUDENT STATUS BY ETHNiCiTY (%)
n (S)
Hispanic, Latino, or Spanish in Origin
Not Hispanic, Latino, or
Spanish in OriginUnknown Ethnicity
Graduated, or expect to graduate, on time 9,125 8.5 80.0 11.5Academic dismissal 173 10.4 75.7 13.9Non-academic dismissal (e.g., professionalism sanction) 7 0.0 100.0 0.0Withdrew: Medical reason(s) 35 8.6 71.4 20.0Withdrew: Personal reason(s) 137 12.4 80.3 7.3Decelerated: Short-term (graduated less than one year late) 122 9.8 82.0 8.2Decelerated: Long-term (to next cohort) 159 13.2 78.6 8.2Total 9,758 8.6 79.9 11.4
TABLE 59A. 2019 COHORT: RACE BY STUDENT STATUS
n (P) % (P) n (S) % (S)%
(All S) M SD MdnAmerican indian or Alaskan Native
Graduated, or expect to graduate, on time 40 19.0 48 90.6 0.5 1.2 0.5 1.0Academic dismissal 3 1.4 3 5.7 0.0 NR NR NRNon-academic dismissal (e.g., professionalism sanction) 0 0.0 0 0.0 0.0 NR NR NRWithdrew: Medical reason(s) 0 0.0 0 0.0 0.0 NR NR NRWithdrew: Personal reason(s) 1 0.5 1 1.9 0.0 NR NR NRDecelerated: Short-term (graduated less than one year late) 1 0.5 1 1.9 0.0 NR NR NRDecelerated: Long-term (to next cohort) 0 0.0 0 0.0 0.0 NR NR NRSubtotal 43 20.5 53 100.0 0.5 1.2 0.6 1.0
AsianGraduated, or expect to graduate, on time 170 81.0 793 92.0 8.0 4.7 3.8 3.5Academic dismissal 19 9.0 22 2.6 0.2 1.2 0.7 1.0Non-academic dismissal (e.g., professionalism sanction) 2 1.0 2 0.2 0.0 NR NR NRWithdrew: Medical reason(s) 1 0.5 1 0.1 0.0 NR NR NRWithdrew: Personal reason(s) 12 5.7 13 1.5 0.1 1.1 0.3 1.0Decelerated: Short-term (graduated less than one year late) 11 5.2 14 1.6 0.1 1.3 0.6 1.0Decelerated: Long-term (to next cohort) 12 5.7 17 2.0 0.2 1.4 0.7 1.0Subtotal 172 81.9 862 100.0 8.7 5.0 4.0 4.0
Black or African AmericanGraduated, or expect to graduate, on time 124 59.0 298 81.2 3.0 2.4 2.2 2.0Academic dismissal 15 7.1 18 4.9 0.2 1.2 0.4 1.0Non-academic dismissal (e.g., professionalism sanction) 1 0.5 1 0.3 0.0 NR NR NRWithdrew: Medical reason(s) 0 0.0 0 0.0 0.0 NR NR NRWithdrew: Personal reason(s) 11 5.2 15 4.1 0.2 1.4 0.9 1.0Decelerated: Short-term (graduated less than one year late) 12 5.7 15 4.1 0.2 1.3 0.5 1.0Decelerated: Long-term (to next cohort) 15 7.1 20 5.4 0.2 1.3 0.5 1.0Subtotal 133 63.3 367 100.0 3.7 2.8 2.6 2.0
MultiracialGraduated, or expect to graduate, on time 67 31.9 190 95.0 1.9 2.8 3.6 2.0Academic dismissal 4 1.9 4 2.0 0.0 NR NR NRNon-academic dismissal (e.g., professionalism sanction) 0 0.0 0 0.0 0.0 NR NR NRWithdrew: Medical reason(s) 0 0.0 0 0.0 0.0 NR NR NRWithdrew: Personal reason(s) 1 0.5 1 0.5 0.0 NR NR NRDecelerated: Short-term (graduated less than one year late) 2 1.0 2 1.0 0.0 NR NR NR
Of the 197 programs that reported some ethnicity information (excluding those that only reported “Do not know”) for their 2019 graduating cohort, 42 (21.3%) reported no Hispanic graduates.
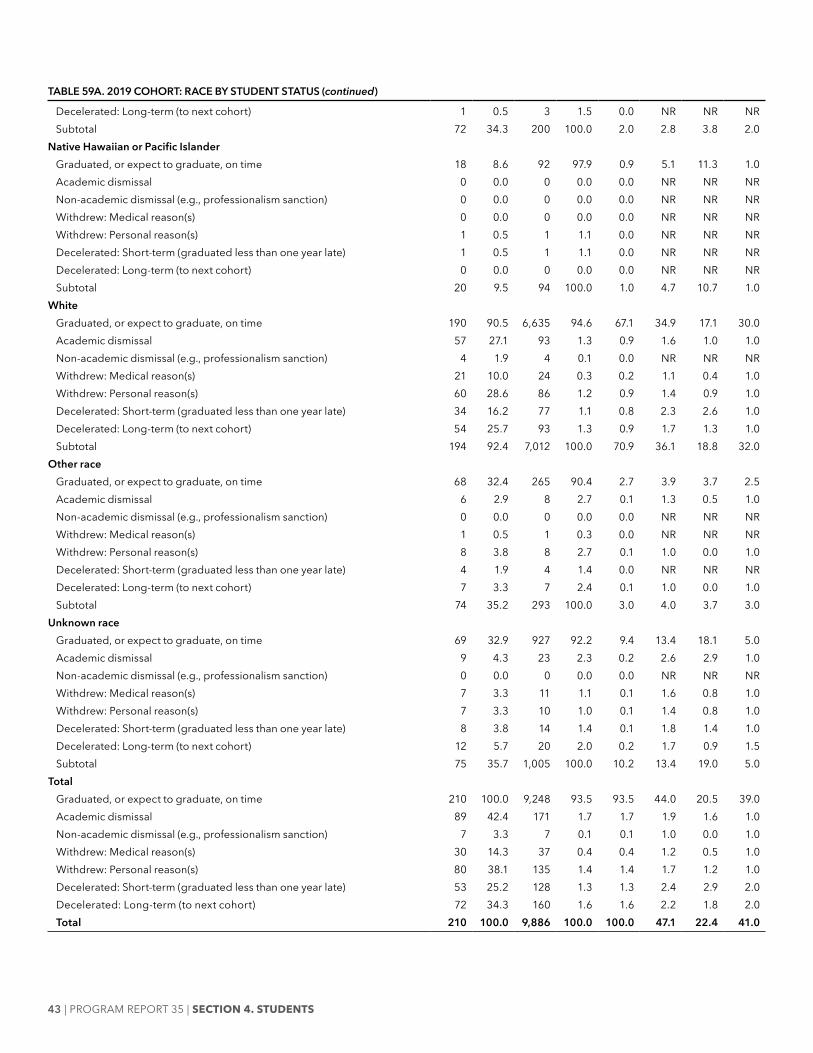
43 | PROGRAM REPORT 35 | SECTion 4. STuDEnTS
TABLE 59A. 2019 COHORT: RACE BY STUDENT STATUS (continued)
Decelerated: Long-term (to next cohort) 1 0.5 3 1.5 0.0 NR NR NRSubtotal 72 34.3 200 100.0 2.0 2.8 3.8 2.0
Native Hawaiian or Pacific IslanderGraduated, or expect to graduate, on time 18 8.6 92 97.9 0.9 5.1 11.3 1.0Academic dismissal 0 0.0 0 0.0 0.0 NR NR NRNon-academic dismissal (e.g., professionalism sanction) 0 0.0 0 0.0 0.0 NR NR NRWithdrew: Medical reason(s) 0 0.0 0 0.0 0.0 NR NR NRWithdrew: Personal reason(s) 1 0.5 1 1.1 0.0 NR NR NRDecelerated: Short-term (graduated less than one year late) 1 0.5 1 1.1 0.0 NR NR NRDecelerated: Long-term (to next cohort) 0 0.0 0 0.0 0.0 NR NR NRSubtotal 20 9.5 94 100.0 1.0 4.7 10.7 1.0
WhiteGraduated, or expect to graduate, on time 190 90.5 6,635 94.6 67.1 34.9 17.1 30.0Academic dismissal 57 27.1 93 1.3 0.9 1.6 1.0 1.0Non-academic dismissal (e.g., professionalism sanction) 4 1.9 4 0.1 0.0 NR NR NRWithdrew: Medical reason(s) 21 10.0 24 0.3 0.2 1.1 0.4 1.0Withdrew: Personal reason(s) 60 28.6 86 1.2 0.9 1.4 0.9 1.0Decelerated: Short-term (graduated less than one year late) 34 16.2 77 1.1 0.8 2.3 2.6 1.0Decelerated: Long-term (to next cohort) 54 25.7 93 1.3 0.9 1.7 1.3 1.0Subtotal 194 92.4 7,012 100.0 70.9 36.1 18.8 32.0
Other raceGraduated, or expect to graduate, on time 68 32.4 265 90.4 2.7 3.9 3.7 2.5Academic dismissal 6 2.9 8 2.7 0.1 1.3 0.5 1.0Non-academic dismissal (e.g., professionalism sanction) 0 0.0 0 0.0 0.0 NR NR NRWithdrew: Medical reason(s) 1 0.5 1 0.3 0.0 NR NR NRWithdrew: Personal reason(s) 8 3.8 8 2.7 0.1 1.0 0.0 1.0Decelerated: Short-term (graduated less than one year late) 4 1.9 4 1.4 0.0 NR NR NRDecelerated: Long-term (to next cohort) 7 3.3 7 2.4 0.1 1.0 0.0 1.0Subtotal 74 35.2 293 100.0 3.0 4.0 3.7 3.0
Unknown raceGraduated, or expect to graduate, on time 69 32.9 927 92.2 9.4 13.4 18.1 5.0Academic dismissal 9 4.3 23 2.3 0.2 2.6 2.9 1.0Non-academic dismissal (e.g., professionalism sanction) 0 0.0 0 0.0 0.0 NR NR NRWithdrew: Medical reason(s) 7 3.3 11 1.1 0.1 1.6 0.8 1.0Withdrew: Personal reason(s) 7 3.3 10 1.0 0.1 1.4 0.8 1.0Decelerated: Short-term (graduated less than one year late) 8 3.8 14 1.4 0.1 1.8 1.4 1.0Decelerated: Long-term (to next cohort) 12 5.7 20 2.0 0.2 1.7 0.9 1.5Subtotal 75 35.7 1,005 100.0 10.2 13.4 19.0 5.0
TotalGraduated, or expect to graduate, on time 210 100.0 9,248 93.5 93.5 44.0 20.5 39.0Academic dismissal 89 42.4 171 1.7 1.7 1.9 1.6 1.0Non-academic dismissal (e.g., professionalism sanction) 7 3.3 7 0.1 0.1 1.0 0.0 1.0Withdrew: Medical reason(s) 30 14.3 37 0.4 0.4 1.2 0.5 1.0Withdrew: Personal reason(s) 80 38.1 135 1.4 1.4 1.7 1.2 1.0Decelerated: Short-term (graduated less than one year late) 53 25.2 128 1.3 1.3 2.4 2.9 2.0Decelerated: Long-term (to next cohort) 72 34.3 160 1.6 1.6 2.2 1.8 2.0Total 210 100.0 9,886 100.0 100.0 47.1 22.4 41.0
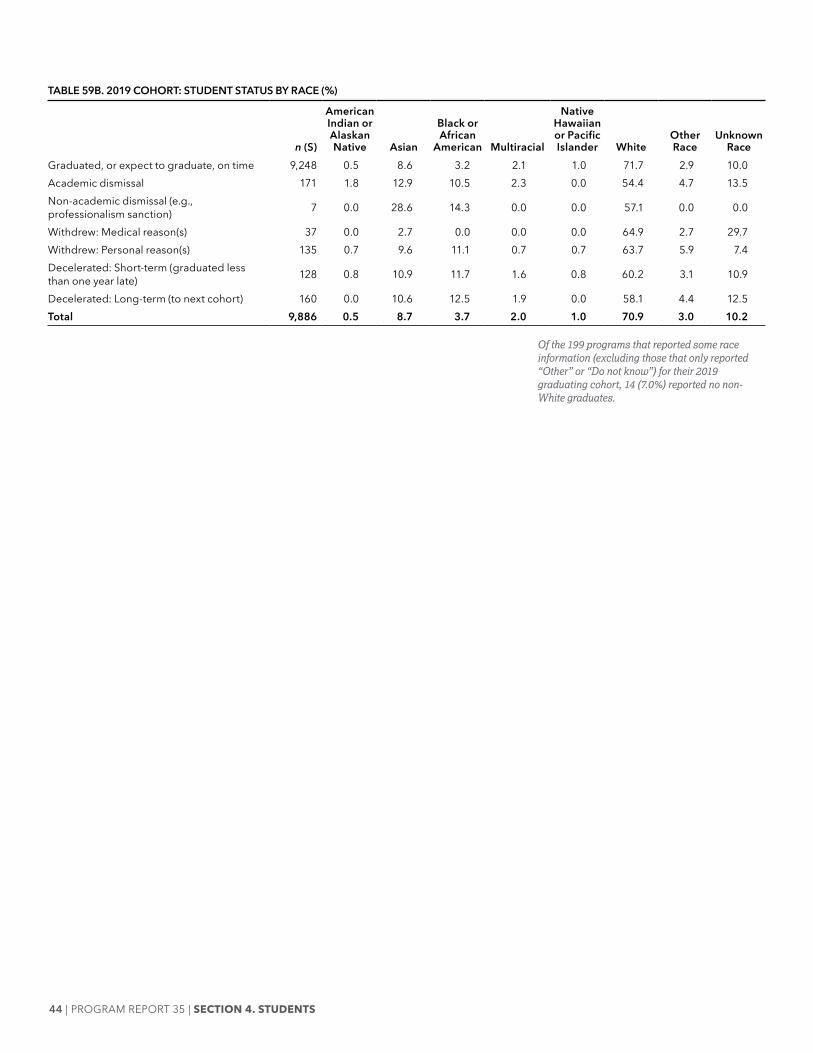
44 | PROGRAM REPORT 35 | SECTion 4. STuDEnTS
TABLE 59B. 2019 COHORT: STUDENT STATUS BY RACE (%)
n (S)
American indian or Alaskan Native Asian
Black or African
American Multiracial
Native Hawaiian or Pacific islander White
Other Race
Unknown Race
Graduated, or expect to graduate, on time 9,248 0.5 8.6 3.2 2.1 1.0 71.7 2.9 10.0Academic dismissal 171 1.8 12.9 10.5 2.3 0.0 54.4 4.7 13.5Non-academic dismissal (e.g., professionalism sanction) 7 0.0 28.6 14.3 0.0 0.0 57.1 0.0 0.0
Withdrew: Medical reason(s) 37 0.0 2.7 0.0 0.0 0.0 64.9 2.7 29.7Withdrew: Personal reason(s) 135 0.7 9.6 11.1 0.7 0.7 63.7 5.9 7.4Decelerated: Short-term (graduated less than one year late) 128 0.8 10.9 11.7 1.6 0.8 60.2 3.1 10.9
Decelerated: Long-term (to next cohort) 160 0.0 10.6 12.5 1.9 0.0 58.1 4.4 12.5Total 9,886 0.5 8.7 3.7 2.0 1.0 70.9 3.0 10.2
Of the 199 programs that reported some race information (excluding those that only reported “Other” or “Do not know”) for their 2019 graduating cohort, 14 (7.0%) reported no non-White graduates.