Embed Size (px)
Citation preview

Environmental Product Declaration A cradle-to-gate EPD according to ISO 14025 and ISO 21930
Ready-mix Concrete as Manufactured by
Emirates Beton
1
Environmental Product Declaration
The company was established in 2008 by a dynamic and highly qualified group of
people with over 20 years of pioneering experience in the ready-mix concrete
industry. The fast-growing company is now a major industry player and boasts of
a reputation for superb products and outstanding services.
About Emirates
Beton
Emirates Beton Ready Mix (EB)
is a ready-mix concrete
company that leads the
industry in the design,
production and supply of
ready-mix concrete.
2
Environmental Product Declaration
ASTM International Certified EPD
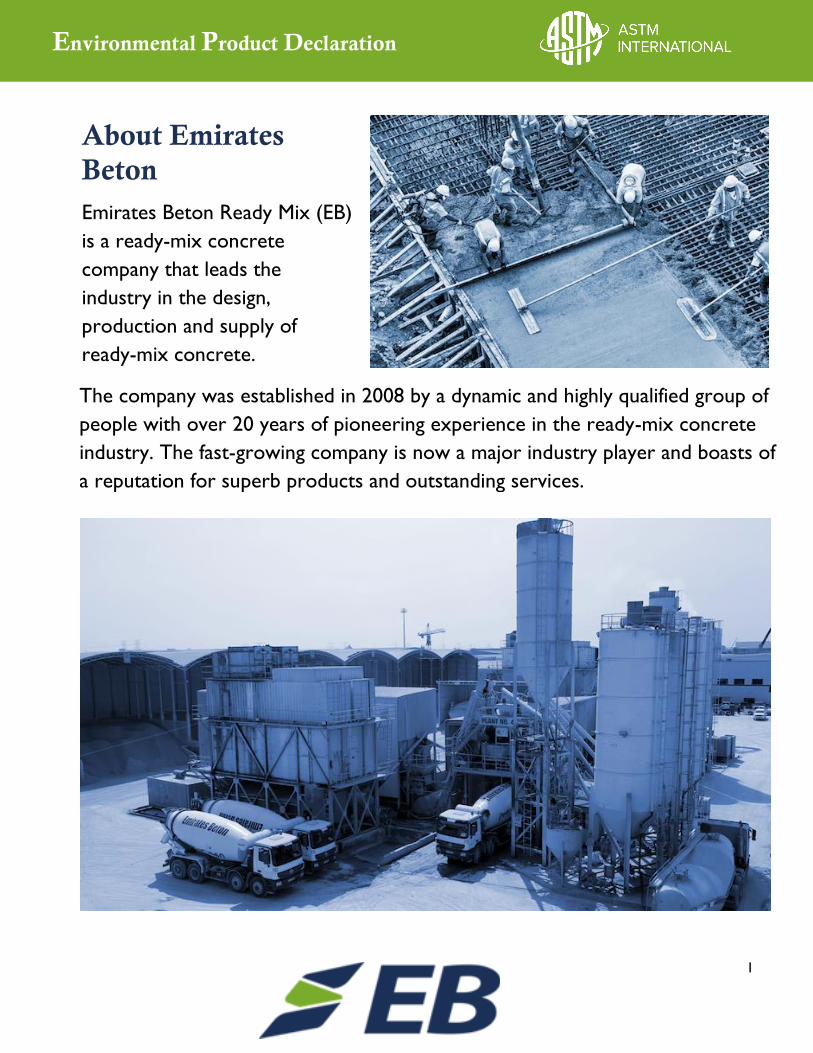
This is a business-to-business Type III environmental product declaration (EPD) for ready mix concrete
products as produced by Emirates Beton. This declaration has been prepared in accordance with ISO
14025 and ISO 21930, and the Carbon Leadership Forum product category rules (PCR) and EPD program
operator rules.
The intent of this document is to further the development of environmentally compatible and more
sustainable construction products by providing comprehensive environmental information related to
potential impacts of ready-mix concrete available in the UAE in accordance with international standards.
Program Operator
ASTM International
Environmental Product Declarations
100 Barr Harbor Drive,
West Conshohocken,
PA 19428-2959
www.astm.org
Owner of the EPD
Emirates Beton Ready Mix LCC
P.O. Box: 111576
Jebel Ali
Dubai - United Arab Emirates
emiratesbeton.com
Concrete Consultant
Grey Matters Consultancy
P.O. Box: 283079
Dubai Investment Park
Dubai - UAE
www.greymatters.ws
EPD Information
Product Name
Ready-mix concrete
Product Definition
A composite material that consists of a binding medium (cement paste, hydraulic cement and
water, and possibly one or more admixtures) embedded with fine aggregate (typically sand) and
coarse aggregate (typically gravel) to form a hard solid mass.
Declared Unit
1 m3 ready-mix concrete
Declaration Number
EPD 083
Declaration Type
A “cradle-to-gate” EPD - activity stages or information modules covered include production (modules A1 to A3). The
declaration is intended for use in Business-to-Business (B-to-B) communication. This EPD of ready-mix concrete (UN CPC
3751) is applicable to those manufactured at the Emirates Beton Jebel Ali facility.
Content of the Declaration
The declaration follows Section 4, Reporting: Content of the EPD, Carbon Leadership Forum, Product Category Rules (PCR)
for ISO 14025 Type III Environmental Product Declarations (EPDs) for Concrete.

3
Environmental Product Declaration
EPD Information
Declaration Comparability Limitation Statement
The following ISO statement indicates the EPD comparability limitations and intent to avoid any market distortions or
misinterpretation of EPDs based on the CLF’s PCR: 2013:
▪ EPDs from different programs (using different PCR) may not be comparable.
▪ Declarations based on the CLF PCR are not comparative assertions; that is, no claim of environmental superiority may
be inferred or implied.
Applicable Countries
United Arab Emirates
Date of Issue
June 22 2018
Period of Validity
5 years
EPD Prepared by
Matt Bowick, Athena Sustainable Materials Institute
119 Ross Avenue, Suite 100
Ottawa, Ontario, K1Y 0N6, Canada
This EPD was independently verified
by ASTM in accordance with ISO 14025:
Timothy Brooke , ASTM International
100 Barr Harbor Dr.
West Conshohocken, PA 19428
Internal External
X
EPD Project Report Information
EPD Project Report
A Cradle-to-Gate Life Cycle Assessment of Ready-Mix Concrete Manufactured by Emirates Beton Ready Mix
in the Emirate of Dubai, UAE, April 2018.
The report is available upon request at [email protected].
EPD Project Prepared by
Matt Bowick, Athena Sustainable Materials Institute
119 Ross Avenue, Suite 100
Ottawa, Ontario, K1Y 0N6, Canada
This EPD and EPD project report were independently
verified by in accordance with ISO 14025 and the
reference PCR:
Thomas Gloria, Ph.D. (LCACP ID: 2008-03)
Industrial Ecology Consultants
Email: [email protected]
PCR Information
Reference PCR
The Carbon Leadership Forum PCR: Product Category Rules (PCR)
for ISO 14025 Type III Environmental Product Declarations (EPDs)
for Concrete Version 1.1
Date of Issue December 2013
PCR review was conducted by:
Nicholas Santero, PE International
Holly Lahd, EL Analytics
Medgar Marceau, Morrison Hershfield
Contact information available upon request via
www.carbonleadershipforum.org.

4
Environmental Product Declaration
1. PRODUCT IDENTIFICATION
This EPD reports environmental information for six ready-mix concrete designs, produced by Emirates
Beton at their Jebel Ali plant in Dubai, United Arab Emirates. See Figure 1 below for a visual
representation of ready-mix concrete.
Figure 1: Ready-mix Concrete
Products covered by this EPD satisfy general purpose concrete as used in residential, commercial and
public works applications in Dubai, UAE. This EPD reports the impacts for six ready-mix concrete
products (listed in Table 1 on the following page) in accordance with the following:
• Dubai Municipality Circular 202: Use of Eco-friendly Cementitious Materials in Concrete
• ACI 211: Standard Practice for Selecting Proportions for Normal, Heavyweight, and Mass
Concrete
• ACI 318: Building Code Requirements for Structural Concrete
• ASTM C94: Standard Specification for Ready-Mixed Concrete
• CSI MasterFormat Division 03-30-00: Cast-in-Place Concrete
• UNSPSC Code 30111500: Ready Mix Concrete

5
Environmental Product Declaration
Table 1: Ready-mix Concrete Designs
Mix Design # 1 2 3 4 5 6
Code NS2027 SB5035 SB5036 SB6021 SB4013 SB4518
Concrete Grade, Fcy/Fcu1 (MPa) C15/20 C40/50 C40/50 C50/60 C32/40 C36/45
End-use Blinding Substructure
- Slabs
Substructure
- Raft /
External
Basement
walls
Substructure
- Column /
Wall /
Canopy Ring
Beam & Pile
Cap
General
Substructure
General
Substructure
2. DECLARED UNIT
The declared unit is 1 m3 of ready-mix concrete.
3. MATERIAL CONTENT
Table 2 below presents the material content by input material for the six mix designs, as produced by
Emirates Beton.
Table 2: Material Content of Ready-mix Concrete Designs
Material NS2027 - C15/20
SB5035 - C40/50
SB5036 - C40/50
SB6021 - C50/60
SB4013 - C32/40
SB4518 - C36/45
Portland Cement 0 176 176 179 160 168
Sulphate Resistant Cement 122 0 0 0 0 0
Slag Cement 228 242 242 248 240 252
Silica Fume 0 22 22 23 0 0
Crushed Coarse Aggregate - 20mm 562 576 576 578 586 579
Crushed Coarse Aggregate - 10mm 382 336 336 345 349 337
Crushed Fine Aggregate - 5mm 604 600 600 576 616 593
Natural Fine Aggregate - dune Sand 333 327 327 322 330 337
Low-range Admixture (plasticizer) 6 0 0 0 7.5 0
Mid-range Admixture (plasticizer) 0 7 7 7 0 6.5
Corrosion Inhibitor Admixture 0 0 0.6 0 0 0
Water 158 141 141 144 140 147
Total, kg/m3 2,395 2,427 2,428 2,422 2,429 2,420
1 Fcy/Fcu is the ratio of 28-day compressive strength (in MPa) of a concrete cylinder vs. a concrete cube
6
Environmental Product Declaration
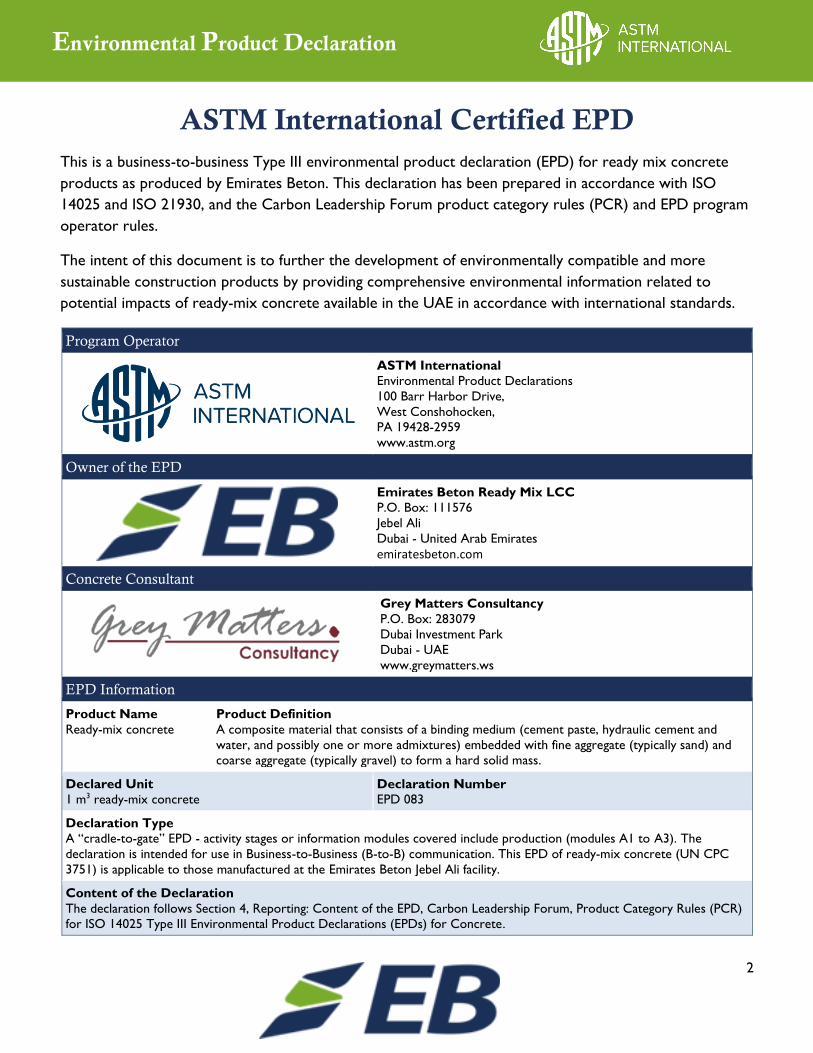
4. SYSTEM BOUNDARY
This EPD is intended for use in Business to Business (B-to-B) communication. The scope of this EPD is
cradle-to-gate and considers the following life cycle modules:
▪ A1 - Raw Material Supply
▪ A2 - Transportation
▪ A3 - Manufacturing
Figure 2 shows the product stage system boundary for ready-mix concrete.
Figure 2: Product Stage (module A1 to A3) System Boundary
7
Environmental Product Declaration
A summary of life cycle activities included in the EPD is as follows:
▪ Raw Material Supply (upstream processes): Extraction, handling and processing of the
raw materials used in the production of concrete: cement, supplementary
cementitious materials, aggregate (coarse and fine), water, admixtures and other materials
or chemicals used in concrete mixtures.
▪ Transportation: Transportation of these materials from the supplier to the 'gate' of the concrete
producer.
▪ Manufacturing (core processes): The energy used to store, batch, mix and distribute the
concrete and operate the facility (concrete plant).
▪ Water use in mixing and distributing concrete.
A summary of life cycle activities excluded from the EPD is as follows:
▪ Production, manufacture and construction of buildings capital goods and infrastructure.
▪ Production and manufacture of concrete production equipment, concrete delivery vehicles,
earthmoving equipment, and laboratory equipment.
▪ Personnel‐related activities (travel, furniture, office supplies).
▪ Energy use related to company management and sales activities.
5. DATA SOURCES AND DATA QUALITY
ASSESSMENT
This EPD is based on foreground LCI data collected from the participating company’s production
facilities for the calendar year 2016. All upstream material, resource and energy carrier inputs have been
sourced from various industry-average datasets and literature. Table 3 through Table 6 describe each
LCI data source and the data quality for each data source.
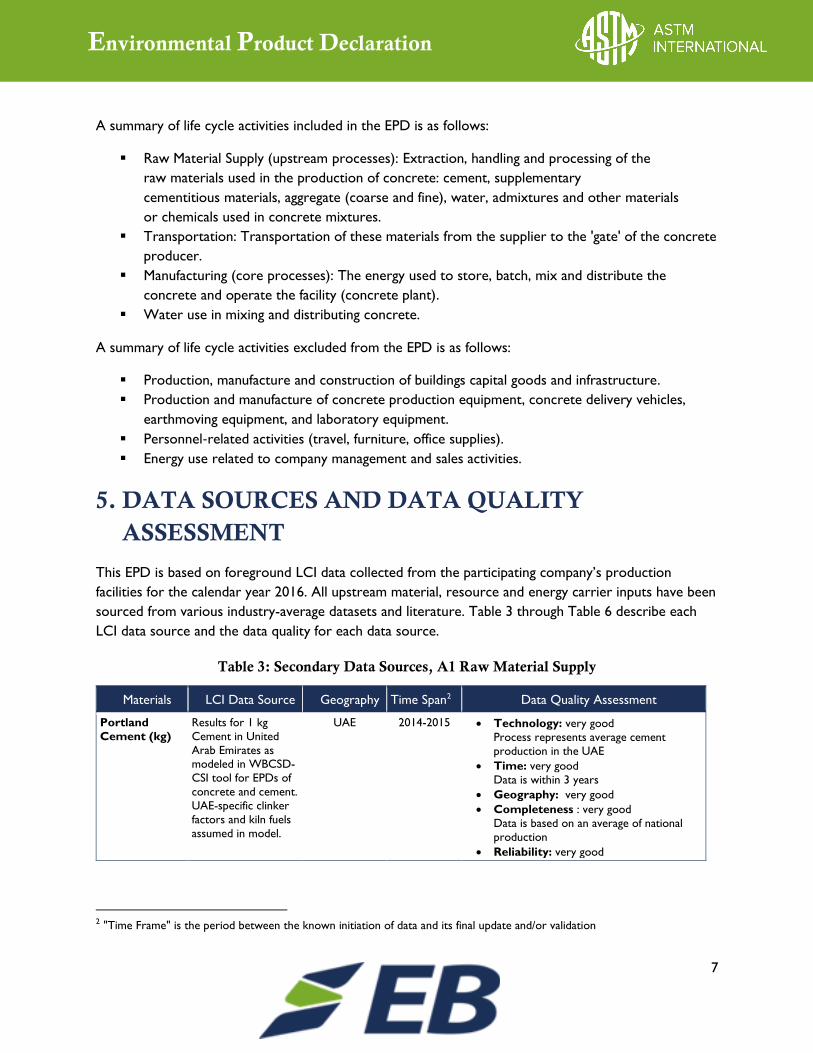
Table 3: Secondary Data Sources, A1 Raw Material Supply
Materials LCI Data Source Geography Time Span2 Data Quality Assessment
Portland
Cement (kg)
Results for 1 kg
Cement in United
Arab Emirates as modeled in WBCSD-
CSI tool for EPDs of
concrete and cement.
UAE-specific clinker
factors and kiln fuels
assumed in model.
UAE 2014-2015 • Technology: very good
Process represents average cement
production in the UAE
• Time: very good
Data is within 3 years
• Geography: very good
• Completeness : very good
Data is based on an average of national
production
• Reliability: very good
2 "Time Frame" is the period between the known initiation of data and its final update and/or validation

8
Environmental Product Declaration
Materials LCI Data Source Geography Time Span2 Data Quality Assessment
Sulphate
Resistant
Cement (kg)
n/a n/a n/a Secondary data for this product was
unavailable; portland cement data was used as
a proxy (see above)
Slag Cement
(kg)
Slag Cement
Association N.
America EPD Slag
Cement, 2015
N. America 2013-2014 • Technology: very good
Process models ground granulated blast
furnace slag
• Time: very good
Data is within 4 years
• Geography: fair
• Completeness: very good
• Reliability: very good
Third-party verified EPD
Silica Fume
(kg)
n/a n/a n/a Transport of silica fume to facility
considered but no preprocessing is
assumed
Crushed
Aggregates
(kg) coarse and
fine
Natural
Aggregates
(kg) fine
ecoinvent 3.3:
Gravel, crushed
{RoW}| production
| Alloc Rec
ecoinvent 3.3
ecoinvent 3.3: Sand
{RoW}| gravel and
quarry operation |
Alloc Rec,
Modified with UAE
electricity, water
ROW/UAE 1997-2016 • Technology: good
Processes represent aggregate, with and
without crushing
• Time: good
• Geography: good
Modified with UAE electricity and water
• Completeness: good
• Reliability: good
ecoinvent has verified the data
Admixtures
(kg)
Low- and mid-
range water
reducers
Concrete
admixtures –
Plasticisers and
Superplasticisers
European
Federation of
Concrete
Admixtures
Associations Ltd.
(EFCA)
EU 2015 • Technology: good
Processes represents admixture
production for use in concrete
• Time: very good
• Geography: fair
• Completeness: very good
Data from a federation of European
admixture producers
• Reliability: very good
Third-party verified EPD
Admixtures
(kg)
corrosion inhibitor
n/a n/a n/a Secondary data for this product was
unavailable; plasticisers and
superplasticisers data was used as a proxy
(see above)
9
Environmental Product Declaration
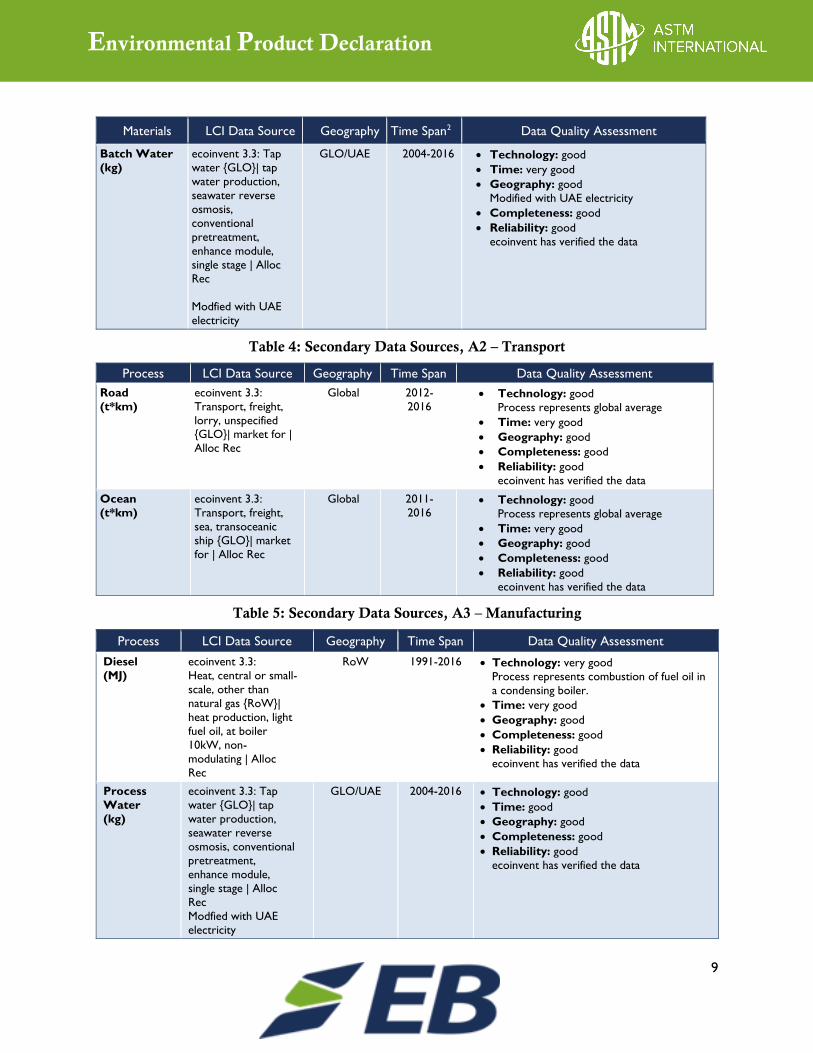
Materials LCI Data Source Geography Time Span2 Data Quality Assessment
Batch Water
(kg)
ecoinvent 3.3: Tap
water {GLO}| tap
water production,
seawater reverse
osmosis,
conventional
pretreatment,
enhance module,
single stage | Alloc
Rec
Modfied with UAE
electricity
GLO/UAE 2004-2016 • Technology: good
• Time: very good
• Geography: good
Modified with UAE electricity
• Completeness: good
• Reliability: good
ecoinvent has verified the data
Table 4: Secondary Data Sources, A2 – Transport
Process LCI Data Source Geography Time Span Data Quality Assessment
Road
(t*km)
ecoinvent 3.3:
Transport, freight,
lorry, unspecified {GLO}| market for |
Alloc Rec
Global 2012-
2016 • Technology: good
Process represents global average
• Time: very good
• Geography: good
• Completeness: good
• Reliability: good
ecoinvent has verified the data
Ocean
(t*km)
ecoinvent 3.3:
Transport, freight,
sea, transoceanic
ship {GLO}| market
for | Alloc Rec
Global 2011-
2016 • Technology: good
Process represents global average
• Time: very good
• Geography: good
• Completeness: good
• Reliability: good
ecoinvent has verified the data
Table 5: Secondary Data Sources, A3 – Manufacturing
Process LCI Data Source Geography Time Span Data Quality Assessment
Diesel
(MJ)
ecoinvent 3.3:
Heat, central or small-
scale, other than
natural gas {RoW}|
heat production, light
fuel oil, at boiler
10kW, non-
modulating | Alloc
Rec
RoW 1991-2016 • Technology: very good
Process represents combustion of fuel oil in
a condensing boiler.
• Time: very good
• Geography: good
• Completeness: good
• Reliability: good
ecoinvent has verified the data
Process
Water
(kg)
ecoinvent 3.3: Tap
water {GLO}| tap
water production,
seawater reverse
osmosis, conventional
pretreatment,
enhance module,
single stage | Alloc
Rec
Modfied with UAE
electricity
GLO/UAE 2004-2016 • Technology: good
• Time: good
• Geography: good
• Completeness: good
• Reliability: good
ecoinvent has verified the data
10
Environmental Product Declaration
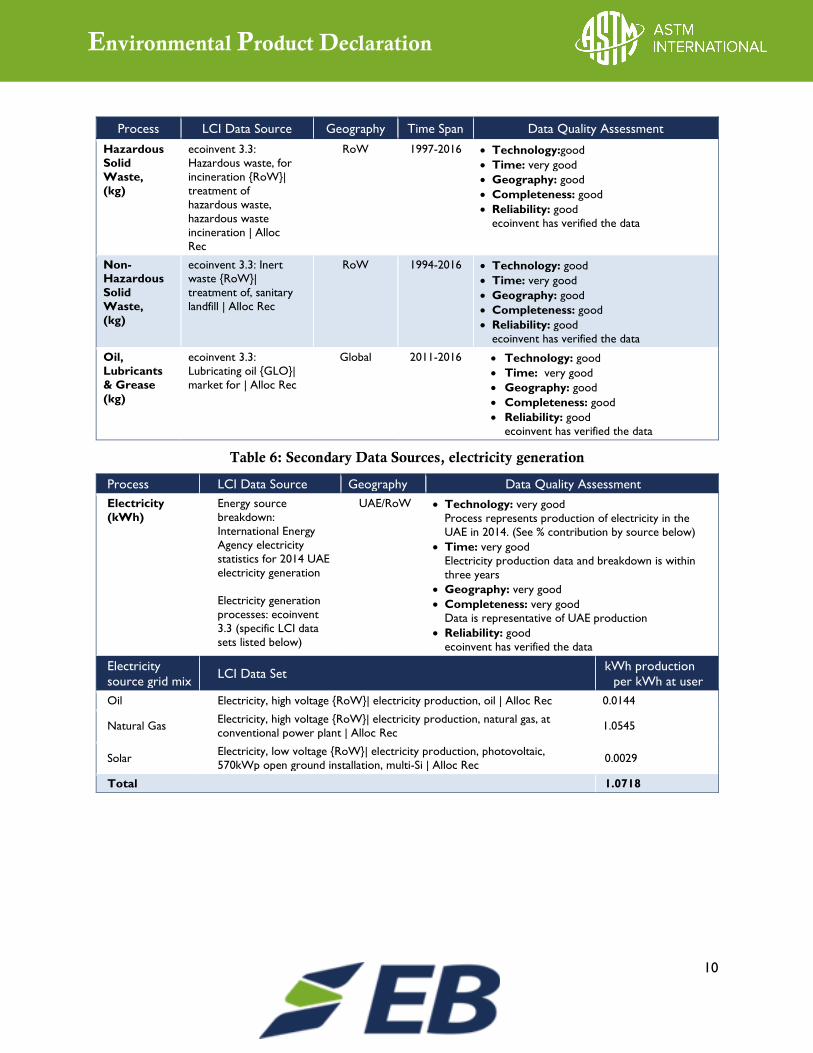
Process LCI Data Source Geography Time Span Data Quality Assessment
Hazardous
Solid
Waste,
(kg)
ecoinvent 3.3:
Hazardous waste, for
incineration {RoW}|
treatment of
hazardous waste,
hazardous waste
incineration | Alloc
Rec
RoW 1997-2016 • Technology:good
• Time: very good
• Geography: good
• Completeness: good
• Reliability: good
ecoinvent has verified the data
Non-Hazardous
Solid
Waste,
(kg)
ecoinvent 3.3: Inert waste {RoW}|
treatment of, sanitary
landfill | Alloc Rec
RoW 1994-2016 • Technology: good
• Time: very good
• Geography: good
• Completeness: good
• Reliability: good
ecoinvent has verified the data
Oil,
Lubricants
& Grease
(kg)
ecoinvent 3.3:
Lubricating oil {GLO}|
market for | Alloc Rec
Global 2011-2016 • Technology: good
• Time: very good
• Geography: good
• Completeness: good
• Reliability: good
ecoinvent has verified the data
Table 6: Secondary Data Sources, electricity generation
Process LCI Data Source Geography Data Quality Assessment
Electricity
(kWh)
Energy source
breakdown:
International Energy
Agency electricity
statistics for 2014 UAE
electricity generation
Electricity generation
processes: ecoinvent
3.3 (specific LCI data
sets listed below)
UAE/RoW • Technology: very good
Process represents production of electricity in the
UAE in 2014. (See % contribution by source below)
• Time: very good
Electricity production data and breakdown is within
three years
• Geography: very good
• Completeness: very good
Data is representative of UAE production
• Reliability: good
ecoinvent has verified the data
Electricity
source grid mix LCI Data Set
kWh production
per kWh at user
Oil Electricity, high voltage {RoW}| electricity production, oil | Alloc Rec 0.0144
Natural Gas Electricity, high voltage {RoW}| electricity production, natural gas, at
conventional power plant | Alloc Rec 1.0545
Solar Electricity, low voltage {RoW}| electricity production, photovoltaic,
570kWp open ground installation, multi-Si | Alloc Rec 0.0029
Total 1.0718
11
Environmental Product Declaration
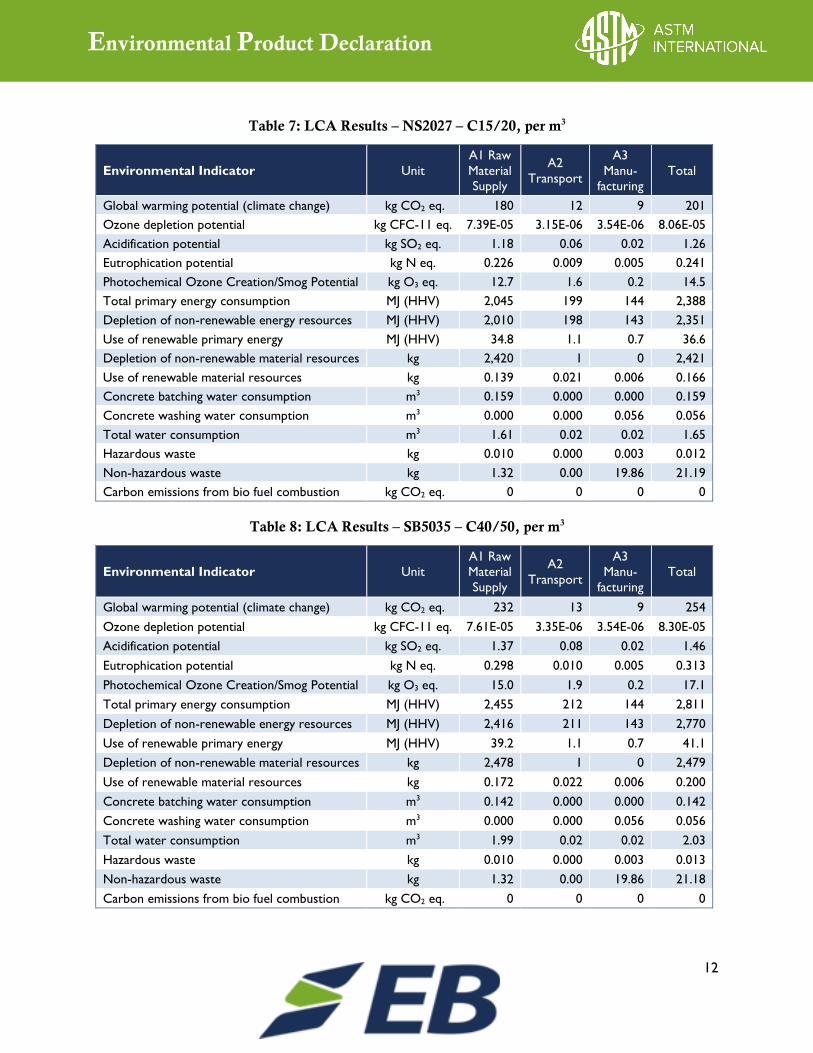
6. LIFE CYCLE ASSESSMENT
This section summarizes the results of the life cycle impact assessment (LCIA) based on the cradle-to-
gate life cycle inventory inputs and outputs analysis. The results are calculated on the basis of 1 m3
ready-mix concrete (Table 7 through Table 12). The production results are delineated by information
modules A1 through A3.
As per the CLF PCR, Section 3.2, US EPA Tool for the Reduction and Assessment of Chemical and
Other Environmental Impacts (TRACI, version 2.1) impact categories are used for the mandatory
category indicators to be included in this EPD. Total primary and sub-set energy consumption was
compiled using a cumulative energy demand model. Material resource consumption and generated
waste reflect cumulative life cycle inventory flow information.
The limitations of this EPD include:
▪ This EPD does not report all of the environmental impacts due to manufacturing of the product,
but rather reports the environmental impacts for those categories with established LCA-based
methods to track and report. Unreported environmental impacts include (but are not limited
to) factors attributable to human health, land use change, and habitat destruction.
▪ In order to assess the local impacts of product manufacturing, additional analysis is required.
▪ This EPD reports the results of an LCA or the ‘cradle-to-gate’ analysis. Thus, declarations
themselves are not comparative assertions, defined as an environmental claim regarding the
superiority or equivalence of one product versus a competing product that performs the same
function. An EPD does not make any statements that the product covered by the EPD is better
or worse than any other product.
▪ The EPD participants may participate in other sustainability or environmental best practice
programs. However, no such additional environmental claim or declaration is conveyed in this
EPD.
▪ EPDs of concrete mixtures may not be comparable if they do not comply with this standard and
data from this EPD. The data cannot be used to compare between concrete mixes, construction
products or concrete mixtures used in different concrete products unless the data is integrated
into a comprehensive LCA. For example, precast concrete, concrete masonry units and site cast
concrete all have different manufacturing processes whose impacts are attributed to different
LCA stages. This precludes direct comparison between mixtures used in these different
products unless all lifecycle phases are included.
▪ Life cycle impact assessment (LCIA) results are relative expressions and do not predict impacts
on category endpoints, the exceeding of thresholds, safety margins or risks.
▪ This EPD was created using industry average data for upstream materials. Variation can result
from differences in supplier locations, manufacturing processes, manufacturing efficiency and fuel
type used.
12
Environmental Product Declaration
Table 7: LCA Results – NS2027 – C15/20, per m3
Environmental Indicator Unit
A1 Raw
Material
Supply
A2
Transport
A3
Manu-
facturing
Total
Global warming potential (climate change) kg CO2 eq. 180 12 9 201
Ozone depletion potential kg CFC-11 eq. 7.39E-05 3.15E-06 3.54E-06 8.06E-05
Acidification potential kg SO2 eq. 1.18 0.06 0.02 1.26
Eutrophication potential kg N eq. 0.226 0.009 0.005 0.241
Photochemical Ozone Creation/Smog Potential kg O3 eq. 12.7 1.6 0.2 14.5
Total primary energy consumption MJ (HHV) 2,045 199 144 2,388
Depletion of non-renewable energy resources MJ (HHV) 2,010 198 143 2,351
Use of renewable primary energy MJ (HHV) 34.8 1.1 0.7 36.6
Depletion of non-renewable material resources kg 2,420 1 0 2,421
Use of renewable material resources kg 0.139 0.021 0.006 0.166
Concrete batching water consumption m3 0.159 0.000 0.000 0.159
Concrete washing water consumption m3 0.000 0.000 0.056 0.056
Total water consumption m3 1.61 0.02 0.02 1.65
Hazardous waste kg 0.010 0.000 0.003 0.012
Non-hazardous waste kg 1.32 0.00 19.86 21.19
Carbon emissions from bio fuel combustion kg CO2 eq. 0 0 0 0
Table 8: LCA Results – SB5035 – C40/50, per m3
Environmental Indicator Unit
A1 Raw
Material
Supply
A2
Transport
A3
Manu-
facturing
Total
Global warming potential (climate change) kg CO2 eq. 232 13 9 254
Ozone depletion potential kg CFC-11 eq. 7.61E-05 3.35E-06 3.54E-06 8.30E-05
Acidification potential kg SO2 eq. 1.37 0.08 0.02 1.46
Eutrophication potential kg N eq. 0.298 0.010 0.005 0.313
Photochemical Ozone Creation/Smog Potential kg O3 eq. 15.0 1.9 0.2 17.1
Total primary energy consumption MJ (HHV) 2,455 212 144 2,811
Depletion of non-renewable energy resources MJ (HHV) 2,416 211 143 2,770
Use of renewable primary energy MJ (HHV) 39.2 1.1 0.7 41.1
Depletion of non-renewable material resources kg 2,478 1 0 2,479
Use of renewable material resources kg 0.172 0.022 0.006 0.200
Concrete batching water consumption m3 0.142 0.000 0.000 0.142
Concrete washing water consumption m3 0.000 0.000 0.056 0.056
Total water consumption m3 1.99 0.02 0.02 2.03
Hazardous waste kg 0.010 0.000 0.003 0.013
Non-hazardous waste kg 1.32 0.00 19.86 21.18
Carbon emissions from bio fuel combustion kg CO2 eq. 0 0 0 0
13
Environmental Product Declaration
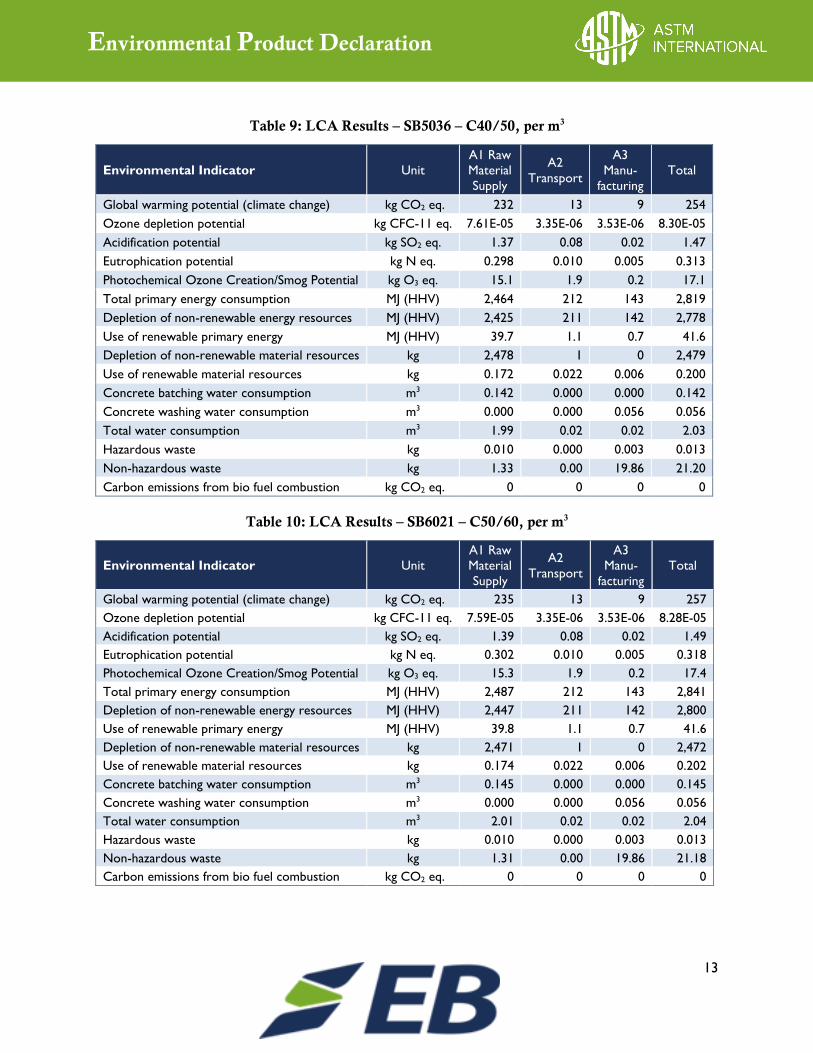
Table 9: LCA Results – SB5036 – C40/50, per m3
Environmental Indicator Unit
A1 Raw
Material
Supply
A2
Transport
A3
Manu-
facturing
Total
Global warming potential (climate change) kg CO2 eq. 232 13 9 254
Ozone depletion potential kg CFC-11 eq. 7.61E-05 3.35E-06 3.53E-06 8.30E-05
Acidification potential kg SO2 eq. 1.37 0.08 0.02 1.47
Eutrophication potential kg N eq. 0.298 0.010 0.005 0.313
Photochemical Ozone Creation/Smog Potential kg O3 eq. 15.1 1.9 0.2 17.1
Total primary energy consumption MJ (HHV) 2,464 212 143 2,819
Depletion of non-renewable energy resources MJ (HHV) 2,425 211 142 2,778
Use of renewable primary energy MJ (HHV) 39.7 1.1 0.7 41.6
Depletion of non-renewable material resources kg 2,478 1 0 2,479
Use of renewable material resources kg 0.172 0.022 0.006 0.200
Concrete batching water consumption m3 0.142 0.000 0.000 0.142
Concrete washing water consumption m3 0.000 0.000 0.056 0.056
Total water consumption m3 1.99 0.02 0.02 2.03
Hazardous waste kg 0.010 0.000 0.003 0.013
Non-hazardous waste kg 1.33 0.00 19.86 21.20
Carbon emissions from bio fuel combustion kg CO2 eq. 0 0 0 0
Table 10: LCA Results – SB6021 – C50/60, per m3
Environmental Indicator Unit
A1 Raw
Material
Supply
A2
Transport
A3
Manu-
facturing
Total
Global warming potential (climate change) kg CO2 eq. 235 13 9 257
Ozone depletion potential kg CFC-11 eq. 7.59E-05 3.35E-06 3.53E-06 8.28E-05
Acidification potential kg SO2 eq. 1.39 0.08 0.02 1.49
Eutrophication potential kg N eq. 0.302 0.010 0.005 0.318
Photochemical Ozone Creation/Smog Potential kg O3 eq. 15.3 1.9 0.2 17.4
Total primary energy consumption MJ (HHV) 2,487 212 143 2,841
Depletion of non-renewable energy resources MJ (HHV) 2,447 211 142 2,800
Use of renewable primary energy MJ (HHV) 39.8 1.1 0.7 41.6
Depletion of non-renewable material resources kg 2,471 1 0 2,472
Use of renewable material resources kg 0.174 0.022 0.006 0.202
Concrete batching water consumption m3 0.145 0.000 0.000 0.145
Concrete washing water consumption m3 0.000 0.000 0.056 0.056
Total water consumption m3 2.01 0.02 0.02 2.04
Hazardous waste kg 0.010 0.000 0.003 0.013
Non-hazardous waste kg 1.31 0.00 19.86 21.18
Carbon emissions from bio fuel combustion kg CO2 eq. 0 0 0 0

14
Environmental Product Declaration
Table 11: LCA Results – SB4013 – C32/40, per m3
Environmental Indicator Unit
A1 Raw
Material
Supply
A2
Transport
A3
Manu-
facturing
Total
Global warming potential (climate change) kg CO2 eq. 217 13 9 239
Ozone depletion potential kg CFC-11 eq. 7.63E-05 3.23E-06 3.53E-06 8.30E-05
Acidification potential kg SO2 eq. 1.32 0.06 0.02 1.41
Eutrophication potential kg N eq. 0.278 0.010 0.005 0.293
Photochemical Ozone Creation/Smog Potential kg O3 eq. 14.4 1.7 0.2 16.3
Total primary energy consumption MJ (HHV) 2,359 204 143 2,707
Depletion of non-renewable energy resources MJ (HHV) 2,320 203 142 2,666
Use of renewable primary energy MJ (HHV) 38.8 1.1 0.7 40.6
Depletion of non-renewable material resources kg 2,495 1 0 2,495
Use of renewable material resources kg 0.163 0.022 0.006 0.191
Concrete batching water consumption m3 0.141 0.000 0.000 0.141
Concrete washing water consumption m3 0.000 0.000 0.056 0.056
Total water consumption m3 1.93 0.02 0.02 1.97
Hazardous waste kg 0.010 0.000 0.003 0.013
Non-hazardous waste kg 1.35 0.00 19.86 21.21
Carbon emissions from bio fuel combustion kg CO2 eq. 0 0 0 0
Table 12: LCA Results – SB4518 – C36/45, per m3
Environmental Indicator Unit
A1 Raw
Material
Supply
A2
Transport
A3
Manu-
facturing
Total
Global warming potential (climate change) kg CO2 eq. 226 13 9 247
Ozone depletion potential kg CFC-11 eq. 7.62E-05 3.22E-06 3.53E-06 8.29E-05
Acidification potential kg SO2 eq. 1.38 0.06 0.02 1.46
Eutrophication potential kg N eq. 0.289 0.010 0.005 0.304
Photochemical Ozone Creation/Smog Potential kg O3 eq. 15.0 1.7 0.2 16.9
Total primary energy consumption MJ (HHV) 2,419 204 143 2,766
Depletion of non-renewable energy resources MJ (HHV) 2,380 202 142 2,725
Use of renewable primary energy MJ (HHV) 39.2 1.1 0.7 41.0
Depletion of non-renewable material resources kg 2,484 1 0 2,485
Use of renewable material resources kg 0.168 0.022 0.006 0.195
Concrete batching water consumption m3 0.148 0.000 0.000 0.148
Concrete washing water consumption m3 0.000 0.000 0.056 0.056
Total water consumption m3 1.89 0.02 0.02 1.93
Hazardous waste kg 0.010 0.000 0.003 0.013
Non-hazardous waste kg 1.32 0.00 19.86 21.18
Carbon emissions from bio fuel combustion kg CO2 eq. 0 0 0 0


![Environmental Product Declaration - St. Marys Cement EPD (Slag).pdf · This declaration has been prepared in accordance with ISO 14025 [3], ISO 21930 [2], ... EPD Project Report Information](https://img.dokumen.tips/doc/110x75/5ab20d287f8b9ac66c8d2fcf/environmental-product-declaration-st-marys-epd-slagpdfthis-declaration-has.jpg)