Embed Size (px)
Citation preview
Anton Rühling Program Manager
OYU TOLGOI FINANCIAL MODEL: NARRATIVE REPORT
1
Content
Executive Summary ........................................................................................................................ 3
Background ..................................................................................................................................... 5 I. Introduction.............................................................................................................................5 II. History and the Investment Agreement ....................................................................................6 III. Ownership structure ............................................................................................................6 IV. November 2015 status: Expansion into underground mining is restarted ..............................7
Underground development timing assumptions in the 2014 Technical report.........................................8
Methodological Challenges in Modelling Oyu Tolgoi ................................................................... 9 I. The 2014 Technical Report ......................................................................................................9
Further points about the economic analysis in the Technical Report .................................................... 11 II. The Oyu Tolgoi fiscal regime................................................................................................. 12 III. Unravelling the financing .................................................................................................. 13 IV. Commodity prices ............................................................................................................. 15
Results for the Base Case ............................................................................................................. 17 I. Cashflows for project participants ......................................................................................... 17 II. What these results mean........................................................................................................ 19 III. Government revenue profile for the base case ................................................................... 19
Alternative Cases .......................................................................................................................... 22 I. Alternative Case 1: Assuming today’s copper and gold prices ............................................... 22 II. Alternative case 2: Revert to 2014TR prices, but Turquoise Hill takes advantage of the Netherlands Double Tax Agreement ............................................................................................. 25 IV. Alternative Case 3: The impact of the 2% NSR royalty and Management Services Payments 26 V. Alternative case 4: the impact of $6Bn project finance ........................................................... 27
Reconciling results to Turquoise Hill market capitalization ....................................................... 29
Other Analytical Considerations .................................................................................................. 30 I. Other analyses that could be done using this model .............................................................. 30 II. Data that would improve the model: OT LLC accounts ........................................................... 30 III. Using the Open Oil model for government revenue forecasting.......................................... 30
Appendix 1: Key terms from main agreement documents ........................................................ 31 I. Investment Agreement (2009) ............................................................................................... 31 II. Amended and Restated Shareholders Agreement (2011)........................................................ 32 III. Underground Development and Financing Plan (2015) ...................................................... 33
Appendix 2: Calibrating the Model Against the 2014 TR and Other Sources ............................ 35 I. Data sources: ........................................................................................................................ 35

OYU TOLGOI FINANCIAL MODEL: NARRATIVE REPORT
2
II. Comparing results with the 2014TR ....................................................................................... 36 III. Comparison with other reference points ............................................................................. 36 IV. Appendix 2 Full-Cycle versus Point Forward cashflow analysis ......................................... 37
OYU TOLGOI FINANCIAL MODEL: NARRATIVE REPORT
3
Executive Summary OpenOil is developing a series of open source economic models and accompanying analysis for a number of mining and oil and gas projects, as part of an initiative to develop a Public Financial Management paradigm to upstream modelling of extractive industries. This report sets out our analysis of huge Oyu Tolgoi mining project in Mongolia, based entirely on public sources, and mainly on a 2014 Technical Report published by Turquoise Hill Resources. This follows Canadian stock exchange rules and shows positive project economics from 2015 forward as the basis for the mineral reserves disclosed by Turquoise Hill. Our analysis seeks to go further and provide a basis for evaluating the economics of the project across its full lifecycle - from when exploration started - and also if measured from the start of the mine development. This report has benefitted from comments from Turquoise Hill Resources. Comments were also sought from the Government of Mongolia, but none were received. Any errors or omissions, and all views expressed remain the sole responsibility of Open Oil. Our main findings are:
● Using the same assumptions, we get a close match with the forward looking - and strongly positive - project economics set out in the 2014 technical report.
● However, when viewed across the entire life of the project, starting from the development of the open pit operation in 2010 (or more so if from the start of exploration in 2002), the project is much less lucrative - at least in Net Present Value terms - than many commentators might think. But NPV is not the only relevant measure for a project of this size and strategic importance - both to Mongolia and the investors.
● The copper and gold prices used in the 2014 Technical report are materially higher than prices prevailing at the time of writing this report (April 2015). If we use current prices project economics are significantly worsened, though the Underground Mine development remains viable on a forward looking basis.
● The complex financing arrangements agreed between investors and the government have a major impact on the sharing of benefits across the project’s life. For example, because dividends are paid only after repaying debt the government’s 34% equity is unlikely to generate revenues for many years, and may not be worth much, unless commodity prices increase substantially.
● If the 20% withholding taxes on dividends and interest that applied in Mongolia when the Investment Agreement was signed were imposed on OT, these would add some $6.9Bn to the government’s total fiscal revenues over the life of the project. However, under the stabilized terms of the Investment Agreement Turquoise Hill appears able to take advantage of Mongolia’s double tax agreement with the Netherlands and eliminate these withholding taxes, even though Mongolia cancelled the treaty in 2014.
● A critical gap in the publicly available data is the lack of separately disclosed accounts for OT LLC, the Mongolian company which is undertaking the project.

OYU TOLGOI FINANCIAL MODEL: NARRATIVE REPORT
4
● Though no doubt imperfect, our model provides an open-source tool that enables evaluation of a wide range of production, price fiscal and financing scenarios. We hope that stakeholders and interested observers in Mongolia and elsewhere will find it interesting and useful, and Open Oil would be happy to improve the model with input from stakeholders.

OYU TOLGOI FINANCIAL MODEL: NARRATIVE REPORT
5
Background
I. Introduction Oyu Tolgoi1 (OT) is a combined open pit
and underground copper mine in the South Gobi desert 550 km south of Mongolia’s capital UlaanBaatar and 80 km north of the Mongolia/China border. Mineral concentrates are produced at the mine, and transported by rail for processing into finished metal by smelters in China. In 2015 the mine produced 202,200 tonnes of copper and 653,000 ounces of gold generating 2015 revenues of around $1.6 Bn, of which around 60% is from copper and 40% gold, plus small amounts from silver and molybdenum; source.
1 “Turquoise Hill” in the Mongolian language, so named due to the colour of the copper mineralization
Figure 1: Oyu Tolgoi Location
Source: TRQ Annual Information Form. Dec 2014
OYU TOLGOI FINANCIAL MODEL: NARRATIVE REPORT
6
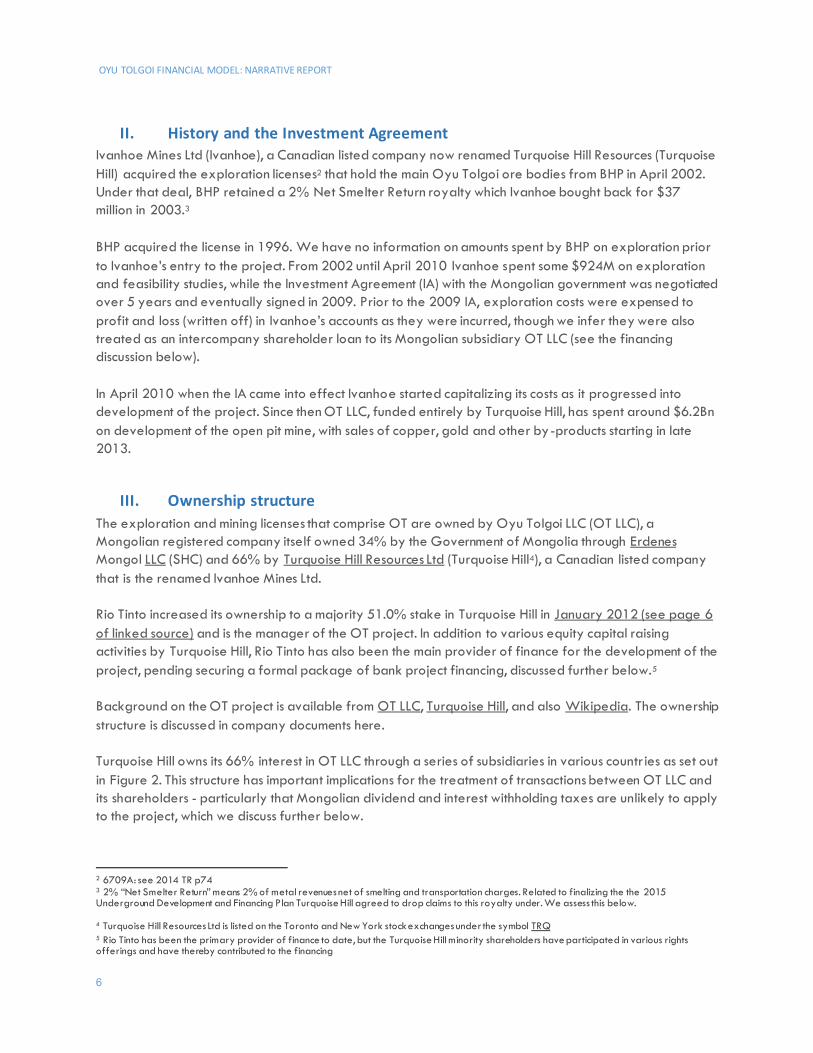
II. History and the Investment Agreement Ivanhoe Mines Ltd (Ivanhoe), a Canadian listed company now renamed Turquoise Hill Resources (Turquoise Hill) acquired the exploration licenses2 that hold the main Oyu Tolgoi ore bodies from BHP in April 2002. Under that deal, BHP retained a 2% Net Smelter Return royalty which Ivanhoe bought back for $37 million in 2003.3 BHP acquired the license in 1996. We have no information on amounts spent by BHP on exploration prior to Ivanhoe’s entry to the project. From 2002 until April 2010 Ivanhoe spent some $924M on exploration and feasibility studies, while the Investment Agreement (IA) with the Mongolian government was negotiated over 5 years and eventually signed in 2009. Prior to the 2009 IA, exploration costs were expensed to profit and loss (written off) in Ivanhoe’s accounts as they were incurred, though we infer they were also treated as an intercompany shareholder loan to its Mongolian subsidiary OT LLC (see the financing discussion below). In April 2010 when the IA came into effect Ivanhoe started capitalizing its costs as it progressed into development of the project. Since then OT LLC, funded entirely by Turquoise Hill, has spent around $6.2Bn on development of the open pit mine, with sales of copper, gold and other by-products starting in late 2013.
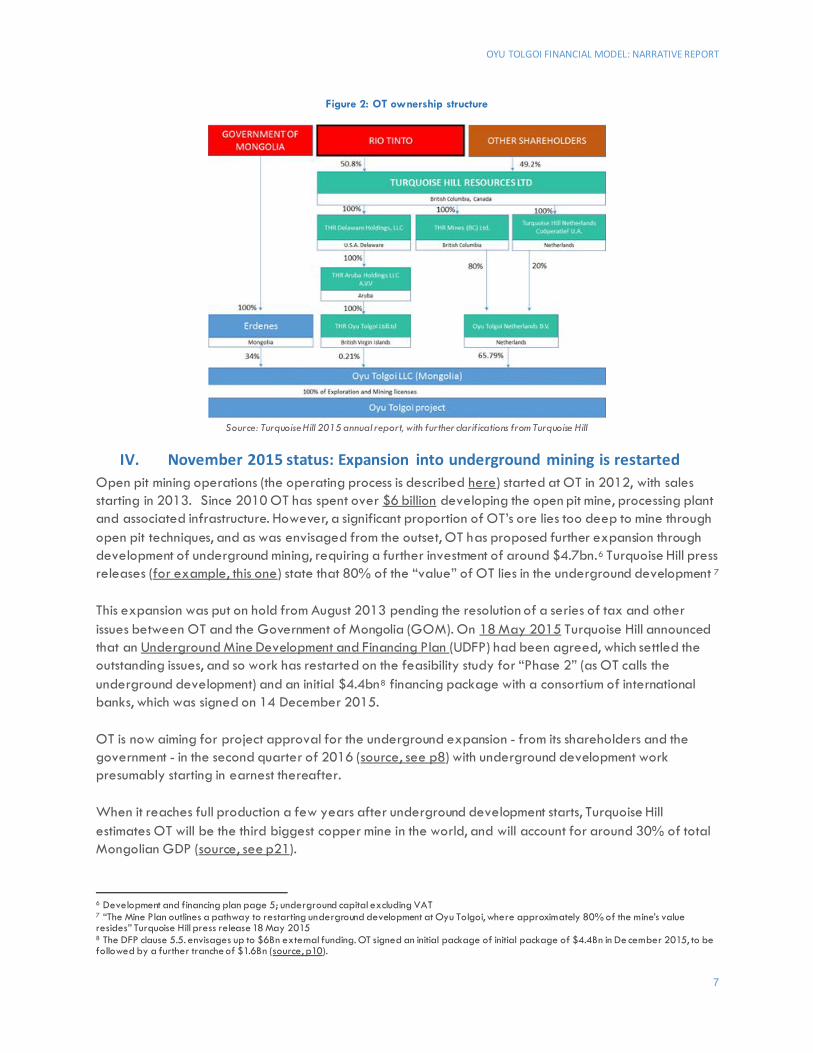
III. Ownership structure The exploration and mining licenses that comprise OT are owned by Oyu Tolgoi LLC (OT LLC), a Mongolian registered company itself owned 34% by the Government of Mongolia through Erdenes Mongol LLC (SHC) and 66% by Turquoise Hill Resources Ltd (Turquoise Hill4), a Canadian listed company that is the renamed Ivanhoe Mines Ltd. Rio Tinto increased its ownership to a majority 51.0% stake in Turquoise Hill in January 2012 (see page 6 of linked source) and is the manager of the OT project. In addition to various equity capital raising activities by Turquoise Hill, Rio Tinto has also been the main provider of finance for the development of the project, pending securing a formal package of bank project financing, discussed further below.5 Background on the OT project is available from OT LLC, Turquoise Hill, and also Wikipedia. The ownership structure is discussed in company documents here. Turquoise Hill owns its 66% interest in OT LLC through a series of subsidiaries in various countries as set out in Figure 2. This structure has important implications for the treatment of transactions between OT LLC and its shareholders - particularly that Mongolian dividend and interest withholding taxes are unlikely to apply to the project, which we discuss further below.
2 6709A: see 2014 TR p74 3 2% “Net Smelter Return” means 2% of metal revenues net of smelting and transportation charges. Related to finalizing the the 2015 Underground Development and Financing Plan Turquoise Hill agreed to drop claims to this royalty under. We assess this below. 4 Turquoise Hill Resources Ltd is listed on the Toronto and New York stock exchanges under the symbol TRQ 5 Rio Tinto has been the primary provider of finance to date, but the Turquoise Hill minority shareholders have participated in various rights offerings and have thereby contributed to the financing
OYU TOLGOI FINANCIAL MODEL: NARRATIVE REPORT
7
Figure 2: OT ownership structure
Source: Turquoise Hill 2015 annual report, with further clarifications from Turquoise Hill
IV. November 2015 status: Expansion into underground mining is restarted Open pit mining operations (the operating process is described here) started at OT in 2012, with sales starting in 2013. Since 2010 OT has spent over $6 billion developing the open pit mine, processing plant and associated infrastructure. However, a significant proportion of OT’s ore lies too deep to mine through open pit techniques, and as was envisaged from the outset, OT has proposed further expansion through development of underground mining, requiring a further investment of around $4.7bn.6 Turquoise Hill press releases (for example, this one) state that 80% of the “value” of OT lies in the underground development 7 This expansion was put on hold from August 2013 pending the resolution of a series of tax and other issues between OT and the Government of Mongolia (GOM). On 18 May 2015 Turquoise Hill announced that an Underground Mine Development and Financing Plan (UDFP) had been agreed, which settled the outstanding issues, and so work has restarted on the feasibility study for “Phase 2” (as OT calls the underground development) and an initial $4.4bn8 financing package with a consortium of international banks, which was signed on 14 December 2015. OT is now aiming for project approval for the underground expansion - from its shareholders and the government - in the second quarter of 2016 (source, see p8) with underground development work presumably starting in earnest thereafter. When it reaches full production a few years after underground development starts, Turquoise Hill estimates OT will be the third biggest copper mine in the world, and will account for around 30% of total Mongolian GDP (source, see p21).
6 Development and financing plan page 5; underground capital excluding VAT 7 “The Mine Plan outlines a pathway to restarting underground development at Oyu Tolgoi, where approximately 80% of the mine’s value resides” Turquoise Hill press release 18 May 2015 8 The DFP clause 5.5. envisages up to $6Bn external funding. OT signed an initial package of initial package of $4.4Bn in De cember 2015, to be followed by a further tranche of $1.6Bn (source, p10).
OYU TOLGOI FINANCIAL MODEL: NARRATIVE REPORT
8
Underground development timing assumptions in the 2014 Technical report The 2014 TR assumes that the development of the underground would start towards the end of 2014, with underground production starting in 2019 (2014 TR p 63 and Table 1.16 p64). However, this has been delayed, as the report itself acknowledges “the 2014 OTTR production estimates assumed early works commenced in Q3 14, this has been delayed”. However, the remainder of the report seems to stick to the original timing regardless. It therefore appears that there may be around a 2 year delay for the underground development relative to the 2014TR. In its 2013 Annual Report, Rio Tinto booked a $4.7bn impairment charge to the carrying value of its investment in Turquoise Hill/OT, “primarily as a result of the delay in developing the underground”.9 In our analysis we have stuck to the timing assumptions reflected in the 2014TR, in order to demonstrate that our model aligns with it. The points we make below about lifecycle economics, and the impact of lower commodity prices are only strengthened if there is also a delay in underground development - keeping other things equal this would materially reduce the NPV of that investment. To model an underground delay scenario we would need to make assumptions to split the aggregated data provided in the 2014TR between underground and open pit operations so that we could delay the latter; currently most of the data is aggregated. In any case Turquoise Hill is due to produce a revised technical report sometime in 2016 consistent with an updated feasibility study that should provide us a new set of data to work with.
9 Rio Tinto Annual report 2013 p138 Note 6. Impairment charges
OYU TOLGOI FINANCIAL MODEL: NARRATIVE REPORT
9
Methodological Challenges in Modelling Oyu Tolgoi OT is a huge, technically and operationally complex project. It produces multiple products, requires total investment for Phases I and II approaching $11 bn and has annual operating costs exceeding $800 million. It is also financially complex due to an intricate set of arrangements between shareholders through which the project has been financed to date, and which have evolved over time, plus there is a huge project finance package now planned. The special fiscal regime agreed for the project comprises multiple mechanisms and invokes complex international tax issues. OpenOil therefore faced a big challenge to build an accessible but realistic and useful model-based analysis using only publicly available sources. Of course, being a high-profile project being managed by publicly traded companies there is a great deal of information available, but it is no easy task to digest it, as we set out below. OT therefore represents an excellent test of the limits of analytical power in the open source modeling concept.
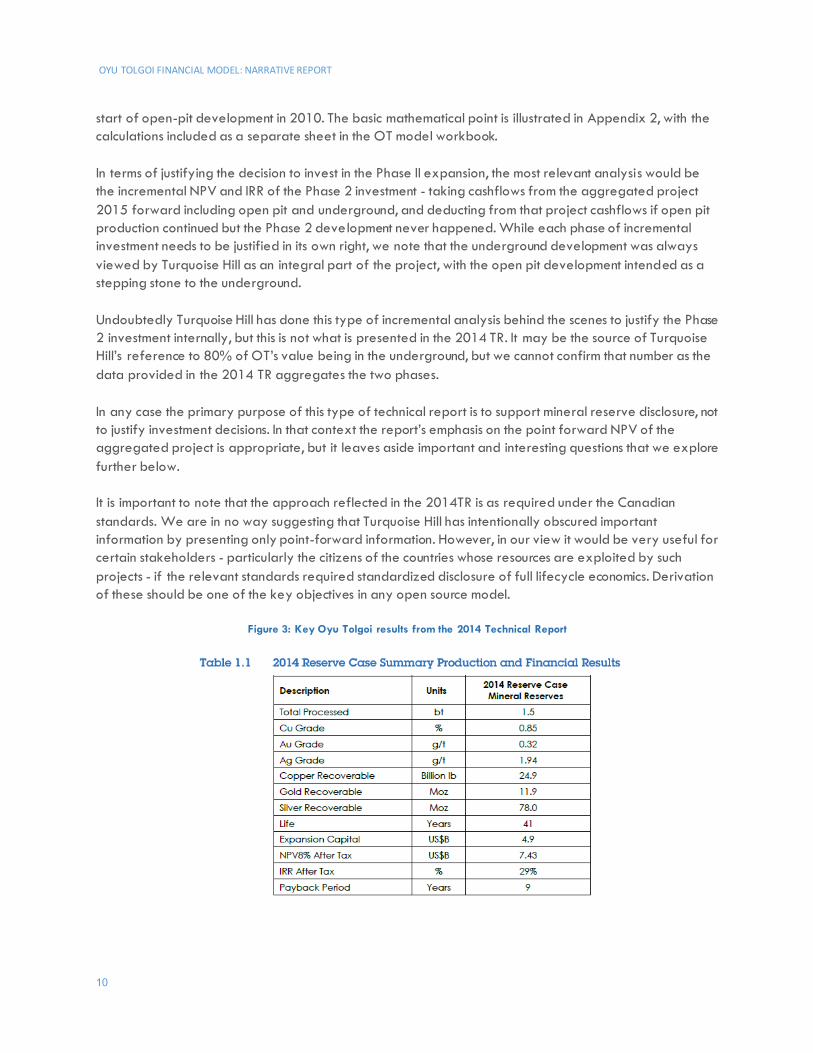
I. The 2014 Technical Report Our principal source for technical, operational and financial data on the project is the October 2014 Technical Report (2014 TR) which Turquoise Hill was required to publish under Canadian stock exchange rules.10 This is available from Turquoise Hill’s website and also independently from the SEDAR service. This 547-page document sets out the case for the underground expansion, and concludes positively about the economic viability of doing so (2014TR p8). It provides details of production, capital and operating costs and other matters necessary for building a model, but some serious detective work is required to extract the relevant data. However, as required under the Canadian stock exchange rules, the 2014 TR only provides numbers and economic analysis on a “point-forward” basis, from 2015 on, meaning that - on its own - it does not present an analysis of the project over its full life cycle; meaning from the start of development, or even further back from the start of exploration. By the end of 2014 OT had already spent over $6bn on developing the open pit and initial work on the underground, and - as we have noted above over $900M before that on exploration. In the 2014TR - as is required for these types of reports - the cashflow analysis ignores these as sunk costs, though they are presumably taken into account in the 2015 forward fiscal calculations.11 Figure 3 reproduces Table 1.1 from the Technical Report. The NPV of $7.4 Bn is on a 2015 forward basis meaning it ignores all of the costs and revenues before then. Critically, this means that the open pit production and revenues from 2015 are reflected (as a positive) in the NPV calculation, but the $6Bn or so of past (sunk) costs are excluded. The IRR of 29% is on the same basis, meaning it is the forward-looking IRR taking into account open pit plus underground production, but measured against only the underground investment. Whilst we must stress that this is the mandatory approach for justifying OT reserves disclosure under Canadian rules (and the rules are similar for other jurisdictions), this does not enable stakeholders to understand what the outcomes are when measured across the project’s entire life-cycle. As we illustrate below results are inevitably less positive if measured from either the start of exploration in 2001, or the 10 National Instrument 43-101 under which Canadian listed companies must provide a technical report supporting mineral resources or reserves disclosure for each mineral property, or when there is a major update. 11 A 2015 forward cashflow should exclude from the analysis any pre-2015 expenditures, but should forecast 2015 onward tax payments taking into account tax depreciation of pre 2015 costs and carried forward tax losses as at the start of 2015 etc.
OYU TOLGOI FINANCIAL MODEL: NARRATIVE REPORT
10
start of open-pit development in 2010. The basic mathematical point is illustrated in Appendix 2, with the calculations included as a separate sheet in the OT model workbook. In terms of justifying the decision to invest in the Phase II expansion, the most relevant analysis would be the incremental NPV and IRR of the Phase 2 investment - taking cashflows from the aggregated project 2015 forward including open pit and underground, and deducting from that project cashflows if open pit production continued but the Phase 2 development never happened. While each phase of incremental investment needs to be justified in its own right, we note that the underground development was always viewed by Turquoise Hill as an integral part of the project, with the open pit development intended as a stepping stone to the underground. Undoubtedly Turquoise Hill has done this type of incremental analysis behind the scenes to justify the Phase 2 investment internally, but this is not what is presented in the 2014 TR. It may be the source of Turquoise Hill’s reference to 80% of OT’s value being in the underground, but we cannot confirm that number as the data provided in the 2014 TR aggregates the two phases. In any case the primary purpose of this type of technical report is to support mineral reserve disclosure, not to justify investment decisions. In that context the report’s emphasis on the point forward NPV of the aggregated project is appropriate, but it leaves aside important and interesting questions that we explore further below. It is important to note that the approach reflected in the 2014TR is as required under the Canadian standards. We are in no way suggesting that Turquoise Hill has intentionally obscured important information by presenting only point-forward information. However, in our view it would be very useful for certain stakeholders - particularly the citizens of the countries whose resources are exploited by such projects - if the relevant standards required standardized disclosure of full lifecycle economics. Derivation of these should be one of the key objectives in any open source model.
Figure 3: Key Oyu Tolgoi results from the 2014 Technical Report
OYU TOLGOI FINANCIAL MODEL: NARRATIVE REPORT
11
Further points about the economic analysis in the Technical Report
1. As is required under Canadian rules 43-101, it is presented in real terms, ignoring the impact of inflation. For comprehensive fiscal evaluation including the impact of financing calculations, nominal terms calculations are required.
2. The financing structure is not modelled. The analysis focuses on real-terms pre-finance project economics and not government revenues or government share evaluation. While this again is normal for this kind of technical report, it provides limited insight into government revenues or the sharing of project benefits across its lifecycle. These are strongly impacted by the financing structure, as we demonstrate below.
3. Though again standard practice, the technical report evaluates OT as a project, and not clearly differentiated outcomes for investors and government. Certain elements of the fiscal/commercial structure are taken into account in the “pre-tax” results. For example, non-refunded VAT paid to the government is included as a project cost. The 2% NSR royalty paid to Turquoise Hill ($1.6Bn real terms in 2014TR Table 22.5; though this is now eliminated) is also treated as a project cost, but is not reflected as income to Turquoise Hill - because the analysis is only of pre-finance cashflows from the point of view of the project. Likewise the Management Services Payment ($2.9bn real terms per Table 22.5) is treated as a project cost despite some portion of this arguably being in effect a distribution of profit to Rio Tinto/Turquoise Hill. On the government side, because financing is not modelled, neither is potential dividend withholding tax, nor dividends the government might receive from Erdenes’ participation.
Thus the analysis in the 2014TR provides insight into the forward looking economic viability of the project but does not provide definitive insight into:
1. What the true economics of the project are before any of the fiscal regime sharing mechanisms are reflected
2. What the government will collect from all direct fiscal mechanisms across the full life of the project including VAT, income tax, dividend and interest withholding tax and state participation
3. What the international investors true net outcomes from the project might be taking into account the project cashflows, but also the financing structure.
4. What this says about sharing of the value of the project across its entire life
We have therefore aimed to build an analysis of the entire lifecycle of the project and the outlook for government revenues, by reconstructing the project’s exploration history and the Phase 1 development, and then integrating these with the forward looking data provided in the 2014 TR. It is no easy task, but we believe this enables some useful additional perspectives not possible from reading the 2014 TR alone. We also make several important observations about the likely path of Government revenues from the project and aim to shed light on a couple of remaining controversies. Our approach has been:
1. To reconstruct the initial exploration investments made by Turquoise Hill (originally Ivanhoe Mines Ltd) from 2001 to 2010. Something over $900 million was spent on exploration between 2001
OYU TOLGOI FINANCIAL MODEL: NARRATIVE REPORT
12
and 2011 and this has a material impact on future government revenues. Data was mainly from annual reports. See Appendix I.
2. To reconstruct the initial investment and operations under Phase I - the open pit development.
Investment of $6.2 Bn was made from 2010 through 2014 and mineral sales started in the last quarter of 2013. Data for this phase was also mainly obtained from annual reports.
3. To extract data necessary to emulate the 2015-forward forecast reflected in the 2014 TR. Though
the 2014 TR provides lots of detailed data, deciphering it is not a trivial exercise due to the aggregated way some of the data are presented. We did some de-construction work as described in Appendix I.
4. We have assumed the same timing for the underground development as reflected in the 2014 TR. As discussed above, this may have slipped by something like two years while the government and investors sorted out disputes.
5. We have attempted to reconstruct the history of the reported balance of shareholder loans, and
modelled the impact these and potential future project financing will have on fiscal revenues and investor outcomes. This has been our biggest challenge and where we have had to make most assumptions. However, as we show below, without evaluating the financing it is not possible to accurately project government revenues or investor outcomes from the project. We see particularly profound implications for the value of the Mongolian government’s 34% equity share in the project. For example, if mineral prices remain as low as they are at the end of 2015 there is a chance that Mongolia will never receive any dividends from this equity.
II. The Oyu Tolgoi fiscal regime Against the backdrop of Mongolia’s generally applicable rules at the time, the main document that sets out fiscal terms applicable to OT is the 2009 Investment Agreement, signed after a protracted 5 year negotiation. Key terms relevant for modelling are summarized in Appendix 1. However, to fully understand the project - particularly the financing - one must also read the 2009 Shareholders Agreement. This was renegotiated resulting in the Amended and Restated Shareholders Agreement signed in June 2011. Further, several important fiscal regime issues have been renegotiated, or at least clarified in the 18 May 2015 Underground Mine Development and Financing Plan. The Investment Agreement was necessary because the generally applicable Mongolian legal and fiscal framework at that time was incomplete or unclear - there is nothing unusual in itself that a special legal and fiscal regime was required for such a huge project. However, we infer that a significant part of the negotiation likely revolved around the Mongolian government’s requirement for 34% state equity. In our view, the complex financing structure reflected in the IA and other agreements is intended to mitigate the impact of the government equity on investor economics - otherwise it would just not be affordable for the private investors to provide 100% of the money but only receive 66% of the dividends. However, as we
OYU TOLGOI FINANCIAL MODEL: NARRATIVE REPORT
13
show below, as a result of these arrangements and lower commodity prices, the government equity may not end up earning as much for the government as might be expected.
III. Unravelling the financing From these agreements and our reading of Turquoise Hill and Rio Tinto financial statements our interpretation of how the financing has unfolded and our modelling approach is as follows. Caveat: the publicly available data does not permit a definitive reconstruction of the history of intercompany balances between OT LLC and its parent. OT LLC accounts are consolidated into Turquoise Hill, but no separate OT LLC accounts are published (that we can find).
1. Exploration period: Ivanhoe (now Turquoise Hill) funded initial exploration and evaluation of OT principally through Ivanhoe raising capital through issuing shares (equity financing) at various points. From annual reports Ivanhoe spent some $946M on OT exploration between 2001 and 2011 ($831 million 2001 through 2009). Under the 2009 SHA these amounts (or some agreed portion thereof) formed part of the Existing Shareholder Loans. Thus the equity that Ivanhoe raised was advanced to OT LLC as debt. Under the 2009 SHA this loan would attract interest at 9.9% plus US CPI, however the 2011 ARSHA states that interest will only accrue from the Effective Date, so it is not clear to us whether interest was accrued on the advances from Turquoise Hill to OT LLC prior to the IA - but we expect it is likely Turquoise Hill would have sought this. The IA (16.19) states an indicative balance for Existing Shareholder Loans, including accrued interest, of $1Bn on the effective date of the IA; which by definition includes pre-IA costs. We find that if we assume that 80% of the exploration amounts are treated as having been funded by shareholder debt and accumulated, plus interest at 9.9% plus CPI, we reach a balance as at the end of 2009 of $961 million, therefore - for the moment - that is what we have assumed.12
2. Phase I development: From the signing of the Investment Agreement Ivanhoe (now Turquoise Hill) provided funding to the project through a combination of Preference Shares13 carrying a fixed dividend of 9.9% plus CPI; shareholder loans at the same interest rate and (possibly) some equity. We do not know the exact breakdown because we do not have OT LLC accounts. However, given that preference shares were considered equity under the IA, we read that Ivanhoe would, at least initially, be entitled to provide virtually all funding as (in effect) interest bearing preference shares or shareholder debt, with minimal non-interest bearing equity. Therefore we might assume close to 100% interest bearing debt financing during the initial development period. Given that the interest rate is the same for (1) Existing Shareholder Debt (2) Preference shares; and (3) Shareholder loans we have modelled these as a single aggregated loan. However, we have assumed that the proportion of interest that corresponds to the preference shares is not tax deductible.
3. Renegotiation of the SHA: The shareholders agreement was renegotiated in 2011 resulting in reduction of the interest rate on shareholder loans and Erdenes carry, and the (anticipation of)
12 This appears contradictory to the 2011 ARSHA stating that interest on Existing Shareholder Loans is accrued only from the Effective Date. An alternative explanation is that interest was not accrued before the IA Effective Date, but costs were higher than we have inferred from annual reports. The bottom line is that the accumulated balance was around $1bn around the end of 2009, and definitely attracts inte rest thereafter. 13 A special type of equity which has debt-like features. It attracts a fixed percentage dividend (which is therefore much the same as interest) and the payment of the interest and principal ranks ahead of dividends or repayment of ordinary capital. A general de finition is here.
OYU TOLGOI FINANCIAL MODEL: NARRATIVE REPORT
14
conversion of the preference shares into common equity. We infer this happened because international interest rates had fallen significantly, though we note that the original 9.9% plus CPI was higher than Rio Tinto’s average corporate level cost of borrowing at the time of around 5.6%.14 Hence some unstated portion of the preference shares was shifted from being interest bearing debt to non interest bearing equity sometime in or after 2011. We assume $2.00Bn was transferred in 2011 in order to match our model to the closing balance of shareholder loans reported as at the end of 2014 being $7.8Bn including accrued interest of $1.5bn (source, p180). However, there is some contradictory information in 2015 quarterly reports as set out below (Box 1). Our matching to the end 2014 loan balance is therefore pretty speculative. If OT LLC accounts were made public this would be made transparent. The Government of Mongolia will no doubt be carefully tracking these balances - their recognition of the material impact these financing arrangements will have on government revenues over the life of the project was no doubt part of the motivation for the ARSHA renegotiation in 2011.
4. Rio Tinto/Ivanhoe arrangements: There is a complex set of funding arrangements between Ivanhoe (now Turquoise Hill) and Rio Tinto under which Rio bought shares in Turquoise Hill (51%)15 and provided funding to Ivanhoe so that Ivanhoe could fund OT. See also the Rio Tinto guarantee charge below. We do not attempt to unravel these, as the main transactions that impact government revenues from OT are those between Turquoise Hill and OT/Erdenes. In short, we consider Turquoise Hill as the investor, and put aside what happens between Turquoise Hill’s shareholders.
5. Project financing package: On December 14th Turquoise Hill announced the signing of a $4.4Bn package of project finance. Further, a December 2015 Scotiabank Mining Conference presentation states that project finance will total $6.0 bn; $4.2 in 2015/2016 and a further $1.8Bn in 2016/17. These drawdowns are to be used initially to repay existing shareholder debt, and can then be re-drawn as needed to fund the underground development. Rio Tinto and Turquoise hill are providing a guarantee for this debt, and charging a total guarantee fee between them of 2.5%, though this is reduced by the amount Rio Tinto holds on its balance sheet pending its use to meet Phase II development costs. This is all very complicated, so we have assumed the following:
a. $4.4Bn is drawn down in 2016. The net proceeds after $0.3Bn of fees (paid to the banks and transactions advisers) is $4.1Bn. The balance of this drawdown remaining after meeting 2016 financing requirements is used to repay shareholder loans.
b. 80% of negative OT cashflows after payment of project finance interest and principal during the remainder of the Phase II development through 2021 are redrawn from shareholder debt. This means around $4.0bn of re-draw against shareholder loans at our Base Case using 2014TR mineral prices.16
14 Per Rio Tinto 2009 Annual report page 229; finance costs of $1058M, on net debt of $18,861. 9.9% is higher than the rate for any material (<$100M) individual Rio Tinto corporate bond set out in note 22, page 171 15 A non-dilution agreement is referenced which puts in place mechanisms that mean Rio Tinto can never be forced below 51% of Turquois e Hill. 16 In the model, cell S289 in the CALCULATIONS sheet
OYU TOLGOI FINANCIAL MODEL: NARRATIVE REPORT
15
c. The project finance attracts an all-in cost (interest plus fees, including the Rio Tinto guarantee fee) of LIBOR + 6% as stated in the the Dec 14 press release. We have not separately modelled the guarantee fee, and therefore it is not included as an income source for Rio Tinto.
d. The project finance at LIBOR + 6% is therefore not much cheaper than the shareholder loan at LIBOR + 6.5%. We note that LIBOR + 6% is still somewhat higher than the roughly LIBOR + 4% that Rio Tinto paid on average in 2014 (see ShareholderLoanBalances sheet in the OT workbook). In the first instance, because of the Guarantee, we might expect a similar interest rate to Rio Tinto’s own balance sheet borrowing. The higher overall interest rate for OT likely includes additional fees including MIGA17 guarantees, and potentially higher interest rates for OT project risks not covered by the guarantee.18
e. For the first 5 years (2016-2021) Interest and fees on the project finance debt is paid, with principal repayments in equal annual instalments over 8 years starting in 2021. The total loan life is therefore around 13 years (5 + 8).
f. In our base case, we assume only the $4.4bn project finance package. We show below how results would change if an additional $1.6Bn of finance is taken out, as anticipated by the Scotiabank presentation, and the UDFP. In short, it will not materially change results.
Box 1: Evolution of shareholder loan balances in 2015
In our OT model we have endeavoured to match the intercompany loan balances between Turquoise Hill and OT, and between Turquoise Hill and Erdenes as reported in the Turquoise Hill Annual report. We have managed to get pretty close to the end 2014 balances. In our model we assume that the investment in the underground started in 2015, so this leads to a mismatch with the actual end 2015 reported balances, but we reconcile with these in Appendix 2. However as set out in the “ShareholderLoanBalances” sheet in our OT model there are some differences we can not explain between the 2014 year end balances reported by Turquoise Hill and those reported at the end of 31 March 2015. The reported shareholder loan balance at 31 march 2015 has decreased by some $800 mill ion, even while taking into account the reported payments made of 105 million principal and 45 million interest (total 150 million). We are not sure what could account for this, except some adjustment to balances - which may have occurred in connection with the negotiation of the UDFP signed in May 2015. Alternatively some of the shareholder loan might have been converted into equity. To reflect this change, and so we do not overstate the loan balance and the interest, we have included a $900 million downwards adjustment to 2014 loan balances to approximately match the aggregate shareholders loan balance as at the end of 2015. Further, we assume this does not result in a corresponding adjustment to the Erdenes carry balance; which would occur for example if there were a further conversion of preference share debt to equity.
IV. Commodity prices Our Base Case uses the same 2015 forward prices as the 2014TR, being $3.08/lb for copper and $1,304/oz for gold, constant in real terms.19 These are the first set of results presented below.
17 Multilateral Investment Guarantee Agency - political risk insurance provided by the World Bank 18 For example if it is a “completion” guarantee, it only applies until the underground development is physically complete, and thereafter the lenders only have recourse to OT LLC cashflows. In this case we should expect a higher interest rate than Rio Tinto corporate debt. 19 For silver - as it is not material - we assume the same relationship between gold and silver prices as reflected in the 2014TR
OYU TOLGOI FINANCIAL MODEL: NARRATIVE REPORT
16
However, current and expected prices per the futures markets are significantly lower and have been declining. As of the time of writing in April 2016 Copper futures are showing a price around $2.24/lb through December 2016; some 30% lower than the 2014TR. Gold futures are at or below $1,250/oz, some 4% lower than the 2014TR assumption. We have therefore loaded these “Futures” prices into the model, selectable from cell D14 on the DASHBOARD sheet. The third selectable alternative “WB” is an January 2016 forecast by the World Bank, which expects copper prices in 2020 of $2.62/lb and $1,041/oz for gold. The model also allows the User to manually input a “UserEntry” price into the 2015 column of the INPUTS sheet.

OYU TOLGOI FINANCIAL MODEL: NARRATIVE REPORT
17
Results for the Base Case Our BaseCase aims to closely align with the 2014 TR, and assumes the following:
1. Exploration costs from 200120 until 2011 as per Ivanhoe/Turquoise Hill annual reports for exploration on OT which was expensed to profit and loss
2. Actual production, prices and costs to the end of 2015. 2016 operating costs are assumed to be $800 as stated in the 2015 annual report. We have included the 2015 underground development costs anticipated in the 2014TR, even though this has been delayed.
3. 2016 forward Production and costs consistent with the 2014TR. Average annual operating costs per the 2014TR are consistent with the $800M expected for 2016.
4. Copper and gold prices per the 2014TR
5. Financing structure as described above
6. Inflation of 2% that applies to both commodity prices and costs, starting from 2016.21
7. The fiscal regime as described in the analysis of project agreements above. This assumes:
a. The 2% NSR royalty is paid to Turquoise Hill. We assume it is a net inflow for Turquoise Hill (i.e. in effect an allocation of profit) that reduces taxable income for OT LLC. We then show the impact of this being eliminated.
b. 20% withholding tax applies to both interest and dividends paid to foreign providers of debt or equity capital (but not debt principal repayments), as well as the Management Services Payment and the NSR royalty.
c. We assume that interest on shareholder loans is repaid first per 15.1 of the ARSHA.
I. Cashflows for project participants Key tables and charts presented below for each case are saved as values in the CASES sheet in the Excel workbook, together with instructions how to recreate them live in the model. Note that there are very minor differences between the saved results and current live model results, but the conclusions remain the same.
20 Our model actually starts from 2005, but we include 2001-2005 exploration total in 2005 21 We should arguably inflate prices and costs from the 2014TR by 2 years to establish a base $2016, but for simplicity have not done so.
OYU TOLGOI FINANCIAL MODEL: NARRATIVE REPORT
18
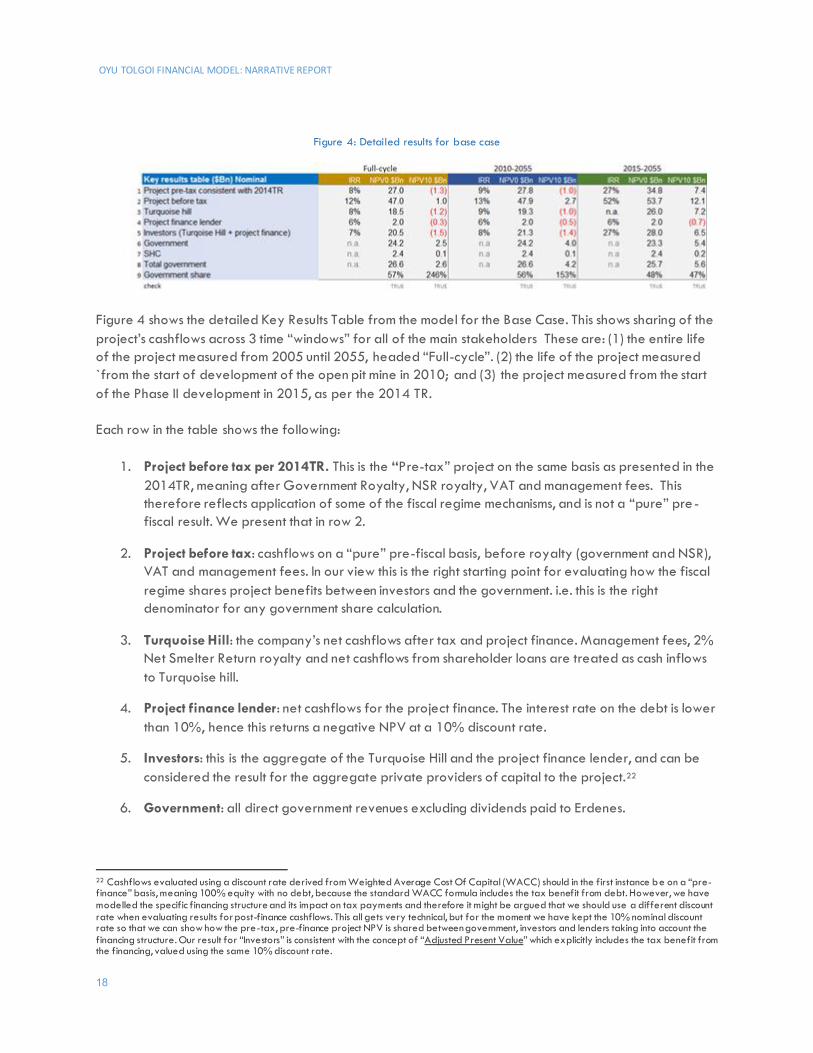
Figure 4: Detailed results for base case
Figure 4 shows the detailed Key Results Table from the model for the Base Case. This shows sharing of the project’s cashflows across 3 time “windows” for all of the main stakeholders These are: (1) the entire life of the project measured from 2005 until 2055, headed “Full-cycle”. (2) the life of the project measured `from the start of development of the open pit mine in 2010; and (3) the project measured from the start of the Phase II development in 2015, as per the 2014 TR. Each row in the table shows the following:
1. Project before tax per 2014TR. This is the “Pre-tax” project on the same basis as presented in the 2014TR, meaning after Government Royalty, NSR royalty, VAT and management fees. This therefore reflects application of some of the fiscal regime mechanisms, and is not a “pure” pre -fiscal result. We present that in row 2.
2. Project before tax: cashflows on a “pure” pre-fiscal basis, before royalty (government and NSR), VAT and management fees. In our view this is the right starting point for evaluating how the fiscal regime shares project benefits between investors and the government. i.e. this is the right denominator for any government share calculation.
3. Turquoise Hill: the company’s net cashflows after tax and project finance. Management fees, 2% Net Smelter Return royalty and net cashflows from shareholder loans are treated as cash inflows to Turquoise hill.
4. Project finance lender: net cashflows for the project finance. The interest rate on the debt is lower than 10%, hence this returns a negative NPV at a 10% discount rate.
5. Investors: this is the aggregate of the Turquoise Hill and the project finance lender, and can be considered the result for the aggregate private providers of capital to the project.22
6. Government: all direct government revenues excluding dividends paid to Erdenes.
22 Cashflows evaluated using a discount rate derived from Weighted Average Cost Of Capital (WACC) should in the first instance be on a “pre-finance” basis, meaning 100% equity with no debt, because the standard WACC formula includes the tax benefit from debt. However, we have modelled the specific financing structure and its impact on tax payments and therefore it might be argued that we should use a different discount rate when evaluating results for post-finance cashflows. This all gets very technical, but for the moment we have kept the 10% nominal discount rate so that we can show how the pre-tax, pre-finance project NPV is shared between government, investors and lenders taking into account the financing structure. Our result for “Investors” is consistent with the concept of “Adjusted Present Value” which explicitly includes the tax benefit from the financing, valued using the same 10% discount rate.
OYU TOLGOI FINANCIAL MODEL: NARRATIVE REPORT
19
7. SHC: Dividends paid to Erdenes MGL LLC on the carried 34%. (SHC is the acronym used for this company in the Shareholders Agreement)
8. Total government: Government + SHC
9. Government share: Total government as a proportion of the pre-fiscal project at row 2. The IMF would call this the “Average Effective Tax Rate” or AETR.
10. An important reconciliation: the “Check” row at the bottom of the table tests whether Government plus project finance plus Turquoise Hill equals Project before tax.
II. What these results mean 1. For the 2015 forward project cashflows, our model closely matches the 2014TR. We show how
we have reconciled our results to the 2014TR and other markers in Appendix 2.
2. On a 2015 forward basis project economics are strongly positive, as described in the 2014TR. Undiscounted pre-tax cashflows project cashflows are $53.7Bn.The project has a pre-tax NPV10 of $12.1Bn and Turquoise Hill’s NPV10 is $7.2 Bn.23
3. However, the picture is less rosy when results are measured across the project’s full lifecycle - at least on an NPV basis. Measured from the start of development in 2010 OT still has strongly positive undiscounted net cashflows of $47.9bn, but this results in a pre-tax NPV10 of only $2.7Bn, and an IRR of 13%. Turquoise Hill has a negative NPV10. NPV results are even more negative if measured “Full-cycle” from the start of Ivanhoe’s exploration in 2002 - a function of over $900 million of exploration costs and the long period before development started. Thus when evaluated over its entire life cycle - at least on an NPV basis - OT appears somewhat less of a bonanza than some observers might think. Put another way, if Turquoise Hill was to evaluate this investment from 2010 all over again using these numbers at the 10% nominal discount rate - they might not want to go ahead with the development. However, perhaps NPV is not the right (or at least the only) metric for such decisions (Box 2).
4. Government receives direct fiscal revenues of $26.6Bn over 2010-2055, equating to 56% of the undiscounted project net cashflows. On an NPV10 basis the government is capturing 153%. This means the fiscal regime is capturing a majority of the undiscounted value of the project, and more than 100% of the economic value expressed as NPV.
III. Government revenue profile for the base case Figure 5 shows the profile of government revenues over the life of the project under the Base Case.
23 Note that there is no valid IRR; hence “n.a.” because the annual net cashflows switch from positive to negative multiple times. This is a well known limitation of the IRR metric. NPV is not affected by these issues and is the most relevant metric for this kind of analysis.
OYU TOLGOI FINANCIAL MODEL: NARRATIVE REPORT
20
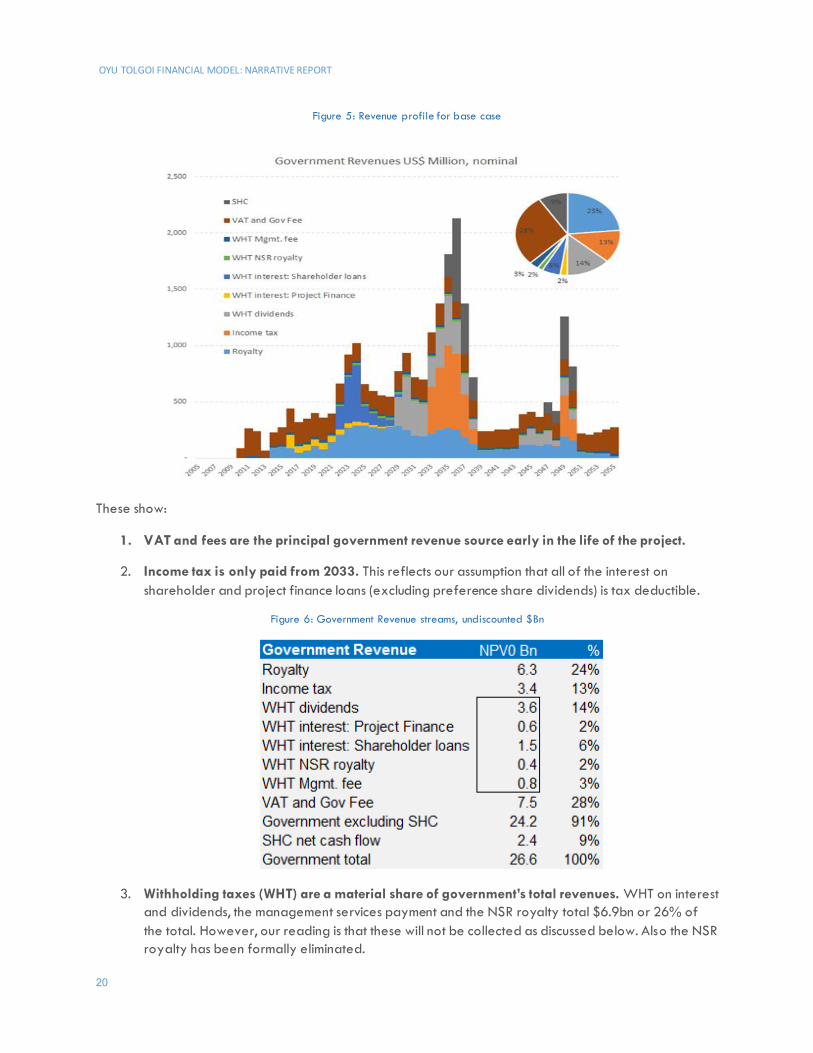
Figure 5: Revenue profile for base case
These show:
1. VAT and fees are the principal government revenue source early in the life of the project.
2. Income tax is only paid from 2033. This reflects our assumption that all of the interest on shareholder and project finance loans (excluding preference share dividends) is tax deductible.
Figure 6: Government Revenue streams, undiscounted $Bn
3. Withholding taxes (WHT) are a material share of government’s total revenues. WHT on interest and dividends, the management services payment and the NSR royalty total $6.9bn or 26% of the total. However, our reading is that these will not be collected as discussed below. Also the NSR royalty has been formally eliminated.
OYU TOLGOI FINANCIAL MODEL: NARRATIVE REPORT
21
4. SHC (Erdenes) only starts to receive dividends in 2035: it takes until then for the shareholder debt and the SHC carry to be repaid, including the accumulated interest. The government’s 34% equity in the project does not generate much revenue. The NPV10 of the dividends (2010-2055) is around $200 million.
Box 2: Is NPV an appropriate metric for a project like OT?
Net Present Value remains one of the main evaluation metrics that mining, Oil and Gas and indeed most other investors use when making investment decisions. However, there are a number of theoretical and practical issues that mean it should not be the only decision-making variable. Without getting too technical, problems with NPV are:
1. Setting the discount rate. We have used the same 10%nominal/8% real terms discount rate as Rio Tinto /1, but there are theoretical (or perhaps rather “theological”) debates about how to do this in practice. The 8% real terms rate reflected in the 2014TR is presumably consistent with what Rio Tinto would use for internal decision making, but we do not know. If it came to the crunch perhaps an investor would accept a lower required rate of return/discount rate.
2. In theory NPV should be applied to probability weighted outcomes; thus project specific risk should be reflected in the cashflows and not the discount rate. In practice cashflows are often not probability weighted, or only imperfectly so, and risk margins - often subjective - are added to discount rates, potentially undermining the validity and comparability of results. The 2014TR - and our model - reflect a single “success case” only, so the resulting NPV ignores potential downside and upside. Sophisticated investors use probabilistic analysis to build risk into the cashflows. We do some sensitivity analysis of changes to certain assumptions, but this is not the same as full probability weighted analysis.
3. NPV ignores managerial flexibility. Consistent with the 2014TR, we have evaluated a single future “path” for the project. In reality Turquoise Hill and the government have many options to react to changing circumstances to either take advantage of opportunities (for example, increased reserves from ongoing exploration) or mitigate the impact of negative events (such as low commodity prices). Unless explicitly built in, NPV ignores these and therefore arguably understates the true value of any real -world business opportunity.
The 2014TR touches on this issue in Figure 24.1. More advanced valuation techniques aim to address this through “decision-tree analysis” (which is really just a way of doing probability weighted cashflows for NPV) or “real options” analysis, which is very complicated, and often relies on heroic assumptions that may not hold in the real world.
4. Big companies like Rio Tinto need big projects that produce big cashflows - they need cash to pay dividends and invest in future projects. This might be as important a consideration for them as NPV, and OT certainly produces those, as long as the investor can find $11 Bn or so to get it up and running...
The bottom line is that we should not overemphasize NPV results, but they are relevant, and it is what Turquoise Hill themselves have used in the 2014 TR. As Winston Churchill (might have) said “NPV is the worst valuation methodology - except for all the others” 1/ A 10% nominal discount rate is a pretty common rule of thumb for mining and oil & gas companies. Turquoise Hill uses 8% real discount rate in the 2014TR - that equates to roughly 10% nominal, assuming 2% inflation. On page 131 of its 2014 annual report Rio Tinto states (for impairment testing - in which NPV is required to be used for accounting purposes) “post-tax cashflows expressed in real terms have been estimated until the end of the life of mine plan and discounted using an asset specific post-tax real discount rate of 8.3 per cent (2013: 8.7 per cent).” This would argue for a roughly 10.3% nominal discount rate (2013 10.7%) which would further reduce our NPVs.
OYU TOLGOI FINANCIAL MODEL: NARRATIVE REPORT
22
Alternative Cases
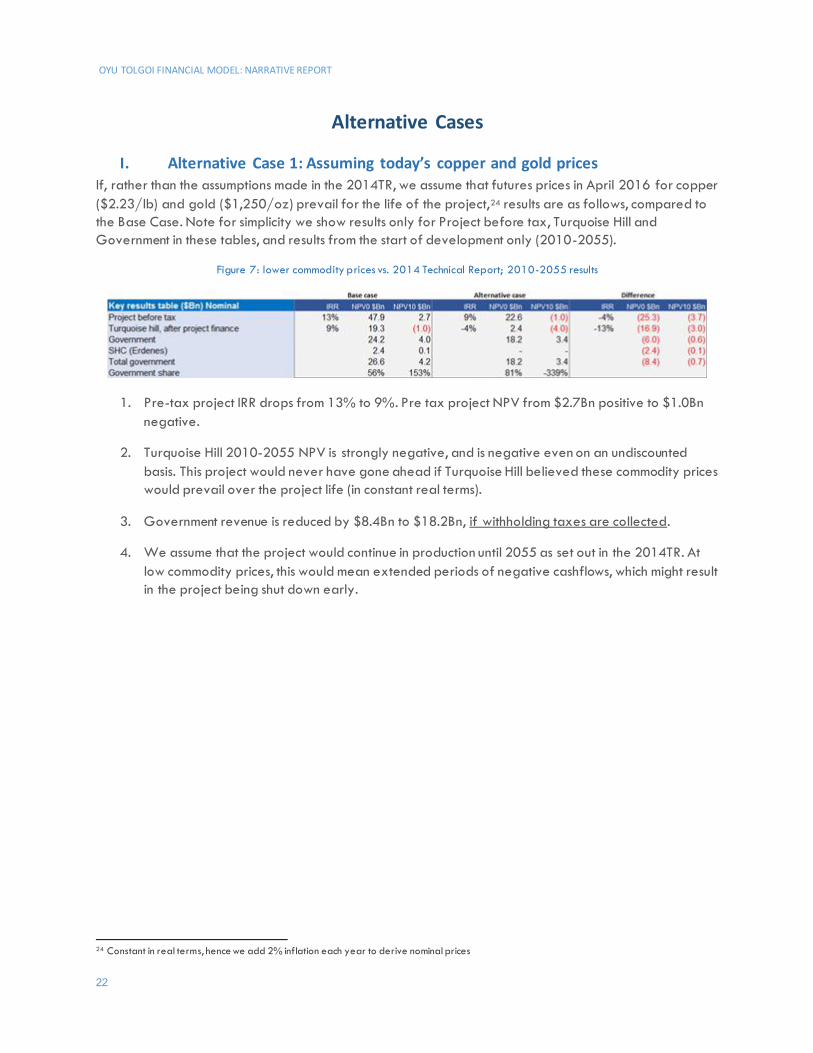
I. Alternative Case 1: Assuming today’s copper and gold prices If, rather than the assumptions made in the 2014TR, we assume that futures prices in April 2016 for copper ($2.23/lb) and gold ($1,250/oz) prevail for the life of the project,24 results are as follows, compared to the Base Case. Note for simplicity we show results only for Project before tax, Turquoise Hill and Government in these tables, and results from the start of development only (2010-2055).
Figure 7: lower commodity prices vs. 2014 Technical Report; 2010-2055 results
1. Pre-tax project IRR drops from 13% to 9%. Pre tax project NPV from $2.7Bn positive to $1.0Bn negative.
2. Turquoise Hill 2010-2055 NPV is strongly negative, and is negative even on an undiscounted basis. This project would never have gone ahead if Turquoise Hill believed these commodity prices would prevail over the project life (in constant real terms).
3. Government revenue is reduced by $8.4Bn to $18.2Bn, if withholding taxes are collected.
4. We assume that the project would continue in production until 2055 as set out in the 2014TR. At low commodity prices, this would mean extended periods of negative cashflows, which might result in the project being shut down early.
24 Constant in real terms, hence we add 2% inflation each year to derive nominal prices
OYU TOLGOI FINANCIAL MODEL: NARRATIVE REPORT
23
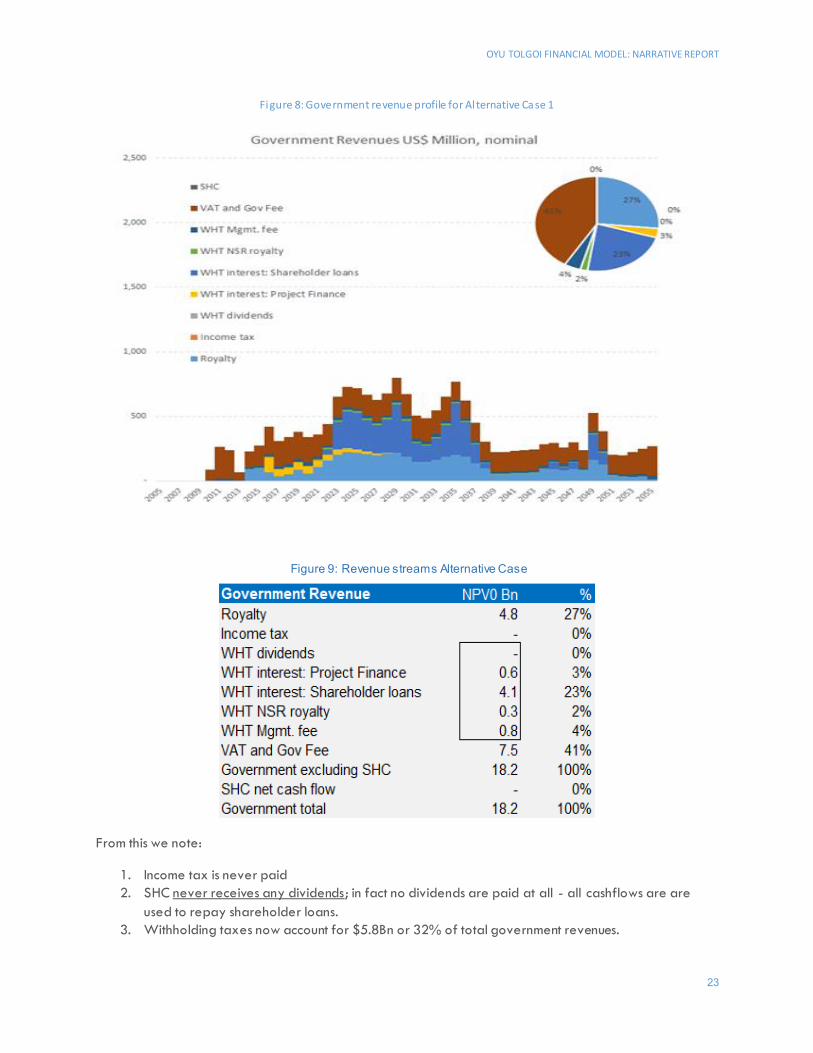
Figure 8: Government revenue profile for Al ternative Case 1
From this we note:
1. Income tax is never paid 2. SHC never receives any dividends; in fact no dividends are paid at all - all cashflows are are
used to repay shareholder loans. 3. Withholding taxes now account for $5.8Bn or 32% of total government revenues.
Figure 9: Revenue streams Alternative Case
OYU TOLGOI FINANCIAL MODEL: NARRATIVE REPORT
24
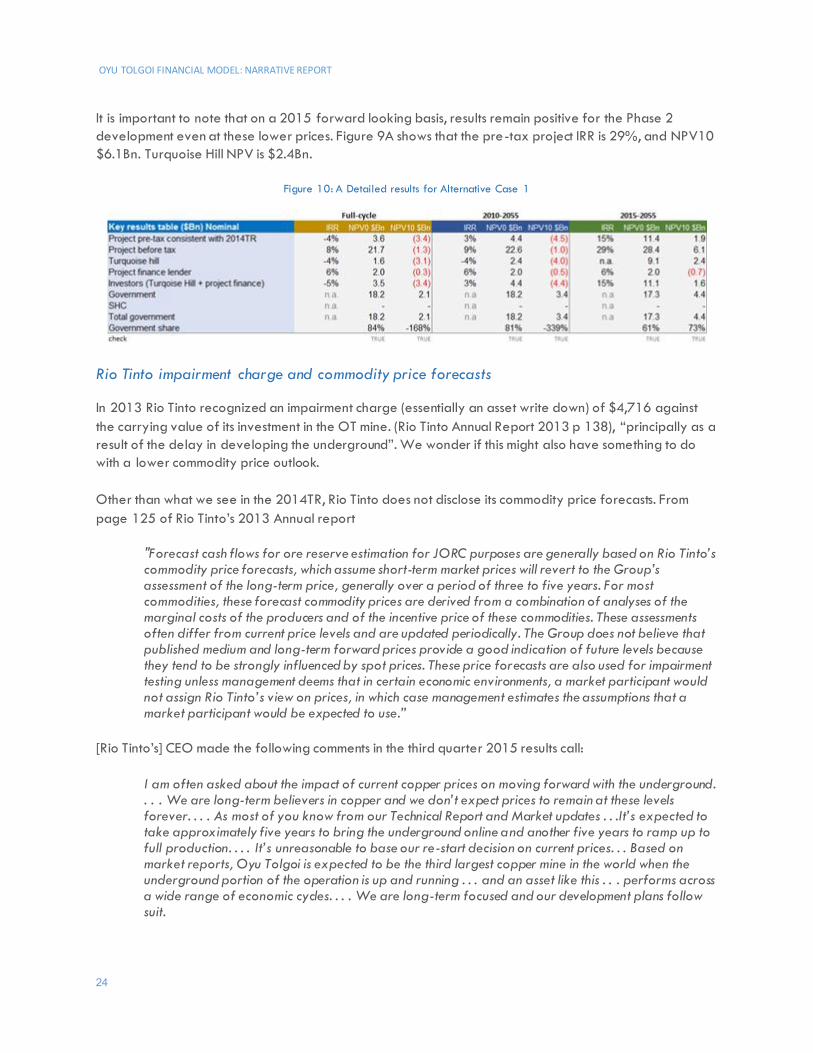
It is important to note that on a 2015 forward looking basis, results remain positive for the Phase 2 development even at these lower prices. Figure 9A shows that the pre-tax project IRR is 29%, and NPV10 $6.1Bn. Turquoise Hill NPV is $2.4Bn.
Figure 10: A Detailed results for Alternative Case 1
Rio Tinto impairment charge and commodity price forecasts
In 2013 Rio Tinto recognized an impairment charge (essentially an asset write down) of $4,716 against the carrying value of its investment in the OT mine. (Rio Tinto Annual Report 2013 p 138), “principally as a result of the delay in developing the underground”. We wonder if this might also have something to do with a lower commodity price outlook. Other than what we see in the 2014TR, Rio Tinto does not disclose its commodity price forecasts. From page 125 of Rio Tinto’s 2013 Annual report
"Forecast cash flows for ore reserve estimation for JORC purposes are generally based on Rio Tinto’s commodity price forecasts, which assume short-term market prices will revert to the Group’s assessment of the long-term price, generally over a period of three to five years. For most commodities, these forecast commodity prices are derived from a combination of analyses of the marginal costs of the producers and of the incentive price of these commodities. These assessments often differ from current price levels and are updated periodically. The Group does not believe that published medium and long-term forward prices provide a good indication of future levels because they tend to be strongly influenced by spot prices. These price forecasts are also used for impairment testing unless management deems that in certain economic environments, a market participant would not assign Rio Tinto’s view on prices, in which case management estimates the assumptions that a market participant would be expected to use.”
[Rio Tinto’s] CEO made the following comments in the third quarter 2015 results call:
I am often asked about the impact of current copper prices on moving forward with the underground. . . . We are long-term believers in copper and we don’t expect prices to remain at these levels forever. . . . As most of you know from our Technical Report and Market updates . . .It’s expected to take approximately five years to bring the underground online and another five years to ramp up to full production. . . . It’s unreasonable to base our re-start decision on current prices. . . Based on market reports, Oyu Tolgoi is expected to be the third largest copper mine in the world when the underground portion of the operation is up and running . . . and an asset like this . . . performs across a wide range of economic cycles. . . . We are long-term focused and our development plans follow suit.

OYU TOLGOI FINANCIAL MODEL: NARRATIVE REPORT
25
We presume Rio Tinto’s long term price outlook - at least at that time - is reflected in the 2014TR assumptions. Thus Rio Tinto might argue that assuming current futures prices will remain constant in real terms is overly pessimistic. The model user can readily input their own copper and gold price forecasts and run their own analysis.
II. Alternative case 2: Revert to 2014TR prices, but Turquoise Hill takes advantage of the Netherlands Double Tax Agreement
Our document index sets out our sources.
The Investment Agreement specifies in 2.2. that Mongolian withholding taxes apply to OT, but so do any double tax agreements in force at the date of the agreement, and all of these terms are stabilized.
Our understanding is that under Mongolian law 20% withholding tax would apply to interest, dividends, NSR royalty and the management services payment, and this is what our base case and other results presented thus far have assumed.
However, Turquoise Hill owns the majority of its interest in OT LLC through a Netherlands registered company (Figure 2). At the time of signing the IA, Mongolia had a Double Tax Agreement (DTA) with the Netherlands under which the WHT rate on interest, dividends and royalties was zero.
After first seeking renegotiation, Mongolia cancelled its DTA with Netherlands effective January 2014. However, Rio Tinto is publicly quoted as stating that the DTA cancellation does not affect OT because of the stabilization provisions in the IA - they get to act as if the Netherlands treaty were still in effect. In this case Turquoise Hill will not be subject to WHT on payments from its Mongolian subsidiary.
Our inference is that at the time of signing the IA, the Government of Mongolia expected it would receive withholding taxes from OT. We imagine there have been some rather tense conversations between GOM and Turquoise Hill about this issue including during the UDFP negotiations, but we see nothing in that agreement that clarifies the DTA issue, so we presume the IA and the stabilized double tax agreement arrangements stand.
In this alternative case we have reverted to the 2014TR copper and gold price assumptions, and then set withholding taxes to zero on shareholder debt, NSR royalty and Management Services Payment. We further assume that the Project Finance Lender is able to take advantage of the same arrangement.25
Impact on Cashflows
Figure 11: results for Alternative Case 2
25 We have made the simplifying assumption that Dividend Withholding Tax (DWT) applies to all distributions of project net cashf lows after tax and debt repayments, without modeling full P&L and Balance sheet. In practice, distributions that represented the return of capital rather than distributions of profits might not attract the withholding tax. Thus we might be overstating the DWT somewhat in our base cas e. Modeling DWT is inherently tricky as it depends on future OT LLC dividend policy.
OYU TOLGOI FINANCIAL MODEL: NARRATIVE REPORT
26
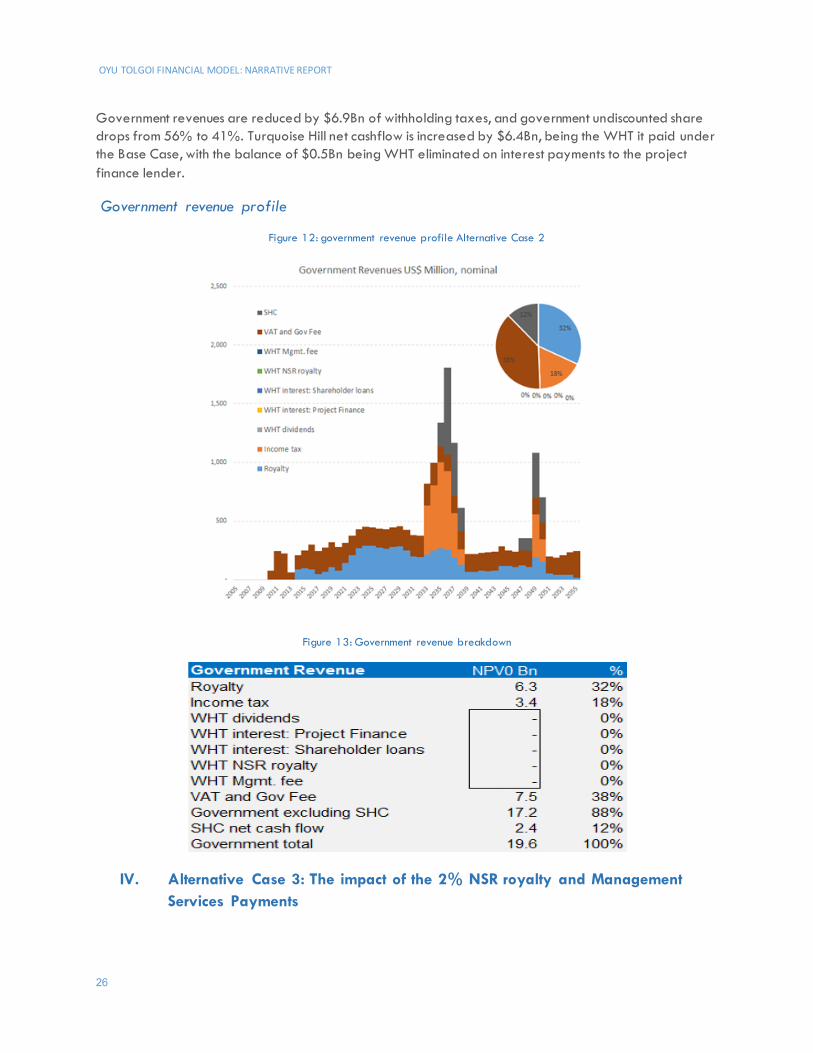
Government revenues are reduced by $6.9Bn of withholding taxes, and government undiscounted share drops from 56% to 41%. Turquoise Hill net cashflow is increased by $6.4Bn, being the WHT it paid under the Base Case, with the balance of $0.5Bn being WHT eliminated on interest payments to the project finance lender.
Government revenue profile
Figure 12: government revenue profile Alternative Case 2
Figure 13: Government revenue breakdown
IV. Alternative Case 3: The impact of the 2% NSR royalty and Management Services Payments
OYU TOLGOI FINANCIAL MODEL: NARRATIVE REPORT
27
Figure 14: NSR and MSP payments
Ivanhoe bought back a 2% NSR royalty from BHP for £37 million. Under the IA Turquoise Hill (or Rio Tinto) will charge a Management Services Payment (MSP) of 3% of total costs before production and 6% thereafter, except that the Phase II development costs will only be charged 3 %, as clarified in the UDFP.
In our Base Case, the NSR accounts for $2.2Bn and the MSP around $3.6Bn (both undiscounted nominal) between 2010 and 2055. We have assumed that Turquoise Hill/Rio Tinto incur no costs for either mechanism that are not already reflected in the OT project costs - in other words that these represent in effect an allocation of profit to Turquoise Hill/Rio Tinto. Whilst that might be a reasonable assumption for the NSR royalty (though we note that Ivanhoe paid $37 million for it in the first place), it may not be for the MSP - some of the cost of Rio Tinto’s management team outside Mongolia may be intended to be covered by this payment. We are in effect assuming it is pure profit, and further that it is not subject to tax in the recipient's hands.
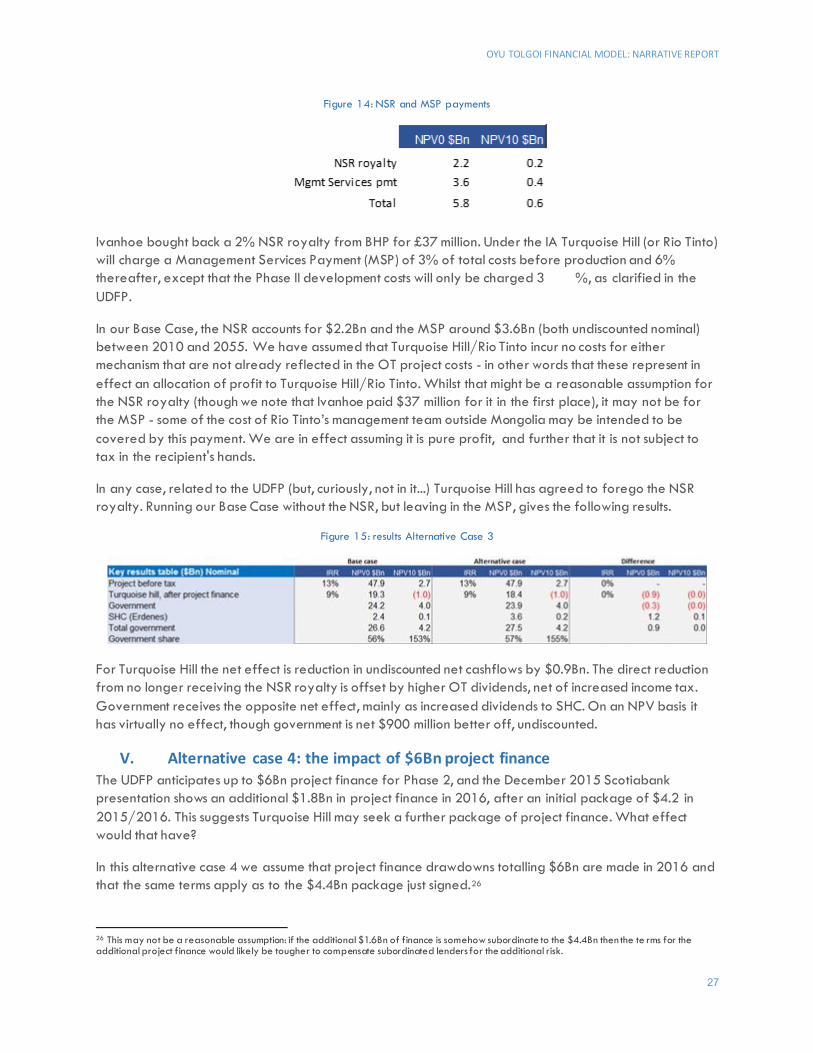
In any case, related to the UDFP (but, curiously, not in it...) Turquoise Hill has agreed to forego the NSR royalty. Running our Base Case without the NSR, but leaving in the MSP, gives the following results.
Figure 15: results Alternative Case 3
For Turquoise Hill the net effect is reduction in undiscounted net cashflows by $0.9Bn. The direct reduction from no longer receiving the NSR royalty is offset by higher OT dividends, net of increased income tax. Government receives the opposite net effect, mainly as increased dividends to SHC. On an NPV basis it has virtually no effect, though government is net $900 million better off, undiscounted.
V. Alternative case 4: the impact of $6Bn project finance The UDFP anticipates up to $6Bn project finance for Phase 2, and the December 2015 Scotiabank presentation shows an additional $1.8Bn in project finance in 2016, after an initial package of $4.2 in 2015/2016. This suggests Turquoise Hill may seek a further package of project finance. What effect would that have?
In this alternative case 4 we assume that project finance drawdowns totalling $6Bn are made in 2016 and that the same terms apply as to the $4.4Bn package just signed.26
26 This may not be a reasonable assumption: if the additional $1.6Bn of finance is somehow subordinate to the $4.4Bn then the te rms for the additional project finance would likely be tougher to compensate subordinated lenders for the additional risk.
OYU TOLGOI FINANCIAL MODEL: NARRATIVE REPORT
28
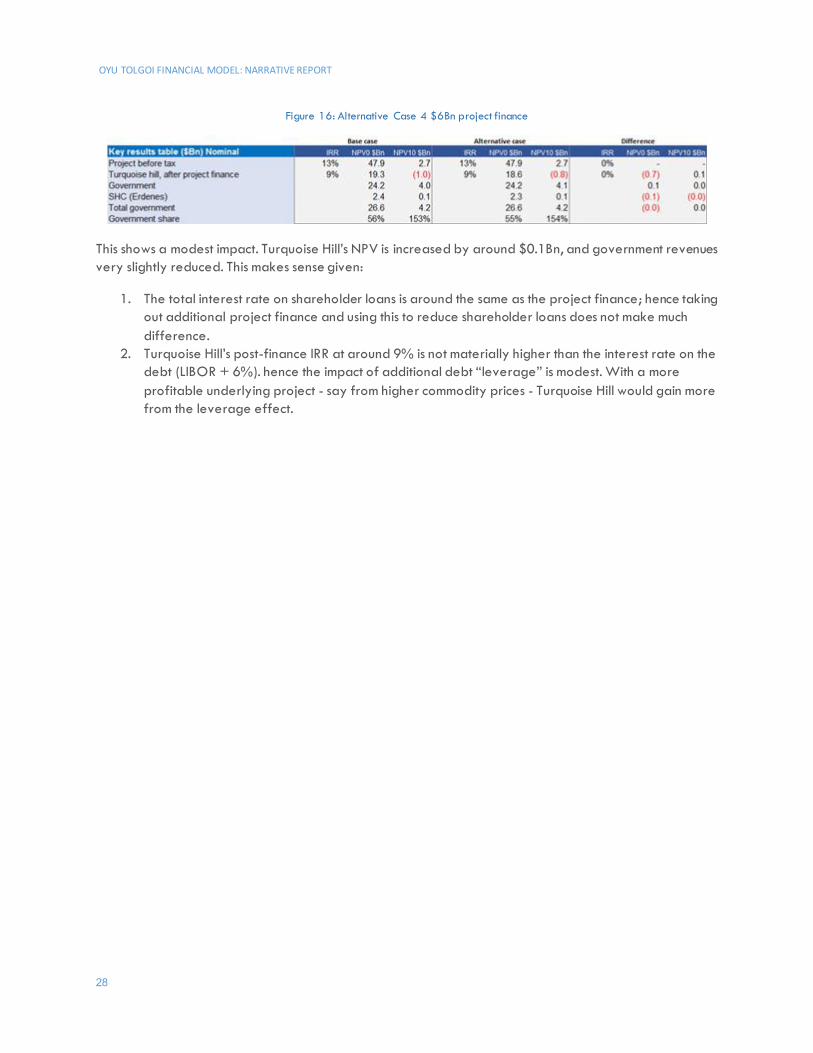
Figure 16: Alternative Case 4 $6Bn project finance
This shows a modest impact. Turquoise Hill’s NPV is increased by around $0.1Bn, and government revenues very slightly reduced. This makes sense given:
1. The total interest rate on shareholder loans is around the same as the project finance; hence taking out additional project finance and using this to reduce shareholder loans does not make much difference.
2. Turquoise Hill’s post-finance IRR at around 9% is not materially higher than the interest rate on the debt (LIBOR + 6%). hence the impact of additional debt “leverage” is modest. With a more profitable underlying project - say from higher commodity prices - Turquoise Hill would gain more from the leverage effect.
OYU TOLGOI FINANCIAL MODEL: NARRATIVE REPORT
29
Reconciling results to Turquoise Hill market capitalization On 31st December 2015 Turquoise Hill market capitalization was around US$5.0Bn, with implied Enterprise Value of US$5.96 bn. On 20 September 2016 this had increased to Market cap $5.9 and enterprise value of $6.41bn.27 How does this compare to our results? Our 2015 forward NPVs for Turquoise Hill are:
● Base case $7.2Bn (Figure 4). Eliminating withholding taxes would increase this to $8.6Bn, but this would also reduce - potentially significantly - if the underground development delay was taken into account.
● With current futures prices (Alternative case 1): $2.4Bn (Figure 9.A) ● With current futures prices and no withholding taxes: $3.6Bn.
Thus our results bookend the current market capitalization/enterprise value.28 The market cap is consistent with pricing in the underground delay, but also assuming that prices will recover above current levels Our model could be a useful tool for stock analysts; either as a direct source, or as a reality check for their own models.
27 Market capitalization is the Enterprise Value (the value of the underlying business) plus cash on hand, minus liabilities. Thus at 31 Dec 2015 Enterprise Value of $5.96bn = $5.1bn Market Cap + $1.34Bn cash minus $0.445Bn liabilities. At 20 September 2016 Enterprise value of $6.45bn = $5.96bn market cap + $1.48Bn cash minus $4.50bn liabilities, plus $3.5bn of project finance proceeds deposited with Rio Tinto. 28 Strictly speaking we should compare 2016 forward NPV to 2016 market capitalizations, but we have stuck to 2015 forward for consistency with the rest of our analysis which aligns with the 2014 Technical report. Our base case NPV for Turquoise Hill of $7.2bn for 2015 forward, becomes $7.8bn from 2016 forward, thus demonstrating broadly the same equivalence.
OYU TOLGOI FINANCIAL MODEL: NARRATIVE REPORT
30
Other Analytical Considerations
I. Other analyses that could be done using this model Now that this model is set up it can be used to evaluate any number of project and fiscal regime scenarios. These could include:
1. Alternative production or cost changes; including delaying the start of Phase 2.
2. Commodity price changes.
3. Financing structure changes - for example: the interest rate on shareholder loans
4. Project financing: what are the results without project financing. What if the terms were different? How does project financing impact government versus Turquoise Hill? (Note that these might require an assumption that Turquoise hill would be willing to provide the Phase II funding in the absence of project finance, which is by no means clear.)
5. Discount rate assumptions.
II. Data that would improve the model: OT LLC accounts
The critical gap in our information is the lack of OT LLC accounts. This would show us the evolution of the intercompany financing arrangements between Turquoise Hill and OT LLC.
III. Using the Open Oil model for government revenue forecasting
The Government of Mongolia no doubt has its own OT models, but they may find our model useful as a cross-check; particularly of the significant impact the project financing structure has on outcomes for the government.
OYU TOLGOI FINANCIAL MODEL: NARRATIVE REPORT
31
Appendix 1: Key terms from main agreement documents The key terms of each document include:
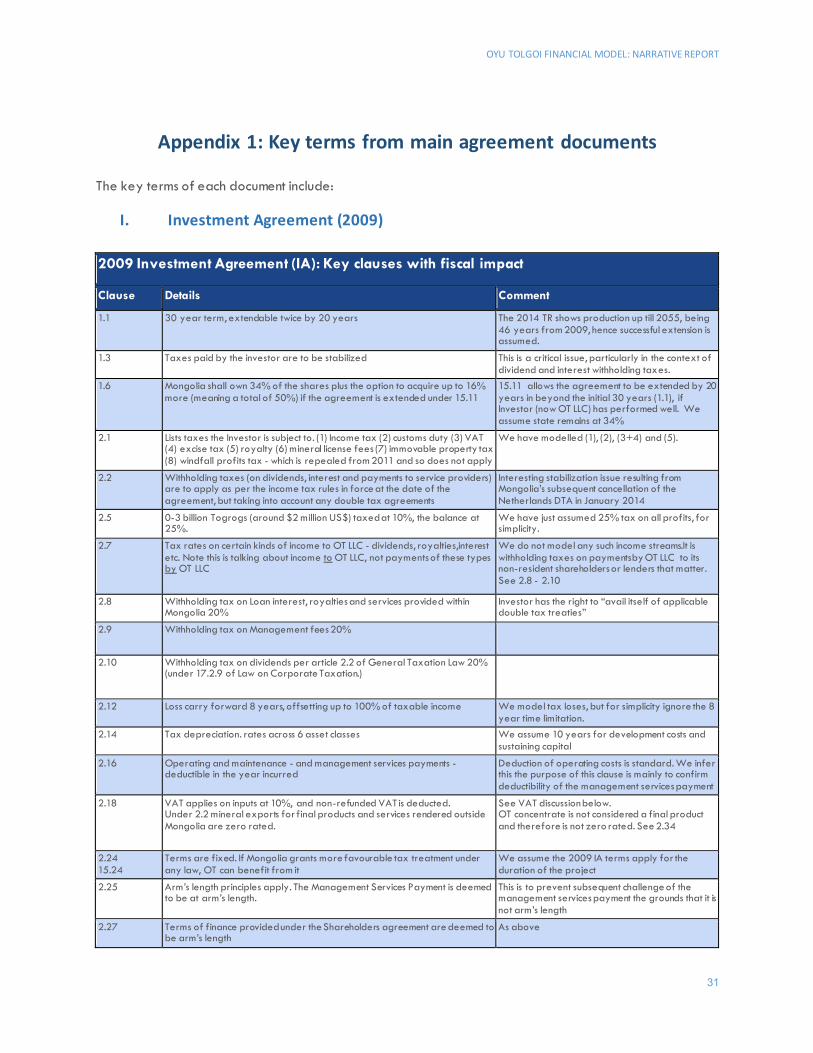
I. Investment Agreement (2009) 2009 Investment Agreement (IA): Key clauses with fiscal impact
Clause Details Comment 1.1 30 year term, extendable twice by 20 years The 2014 TR shows production up till 2055, being
46 years from 2009, hence successful extension is assumed.
1.3 Taxes paid by the investor are to be stabilized This is a critical issue, particularly in the context of dividend and interest withholding taxes.
1.6 Mongolia shall own 34% of the shares plus the option to acquire up to 16% more (meaning a total of 50%) if the agreement is extended under 15.11
15.11 allows the agreement to be extended by 20 years in beyond the initial 30 years (1.1), if Investor (now OT LLC) has performed well. We assume state remains at 34%
2.1 Lists taxes the Investor is subject to. (1) Income tax (2) customs duty (3) VAT (4) excise tax (5) royalty (6) mineral license fees (7) immovable property tax (8) windfall profits tax - which is repealed from 2011 and so does not apply
We have modelled (1), (2), (3+4) and (5).
2.2 Withholding taxes (on dividends, interest and payments to service providers) are to apply as per the income tax rules in force at the date of the agreement, but taking into account any double tax agreements
Interesting stabilization issue resulting from Mongolia’s subsequent cancellation of the Netherlands DTA in January 2014
2.5 0-3 billion Togrogs (around $2 million US$) taxed at 10%, the balance at 25%.
We have just assumed 25% tax on all profits, for simplicity.
2.7 Tax rates on certain kinds of income to OT LLC - dividends, royalties,interest etc. Note this is talking about income to OT LLC, not payments of these types by OT LLC
We do not model any such income streams.It is withholding taxes on paymentsby OT LLC to its non-resident shareholders or lenders that matter. See 2.8 - 2.10
2.8 Withholding tax on Loan interest, royalties and services provided within Mongolia 20%
Investor has the right to “avail itself of applicable double tax treaties”
2.9 Withholding tax on Management fees 20%
2.10 Withholding tax on dividends per article 2.2 of General Taxation Law 20% (under 17.2.9 of Law on Corporate Taxation.)
2.12 Loss carry forward 8 years, offsetting up to 100% of taxable income We model tax loses, but for simplicity ignore the 8 year time limitation.
2.14 Tax depreciation. rates across 6 asset classes We assume 10 years for development costs and sustaining capital
2.16 Operating and maintenance - and management services payments - deductible in the year incurred
Deduction of operating costs is standard. We infer this the purpose of this clause is mainly to confirm deductibility of the management services payment
2.18 VAT applies on inputs at 10%, and non-refunded VAT is deducted. Under 2.2 mineral exports for final products and services rendered outside Mongolia are zero rated.
See VAT discussion below. OT concentrate is not considered a final product and therefore is not zero rated. See 2.34
2.24 15.24
Terms are fixed. If Mongolia grants more favourable tax treatment under any law, OT can benefit from it
We assume the 2009 IA terms apply for the duration of the project
2.25 Arm’s length principles apply. The Management Services Payment is deemed to be at arm’s length.
This is to prevent subsequent challenge of the management services payment the grounds that it is not arm’s length
2.27 Terms of finance provided under the Shareholders agreement are deemed to be arm’s length
As above
OYU TOLGOI FINANCIAL MODEL: NARRATIVE REPORT
32
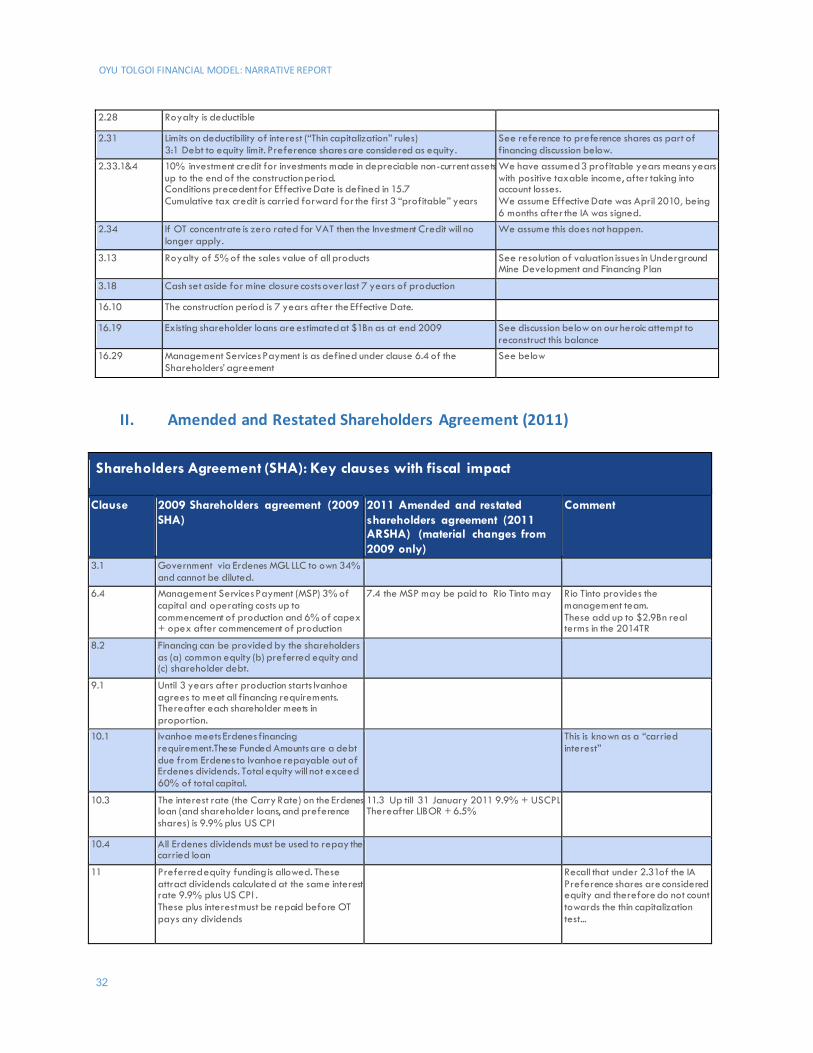
2.28 Royalty is deductible 2.31 Limits on deductibility of interest (“Thin capitalization” rules)
3:1 Debt to equity limit. Preference shares are considered as equity. See reference to preference shares as part of financing discussion below.
2.33.1&4 10% investment credit for investments made in depreciable non-current assets up to the end of the construction period. Conditions precedent for Effective Date is defined in 15.7 Cumulative tax credit is carried forward for the first 3 “profitable” years
We have assumed 3 profitable years means years with positive taxable income, after taking into account losses. We assume Effective Date was April 2010, being 6 months after the IA was signed.
2.34 If OT concentrate is zero rated for VAT then the Investment Credit will no longer apply.
We assume this does not happen.
3.13 Royalty of 5% of the sales value of all products See resolution of valuation issues in Underground Mine Development and Financing Plan
3.18 Cash set aside for mine closure costs over last 7 years of production 16.10 The construction period is 7 years after the Effective Date. 16.19 Existing shareholder loans are estimated at $1Bn as at end 2009 See discussion below on our heroic attempt to
reconstruct this balance 16.29 Management Services Payment is as defined under clause 6.4 of the
Shareholders’ agreement See below
II. Amended and Restated Shareholders Agreement (2011)
Shareholders Agreement (SHA): Key clauses with fiscal impact
Clause 2009 Shareholders agreement (2009 SHA)
2011 Amended and restated shareholders agreement (2011 ARSHA) (material changes from 2009 only)
Comment
3.1 Government via Erdenes MGL LLC to own 34% and cannot be diluted.
6.4 Management Services Payment (MSP) 3% of capital and operating costs up to commencement of production and 6% of capex + opex after commencement of production
7.4 the MSP may be paid to Rio Tinto may Rio Tinto provides the management team. These add up to $2.9Bn real terms in the 2014TR
8.2 Financing can be provided by the shareholders as (a) common equity (b) preferred equity and (c) shareholder debt.
9.1 Until 3 years after production starts Ivanhoe agrees to meet all financing requirements. Thereafter each shareholder meets in proportion.
10.1 Ivanhoe meets Erdenes financing requirement.These Funded Amounts are a debt due from Erdenes to Ivanhoe repayable out of Erdenes dividends. Total equity will not exceed 60% of total capital.
This is known as a “carried interest”
10.3 The interest rate (the Carry Rate) on the Erdenes loan (and shareholder loans, and preference shares) is 9.9% plus US CPI
11.3 Up till 31 January 2011 9.9% + USCPI. Thereafter LIBOR + 6.5%
10.4 All Erdenes dividends must be used to repay the carried loan
11 Preferred equity funding is allowed. These attract dividends calculated at the same interest rate 9.9% plus US CPI . These plus interest must be repaid before OT pays any dividends
Recall that under 2.31of the IA Preference shares are considered equity and therefore do not count towards the thin capitalization test...
OYU TOLGOI FINANCIAL MODEL: NARRATIVE REPORT
33
12 IVN can provide debt finance as “Shareholder Debt”. The interest rate is 9.9% plus US CPI.
12. Preference shares are converted to ordinary shares as at 31 January 2011.
Thus this portion of funding stops accruing interest on 31 January 2011
12.2 Shareholder debt must29 be repaid before any dividends can be paid Interest on shareholder debt 9.9% + CPI
Original interest rate up till 31 January 2011, 6.5% + LIBOR, no CPI adjustment thereafter
This Erdenes will not receive any dividends until the carry and preference shares and shareholder loans are all repaid. See below
14.1.d Dividends cannot be paid until (1) the existing shareholder loan (2) interest on shareholder debt and the carried loan (3) principal on shareholder debt and carried loan (4) interest and principal on preference shares
14.2 Erdenes dividends are used first to repay the carried loan
24 definitions Existing Shareholder loans means all funds advanced by Ivanhoe up to the effective date, as determined under 15.7.5 of the IA, plus interest at 9.9% plus US CPI.
9.7 Interest on Existing Shareholder loans shall only accrue from the Effective Date In definitions: From effective date till conversion date 9.9% + CPI; thereafter LIBOR + 6.5%
The IA 16.19 states this balance to be around $1bn as at the date of the shareholders agreement.
9.8 Existing shareholder loans may be converted to equity, with Erdenes 34% added to the carried loan
15.1 Erdenes has the option to acquire up to 16% additional equity (making total 50%) if the IA is extended by 20 years. The terms are to be agreed. Ivanhoe retains “full and unrestricted management rights”
We have assumed this does not occur
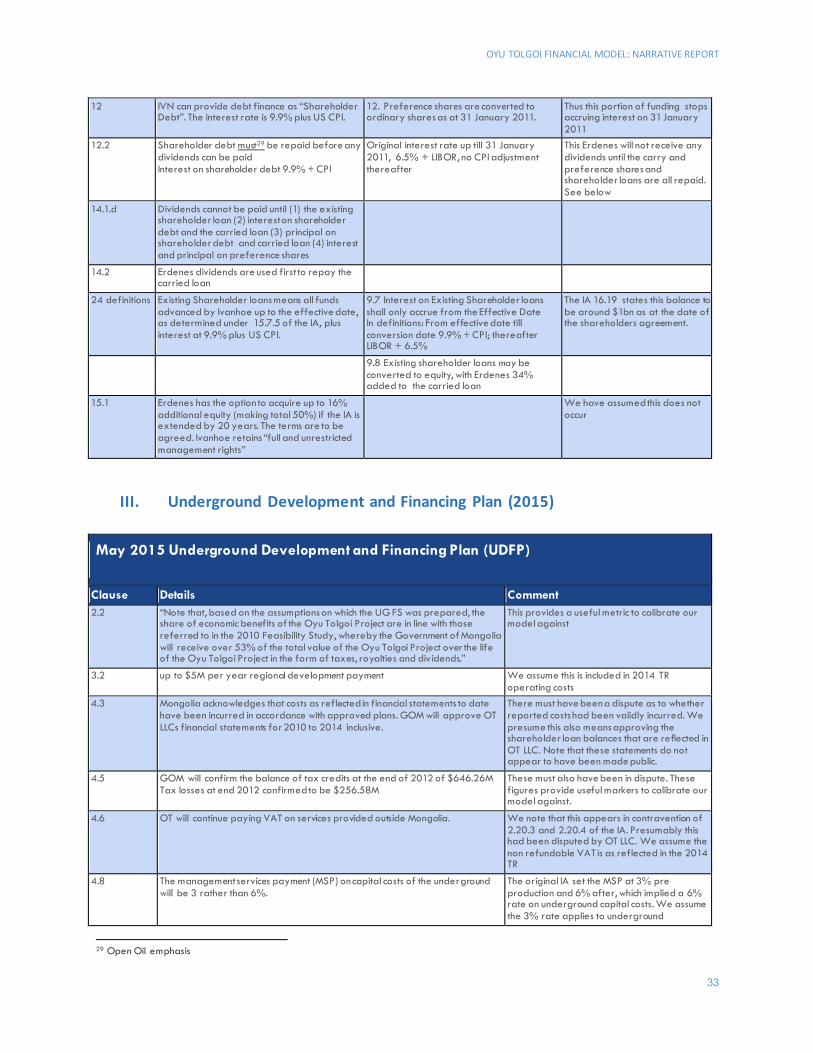
III. Underground Development and Financing Plan (2015)
May 2015 Underground Development and Financing Plan (UDFP)
Clause Details Comment 2.2 “Note that, based on the assumptions on which the UG FS was prepared, the
share of economic benefits of the Oyu Tolgoi Project are in line with those referred to in the 2010 Feasibility Study, whereby the Government of Mongolia will receive over 53% of the total value of the Oyu Tolgoi Project over the life of the Oyu Tolgoi Project in the form of taxes, royalties and div idends.”
This provides a useful metric to calibrate our model against
3.2 up to $5M per year regional development payment We assume this is included in 2014 TR operating costs
4.3 Mongolia acknowledges that costs as reflected in financial statements to date have been incurred in accordance with approved plans. GOM will approve OT LLCs financial statements for 2010 to 2014 inclusive.
There must have been a dispute as to whether reported costs had been validly incurred. We presume this also means approving the shareholder loan balances that are reflected in OT LLC. Note that these statements do not appear to have been made public.
4.5 GOM will confirm the balance of tax credits at the end of 2012 of $646.26M Tax losses at end 2012 confirmed to be $256.58M
These must also have been in dispute. These figures provide useful markers to calibrate our model against.
4.6 OT will continue paying VAT on services provided outside Mongolia. We note that this appears in contravention of 2.20.3 and 2.20.4 of the IA. Presumably this had been disputed by OT LLC. We assume the non refundable VAT is as reflected in the 2014 TR
4.8 The management services payment (MSP) on capital costs of the underground will be 3 rather than 6%.
The original IA set the MSP at 3% pre production and 6% after, which implied a 6% rate on underground capital costs. We assume the 3% rate applies to underground
29 Open Oil emphasis
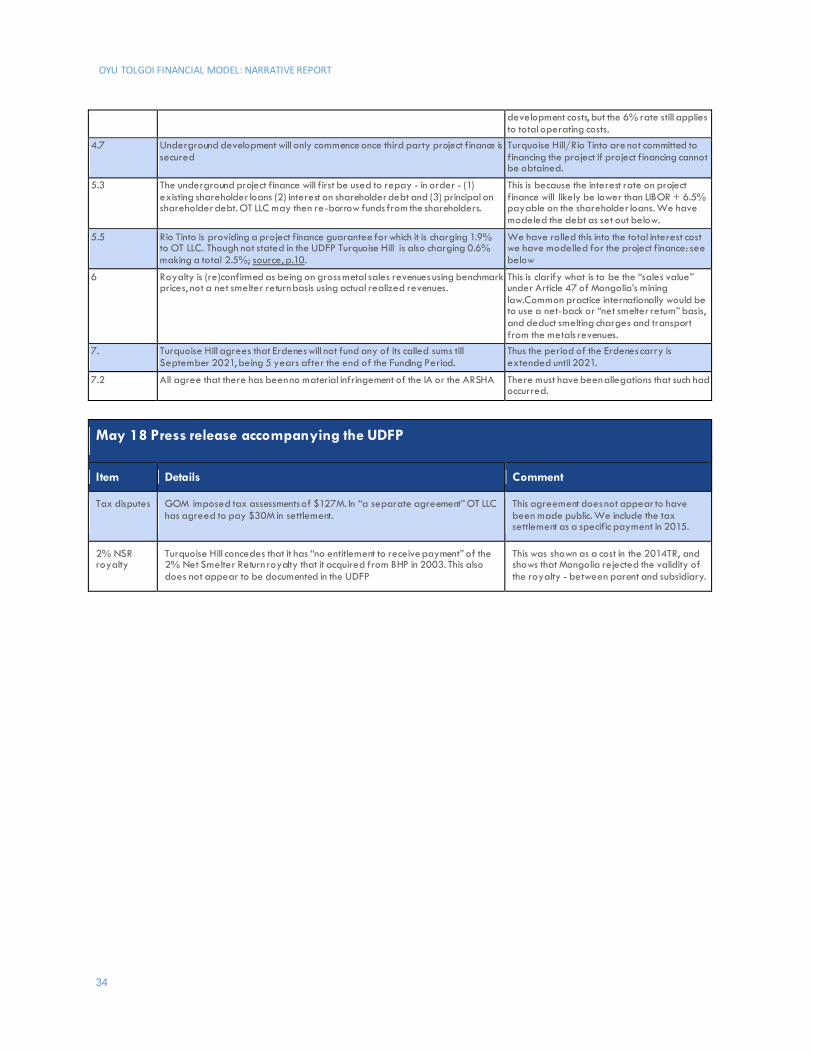
OYU TOLGOI FINANCIAL MODEL: NARRATIVE REPORT
34
development costs, but the 6% rate still applies to total operating costs.
4.7 Underground development will only commence once third party project finance is secured
Turquoise Hill/Rio Tinto are not committed to financing the project if project financing cannot be obtained.
5.3 The underground project finance will first be used to repay - in order - (1) existing shareholder loans (2) interest on shareholder debt and (3) principal on shareholder debt. OT LLC may then re-borrow funds from the shareholders.
This is because the interest rate on project finance will likely be lower than LIBOR + 6.5% payable on the shareholder loans. We have modeled the debt as set out below.
5.5 Rio Tinto is providing a project finance guarantee for which it is charging 1.9% to OT LLC. Though not stated in the UDFP Turquoise Hill is also charging 0.6% making a total 2.5%; source, p.10.
We have rolled this into the total interest cost we have modelled for the project finance: see below
6 Royalty is (re)confirmed as being on gross metal sales revenues using benchmark prices, not a net smelter return basis using actual realized revenues.
This is clarify what is to be the “sales value” under Article 47 of Mongolia’s mining law.Common practice internationally would be to use a net-back or “net smelter return” basis, and deduct smelting charges and transport from the metals revenues.
7. Turquoise Hill agrees that Erdenes will not fund any of its called sums till September 2021, being 5 years after the end of the Funding Period.
Thus the period of the Erdenes carry is extended until 2021.
7.2 All agree that there has been no material infringement of the IA or the ARSHA There must have been allegations that such had occurred.
May 18 Press release accompanying the UDFP
Item Details Comment
Tax disputes GOM imposed tax assessments of $127M. In “a separate agreement” OT LLC has agreed to pay $30M in settlement.
This agreement does not appear to have been made public. We include the tax settlement as a specific payment in 2015.
2% NSR royalty
Turquoise Hill concedes that it has “no entitlement to receive payment” of the 2% Net Smelter Return royalty that it acquired from BHP in 2003. This also does not appear to be documented in the UDFP
This was shown as a cost in the 2014TR, and shows that Mongolia rejected the validity of the royalty - between parent and subsidiary.

OYU TOLGOI FINANCIAL MODEL: NARRATIVE REPORT
35
Appendix 2: Calibrating the Model Against the 2014 TR and Other Sources
We have painstakingly - but inevitably imperfectly - attempted to reconstruct the production and costs set out in the 2014TR. Imperfectly, as certain of the information is provided only on an aggregated basis for several years and there are some (minor) inconsistencies. We have used updated production and price data for 2015 production.
I. Data sources: Exploration costs: from Ivanhoe annual reports from 2001 onwards. We have reflected OT-specific exploration that Ivanhoe expensed to profit and loss. Production: Set out in table TR16.24. This shows individual years from 1-6 (2015 to 2021) but then aggregates 6-10; 11-20 etc. When priced using the 2014TR pricing assumptions these do not exactly match the revenues stated in Table 22.9, so we have adjusted the production so that they do. For aggregated years we have inferred annual copper and gold production from Figure 22.2 in the TR. Our total copper and gold production figures are
Production from our model
From the 2014 TR
Using 2014TR prices aggregate real-terms revenues from 2015 on are $89.1Bn and from Table 22.9 in the TR $89.5bn. The difference mainly arise from our use of Turquoise Hill’s most recently quoted 2015 production figures, which are lower than anticipated in the 2014TR. Realization costs: The 2014TR aggregates smelting, transportation and other charges into a single “realization” line item. We have assumed these are 11% of revenues per Table 22.5 (9.773/89.514) Government royalty: this appears as 4.5% of gross revenues in table 22.5 (4.075/89.514). We infer that Turquoise Hill were of the view that certain realization or other costs were deductible from gross revenues in determining the royalty. We read article of the UDFP as resolving that the royalty is 5% of gross revenues without deduction. Our royalty is therefore $4.54 Bn (real terms) compared with $4.1Bn in the 2014TR.
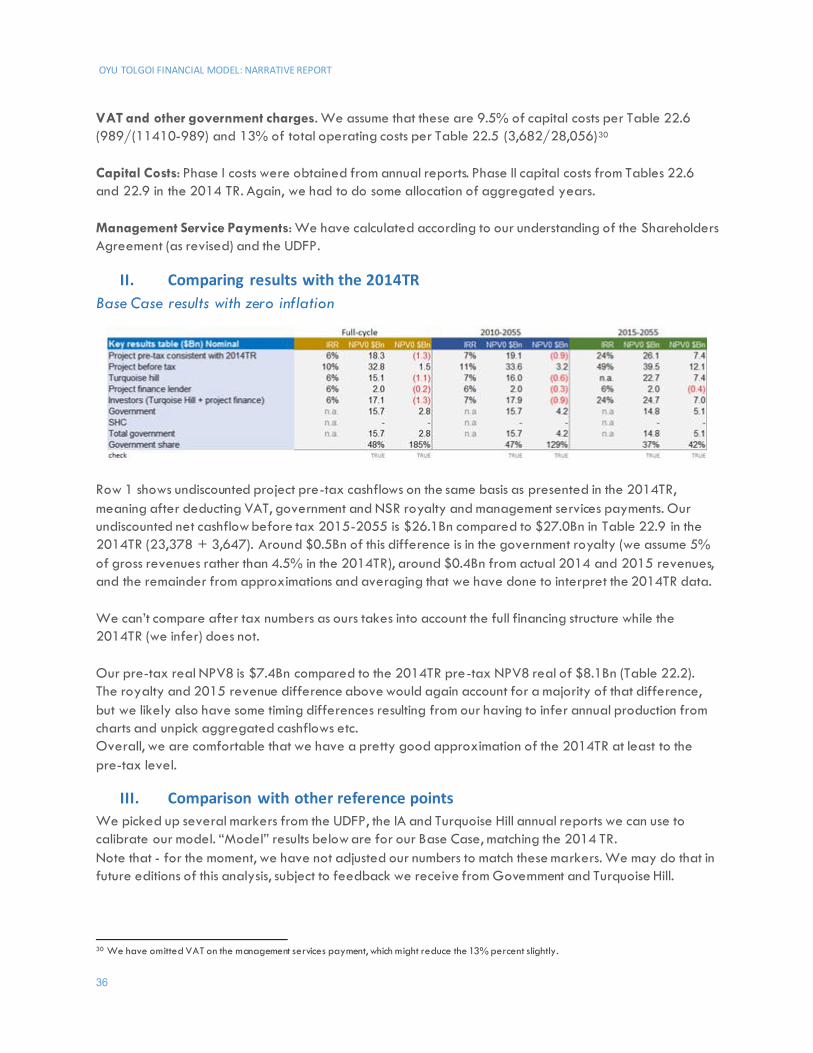
OYU TOLGOI FINANCIAL MODEL: NARRATIVE REPORT
36
VAT and other government charges. We assume that these are 9.5% of capital costs per Table 22.6 (989/(11410-989) and 13% of total operating costs per Table 22.5 (3,682/28,056)30 Capital Costs: Phase I costs were obtained from annual reports. Phase II capital costs from Tables 22.6 and 22.9 in the 2014 TR. Again, we had to do some allocation of aggregated years. Management Service Payments: We have calculated according to our understanding of the Shareholders Agreement (as revised) and the UDFP.
II. Comparing results with the 2014TR Base Case results with zero inflation
Row 1 shows undiscounted project pre-tax cashflows on the same basis as presented in the 2014TR, meaning after deducting VAT, government and NSR royalty and management services payments. Our undiscounted net cashflow before tax 2015-2055 is $26.1Bn compared to $27.0Bn in Table 22.9 in the 2014TR (23,378 + 3,647). Around $0.5Bn of this difference is in the government royalty (we assume 5% of gross revenues rather than 4.5% in the 2014TR), around $0.4Bn from actual 2014 and 2015 revenues, and the remainder from approximations and averaging that we have done to interpret the 2014TR data. We can’t compare after tax numbers as ours takes into account the full financing structure while the 2014TR (we infer) does not. Our pre-tax real NPV8 is $7.4Bn compared to the 2014TR pre-tax NPV8 real of $8.1Bn (Table 22.2). The royalty and 2015 revenue difference above would again account for a majority of that difference, but we likely also have some timing differences resulting from our having to infer annual production from charts and unpick aggregated cashflows etc. Overall, we are comfortable that we have a pretty good approximation of the 2014TR at least to the pre-tax level.
III. Comparison with other reference points We picked up several markers from the UDFP, the IA and Turquoise Hill annual reports we can use to calibrate our model. “Model” results below are for our Base Case, matching the 2014 TR. Note that - for the moment, we have not adjusted our numbers to match these markers. We may do that in future editions of this analysis, subject to feedback we receive from Government and Turquoise Hill.
30 We have omitted VAT on the management services payment, which might reduce the 13% percent slightly.
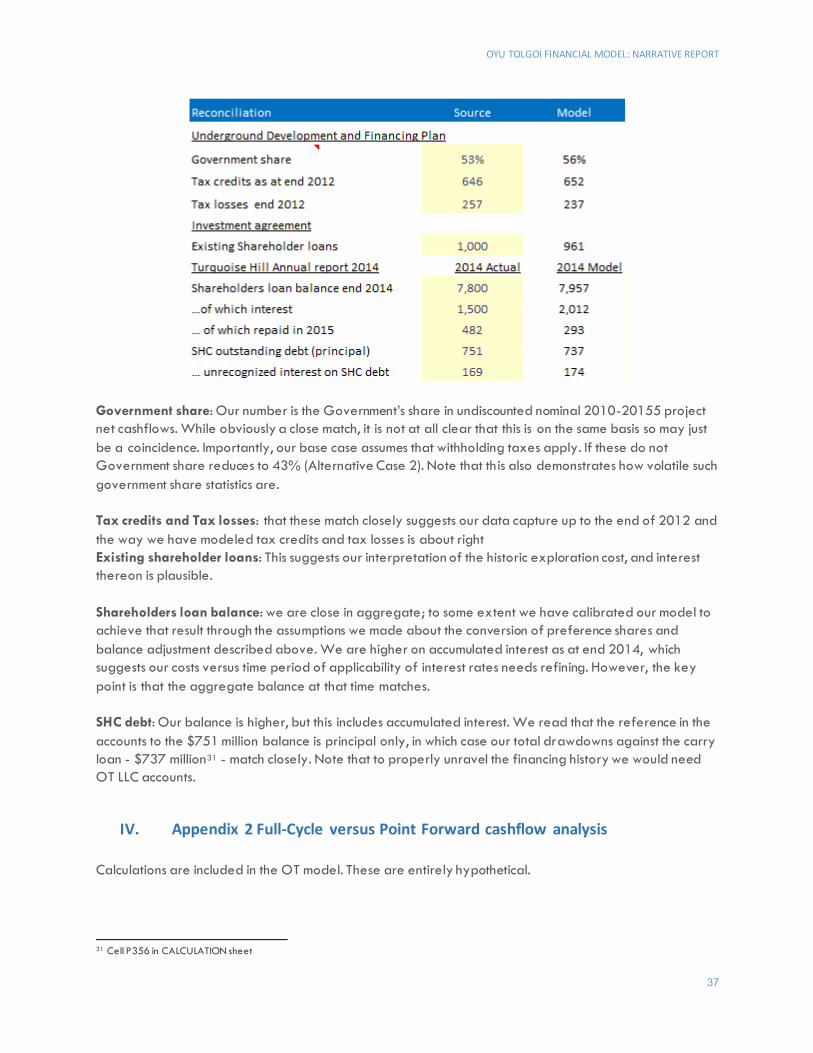
OYU TOLGOI FINANCIAL MODEL: NARRATIVE REPORT
37
Government share: Our number is the Government’s share in undiscounted nominal 2010-20155 project net cashflows. While obviously a close match, it is not at all clear that this is on the same basis so may just be a coincidence. Importantly, our base case assumes that withholding taxes apply. If these do not Government share reduces to 43% (Alternative Case 2). Note that this also demonstrates how volatile such government share statistics are. Tax credits and Tax losses: that these match closely suggests our data capture up to the end of 2012 and the way we have modeled tax credits and tax losses is about right Existing shareholder loans: This suggests our interpretation of the historic exploration cost, and interest thereon is plausible. Shareholders loan balance: we are close in aggregate; to some extent we have calibrated our model to achieve that result through the assumptions we made about the conversion of preference shares and balance adjustment described above. We are higher on accumulated interest as at end 2014, which suggests our costs versus time period of applicability of interest rates needs refining. However, the key point is that the aggregate balance at that time matches. SHC debt: Our balance is higher, but this includes accumulated interest. We read that the reference in the accounts to the $751 million balance is principal only, in which case our total drawdowns against the carry loan - $737 million31 - match closely. Note that to properly unravel the financing history we would need OT LLC accounts.
IV. Appendix 2 Full-Cycle versus Point Forward cashflow analysis Calculations are included in the OT model. These are entirely hypothetical.
31 Cell P356 in CALCULATION sheet
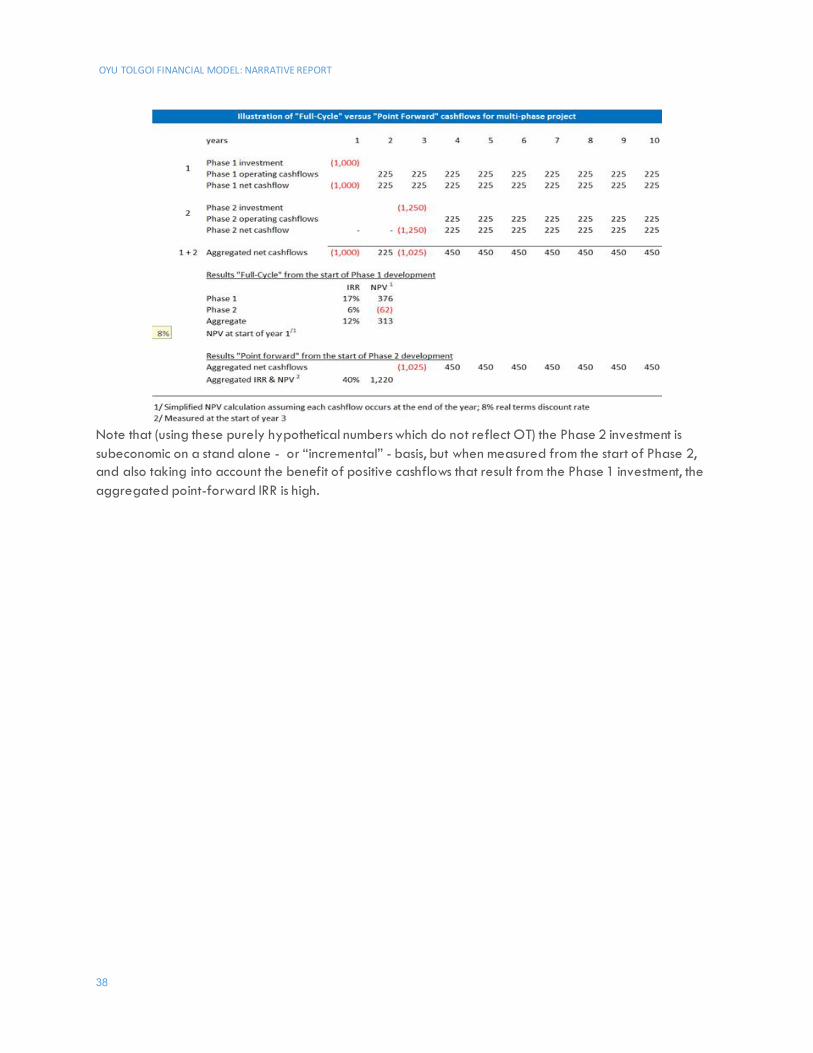
OYU TOLGOI FINANCIAL MODEL: NARRATIVE REPORT
38
Note that (using these purely hypothetical numbers which do not reflect OT) the Phase 2 investment is subeconomic on a stand alone - or “incremental” - basis, but when measured from the start of Phase 2, and also taking into account the benefit of positive cashflows that result from the Phase 1 investment, the aggregated point-forward IRR is high.