Embed Size (px)
Citation preview

East Tennessee State UniversityDigital Commons @ East
Tennessee State University
Electronic Theses and Dissertations Student Works
12-2014
Oxidative Damage to DNA 2´-Deoxyribose byCarbonate Radicals: Reaction Mechanisms andProductsTerence J. MooreEast Tennessee State University
Follow this and additional works at: https://dc.etsu.edu/etd
Part of the Physical Chemistry Commons
This Thesis - Open Access is brought to you for free and open access by the Student Works at Digital Commons @ East Tennessee State University. Ithas been accepted for inclusion in Electronic Theses and Dissertations by an authorized administrator of Digital Commons @ East Tennessee StateUniversity. For more information, please contact [email protected].
Recommended CitationMoore, Terence J., "Oxidative Damage to DNA 2´-Deoxyribose by Carbonate Radicals: Reaction Mechanisms and Products" (2014).Electronic Theses and Dissertations. Paper 2445. https://dc.etsu.edu/etd/2445
Oxidative Damage to DNA 2´-Deoxyribose by Carbonate Radicals: Reaction Mechanisms and
Products
________________________________
A thesis
presented to
the Faculty of the Department of Chemistry
East Tennessee State University
In partial fulfillment
of the requirements for the degree
Master of Science in Chemistry
________________________________
by
Terence Joshua Moore
December 2014
________________________________
Dr. Marina Roginskaya, Chair
Dr. Scott Kirkby
Dr. David Close
Keywords: DNA damage; oxidative stress; reactive oxygen species; carbonate radical anion

2
ABSTRACT
Oxidative Damage to DNA 2´-Deoxyribose by Carbonate Radicals: Reaction Mechanisms and
Products
by
Terence Joshua Moore
The carbonate radical anion (CO3•-, CR) is an important reactive oxygen species produced in
vivo by one-electron oxidation of CO2 or bicarbonate, constituents of the major physiological
buffer. It was demonstrated for the first time by using an HPLC-based analysis of low-molecular
products of DNA damage that CRs react with DNA 2΄-deoxyribose by the hydrogen abstraction
mechanism. CRs exhibit a ~ 800-fold preference for one-electron oxidation of guanine over
hydrogen abstraction from DNA sugar, in sharp contrast with •OH. CRs also have, as compared
to •OH, an increased preference for the H1΄ abstraction, which is the most thermodynamically
favorable due to the highest stability of the respective deoxyribosyl radical but kinetically the
slowest due to low solvent accessibility, by the expense of the decreased preference for the H5΄
abstraction. All these findings are in agreement with the characteristics of CR as a potent oxidant
and selective hydrogen abstractor.
3
DEDICATION
To my mother, Diana, and my father, Terry, for showing me the value of education from
an early age. None of my accomplishments would have been possible without each of you.
To the rest of my family for their love and support throughout my entire academic career.
To Justin for your unwavering support and encouragement. You have been my rock
throughout this process, and I know you will only continue to inspire me to achieve great things.
4
ACKNOWLEDGEMENTS
I am endlessly grateful to Dr. Marina Roginskaya for her superb mentorship during my
graduate studies at ETSU and for allowing me the opportunity to pursue my dreams under her
guidance. Many thanks to Drs. Scott Kirkby and David Close for their time serving on my
advisory committee. I am also indebted to Dr. David Close and Yuriy Razskazovskiy for use of
their laboratory spaces and to Dr. Razskazovskiy for synthesizing the carbonato-cobalt
complexes used extensively in my research. I am also grateful to Mr. Derrick Ampadu-Boateng,
my lab mate, for his work on 8oxoG kinetics.
To the faculty and staff of the Chemistry Department for sharing their advice and wisdom
with me, I am unceasingly appreciative. Many thanks to Mr. Ryan Alexander, Ms. Jillian
Quirante, and Dr. Sandy Eagle for everything they do for the students and faculty in the
Chemistry Department. Your tireless dedication to my colleagues and myself has not gone
unnoticed.
I am also beholden to all my fellow graduate students in the Chemistry Department for
their emotional and academic support. I know each of you will continue to amaze me as I follow
your careers.
5
TABLE OF CONTENTS
Page
ABSTRACT .....................................................................................................................................2
DEDICATION .................................................................................................................................3
ACKNOWLEDGEMENTS .............................................................................................................4
LIST OF TABLES ...........................................................................................................................9
LIST OF FIGURES ......................................................................................................................11
LIST OF ABBREVIATIONS ........................................................................................................14
Chapter
1. INTRODUCTION .............................................................................................................15
Oxidative Stress and DNA .....................................................................................15
Types of Oxidative Damage to DNA: Sugar and Base Damage ...........................16
Sugar Damage ............................................................................................16
C1΄ Pathway ...................................................................................19
C5΄ Pathway ...................................................................................22
C4΄ Pathway ...................................................................................23
C4΄-Oxidized Abasic Site Formation.............................................24
Malondialdehyde C4΄ Chemistry ...................................................27
Base Damage .............................................................................................29
Carbonate Radicals ................................................................................................33
In Vivo and In Vitro CR Production ...........................................................35
CR vs. Hydroxyl Radicals ....................................................................................41
6
Quantitative Analysis of DNA Sugar and Base Damage Products Using
HPLC .....................................................................................................................42
C1΄ and C5΄ Pathways ...............................................................................42
C4΄ Pathway ...............................................................................................44
Lac Formation ................................................................................44
Specific Aims .........................................................................................................46
2. EXPERIMENTAL METHODS.........................................................................................48
Instrumentation, Glassware, and Other Materials ..................................................48
Instrumentation ..........................................................................................48
Glassware and Other Materials ..................................................................48
Reagents .................................................................................................................49
Deoxyribonucleic Acid ..............................................................................49
Carbonatopentamminecobalt(III) Perchlorate ...........................................49
DNA Reagents ...........................................................................................49
HPLC Solvents...........................................................................................50
Buffers, Solutions, and Gases ....................................................................50
Preparation of DNA Solutions .......................................................51
Other Stock Solutions ....................................................................51
Other Reagents ...............................................................................51
Fricke Dosimetry ...................................................................................................52
Methods of Generation of CR ................................................................................55
Generation of CR by X-Irradiation of Bicarbonate Solutions ...................55
Preparation of Reaction Solution ...................................................55
7
X-Irradiation of Reaction Solution ................................................55
Generation of CR by Photolysis of Persulfate and Bicarbonate
Solutions ....................................................................................................56
Preparation of Reaction Solution ...................................................56
Illumination of Reaction Solution ..................................................57
Generation of CR by Photolysis of Carbonatopentamminecobalt(III)
Perchlorate .................................................................................................58
Preparation of Carbonatopentamminecobalt(III) Perchlorate
Solution ..........................................................................................58
Preparation of Reaction Solution ...................................................58
Illumination of Reaction Solution ..................................................59
Post-Irradiation/Post-Illumination Sample Treatments .............................60
Heat Treatment with Spermine ......................................................60
Heat Treatment with Glycine .........................................................61
Heat Treatment with PolyL ............................................................61
Malondialdehyde (MDA) Analysis............................................................62
HPLC Calibration for MDA Detection ..........................................62
HPLC Detection of MDA ..............................................................63
Extraction of MDA with N-Butanol ..............................................64
Determination of the MDA-TBA Extinction Coefficient
in N-Butanol...................................................................................65
DNA Denaturation .....................................................................................66
HPLC Analysis ..........................................................................................66
8
HPLC Analysis of Lac, 5MF, Fur, and FBR .................................66
Gradient Elution of MDA-TBA Adduct ........................................67
Quantification of HPLC Chromatograms ......................................68
3. RESULTS AND DISCUSSION ........................................................................................71
Generation of CR by X-Irradiation of Bicarbonate Solutions ...............................71
Generation of CR by Photolysis of Persulfate + Bicarbonate Solutions ...............77
Photolysis of Persulfate + 0.3 M Bicarbonate Solutions ...........................79
Photolysis of Persulfate in the Presence of Varied Concentrations of
HCO3- .........................................................................................................83
Generation of CR by Photolysis of the Carbonatopentamminecobalt(III)
Complex .................................................................................................................85
Double-Stranded DNA (dsDNA) ...............................................................87
5MF, Fur, Lac, and FBR Analysis .................................................87
dsDNA MDA HPLC Analysis .......................................................91
MDA Analysis Using N-Butanol Extraction .................................93
Discussion of Results .....................................................................95
Single-Stranded DNA (ssDNA) .................................................................99
ssDNA MDA HPLC Analysis .....................................................102
ssDNA Results .............................................................................103
4. CONCLUSIONS..............................................................................................................105
REFERENCES ............................................................................................................................108
APPENDIX: Plotting Data and Statistical Analyses ...................................................................117
VITA ............................................................................................................................................124
9
LIST OF TABLES
Table Page
1. The Standard Reduction Potentials for DNA Nucleosides ................................................29
2. Optical Density as a Function of Irradiation Time in a Copper Disk Attenuated
X-ray Beam ........................................................................................................................54
3. The Masses of Sodium Bicarbonate and Volumes of Glacial Acetic Acid Used During
Varied Ionic Strength Experiments ....................................................................................57
4. The Molar Extinction Coefficients for SDP in 40 mM Ammonium Acetate, pH 6.9 .......69
5. The Molar Extinction Coefficients for Uracil and Native DNA Bases in 40 mM
Ammonium Acetate, pH 6.9 ..............................................................................................70
6. The Linear Regression Data and Radiation Chemical Yields (G) from the Plot of
Individual SDP, Total SDP, and Total FBR as a Function of Dose ..................................75
7. The Linear Regression Data and Relative Product Yields from the Plot of Individual
SDP, Total SDP, and Total FBR as a Function of Illumination Time for the Persulfate/
Bicarbonate System ...........................................................................................................82
8. The Relative Yields of Individual SDP, Total SDP, and Total FBR in the
Carbonatopentamminecobalt(III) Perchlorate System for dsDNA ....................................95
9. The Relative Yields of Individual SDP, Total SDP, and Total FBR in the
Carbonatopentamminecobalt(III) Perchlorate System for ssDNA ..................................102
A.1 . SDP Data for X-Irradiated Bicarbonate Solutions (dsDNA) ...........................................117
A.2 . FBR Data for X-Irradiated Bicarbonate Solutions (dsDNA) ...........................................118
A.3 . SDP Data for Photolyzed Persulfate/Bicarbonate Solutions (dsDNA) ............................119
A.4 . FBR Data for Photolyzed Persulfate/Bicarbonate Solutions (dsDNA) ...........................119
10
A.5 . SDP Data for Photolyzed [Co(NH3)5CO3]+ClO4
- Solutions (dsDNA) ............................120
A.6 . FBR Data for Photolyzed [Co(NH3)5CO3]+ClO4
- Solutions (dsDNA) ............................121
A.7 . SDP Data for Photolyzed [Co(NH3)5CO3]+ClO4
- Solutions (ssDNA) .............................122
A.8 . FBR Data for Photolyzed [Co(NH3)5CO3]+ClO4
- Solutions (ssDNA) ............................123
11
LIST OF FIGURES
Figure Page
1. The structure of the 2΄-deoxyribose moiety of the sugar-phosphate backbone of DNA
indicating the numbering of the five deoxyribose carbons ................................................17
2. The structures of deoxyribosyl radicals formed via hydrogen abstraction ........................18
3. The formation of 5MF from a C1΄ radical and dL precursor lesion ..................................21
4. The formation of 5΄-aldehyde (5΄-Ald) from the precursor C5΄-deoxyribosyl radical ......23
5. The C4΄-pathway chemistry under aerobic and anoxic conditions leading to the formation
of C4΄-OAS and MDA sugar damage products .................................................................26
6. The formation of 3΄-phosphoglycolate, 5΄-phosphate, and MDA from the
C4΄-chemistry ....................................................................................................................27
7. The formation of MDA-TBA adduct from 1 equivalent of MDA and 2 equivalents
of TBA ...............................................................................................................................28
8. The oxidation products of guanine ....................................................................................31
9. The further oxidation products of 8-oxo-7,8-dihydroguanine (8oxoG).............................33
10. The structure of a carbonate radical anion (CR), indicating the delocalization of the
radical electron between two oxygen atoms ......................................................................34
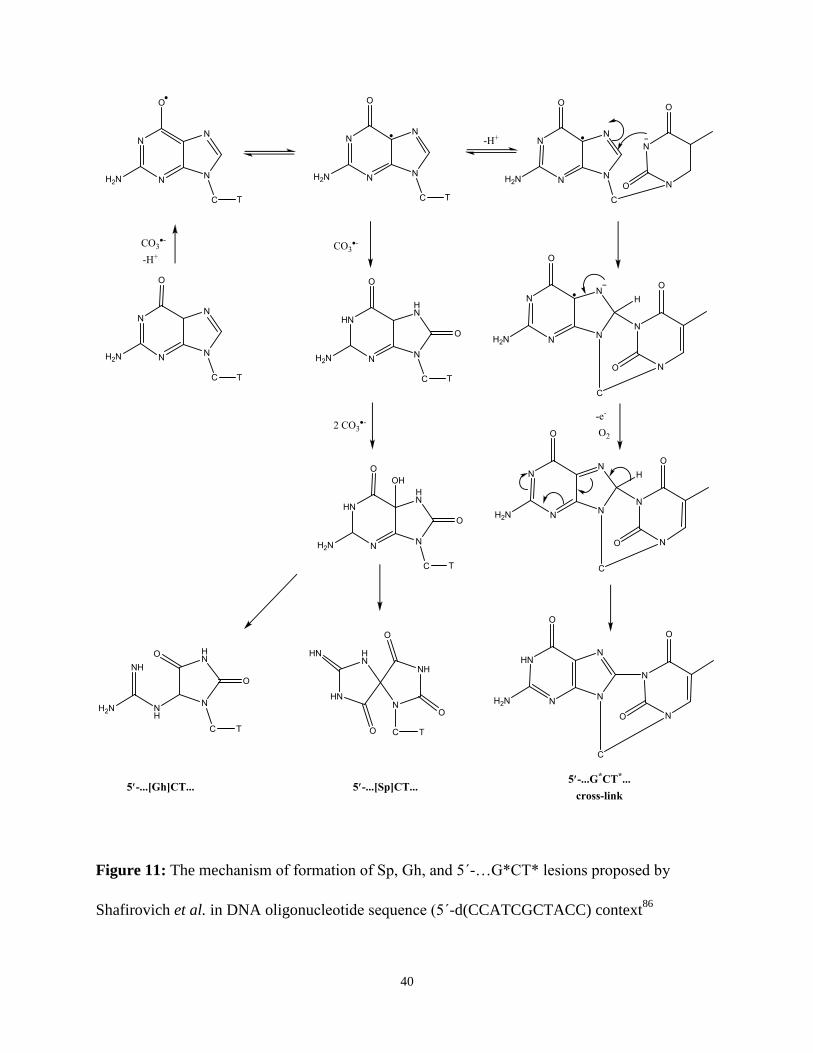
11. The mechanism of formation of Sp, Gh, and 5΄-…G*CT* lesions proposed by
Shafirovich et al. in DNA oligonucleotide sequence (5΄-d(CCATCGCTACC) context ...40
12. The formation of 5-methylenefuran-2-one (5MF) from the 2΄-deoxyribonolactone
precursor lesion ..................................................................................................................44
13. The formation of furfural (Fur) from the 5΄-aldehyde precursor lesion ............................44
14. The formation of lactam (Lac) from the C4΄-oxidized abasic site precursor lesion ..........46
12
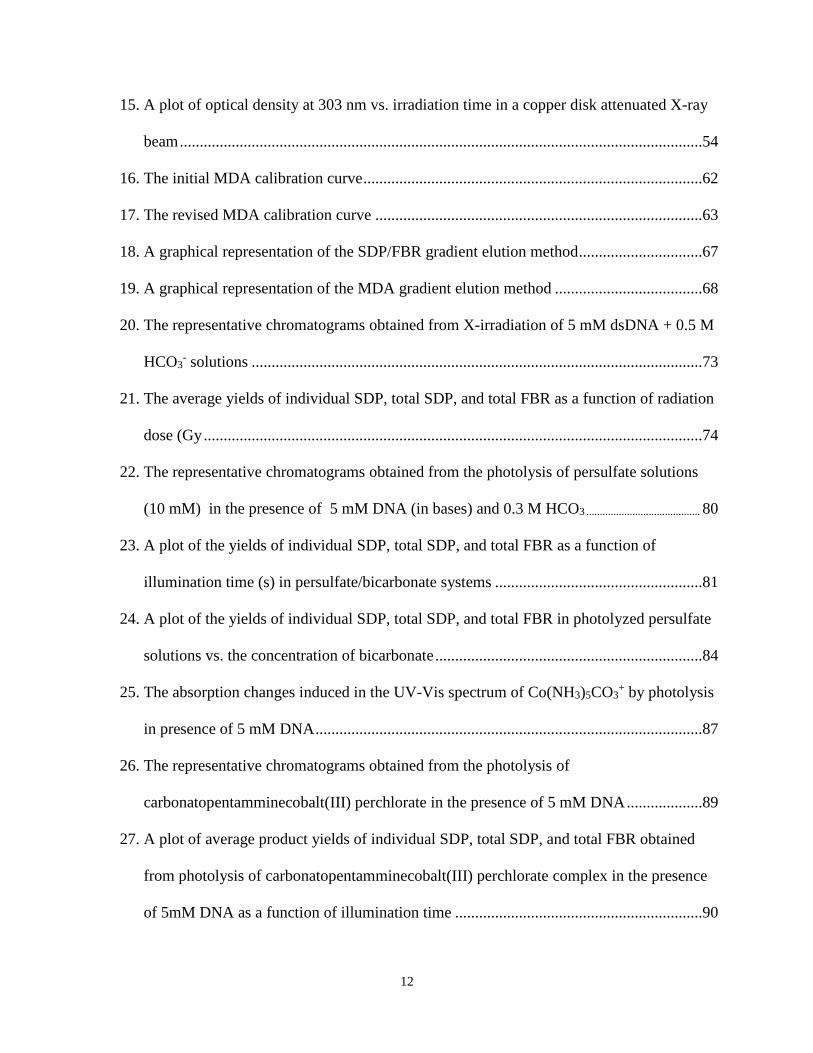
15. A plot of optical density at 303 nm vs. irradiation time in a copper disk attenuated X-ray
beam ...................................................................................................................................54
16. The initial MDA calibration curve .....................................................................................62
17. The revised MDA calibration curve ..................................................................................63
18. A graphical representation of the SDP/FBR gradient elution method ...............................67
19. A graphical representation of the MDA gradient elution method .....................................68
20. The representative chromatograms obtained from X-irradiation of 5 mM dsDNA + 0.5 M
HCO3- solutions .................................................................................................................73
21. The average yields of individual SDP, total SDP, and total FBR as a function of radiation
dose (Gy .............................................................................................................................74
22. The representative chromatograms obtained from the photolysis of persulfate solutions
(10 mM) in the presence of 5 mM DNA (in bases) and 0.3 M HCO3 .......................................... 80
23. A plot of the yields of individual SDP, total SDP, and total FBR as a function of
illumination time (s) in persulfate/bicarbonate systems ....................................................81
24. A plot of the yields of individual SDP, total SDP, and total FBR in photolyzed persulfate
solutions vs. the concentration of bicarbonate ...................................................................84
25. The absorption changes induced in the UV-Vis spectrum of Co(NH3)5CO3+ by photolysis
in presence of 5 mM DNA .................................................................................................87
26. The representative chromatograms obtained from the photolysis of
carbonatopentamminecobalt(III) perchlorate in the presence of 5 mM DNA ...................89
27. A plot of average product yields of individual SDP, total SDP, and total FBR obtained
from photolysis of carbonatopentamminecobalt(III) perchlorate complex in the presence
of 5mM DNA as a function of illumination time ..............................................................90
13
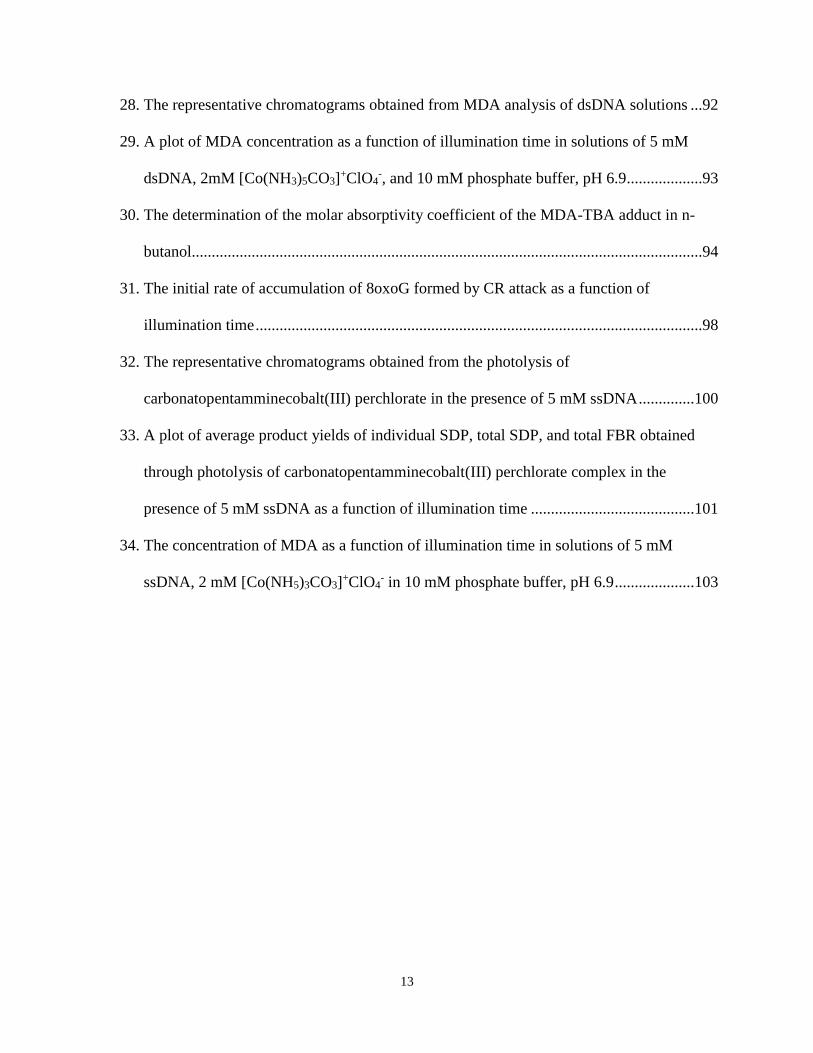
28. The representative chromatograms obtained from MDA analysis of dsDNA solutions ...92
29. A plot of MDA concentration as a function of illumination time in solutions of 5 mM
dsDNA, 2mM [Co(NH3)5CO3]+ClO4
-, and 10 mM phosphate buffer, pH 6.9 ...................93
30. The determination of the molar absorptivity coefficient of the MDA-TBA adduct in n-
butanol................................................................................................................................94
31. The initial rate of accumulation of 8oxoG formed by CR attack as a function of
illumination time ................................................................................................................98
32. The representative chromatograms obtained from the photolysis of
carbonatopentamminecobalt(III) perchlorate in the presence of 5 mM ssDNA ..............100
33. A plot of average product yields of individual SDP, total SDP, and total FBR obtained
through photolysis of carbonatopentamminecobalt(III) perchlorate complex in the
presence of 5 mM ssDNA as a function of illumination time .........................................101
34. The concentration of MDA as a function of illumination time in solutions of 5 mM
ssDNA, 2 mM [Co(NH5)3CO3]+ClO4
- in 10 mM phosphate buffer, pH 6.9 ....................103
14
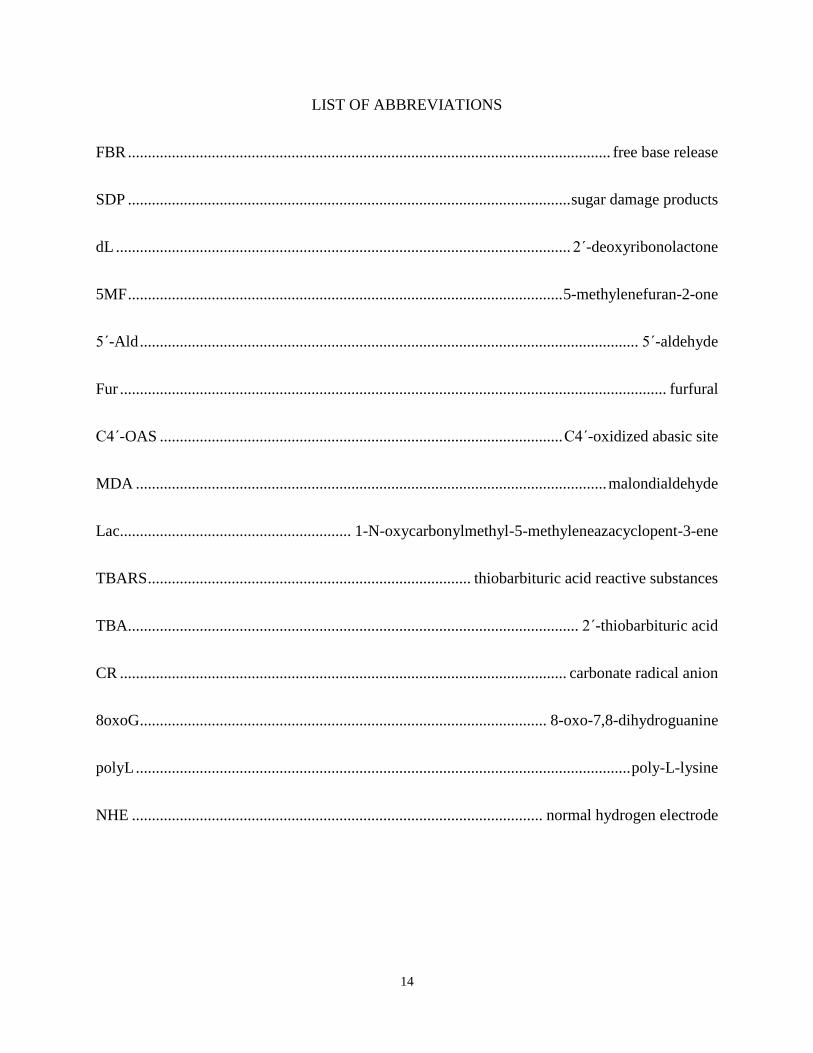
LIST OF ABBREVIATIONS
FBR ......................................................................................................................... free base release
SDP ............................................................................................................... sugar damage products
dL .................................................................................................................. 2΄-deoxyribonolactone
5MF ............................................................................................................. 5-methylenefuran-2-one
5΄-Ald ............................................................................................................................. 5΄-aldehyde
Fur ......................................................................................................................................... furfural
C4΄-OAS ..................................................................................................... C4΄-oxidized abasic site
MDA ...................................................................................................................... malondialdehyde
Lac.......................................................... 1-N-oxycarbonylmethyl-5-methyleneazacyclopent-3-ene
TBARS ................................................................................. thiobarbituric acid reactive substances
TBA................................................................................................................. 2΄-thiobarbituric acid
CR ................................................................................................................ carbonate radical anion
8oxoG ...................................................................................................... 8-oxo-7,8-dihydroguanine
polyL ............................................................................................................................ poly-L-lysine
NHE ....................................................................................................... normal hydrogen electrode

15
CHAPTER 1
INTRODUCTION
Oxidative Stress and DNA
The adverse side effect of living in an oxygenated environment is the oxidation of
biologically important macromolecules within aerobic organisms. While it has been shown that
oxidation of these molecules is necessary to promote cellular signaling processes and hence is
beneficial to the organism, excessive production of species capable of oxidizing biomolecules
may be defined as a state of oxidative stress. This oxidative stress may be the result of
endogenous or exogenous factors, including environmental pollution1, UV light
2, and ionizing
radiation3,4
. The typical stressor is a reactive oxygen species (ROS) that is usually free radical in
nature. ROS such as the hydroxyl radical (HO•), the superoxide radical (O2•-), hydrogen peroxide
(H2O2), nitric oxide (NO), and peroxynitrite (ONOO-) have been implicated in a number of
pathologies including inflammatory diseases, ischemia and reperfusion5,6
, neurodegenerative
diseases (like Huntington’s disease7 and Alzheimer’s disease
1,8), cancers
6, stroke
5, respiratory
diseases9, and aging processes
6.
Among all biomolecules subjected to oxidative stress conditions, deoxyribonucleic acid
(DNA) as the major hereditary unit is the major focus of studies in this field. A multitude of
oxidative modifications to DNA may be initiated by interaction with ROS, including damage to
the deoxyribose moiety of the sugar-phosphate backbone of the DNA double helix, nucleobase
modifications within the DNA sequence, single- and double-strand breaks (SSB and DSB,
16
respectively), and DNA-protein crosslinks6. These types of oxidative damage to DNA are usually
repaired by the cells under normal metabolic conditions, but during oxidative stress the repair
mechanism is unable to cope with the volume of DNA lesions, and some DNA lesions are left
unrepaired. It is these unrepaired DNA lesions that can lead to the development of the disease
conditions listed above. In the specific case of cancers, this oxidative damage to DNA is believed
to be the precursor to oncogene activation and tumor-suppressor gene inactivation, resulting in
unregulated cellular growth (tumorigenesis)10
.
Types of Oxidative Damage to DNA: Sugar and Base Damage
DNA damage occurs when ROS attack the DNA at one of two loci: the deoxyribose
moiety (sugar damage) or the nucleobase moiety (base damage). Base damage is estimated to
account for 2/3 of the total damage, while sugar damage comprises the remaining 1/3 of total
damage11
. Sugar damage has been implicated as the precursor to DNA SSBs and DSBs, which
have traditionally been acknowledged as important biomarkers for cellular DNA damage. The
double-strand breaks initiated by sugar damage have also been considered to be mutagenic in
nature due to possibility of base deletion, and contribute to increased genomic instability.
Sugar Damage
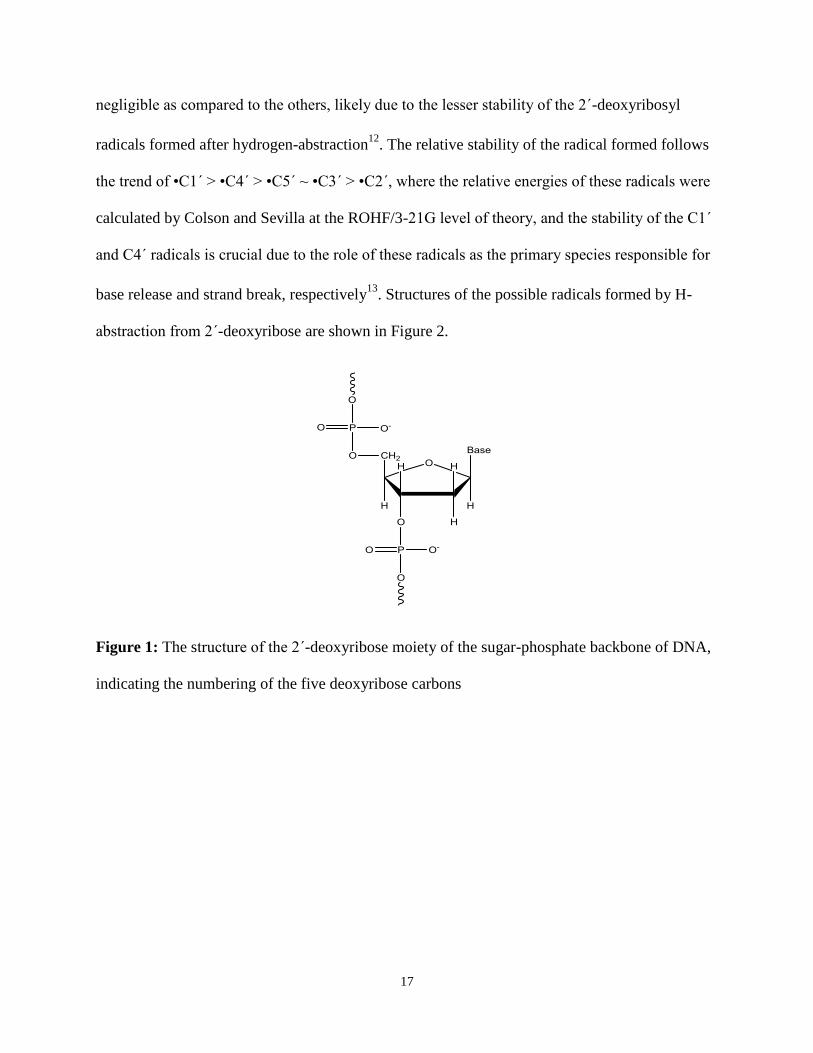
Upon reaction with 2΄-deoxyribose (Figure 1, page 17), ROS can abstract a hydrogen
from one of the five carbons present, resulting in a 2΄-deoxyribosyl radical. Typical sugar lesions
occur at the C1΄, C4΄, and C5΄ positions of 2΄-deoxyribose12
. Although there is the potential for
sugar damage at the C2΄ and C3΄ positions as well, the overall contribution of these pathways is
17
negligible as compared to the others, likely due to the lesser stability of the 2΄-deoxyribosyl
radicals formed after hydrogen-abstraction12
. The relative stability of the radical formed follows
the trend of •C1΄ > •C4΄ > •C5΄ ~ •C3΄ > •C2΄, where the relative energies of these radicals were
calculated by Colson and Sevilla at the ROHF/3-21G level of theory, and the stability of the C1΄
and C4΄ radicals is crucial due to the role of these radicals as the primary species responsible for
base release and strand break, respectively13
. Structures of the possible radicals formed by H-
abstraction from 2΄-deoxyribose are shown in Figure 2.
Figure 1: The structure of the 2΄-deoxyribose moiety of the sugar-phosphate backbone of DNA,
indicating the numbering of the five deoxyribose carbons

18
Figure 2: The structures of deoxyribosyl radicals formed via hydrogen abstraction. The radicals
are arranged in increasing numerical order: a) C1΄-radical; b) C2΄-radical; c) C3΄-radical; d) C4΄-
radical; and e) C5΄-radical
The question of which DNA sugar hydrogen is preferentially abstracted during ROS
attack has been studied extensively by our research group14-17
and other research groups, and this

19
query is key to the study of DNA degradation by ROS attack. The debate is not without its share
of controversy amongst the research community, but the nature of DNA oxidative lesions is
heavily dependent on the position where hydrogen abstraction from 2΄-deoxyribose occurs. The
resulting consequences from each type of DNA damage are also dependent on the position of
initial hydrogen abstraction.
The bulk of evidence suggests that DNA sugar damage occurs via combination of three
major competing pathways: C1΄, C4΄, and C5΄ sugar H-abstraction by ROS. Until recently, the
focus of this research has been on the interaction between hydroxyl radicals (considered by many
to be the most biologically important ROS), and these radicals specifically oxidize DNA sugar in
the preferential order of C4΄ > C1΄ > C5΄ >> C2΄ ~ C3΄.14-18
The predominance of one pathway
over the other is a combination of thermodynamic and kinetic factors: the thermodynamic
preference of hydrogen abstraction from each position of 2΄-deoxyribose is decreased in the
order C1΄ > C4΄ > C2΄ > C3΄> C5΄.13,19
Solvent accessibility decreases in the order C5΄ > C4΄ ~
C3΄ ~ C2΄ ~ C1΄, and this parallels the reactivity of the corresponding hydrogens to hydroxyl
radicals.12
C1΄ Pathway. The formation of a C1΄deoxyribosyl radical is preceded by hydrogen
abstraction from the C1΄ position of the parent sugar. However, the C1΄ hydrogen of 2΄-
deoxyribose is buried within the minor groove of the DNA beta helix (in B-DNA), and solvent
accessibility to this locus is limited.12
The reactivity at this position of 2΄-deoxyribose is limited
to minor groove-binding molecules in which the oxidant was generated within the groove and
oriented toward the H1΄ hydrogen.12
Once the C1΄ deoxyribosyl radical is formed it will proceed
20
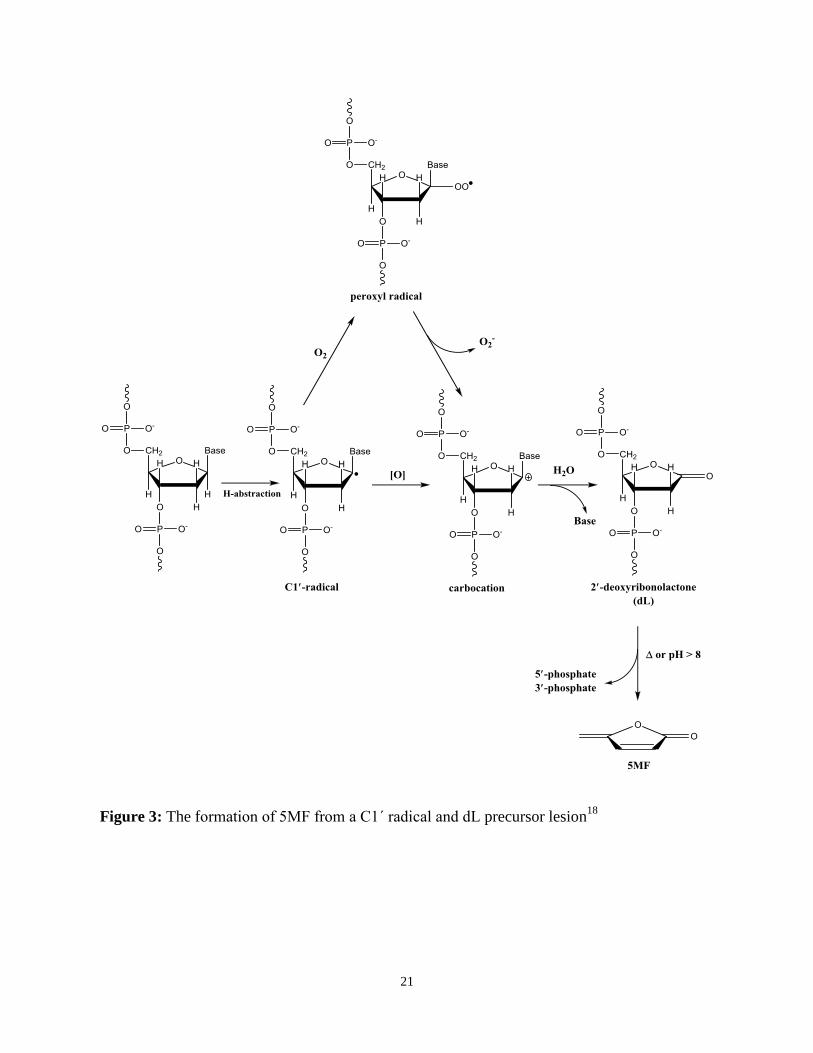
down one of two pathways: the C1΄ radical can be further oxidized to form a carbocation, while
in the presence of molecular oxygen, a peroxyl radical is formed, followed by release of a
superoxide anion and formation of a carbocation at the C1΄ position. The carbocation formed by
either of the previous two pathways is hydrolyzed by water; this process is accompanied by
release of a free base (free base release, FBR). The resulting intermediate, 2΄-deoxyribonolactone
(dL), is relatively unstable and will undergo β- and δ-elimination of 5΄-phosphate and the 3΄-
phosphate upon heating or at basic pH to form 5-methylenefuran-2-one (5MF). This reaction
scheme is summarized in Figure 3.18
21
Figure 3: The formation of 5MF from a C1΄ radical and dL precursor lesion18

22
C5΄ Pathway. The formation of a C5΄-deoxyribosyl radical is preceded by hydrogen
abstraction from the C5΄ position of 2΄-deoxyribose. The two hydrogen atoms attached to the 5΄-
carbon atom are highly accessible in a B-DNA helix, and consideration of the surface areas of
both of these atoms leads to even greater solvent accessibility12
. Despite the fact that both atoms
are accessible from the minor groove of the DNA double helix, one atom points away from the
groove toward the solvent12
, and it stands to reason that this hydrogen will be the primary focus
of hydrogen abstraction by aqueous oxidants. Pathways involving the abstraction of hydrogen
from the 5΄-position have been proposed for DNA scission mediated by enediyne antibiotics,
Fenton-generated hydroxyl radicals, gamma radiolysis, cationic metal porphyrins, and the
hydroperoxyl radical (•OOH)12
.
The radical formed by the abstraction of H5΄ can undergo a second one-electron
oxidation, resulting in the formation of a carbocation intermediate that is reactive to water. The
hydroxylated C5΄-position then undergoes 3΄-phosphate elimination to yield an oligonucleotide
of 5΄-aldehyde (5΄-Ald), which can then undergo FBR and phosphate elimination to generate
furfural (Fur). This proposed reaction scheme is presented in Figure 4.

23
Figure 4: The formation of 5΄-aldehyde (5΄-Ald) from the precursor C5΄-deoxyribosyl radical.
This radical undergoes base and phosphate elimination reactions to generate furfural18
C4΄ Pathway. The C4΄ pathway is initiated by hydrogen abstraction from the C4΄-position
of the DNA 2΄-deoxyribose. Due in large part to the accessibility of this site in B-DNA, many
DNA-cleaving molecules can attack DNA at this position12
. Systems involving ionizing
radiation-induced damage, methidiumpropyl(EDTA)•Fe(II), Fenton-generated hydroxyl radicals,
and several drugs (including bleomycin, calicheamicin, neocarzinostatin, elsamicin A, and
C1027) have been proposed to undergo 4΄-hydrogen abstraction to yield DNA damage12
.
The von Sonntag research group proposed a pathway based on alkyl phosphate and ribose
5΄-phosphate chemistry that was independent of the presence of oxygen20
. In this pathway, an
alkyl radical generated adjacent to a phosphate ester underwent hydrolysis followed by β-
24
elimination of phosphate12
. Extrapolating this proposed mechanism from model systems to
DNA, von Sonntag et al. hypothesized a C4΄-radical was formed followed by β-elimination of
one – or both – phosphate group(s)12,20
. Also in this model, a radical cation intermediate is
generated followed by an addition reaction of water and release of a proton12,21,22
. The radical is
believed to be stabilized due to the lone pairs of electrons on the oxygen heteroatom in the ring12
.
The phosphate elimination and radical cation formation were also observed in model studies by
Giese et al.23
, where the final product is dependent on whether water adds to the carbocation or
the carbon-centered radical.
The C4΄ pathway has been established as a fundamental mechanism of DNA immediate
strand breaks initiated by radiation-produced HO•, and this pathway is estimated to participate in
approximately 50% of immediate strand breaks in dilute aqueous solutions24
, in contrast to the
findings of Tullius et al. (~21%)25
. This pathway can be divided into two component pathways:
formation of malondialdehyde or formation of a C4΄-oxidized abasic site.
C4΄-Oxidized Abasic Site Formation. Despite being initially identified in γ-irradiated
aqueous solutions of DNA26,27
, the C4΄-oxidized abasic site (C4΄-OAS) has also been found as a
product of bleomycin-facilitated anaerobic DNA cleavage17
. Upon formation of this lesion,
DNA-DNA cross-linking reactions have been observed28-30
, and the product of this cross-linking
has been shown to block DNA replication and repair mechanisms17,31,32
, which increases the
potential for the C4΄-OAS to act mutagenically.
The role of the C4΄-OAS in radiation-induced DNA damage remains at a minimum,
unclear, if not controversial, due to lack of directly comparable data in the literature on the yields
of the C4΄-OAS17
. Fluorimetric assays performed by Dhar et al.33
found the yield of C4΄-OAS in

25
DNA to be 27.5% of all radio-induced aldehyde-reactive probe (ARP) carbonyl groups, while
gas chromatography-mass spectrometry (GC-MS) techniques used by Chen et al.34
found the
C4΄-OAS to be only 3% of all 2΄-deoxyribose damage. Both of the procedures used by these two
research groups rely on multiple derivatization steps and, perhaps most important of all, require
calibration using well-characterized authentic oligonucleotides containing chemically
incorporated C4΄-oxidized abasic sites17
.
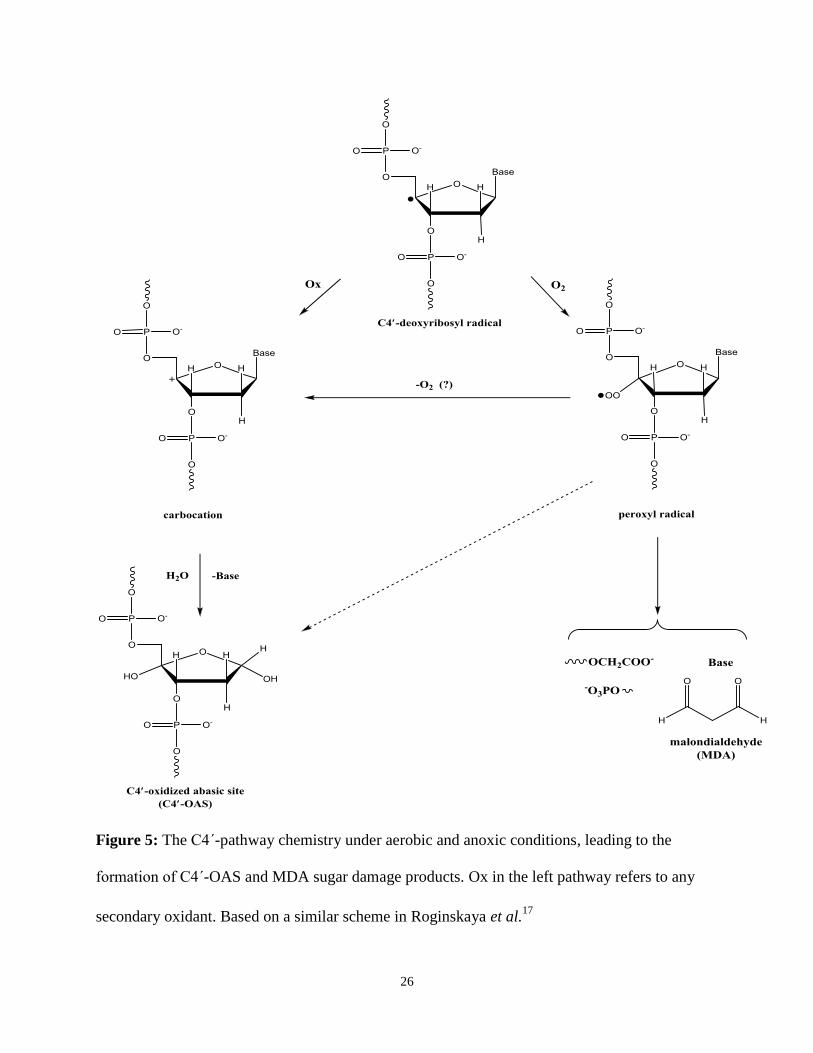
While the exact mechanism for the formation of a C4΄-OAS remains unclear, the
mechanism proposed by our research group is found in Figure 5, below. In the presence of
molecular oxygen, a C4΄-deoxyribosyl radical will undergo an addition of molecular oxygen to
form a peroxyl radical, which proceeds through an undetermined mechanistic pathway to form
the C4΄-OAS. The peroxyl radical can also undergo elimination of molecular oxygen to form a
C4΄-deoxyribosyl carbocation that can eliminate the nucleobase in the presence of water to form
the C4΄-OAS.
26
Figure 5: The C4΄-pathway chemistry under aerobic and anoxic conditions, leading to the
formation of C4΄-OAS and MDA sugar damage products. Ox in the left pathway refers to any
secondary oxidant. Based on a similar scheme in Roginskaya et al.17
27
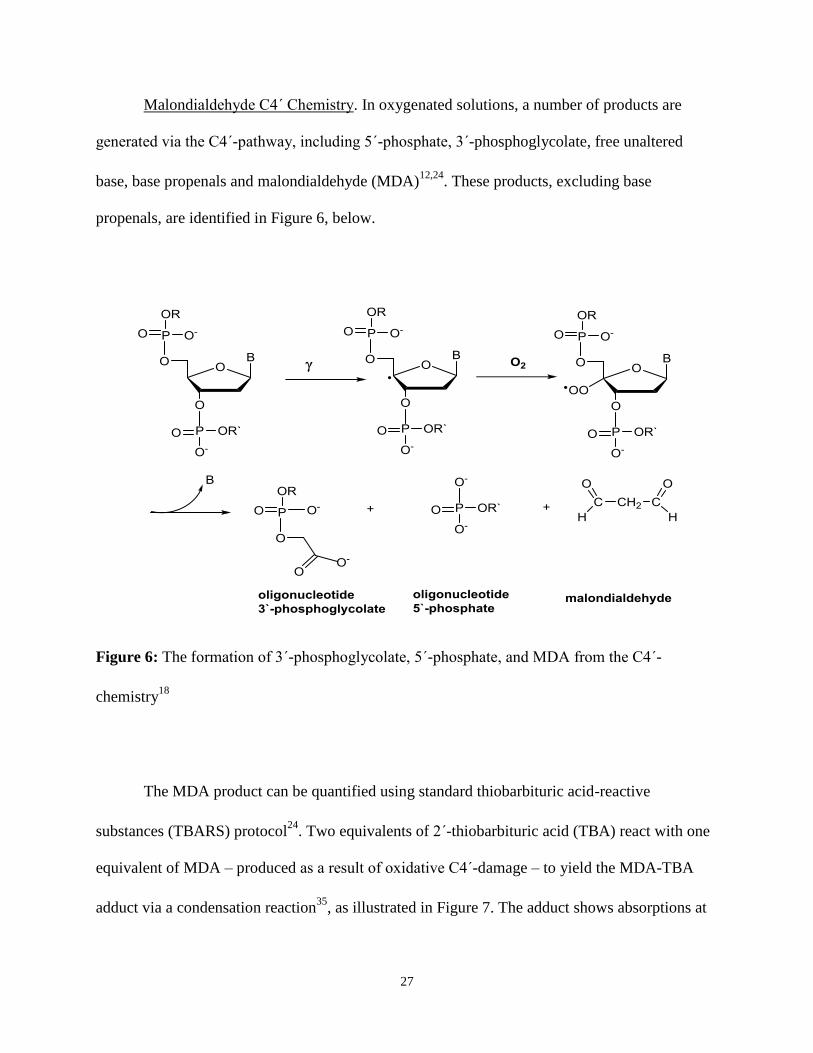
Malondialdehyde C4΄ Chemistry. In oxygenated solutions, a number of products are
generated via the C4΄-pathway, including 5΄-phosphate, 3΄-phosphoglycolate, free unaltered
base, base propenals and malondialdehyde (MDA)12,24
. These products, excluding base
propenals, are identified in Figure 6, below.
Figure 6: The formation of 3΄-phosphoglycolate, 5΄-phosphate, and MDA from the C4΄-
chemistry18
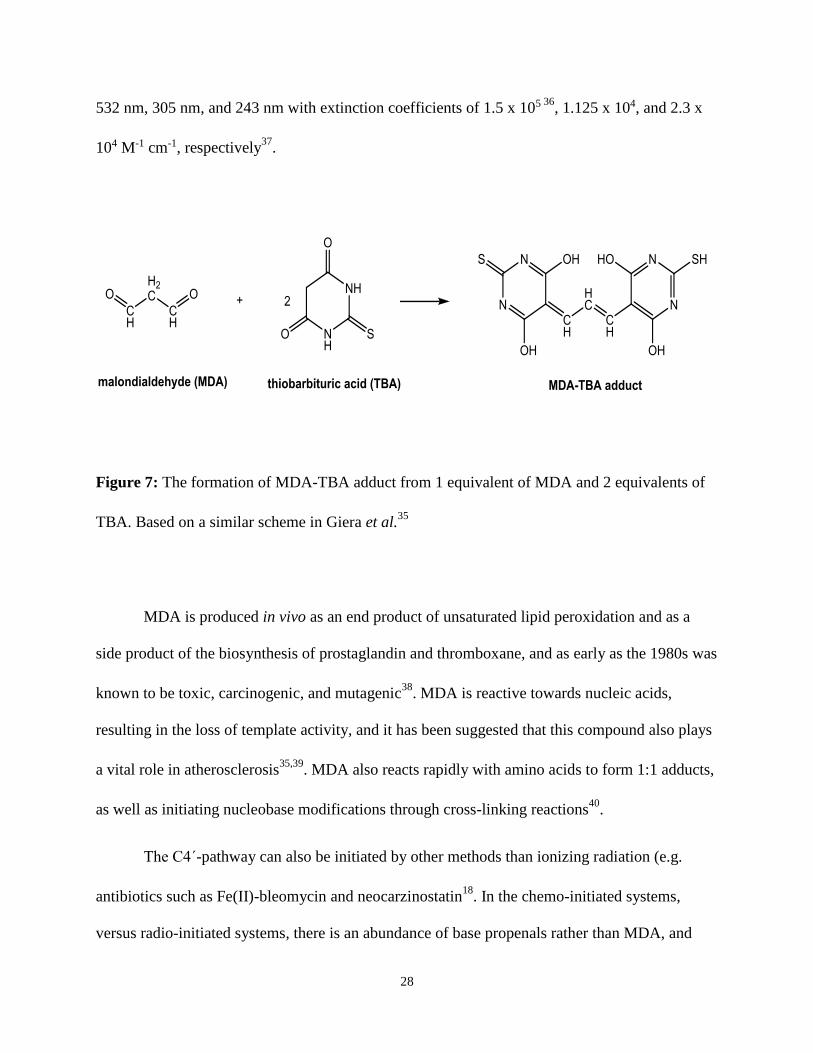
The MDA product can be quantified using standard thiobarbituric acid-reactive
substances (TBARS) protocol24
. Two equivalents of 2΄-thiobarbituric acid (TBA) react with one
equivalent of MDA – produced as a result of oxidative C4΄-damage – to yield the MDA-TBA
adduct via a condensation reaction35
, as illustrated in Figure 7. The adduct shows absorptions at
28
532 nm, 305 nm, and 243 nm with extinction coefficients of 1.5 x 10⁵ 36, 1.125 x 10⁴, and 2.3 x
104 M-1 cm-1, respectively37
.
Figure 7: The formation of MDA-TBA adduct from 1 equivalent of MDA and 2 equivalents of
TBA. Based on a similar scheme in Giera et al.35
MDA is produced in vivo as an end product of unsaturated lipid peroxidation and as a
side product of the biosynthesis of prostaglandin and thromboxane, and as early as the 1980s was
known to be toxic, carcinogenic, and mutagenic38
. MDA is reactive towards nucleic acids,
resulting in the loss of template activity, and it has been suggested that this compound also plays
a vital role in atherosclerosis35,39
. MDA also reacts rapidly with amino acids to form 1:1 adducts,
as well as initiating nucleobase modifications through cross-linking reactions40
.
The C4΄-pathway can also be initiated by other methods than ionizing radiation (e.g.
antibiotics such as Fe(II)-bleomycin and neocarzinostatin18
. In the chemo-initiated systems,
versus radio-initiated systems, there is an abundance of base propenals rather than MDA, and
29
this is indicative of the differing nature between radiation-induced and chemically-induced C4΄-
pathway chemistry18
.
Base Damage
DNA bases are the primary targets of oxidative damage due to their lower oxidation
potentials compared to the DNA sugar-phosphate backbone. The resulting base damage is
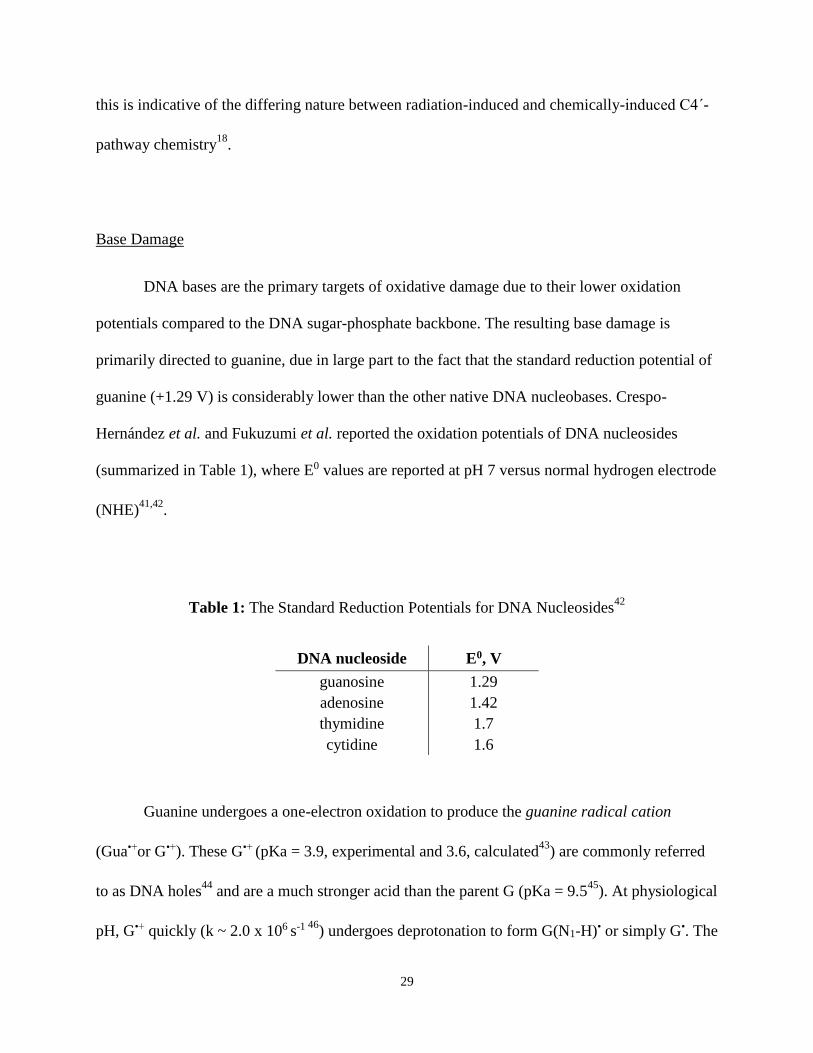
primarily directed to guanine, due in large part to the fact that the standard reduction potential of
guanine (+1.29 V) is considerably lower than the other native DNA nucleobases. Crespo-
Hernández et al. and Fukuzumi et al. reported the oxidation potentials of DNA nucleosides
(summarized in Table 1), where E0 values are reported at pH 7 versus normal hydrogen electrode
(NHE)41,42
.
Table 1: The Standard Reduction Potentials for DNA Nucleosides42
DNA nucleoside E0, V
guanosine 1.29
adenosine 1.42
thymidine 1.7
cytidine 1.6
Guanine undergoes a one-electron oxidation to produce the guanine radical cation
(Gua•+or G•+). These G•+ (pKa = 3.9, experimental and 3.6, calculated43
) are commonly referred
to as DNA holes44
and are a much stronger acid than the parent G (pKa = 9.545
). At physiological
pH, G•+ quickly (k ~ 2.0 x 10⁶ s-1 46) undergoes deprotonation to form G(N1-H)• or simply G•. The
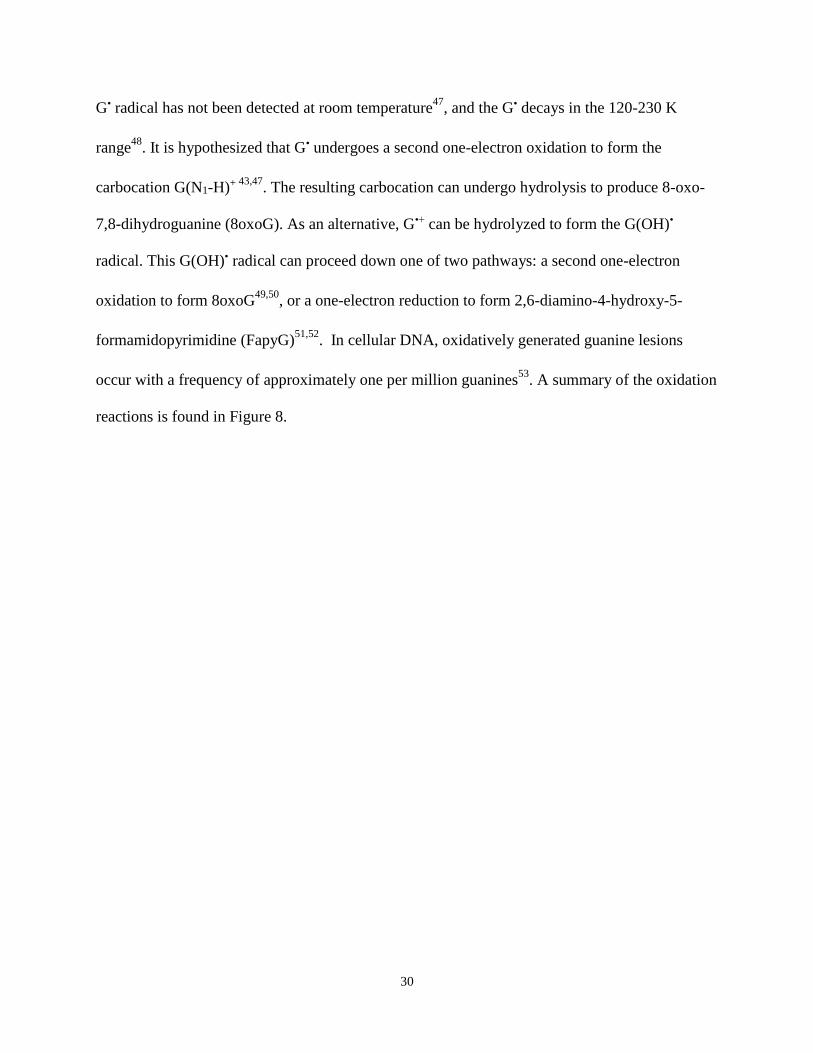
30
G• radical has not been detected at room temperature47
, and the G• decays in the 120-230 K
range48
. It is hypothesized that G• undergoes a second one-electron oxidation to form the
carbocation G(N1-H)+ 43,47. The resulting carbocation can undergo hydrolysis to produce 8-oxo-
7,8-dihydroguanine (8oxoG). As an alternative, G•+ can be hydrolyzed to form the G(OH)•
radical. This G(OH)• radical can proceed down one of two pathways: a second one-electron
oxidation to form 8oxoG49,50
, or a one-electron reduction to form 2,6-diamino-4-hydroxy-5-
formamidopyrimidine (FapyG)51,52
. In cellular DNA, oxidatively generated guanine lesions
occur with a frequency of approximately one per million guanines53
. A summary of the oxidation
reactions is found in Figure 8.
31
Figure 8: The oxidation products of guanine. The scheme above is based on a similar scheme
found in Close et al.47
8oxoG is known as a biomarker for oxidative stress conditions in vivo54-56
. Elevated
levels of 8oxoG have been found in a variety of tissues, including lung tissues57,58
of individuals
living or working in environments with high concentrations of oxidative stressors, including
asbestos fibers59,60
, exhaust from diesel engines61
, and environmental pollution62
. Other oxidative
stressors include heavy metals and metalloids63
, polycyclic aromatic hydrocarbons64-66
, and
32
benzene, styrene, and organoarsenic61
. Regardless of the nature of these environmental stressors,
all were associated with increased levels of 8oxoG due to oxidative stress conditions.
8oxoG can be further oxidized due to its low standard reduction potential (+0.74 V vs.
NHE67
), and multiple research groups have reported that 8oxoG is susceptible to further
oxidation using other oxidizers including peroxynitrite, iridium hexachloride anion ([IrCl6]2-),
singlet oxygen (1O2), and the dichromate anion ([Cr2O7]2-)
68. The products of these further 2-
electron 8oxoG oxidations have been identified in vitro68
. Because of the low reduction
potential
of 8oxoG, a variety of biologically important oxidizers that are less potent than HO• can also
oxidize 8oxoG, including the CR (E° = +1.59 V53
), and organic radicals including the
alkylhydroperoxyradical (E° = +0.9 V). Based on the conditions and oxidant type, 8oxoG can be
oxidized to form a number of hyperoxidized products that can also serve as biomarkers for
oxidative stress in cells. Guanidinohydantoin (Gh) and iminoallantoin are produced from 8oxoG
in oligonucleotides via oxidation by [IrCl6]2-, and are further oxidized to yield parabanic acid and
oxaluric acid at neutral pH69,70
. Two stereoisomers of spiroiminodihydantoin (Sp) were also
detected in cellular DNA, and these lesions are indicative of the biological importance of 8oxoG
oxidation in vivo68
. Other hyperoxidized products of 8oxoG include imidazalone (2,5-diamino-
4H-imidazol-4-one), oxazalone, cyanuric acid68
, and 1,3,5-triazepane-2,4,6,7-tetrone71,72
. While
the in vivo 8oxoG lesion is only slightly mutagenic – with < 10% of 8oxoG lesions resulting in
G→T transversion – these hyperoxidized products are even more mutagenic than 8oxoG and can
result in G-T and/or G-C mutation by transversion both in vitro and in vivo. Structures for these
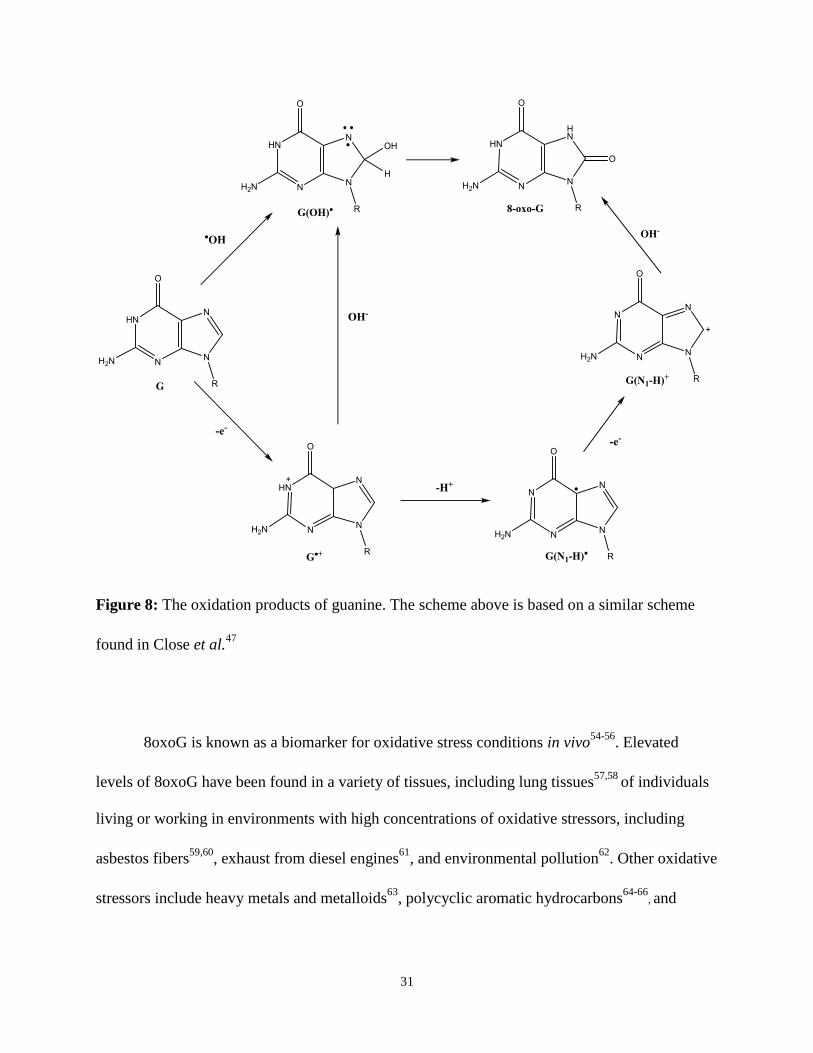
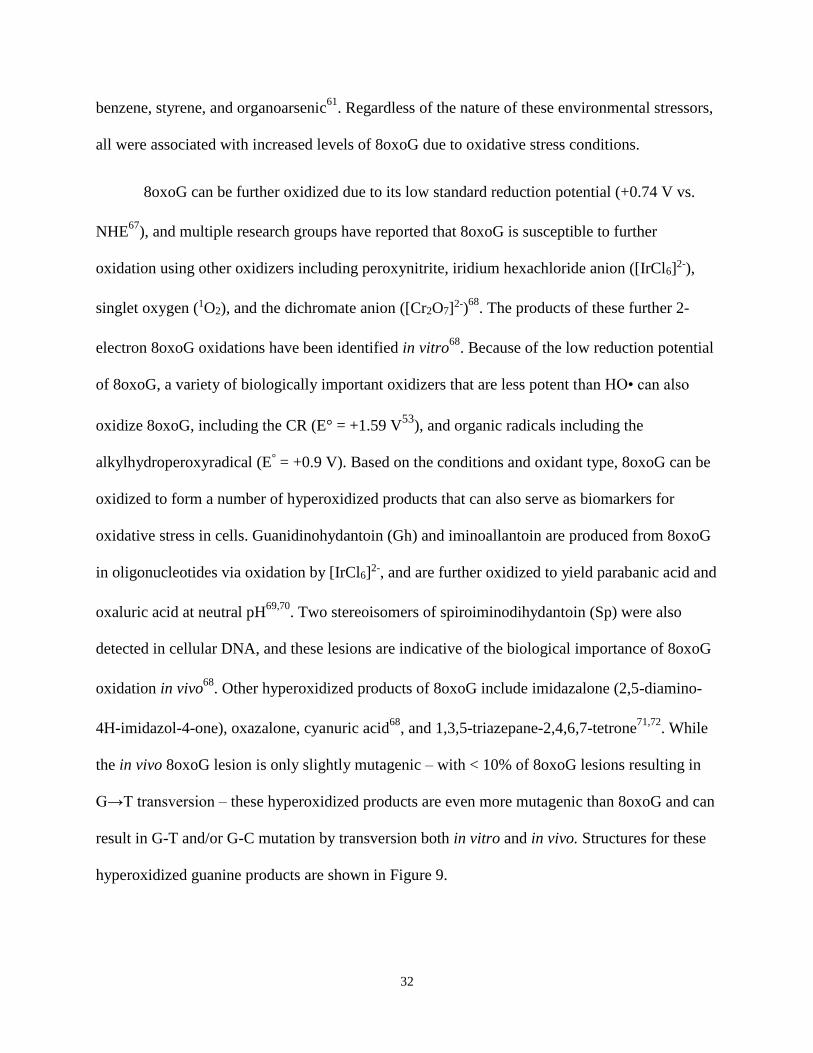
hyperoxidized guanine products are shown in Figure 9.
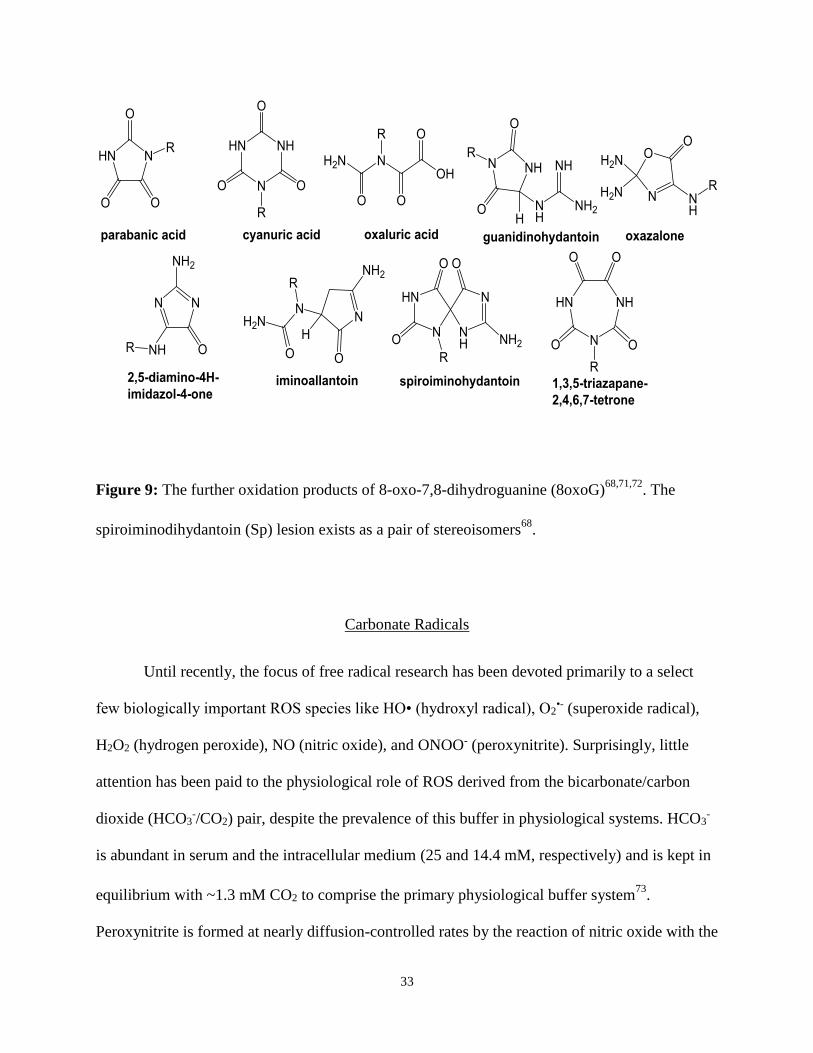
33
Figure 9: The further oxidation products of 8-oxo-7,8-dihydroguanine (8oxoG)68,71,72
. The
spiroiminodihydantoin (Sp) lesion exists as a pair of stereoisomers68
.
Carbonate Radicals
Until recently, the focus of free radical research has been devoted primarily to a select
few biologically important ROS species like HO• (hydroxyl radical), O2•- (superoxide radical),
H2O2 (hydrogen peroxide), NO (nitric oxide), and ONOO- (peroxynitrite). Surprisingly, little
attention has been paid to the physiological role of ROS derived from the bicarbonate/carbon
dioxide (HCO3-/CO2) pair, despite the prevalence of this buffer in physiological systems. HCO3
-
is abundant in serum and the intracellular medium (25 and 14.4 mM, respectively) and is kept in
equilibrium with ~1.3 mM CO2 to comprise the primary physiological buffer system73
.
Peroxynitrite is formed at nearly diffusion-controlled rates by the reaction of nitric oxide with the
34
superoxide radical anion (Reaction 1.1)74
. This peroxynitrite then goes on to further react with
the CO2 (Reaction 1.2) of the bicarbonate buffer to produce the intermediate
nitrosoperoxycarbonate anion, which further undergoes homolytic O-O bond cleavage to yield
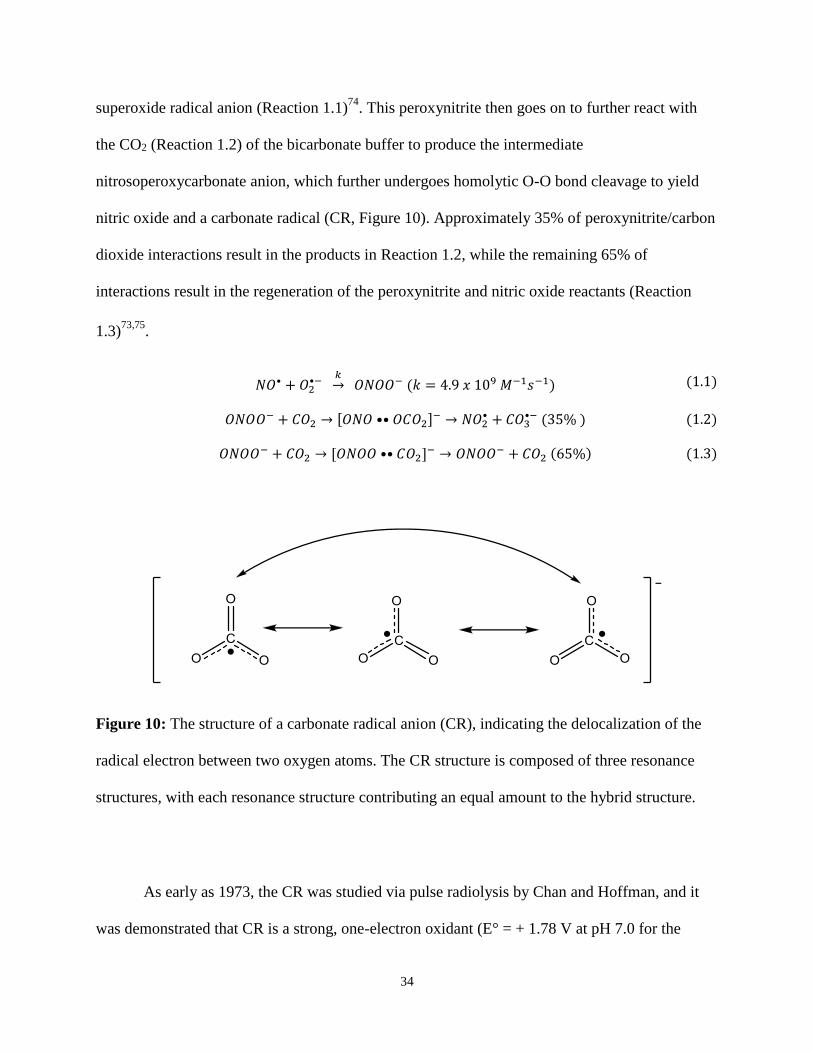
nitric oxide and a carbonate radical (CR, Figure 10). Approximately 35% of peroxynitrite/carbon
dioxide interactions result in the products in Reaction 1.2, while the remaining 65% of
interactions result in the regeneration of the peroxynitrite and nitric oxide reactants (Reaction
1.3)73,75
.
𝑁𝑂• + 𝑂2•−
𝑘→ 𝑂𝑁𝑂𝑂− (𝑘 = 4.9 𝑥 109 𝑀−1𝑠−1) (1.1)
𝑂𝑁𝑂𝑂− + 𝐶𝑂2 → [𝑂𝑁𝑂 •• 𝑂𝐶𝑂2]− → 𝑁𝑂2• + 𝐶𝑂3
•− (35% ) (1.2)
𝑂𝑁𝑂𝑂− + 𝐶𝑂2 → [𝑂𝑁𝑂𝑂 •• 𝐶𝑂2]− → 𝑂𝑁𝑂𝑂− + 𝐶𝑂2 (65%) (1.3)
Figure 10: The structure of a carbonate radical anion (CR), indicating the delocalization of the
radical electron between two oxygen atoms. The CR structure is composed of three resonance
structures, with each resonance structure contributing an equal amount to the hybrid structure.
As early as 1973, the CR was studied via pulse radiolysis by Chan and Hoffman, and it
was demonstrated that CR is a strong, one-electron oxidant (E° = + 1.78 V at pH 7.0 for the
35
carbonate radical/bicarbonate pair75
) capable of oxidizing many diverse substrates with rate
constants over the range of ~105 to 1010 M-1 s-1 76
. CR oxidizes appropriate electron donors via
electron transfer mechanisms. The CR exhibits a broad optical absorption in the visible range,
with a maximum at 600 nm (ε = 1970 M-1 cm-1 77). It is possible to monitor the formation of CR
and the reactions carried out by CR by visible spectroscopy in the 500-700 nm range. CR acts
primarily as a one-electron oxidizer and can oxidize many organic and inorganic compounds78
.
CR is negatively charged over the range of physiological pH, including those of acidic pH such
as the phagolysosomes of phagocytic cells and ischemic tissues73
. Recent studies have
established that the CR is a very strong acid with a pKa < 073,79
.
In Vivo and In Vitro CR Production
CRs are produced in vivo through several channels. As early as 1976, it was proposed
that CRs were formed as a byproduct of acetaldehyde oxidation by xanthine oxidase80
. However,
it was not until the 1990s that the role of CR in producing biologically relevant oxidative damage
became elucidated. During this time, it was demonstrated by Lymar and Hurst that CR is
produced as an intermediate product in the reaction between CO2 and peroxynitrite (ONOO-)74
.
Later, it was explicitly shown by Bonini et al. in continuous-flow EPR studies that CRs are
formed as the result of this reaction81
. Recently, CR has been proposed to be a key mediator of
the oxidative damage resulting from peroxynitrite production, xanthine oxidase turnover, and
superoxide dismutase (SOD) peroxidase activity73,75,76
. CRs can also be produced via the
reaction between HO• and HCO3- (Reaction 1.4, next page)
75,76,82.
36
𝐻𝐶𝑂3− + 𝐻𝑂•
𝑘→ 𝐻2𝑂 + 𝐶𝑂3
•− (𝑘 = 1.0 𝑥 107𝑀−1𝑠−1) (1.4)
CRs are overproduced at sites of inflammation via the homolytic bond cleavage of
nitrosoperoxycarbonate53
, and as such is a biologically important ROS. CRs are especially
important in ischemia/reperfusion due to low concentrations of oxygen and high concentrations
of CO2 and NO. Natural formation of oxidants during the initiation of events in
ischemia/reperfusion can result in oxidant formation followed by tissue damage83
. The
abundance of NO and endogenously generated O2•- during these times of oxidative stress can
result in the production of peroxynitrite, which coupled with ubiquitous CO2, can result in the
formation of the CR. Liochev and Fridovich76
also reported recently that CR plays some role in
enhancement of the peroxidase activity of SOD. In the presence of CO2, the oxidant bound to
SOD is responsible for attacking a histidine residue in the ligand field of the copper (specifically,
CuSOD), which inactivates the enzyme. In the presence of CO2, a CR is formed as a side product
by SOD activity, and the CO2 present in this system does not protect SOD against inactivation by
H2O2 since a fraction of the generated CR inactivates the enzyme by oxidizing the histidine
residue76
.
Methods of in vitro CR generation include the photolysis of carbonato-metal complexes,
specifically carbonatotetrammine cobalt(III) and carbonatopentammine cobalt (III)84
(Reaction
1.5), as well as photolysis of solutions of persulfate and bicarbonate salts, yielding sulfate
radicals (SR, Reaction 1.6, ϕ308 = 0.5585
) which then react with bicarbonate anions to produce
CR (Reaction 1.7), and one-electron oxidations of bicarbonate anions by hydroxyl radicals to
form CR (Reaction 1.4, above).
37
[𝐶𝑜(𝑁𝐻3)𝑛𝐶𝑂3]+ + ℎ𝜈 → 𝐶𝑜2+ + 𝑛 𝑁𝐻3 + 𝐶𝑂3•−
𝑛 = 4 𝑜𝑟 5 (1.5)
𝑆2𝑂82− + ℎ𝜈 → 2𝑆𝑂4
•− (𝜙308 = 0.55) (1.6)
𝑆𝑂4•− + 𝐻𝐶𝑂3
− → 𝑆𝑂42− + 𝐶𝑂3
•− + 𝐻+ (1.7)
Shafirovich and his research group have extensively studied reactions of one-electron
oxidation of guanine residues in DNA and model DNA oligos86
by CR. In most of these works,
CRs were generated by flash photolysis of persulfate anions (S2O82-) in the presence of
bicarbonate anions (HCO3-). The persulfate/bicarbonate solutions were subjected to pulses from
a XeCl excimer laser (308 nm), which generated sulfate radicals (SRs) through photodissociation
(Reaction 1.6). The resulting SR then further reacted with the HCO3- to yield sulfate anion and
CR (Reaction 1.7), with a rate constant of k = (4.6 ± 0.5) x 106 M-1 s -1 77. It was their finding that
guanine is the only target of one-electron abstraction reactions by CR86
, and the bimolecular rate
constant for guanine oxidation by CR was (1.9 ± 0.2) x 107 M-1 s-1 46
. Duplexes with single G
and contiguous GG and GGG sequences have similar second-order rate constants when oxidized
by CR, which differs from other ROS studied. Regardless of the number or distribution of
guanine in the duplexes, the G were oxidized by CR at nearly equivalent rate constants over the
limited range of 1.5 – 3.0 x 10⁷ M-1s-1 77
.
The oxidation of G by CR leads to the formation of Sp and Gh lesions, with a preference
for the Sp lesion86
. This Sp lesion is the result of a four-electron site-selective oxidation of G and
8oxoG residues by CR, and the oxidation of guanine to Sp occurs via the formation of 8oxoG
lesion intermediates87
. The Sp lesions are considered as the terminal products of G and 8oxoG
oxidation in DNA by CR87
. In addition to these 8oxoG oxidation products, Shafirovich et al.
38
found that oxidation of the single guanine in model oligos (5΄-CCATCGCTACC) yields
intrastrand cross-linked oxidation products of 5΄-CCAT*CG*CTACC (minor) and 5΄-
CCATCG*CT*ACC (major) – the latter of which can be referred to as 5΄-…G*CT* lesions86
.
The reaction scheme in Figure 11 (p. 40) shows the mechanism for generation of the Sp, Gh, and
5΄-…G*CT* lesions proposed by Shafirovich et al. Additional studies by Shafirovich et al.
sought to determine the effect of cytosine base bridging on cross-link formation in a series of 5΄-
d(GpCnpT) and 5΄-d(TpCnpC) with n = 0, 1, 2, and 3, and cross-linking in a 12-mer duplex
derived from the self-complementary 5΄-d(TTACGTACGTAA) sequence88
. This research
determined that the 5΄-d(G*pCpT*) crosslink was the most abundant intrastrand cross-link in
these experimental conditions88
.
Recent work by the Shafirovich research group has been dedicated to the investigation of
guanine-thymidine cross-links in DNA mediated by the peroxynitrite/carbon dioxide system. In
vitro experiments by Shafirovich et al. have shown that guanine lesions generated by
decomposition products of nitrosoperoxycarbonate (ONOOCO3) include not only oxidation
products, but nitration products as well89
. Of the radical species generated by the decomposition
of nitrosoperoxycarbonate, only the CR can directly react with guanine in DNA, due to its high
reduction potential89
. The •NO2 radical has a lower reduction potential (E° = + 1.04 V vs.
NHE89
), and hence it is a milder oxidant. As a milder oxidant, nitric oxide is unable to react with
guanine directly. Further research by Shafirovich et al. demonstrated that these cross-links and
known guanine oxidation products are also formed in native double-stranded DNA exposed to
peroxynitrite in aqueous solutions of carbon dioxide/bicarbonate, and the relative yields of the
G*-T* cross-links to other known DNA lesions89
.
39
Despite extensive research on CR-mediated guanine damage, Shafirovich's research
group has never considered the potential reactions between CRs and the 2΄-deoxyribose moiety
of DNA. The first hypothesis of the present work is that CRs can also damage DNA at the sugar
moiety, and that this process is initiated by hydrogen abstraction by CR from 2΄-deoxyribose.
CRs have been shown to abstract hydrogens from carbohydrates but at a much slower rate than
hydroxyl radicals. Extensive chain scission of glycosaminoglycans, long-chain linear
polysaccharides, has been observed by both OH and CO3−
90,91. CR were less efficient in
hydrogen abstraction from target polysaccharides than hydroxyl radical and, according to ESR
spin trapping experiments with model monosaccharides, show different patterns of hydrogen
abstraction than hydroxyl radicals, presumably due to lower hydrogen abstraction ability90,91
.
Chen and Hoffman determined the second-order rate constant of the hydrogen abstraction
reaction between CR and glucose to be 7 x 10⁴ M-1 s-1 92
, indicating that CRs do indeed react
with sugars. Carlsson confirmed that CRs react with D-glucose primarily through abstraction of
the C1΄ hydrogen93
; this trend can be applied to other sugar groups including 2΄-deoxyribose.
40
Figure 11: The mechanism of formation of Sp, Gh, and 5΄-…G*CT* lesions proposed by
Shafirovich et al. in DNA oligonucleotide sequence (5΄-d(CCATCGCTACC) context86
41
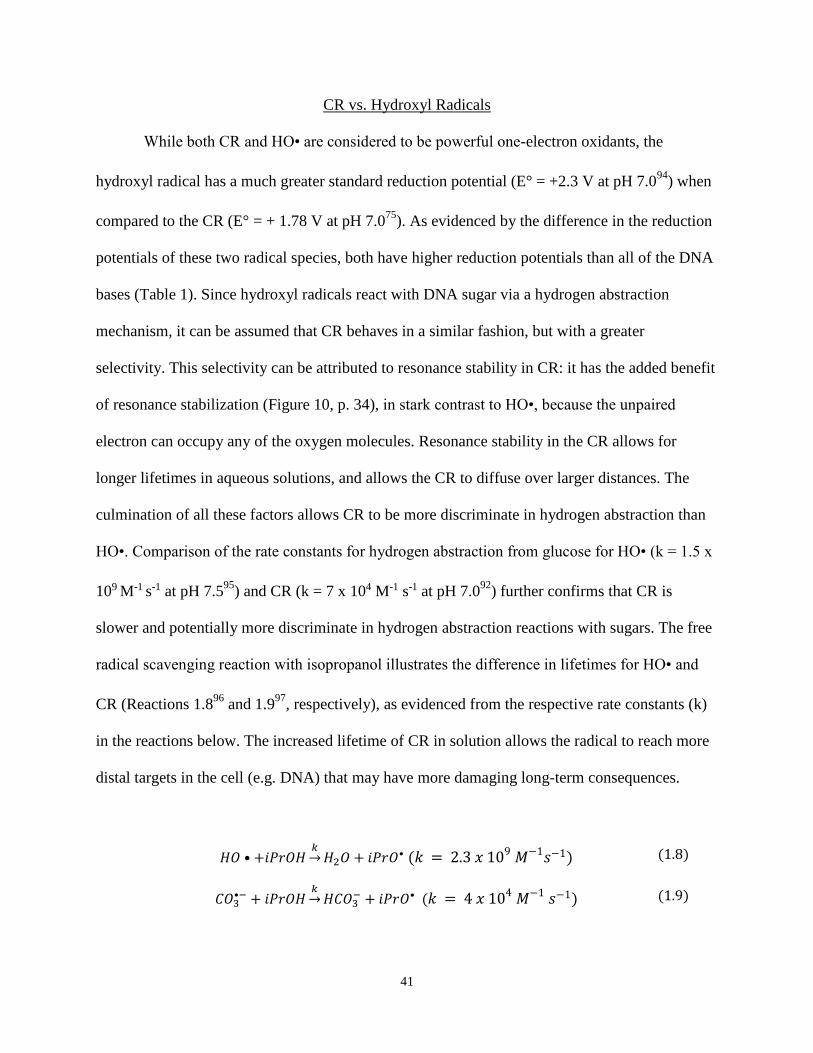
CR vs. Hydroxyl Radicals
While both CR and HO• are considered to be powerful one-electron oxidants, the
hydroxyl radical has a much greater standard reduction potential (E° = +2.3 V at pH 7.094
) when
compared to the CR (E° = + 1.78 V at pH 7.075
). As evidenced by the difference in the reduction
potentials of these two radical species, both have higher reduction potentials than all of the DNA
bases (Table 1). Since hydroxyl radicals react with DNA sugar via a hydrogen abstraction
mechanism, it can be assumed that CR behaves in a similar fashion, but with a greater
selectivity. This selectivity can be attributed to resonance stability in CR: it has the added benefit
of resonance stabilization (Figure 10, p. 34), in stark contrast to HO•, because the unpaired
electron can occupy any of the oxygen molecules. Resonance stability in the CR allows for
longer lifetimes in aqueous solutions, and allows the CR to diffuse over larger distances. The
culmination of all these factors allows CR to be more discriminate in hydrogen abstraction than
HO•. Comparison of the rate constants for hydrogen abstraction from glucose for HO• (k = 1.5 x
109 M-1 s-1 at pH 7.595
) and CR (k = 7 x 10⁴ M-1 s-1 at pH 7.092
) further confirms that CR is
slower and potentially more discriminate in hydrogen abstraction reactions with sugars. The free
radical scavenging reaction with isopropanol illustrates the difference in lifetimes for HO• and
CR (Reactions 1.896
and 1.997
, respectively), as evidenced from the respective rate constants (k)
in the reactions below. The increased lifetime of CR in solution allows the radical to reach more
distal targets in the cell (e.g. DNA) that may have more damaging long-term consequences.
𝐻𝑂 • +𝑖𝑃𝑟𝑂𝐻𝑘→ 𝐻2𝑂 + 𝑖𝑃𝑟𝑂• (𝑘 = 2.3 𝑥 109 𝑀−1𝑠−1) (1.8)
𝐶𝑂3•− + 𝑖𝑃𝑟𝑂𝐻
𝑘→ 𝐻𝐶𝑂3
− + 𝑖𝑃𝑟𝑂• (𝑘 = 4 𝑥 104 𝑀−1 𝑠−1) (1.9)
42
The second hypothesis of the present work is based on the comparison of hydrogen
abstracting abilities of HO• and CR. CR as slow, selective hydrogen abstractor is expected to
show a higher preference for weaker bound hydrogens in DNA sugar (H1´) rather than for more
solvent accessible hydrogens (H5´), in contrast to HO• as a fast, indiscriminate hydrogen
abstractor. As a result, a higher ratio of the C1´/C5´ products is expected for CR-mediated DNA
sugar damage as compared to HO•-mediated damage.
Quantitative Analysis of DNA Sugar and Base Damage Products Using HPLC
The Roginskaya research group has established an HPLC-based method of qualitative
and quantitative analysis of DNA sugar damage based on quantitative detection of low-molecular
weight products released as the result of DNA sugar damage14-17
. Our employed methodology
makes use of the propensity of oxidized DNA lesions to undergo fragmentation of the 2´-
deoxyribose ring by catalytic and/or heat treatment. Typically, such fragmentation produces a
strand break, a free DNA base, and a characteristic low-molecular weight product. The products
of these catalytic/heat treatments are unique to the precursor 2΄-deoxyribose lesion.
C1΄and C5΄ Pathways
The formation of C1΄ and C5΄ products from precursor lesions – 5MF from dL (Figure 3,
p. 21) and Fur from 5΄-Ald (Figure 4, p.23), respectively – is catalyzed by the reaction of the
appropriate precursor lesion with a cationic form of polyamine/polypeptide (in this work,
spermine or poly-L-lysine (polyL)). The reaction conditions were optimized by the Roginskaya
group14-16
and the results of this optimization indicate that both 5MF and Fur achieve their
43
kinetic saturation/steady state concentrations at 70 °C within 25-30 minutes of heating in the
presence of a polyamine. Ha et al. found that spermine, which is present in millimolar
concentrations in the cellular nucleus, can function directly as a radical scavenger, among other
functions including regulation of gene expression, stabilization of chromatin, prevention of
endonuclease-mediated DNA fragmentation, and inhibition of DNA damage98
. The binding
constants of spermine to DNA over a range of ionic strengths were obtained by Braunlin et al.,
and it was found that as ionic strength in solution increases, there is a significant decrease in the
ability of spermine to bind to DNA (K = (11 ± 2) x 10-3 M-1 at 71 mM [Na+] vs. (0.82 ± 0.1) x
10-3 M-1 at 154 mM [Na+])99
. Braunlin et al. also found that the binding of polyamines to DNA is
increased with temperature; by holding the ionic strength constant, they were able to discern that
increased temperature correlated with increases in the binding of spermine to DNA99
.
Our research group also determined the release of 5MF upon treatment of irradiated DNA
with spermine to be quantitative, and the amount of 5MF was found to be a direct measure of the
amount of dL precursor lesion present in the irradiated DNA14-16
. Both 5MF and Fur are released
during the heat treatment of DNA in the presence of a DNA-binding catalyst with Lewis acid
properties such as spermine or polyL14-16
. The reaction for formation of 5MF from the precursor
lesion (dL) is shown in Figure 12 and the reaction for the formation of Fur from the precursor
lesion (5΄-Ald) is shown in Figure 13.

44
Figure 12: The formation of 5-methylenefuran-2-one (5MF) from the 2΄-deoxyribonolactone
precursor lesion
Figure 13. The formation of furfural (Fur) from the 5΄-aldehyde precursor lesion
C4΄ Pathway
Lac Formation. The C4΄-OAS is capable of reacting – under neutral or slightly acidic
conditions – with primary amines (RNH2) to form N-substituted 5-methylene-Δ3-pyrrolin-2-
45
ones. The specific product of the reaction is dependent on the structure of the primary amine
used to derivatize the C4΄-OAS. Yields from these derivatization reactions are nearly
quantitative (greater than 75%)100-102
, and the resulting lactams are easily quantified by HPLC
with UV detection due to a fairly strong characteristic absorption below 350 nm100,103
. Whereas
traditional fluorimetric33
and GC/MS methods34
of determining the yield of C4΄-OAS have relied
extensively on multiple derivatization steps and calibration with well-characterized authentic
oligonucleotides, the cost-prohibitive nature of such oligonucleotides makes the technique
difficult to reproduce17
.
Determination of the contribution of the lactam C4΄ pathway is facilitated by
quantification of the relative yield of 1-N-oxycarbonylmethyl-5-methyleneazacyclopent-3-ene
(azalactone, lactam, or Lac) produced from the derivatization of the C4΄-OAS by a primary
amine17
; in this work, this primary amine used was specifically glycine (R = CH2COOH).
Choosing glycine as the derivatizing agent for HPLC quantification of C4΄-OAS through the
formation of Lac was based on several advantages of this reagent over other primary amines
previously studied by our research group. Due to glycine’s small, hydrophilic, and zwitterionic
nature, glycine is not retained under reverse-phase separation conditions, it creates a slightly
acidic medium optimal for derivatization, and it does not interfere with subsequent precipitation
of DNA by protamine17
. The derivatization reaction between the C4΄-OAS and glycine is shown
in Figure 14.

46
Figure 14. Formation of lactam (Lac) from the C4΄-OAS precursor lesion
Lac is formed rapidly at 70 °C in the presence of glycine, and of all the lactam derivatives
previously tested by the Roginskaya research group17
has the highest relative yield based off
peak area ratios in HPLC. Lac is also stable at the derivatization temperature, does not co-elute
with any significant DNA damage products, and quantification of Lac can easily be performed
photometrically due to the known absorption characteristics17
.
Specific Aims
The objective of the current work was to, firstly, determine the optimal method of CR
generation in DNA solutions that is suitable for our novel method of HPLC detection. The choice
of the optimal method of CR generation is dependent on the requirement of effective
minimization of side reactions that can affect the quality of HPLC spectra, especially those
reactions which compete with the reactions of interest between the CR and DNA 2΄-deoxyribose.
47
The second goal of the current work was to prove the hypothesis that CR is capable of
oxidizing DNA 2΄-deoxyribose in a similar manner to the well-studied hydroxyl radical by
analysis of the preference of hydrogen abstraction by CR from the 2΄-deoxyribose moiety of
DNA. The selectivity of these two ROS has been compared to prove that CR is a more
discriminate hydrogen abstractor than HO•. In order to prove the above hypothesis, the major
products of 2΄-deoxyribose oxidation – 5MF, Lac, Fur, and MDA – by CR have been determined
for both double-stranded (ds) and single-stranded (ss) DNA, and the relative yields of each
product have been compared with those obtained from hydroxyl radical-mediated oxidation of
2΄-deoxyribose.
Lastly, the reaction rates of CR with DNA nucleobases – in particular, guanine – have
been compared to the reaction rates of the same radical with 2΄-deoxyribose in order to
determine the ratio of base damage to sugar damage (See Chapter 3).
48
CHAPTER 2
EXPERIMENTAL METHODS
Instrumentation, Glassware, and Other Materials
Instrumentation
A Shimadzu High Performance Liquid Chromatograph (HPLC), equipped with a
degasser, autosampler, column oven, photodiode array (PDA) consisting of a tungsten lamp and
deuterium lamp, and an analytical column (Phenomenex Gemini™, C18, reversed phase, 250
mm x 4.6 mm, 5 μm) was used as the primary instrument for data collection. Additionally, a
Cary 100 ultraviolet-visible (UV-vis) spectrophotometer from Agilent was used for
spectroscopic determination of concentrations of prepared solutions. X-ray radiation was
generated via a Phillips X-ray tube with a tungsten anode, courtesy of Dr. David Close
(Department of Physics and Astronomy, East Tennessee State University). A high pressure
Xe(Hg) lamp from Optical Building Blocks Corporation was used as the primary source of UV
light for photolysis experiments. Additional instrumentation used in this research included a
laboratory analytical balance, oven, microprocessor-controlled hot water bath, and vortex mixer,
all from Fisher Scientific.
Glassware and Other Materials
Additional important glassware and materials, including beakers, graduated cylinders,
volumetric flasks, Pasteur pipettes, glass vials, Wheaton ampoules (pre-scored), graduated
49
pipettes, mechanical pipettes with appropriate pipette tips, graduated plastic vials (1.5 mL),
centrifuge tubes (50 mL and 15 mL), and magnetic stirring bars of varying sizes were all used
extensively throughout experimentation. HPLC inserts (200 μL) from Fisher were used to reduce
the volume of solution needed for HPLC analysis. Matched quartz cuvettes were used in all
spectrophotometric measurements.
Reagents
Deoxyribonucleic Acid
The sodium salt of salmon testes deoxyribonucleic acid (DNA) was purchased from
Sigma-Aldrich Chemical Company.
Carbonatopentamminecobalt(III) Perchlorate
Carbonatopentamminecobalt(III) perchlorate (Co(NH3)5CO3]ClO4) was synthesized in
our research lab according to the procedure published in Basolo and Murmann104
, and its identity
was confirmed by IR and UV-vis spectroscopy.
DNA Reagents
Spermine tetrahydrochloride, glycine, protamine sulfate, and poly-L-lysine hydrochloride
(polyL) (MW per one lysine hydrochloride = 149.45 g/mol, total MW > 30 000) were purchased
from Sigma-Aldrich.
50
HPLC Solvents
Two distinct mobile phases were used during HPLC separation and analysis; the first was
40 mM aqueous ammonium acetate (prepared from 4 M stock solution of ammonium acetate,
ACS reagent grade) in HPLC-grade water (both components of this buffer system were provided
by Fisher); the second was an aqueous solution of 80% acetonitrile (CH3COCN) prepared from
HPLC-grade acetonitrile (from VWR) and HPLC-grade water.
4 M ammonium acetate was prepared by dissolving 154 g of ammonium acetate in a
small volume of HPLC-grade water contained in a small beaker. After complete dissociation, the
solution was transferred to a 500 mL volumetric flask, the solution was diluted to the mark on
the volumetric flask, and stirred using a magnetic stirring bar to ensure homogeneity. The 80%
(v/v) acetonitrile was prepared by combining 4 volumes of HPLC-grade acetonitrile with 1
volume of HPLC-grade water.
Buffers, Solutions, and Gases
All stock solutions were prepared using HPLC-grade water. 1 M stock solutions of
potassium monobasic phosphate (KH2PO4) and potassium dibasic phosphate (K2HPO4) from
Sigma were mixed in equal volumes to make a 1 M phosphate buffer system, pH = 6.9. This
stock solution of phosphate buffer was diluted by a factor of 100 to yield 10 mM phosphate
buffer with the same pH as the stock solution. This phosphate buffer was used in nearly all
experimental protocols to maintain near-physiological pH.
Carbon dioxide gas (100% purity) and molecular oxygen gas (USP) provided by Airgas
were used for sample purging.
51
Preparation of DNA Solutions. DNA solutions were prepared at 10 mM concentration
(here and elsewhere in this text, DNA concentration is expressed per DNA nucleotide) by mixing
36 mg ST DNA (average MW per nucleotide = 360 g/mol) sodium salt with 10 mL of 10 mM
phosphate buffer, pH 6.9. Following addition of the DNA, the solution was allowed to soak
overnight at 4°C, and the following day it was stirred gently for 1 hour to ensure homogeneity.
Other Stock Solutions. The following aqueous stock solutions were prepared in HPLC-
grade water and kept at +4oC: 100 mM spermine tetrahydrochloride, 100 mM poly-L-lysine
(PolyL) and 2 M glycine 10x stock solutions were used to catalyze the formation of low
molecular weight end products of DNA sugar damage. A saturated solution of protamine sulfate
from salmon testes (salmine) was prepared for precipitation of DNA. 100 mM potassium
persulfate 10x stock solution was used in the generation of CRs via UV photolysis of persulfate
in the presence of bicarbonate.
Other Reagents. A saturated solution of 0.67% (w/v) thiobarbituric acid was prepared for
MDA analysis. Pure MDA-TBA adduct was synthesized following protocols outlined in von
Sonntag et al.36
using 1,1,3,3-tetramethoxypropane and 2΄-thiobarbituric acid. The resulting
MDA-TBA adduct has a maximum absorption at 532 nm. Solid sodium bicarbonate was used in
X-irradiation of bicarbonate solution experiments. Glacial acetic acid liquid was used to
neutralize the sodium bicarbonate solutions during X-irradiation of bicarbonate solutions
experiments. All reagents above were obtained from Fisher Scientific or Sigma-Aldrich.
52
Fricke Dosimetry
This method is based on the oxidation of Fe2+ to Fe3+ by hydroxyl radicals produced by
radiolysis aqueous solutions. Fe3+ has a characteristic absorption maximum at 303 nm, but
absorption by Fe2+ may also be observed at this wavelength. It becomes necessary to calculate
the difference in the molar absorptivity of the two cations; Δε = 2201 M-1 cm-1 105
.
As a consequence of the received dose of ionizing radiation, the ferric ion accumulates
linearly with doses in the range from 0 to 400 Gy, and the plot of optical density at 303 nm vs.
time (d[OD303]/dt) is proportional to the dose rate (dD/dt), where D is the delivered dose to the
solution.
A stock Fricke solution containing 1 mM FeSO4 in 0.4 M sulfuric acid was prepared for
determination of the dose delivered by the X-ray generator. The X-ray beam was attenuated by
using a small copper disk. A small volume of this stock solution (100 μL) was placed into
Wheaton ampoules and X-irradiated for 0 (control), 30, 60, 90, 120, 180, and 300 s. The
resulting irradiated solutions were analyzed using the Cary 100 UV-vis spectrophotometer, and
the OD of the samples was plotted as a function of irradiation time. The resulting regression line
was used to calculate the dose via Equation 2.6 (p. 53). The derivation of Equation 2.6 follows
below.
Using the Beer-Lambert law, the absorbance of the Fe3+ cation can be expressed Equation
2.1, which is then partially differentiated with respect to time in order to yield Equation 2.2,
𝑂𝐷303 = 𝜀303 ∗ 𝑙 ∗ [𝐹𝑒3+] (2.1)
𝜕𝑂𝐷303
𝜕𝑡= 𝜀303 ∗ 𝑙 ∗
𝜕[𝐹𝑒3+]
𝜕𝑡 (2.2)
53
where 𝜕𝑂𝐷303
𝜕𝑡 is the rate of change in absorbance with respect to time, and can be represented as
the slope of the regression line obtained by plotting OD303 vs. time, and 𝜕[𝐹𝑒3+]
𝜕𝑡 is the rate of
accumulation of Fe3+ with time.
The quantity 𝜕[𝐹𝑒3+]
𝜕𝑡 can be expressed as the product of the density of the mixture, the
radiation chemical yield of Fe3+, and the partial derivative of dose with respect to time, 𝜕𝐷
𝜕𝑡, as
expressed in Equation 2.3. The density of a typical Fricke solution can be approximated as 1 kg
L-1, approximately the same as water, and the radiation chemical yield of Fe3+ is approximately
1.5 x 10⁻⁶ mol J-1 106 for X-rays in the range of 60 keV. Substitution of Equation 2.3 into
Equation 2.2 yields Equation 2.4, which can be rearranged to yield Equation 2.5.
𝜕[𝐹𝑒3+]
𝜕𝑡= 𝜌 ∗ 𝐺(𝐹𝑒3+
) ∗𝜕𝐷
𝜕𝑡 (2.3)
𝜕𝑂𝐷303
𝜕𝑡= 𝜀303 ∗ 𝑙 ∗ 𝜌 ∗ 𝐺(𝐹𝑒3+) ∗
𝜕𝐷
𝜕𝑡 (2.4)
𝜕𝐷
𝜕𝑡=
1
𝜀303 ∗ 𝑙 ∗ 𝜌 ∗ 𝐺(𝐹𝑒3+)∗
𝜕𝑂𝐷303
𝜕𝑡 (2.5)
Solving the leading term on the right-hand side of Equation 2.5 yields Equation 2.6.
𝑑𝐷
𝑑𝑡= 302.89 𝐽 𝑘𝑔−1 ∗
𝑑𝑂𝐷303
𝑑𝑡 (2.6)
where the units J kg-1 can be expressed as gray (Gy).
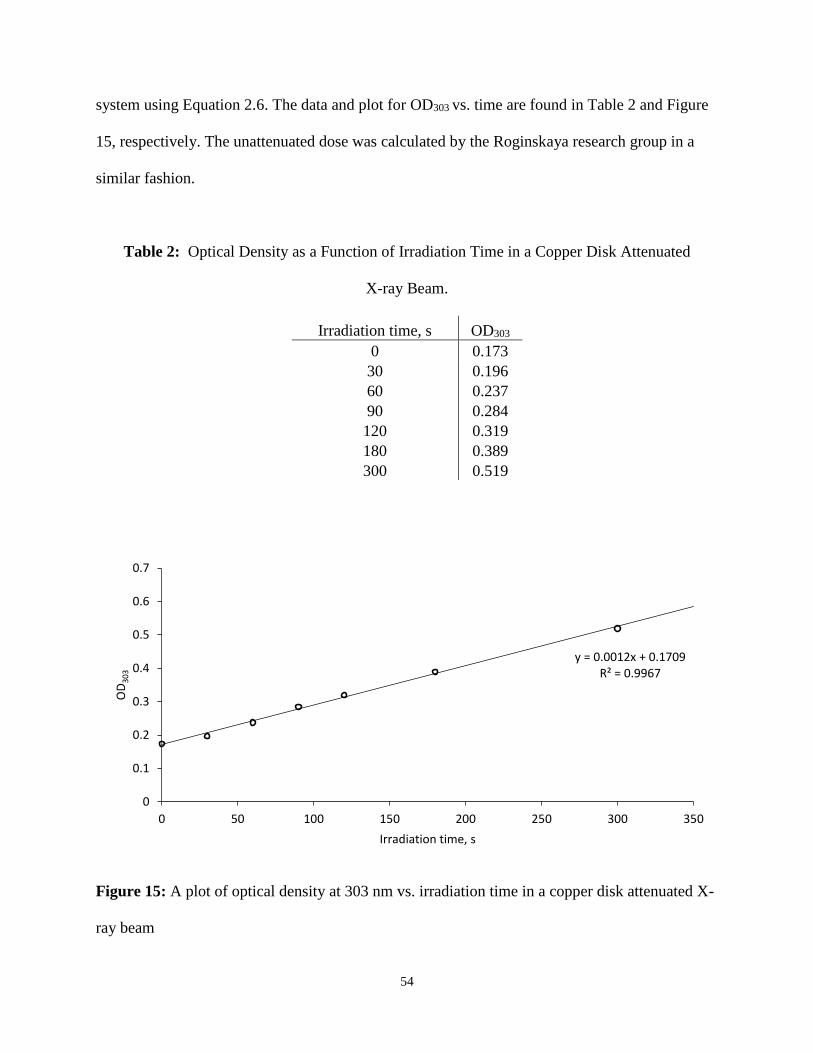
The data from the attenuated X-ray Fricke dosimetry were plotted, and the resulting
regression line (OD303 = 0.0012t + 0.1709) was used to calculate the attenuated dose rate of the
54
system using Equation 2.6. The data and plot for OD303 vs. time are found in Table 2 and Figure
15, respectively. The unattenuated dose was calculated by the Roginskaya research group in a
similar fashion.
Table 2: Optical Density as a Function of Irradiation Time in a Copper Disk Attenuated
X-ray Beam.
Irradiation time, s OD303
0 0.173
30 0.196
60 0.237
90 0.284
120 0.319
180 0.389
300 0.519
Figure 15: A plot of optical density at 303 nm vs. irradiation time in a copper disk attenuated X-
ray beam
y = 0.0012x + 0.1709R² = 0.9967
0
0.1
0.2
0.3
0.4
0.5
0.6
0.7
0 50 100 150 200 250 300 350
OD
30
3
Irradiation time, s
55
Methods of Generation of CR
Generation of CR by X-Irradiation of Bicarbonate Solutions
Preparation of Reaction Solution. A 5 mM solution of DNA was prepared by dilution of
stock 10 mM DNA solution in 10 mM phosphate buffer, pH = 6.9. Equal volumes of DNA and
phosphate buffer were combined and then were gently inverted to mix. Once prepared, the 5 mM
DNA solution was combined with 42 mg solid sodium bicarbonate per 1 mL of 5 mM DNA to
yield a solution of 5 mM DNA and 0.5 M NaHCO3. The solid was dissolved via magnetic
stirring bar and kept on ice until needed. Reaction solutions containing 1 M sodium bicarbonate
were prepared in an identical manner, with the exception of addition of 84 mg solid sodium
bicarbonate per 1 mL of 5 mM DNA.
X-Irradiation of Reaction Solution. The resulting reaction solution was divided into 210
μL aliquots and was placed into Wheaton ampoules for X-irradiation. Prior to X-irradiation, each
ampoule was bubbled with a ~3:1 mixture of CO2/O2 for 10 minutes. The 3:1 mixture of carbon
dioxide/oxygen was prepared by bubbling each gas through a round bottomed three-necked flask
containing water. The number of bubbles of each gas per 15 s time interval was recorded, and the
flow rates were adjusted to yield a ~3:1 mixture of CO2/O2. Following the adjustment of the flow
rates of each gas, the system was allowed to equilibrate for 10 minutes prior to bubbling of
ampoules.
Each ampoule was bubbled individually, and following bubbling with the gaseous
mixture ampoules were capped with Parafilm in order to minimize the evolution of CO2 gas.
Samples were then X-irradiated via Phillips X-ray generator (at 10.9 Gy/s dose rate determined
56
by Fricke dosimetry) for doses of 0 to 1957 Gy. Following irradiation, the samples were treated
with glacial acetic acid (7.2 μL) to neutralize the bicarbonate in solution, and the neutralized
solution was transferred to labeled plastic centrifuge vials (1.5 mL, graduated). Irradiated
solutions were kept on ice until needed. Once all samples were irradiated, each sample was
divided into two 100 μL aliquots and transferred to labeled vials for polyL treatment or glycine
treatment. Due to the high ionic strength of reaction solutions in this series of experiments
because of using high concentrations of bicarbonate, polyL was used to precipitate DNA from
solutions instead of spermine.
Generation of CR by Photolysis of Persulfate and Bicarbonate Solutions
Preparation of Reaction Solution. A solution of 5 mM DNA was prepared by mixing
equal volumes of 10 mM stock DNA solution with 10 mM phosphate buffer in a 15 mL
centrifuge tube. The tube containing the resulting solution was inverted gently several times to
ensure adequate mixing of the two solutions, yielding a 5 mM DNA solution. An appropriate
amount of solid sodium bicarbonate was added to the centrifuge tube to yield 5 mM DNA + 0.34
M sodium bicarbonate reaction solution. The solution was kept on ice until needed.
Reaction solutions were also prepared with varying concentrations of bicarbonate. The
mass of solid bicarbonate and the volume of glacial acetic acid required to neutralize these
solutions are summarized in Table 3, below, where the masses of sodium bicarbonate solid are
for 800 μL solution volumes prior to neutralization with glacial acetic acid.
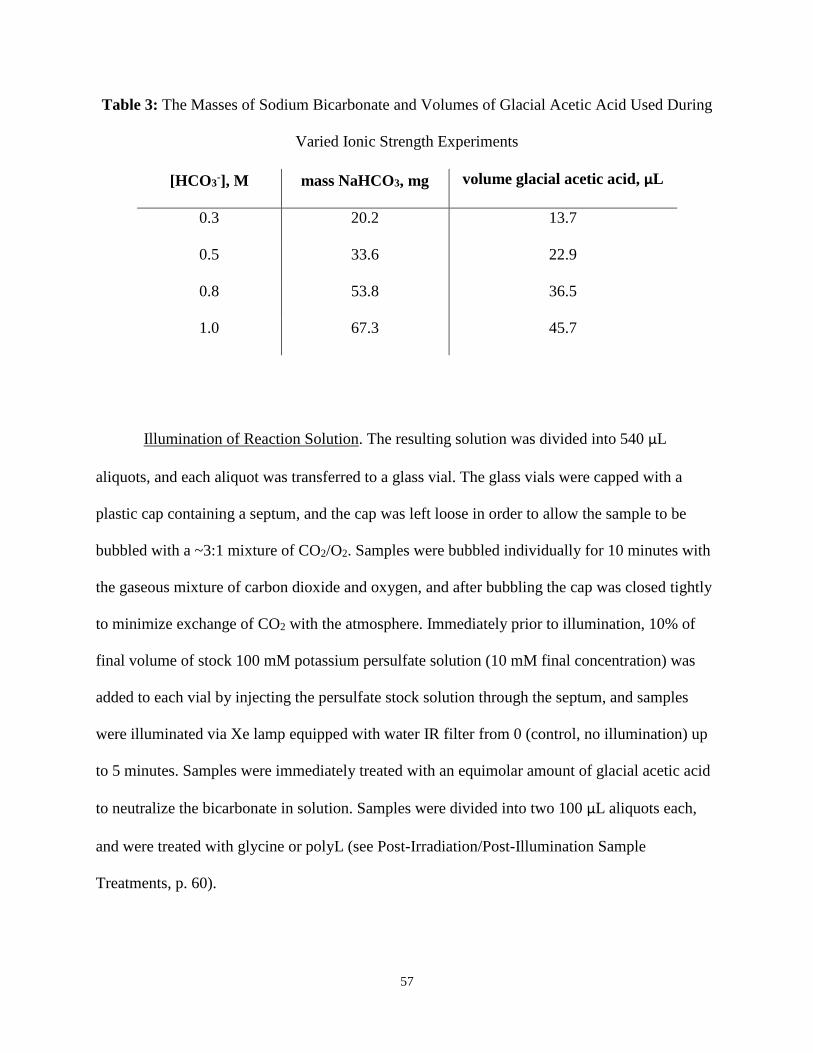
57
Table 3: The Masses of Sodium Bicarbonate and Volumes of Glacial Acetic Acid Used During
Varied Ionic Strength Experiments
[HCO3-], M mass NaHCO3, mg volume glacial acetic acid, μL
0.3 20.2 13.7
0.5 33.6 22.9
0.8 53.8 36.5
1.0 67.3 45.7
Illumination of Reaction Solution. The resulting solution was divided into 540 μL
aliquots, and each aliquot was transferred to a glass vial. The glass vials were capped with a
plastic cap containing a septum, and the cap was left loose in order to allow the sample to be
bubbled with a ~3:1 mixture of CO2/O2. Samples were bubbled individually for 10 minutes with
the gaseous mixture of carbon dioxide and oxygen, and after bubbling the cap was closed tightly
to minimize exchange of CO2 with the atmosphere. Immediately prior to illumination, 10% of
final volume of stock 100 mM potassium persulfate solution (10 mM final concentration) was
added to each vial by injecting the persulfate stock solution through the septum, and samples
were illuminated via Xe lamp equipped with water IR filter from 0 (control, no illumination) up
to 5 minutes. Samples were immediately treated with an equimolar amount of glacial acetic acid
to neutralize the bicarbonate in solution. Samples were divided into two 100 μL aliquots each,
and were treated with glycine or polyL (see Post-Irradiation/Post-Illumination Sample
Treatments, p. 60).
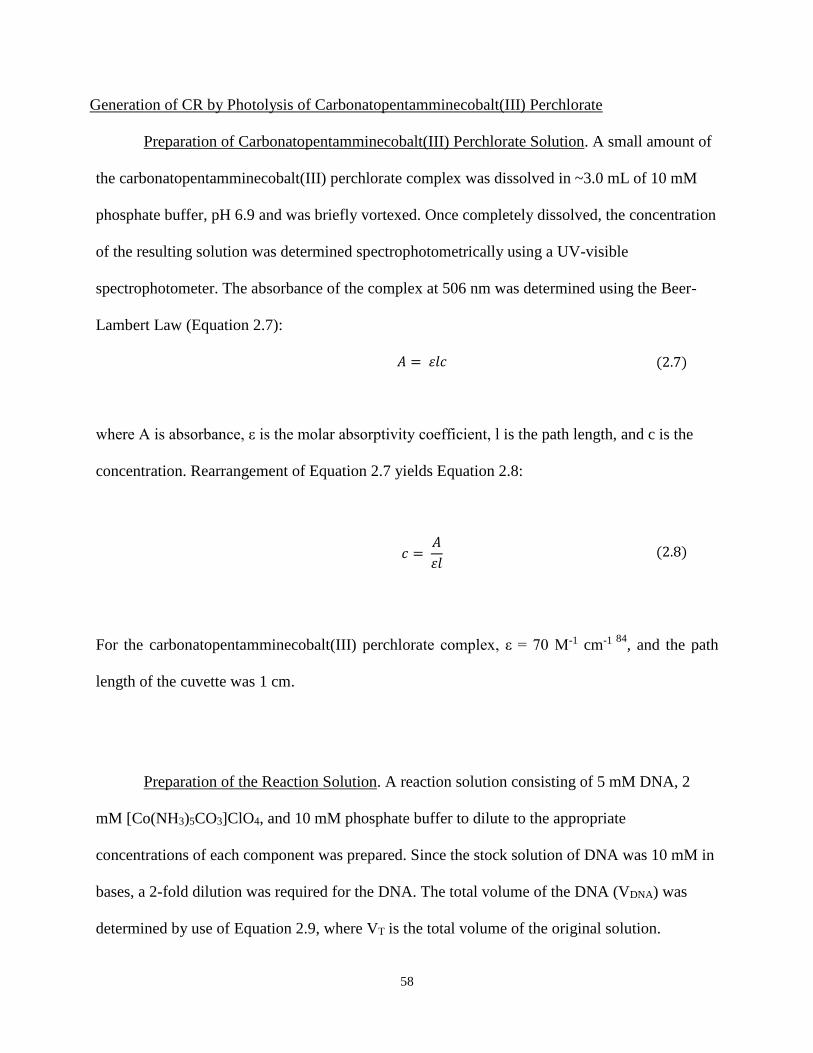
58
Generation of CR by Photolysis of Carbonatopentamminecobalt(III) Perchlorate
Preparation of Carbonatopentamminecobalt(III) Perchlorate Solution. A small amount of
the carbonatopentamminecobalt(III) perchlorate complex was dissolved in ~3.0 mL of 10 mM
phosphate buffer, pH 6.9 and was briefly vortexed. Once completely dissolved, the concentration
of the resulting solution was determined spectrophotometrically using a UV-visible
spectrophotometer. The absorbance of the complex at 506 nm was determined using the Beer-
Lambert Law (Equation 2.7):
𝐴 = 𝜀𝑙𝑐 (2.7)
where A is absorbance, ε is the molar absorptivity coefficient, l is the path length, and c is the
concentration. Rearrangement of Equation 2.7 yields Equation 2.8:
𝑐 =
𝐴
𝜀𝑙 (2.8)
For the carbonatopentamminecobalt(III) perchlorate complex, ε = 70 M-1 cm-1 84, and the path
length of the cuvette was 1 cm.
Preparation of the Reaction Solution. A reaction solution consisting of 5 mM DNA, 2
mM [Co(NH3)5CO3]ClO4, and 10 mM phosphate buffer to dilute to the appropriate
concentrations of each component was prepared. Since the stock solution of DNA was 10 mM in
bases, a 2-fold dilution was required for the DNA. The total volume of the DNA (VDNA) was
determined by use of Equation 2.9, where VT is the total volume of the original solution.
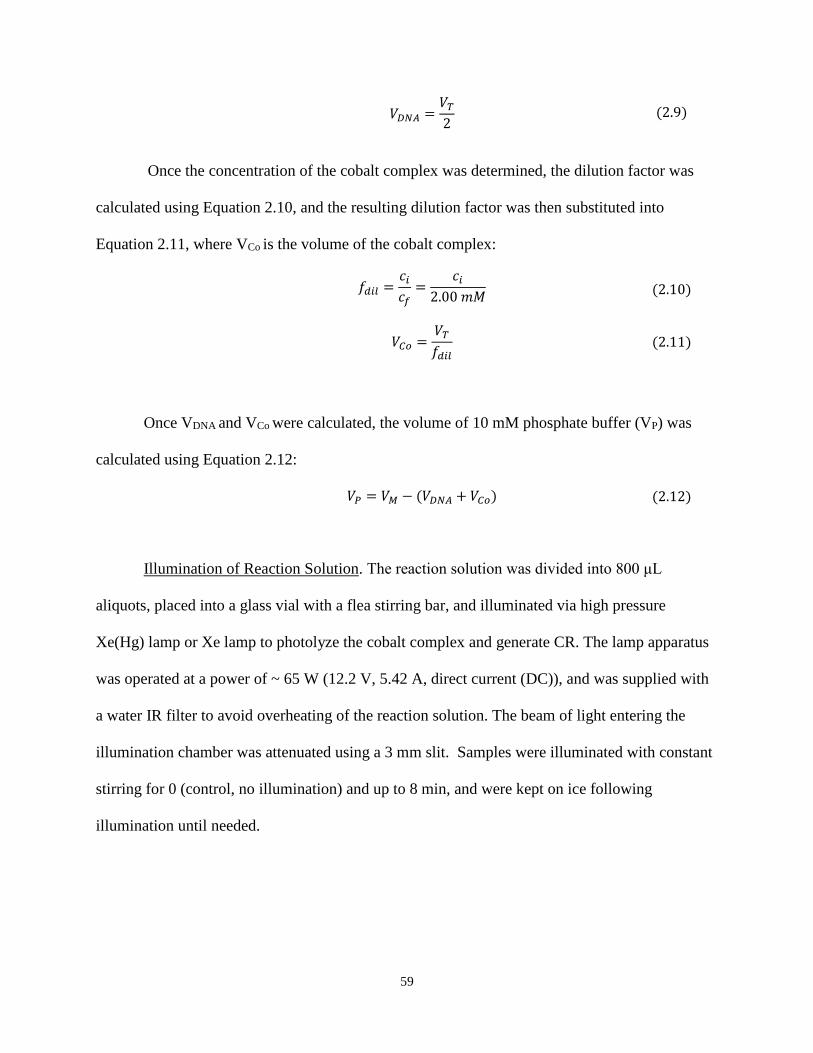
59
𝑉𝐷𝑁𝐴 =
𝑉𝑇
2 (2.9)
Once the concentration of the cobalt complex was determined, the dilution factor was
calculated using Equation 2.10, and the resulting dilution factor was then substituted into
Equation 2.11, where VCo is the volume of the cobalt complex:
𝑓𝑑𝑖𝑙 =𝑐𝑖
𝑐𝑓=
𝑐𝑖
2.00 𝑚𝑀 (2.10)
𝑉𝐶𝑜 =
𝑉𝑇
𝑓𝑑𝑖𝑙 (2.11)
Once VDNA and VCo were calculated, the volume of 10 mM phosphate buffer (VP) was
calculated using Equation 2.12:
𝑉𝑃 = 𝑉𝑀 − (𝑉𝐷𝑁𝐴 + 𝑉𝐶𝑜) (2.12)
Illumination of Reaction Solution. The reaction solution was divided into 800 μL
aliquots, placed into a glass vial with a flea stirring bar, and illuminated via high pressure
Xe(Hg) lamp or Xe lamp to photolyze the cobalt complex and generate CR. The lamp apparatus
was operated at a power of ~ 65 W (12.2 V, 5.42 A, direct current (DC)), and was supplied with
a water IR filter to avoid overheating of the reaction solution. The beam of light entering the
illumination chamber was attenuated using a 3 mm slit. Samples were illuminated with constant
stirring for 0 (control, no illumination) and up to 8 min, and were kept on ice following
illumination until needed.
60
Post-Irradiation/Post-Illumination Sample Treatments
Each of the following treatments catalyzes the formation of HPLC-detectable low-
molecular weight sugar damage products (SDP) in CR-damaged DNA. Spermine treatment was
utilized to quantify the conversion of C1΄ deoxyribosyl radicals to 5-methylenefuran-2-one
(5MF) and C5΄ deoxyribosyl radicals to furfural (Fur), as well as to quantify free, unaltered base
release (FBR). Glycine treatment was utilized to quantify the conversion of C4΄ deoxyribosyl
radicals to 1-N-(oxycarbonylmethyl)-5-methyleneazacyclopent-3-ene (lactam, or Lac). In
solutions with high ionic strength, the binding of spermine to DNA is disrupted, and poly-L-
lysine (polyL) was utilized in place of spermine for C1΄ and C5΄ analysis.
Heat Treatment with Spermine. Following illumination or irradiation, an aliquot from
each sample was placed into a labeled plastic tube for treatment with 10 mM spermine (final
concentration). 10% of the total volume of the stock solution of 100 mM spermine + 20 or 40
M uracil (as an HPLC internal standard) was added, vortexed for 15 s to precipitate DNA,
briefly centrifuged, and was then placed into a water bath at 70°C. Samples were heated in the
bath for 35 min, and following the heat treatment were cooled on ice for 1 min. After cooling, 10
μL of saturated protamine stock solution was added to each sample to precipitate any DNA
remaining in solution, and the samples were allowed to cool on ice for an additional 10 min to
allow for full precipitation of DNA. Following complete precipitation of DNA, samples were
centrifuged for 2 min to pelletize DNA, and the supernatant (typically, 200 μL) was transferred
to HPLC vials with plastic inserts for the 5MF, Fur, and FBR analysis.
61
Heat Treatment with Glycine. Following illumination, an aliquot from each sample was
placed into a labeled plastic vial for treatment with glycine and combined with 10% of final
volume the stock solution of 2 M glycine + 20 or 40 μM uracil, vortexed for 15 s, briefly
centrifuged, and was then placed into a water bath, set to 70°C. Samples were heated in the bath
for 20 minutes, and following the heat treatment were cooled on ice for 1 min. After cooling, 30
μL of saturated protamine stock solution was added to each sample to precipitate DNA
remaining in solution, and the samples were allowed to cool on ice for an additional 10 min to
allow for full precipitation of DNA. Following complete precipitation of DNA, samples were
centrifuged for 2 min to pelletize DNA, and typically 200 μL of the supernatant was transferred
to HPLC vials with plastic inserts for the Lac analysis.
Heat Treatment with PolyL. 10% of the solution volume of a 100 mM stock polyL
solution was added to 100 μL of X-irradiated or UV-vis illuminated samples to yield a final
concentration of 10 mM polyL. Samples were vortexed briefly, and precipitation of DNA was
observed. The solutions were allowed to remain on ice for 10 minutes to completely precipitate
DNA. Following precipitation, the samples were centrifuged for 2 minutes, and the supernatant
was discarded. The precipitate was washed twice with 10 mM phosphate buffer to remove any
unbound polyL from the precipitate. After each wash, the samples were vortexed briefly and
were centrifuged to separate the precipitate from the supernatant. The supernatant resulting from
each wash was discarded.
Following washing, 110 μL of 4 μM uracil in 10 mM phosphate buffer, pH 6.9 was added
to each sample, and the samples were heated in a 70°C water bath for 35 minutes as with
spermine. After heating, each sample was cooled on ice for 2 minutes. The samples were
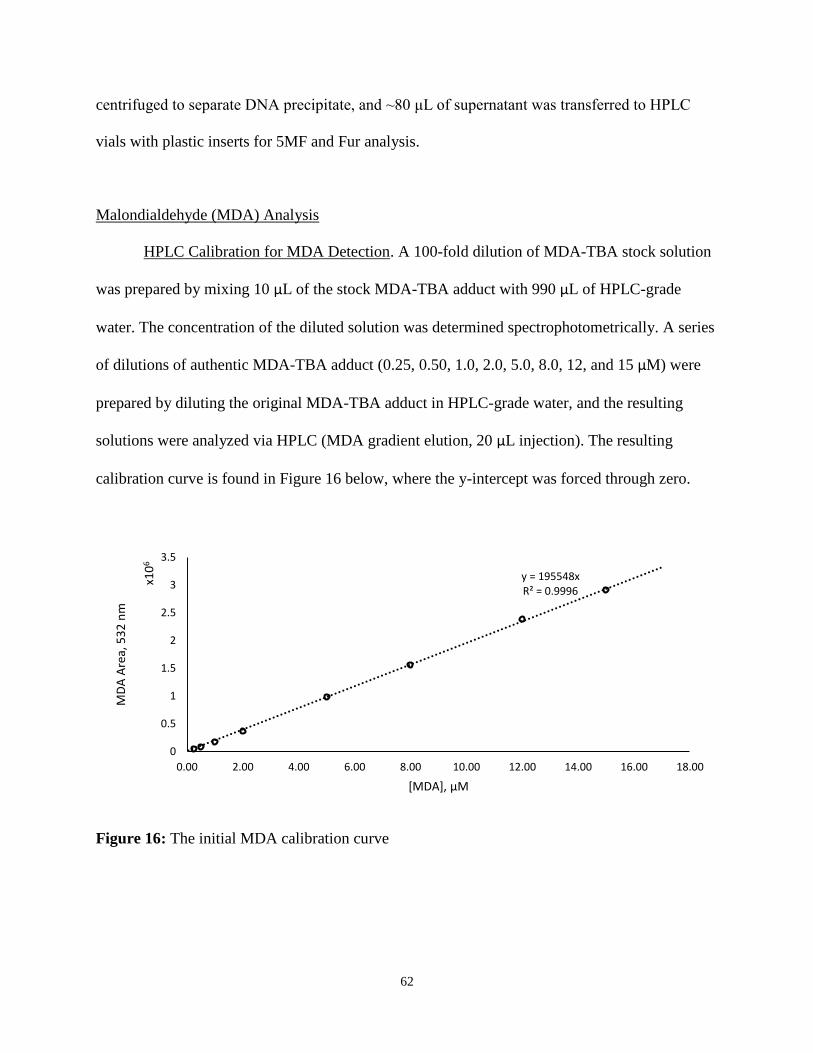
62
centrifuged to separate DNA precipitate, and ~80 μL of supernatant was transferred to HPLC
vials with plastic inserts for 5MF and Fur analysis.
Malondialdehyde (MDA) Analysis
HPLC Calibration for MDA Detection. A 100-fold dilution of MDA-TBA stock solution
was prepared by mixing 10 μL of the stock MDA-TBA adduct with 990 μL of HPLC-grade
water. The concentration of the diluted solution was determined spectrophotometrically. A series
of dilutions of authentic MDA-TBA adduct (0.25, 0.50, 1.0, 2.0, 5.0, 8.0, 12, and 15 μM) were
prepared by diluting the original MDA-TBA adduct in HPLC-grade water, and the resulting
solutions were analyzed via HPLC (MDA gradient elution, 20 μL injection). The resulting
calibration curve is found in Figure 16 below, where the y-intercept was forced through zero.
Figure 16: The initial MDA calibration curve
y = 195548xR² = 0.9996
0
0.5
1
1.5
2
2.5
3
3.5
0.00 2.00 4.00 6.00 8.00 10.00 12.00 14.00 16.00 18.00
MD
A A
rea,
53
2 n
m
x10
6
[MDA], μM
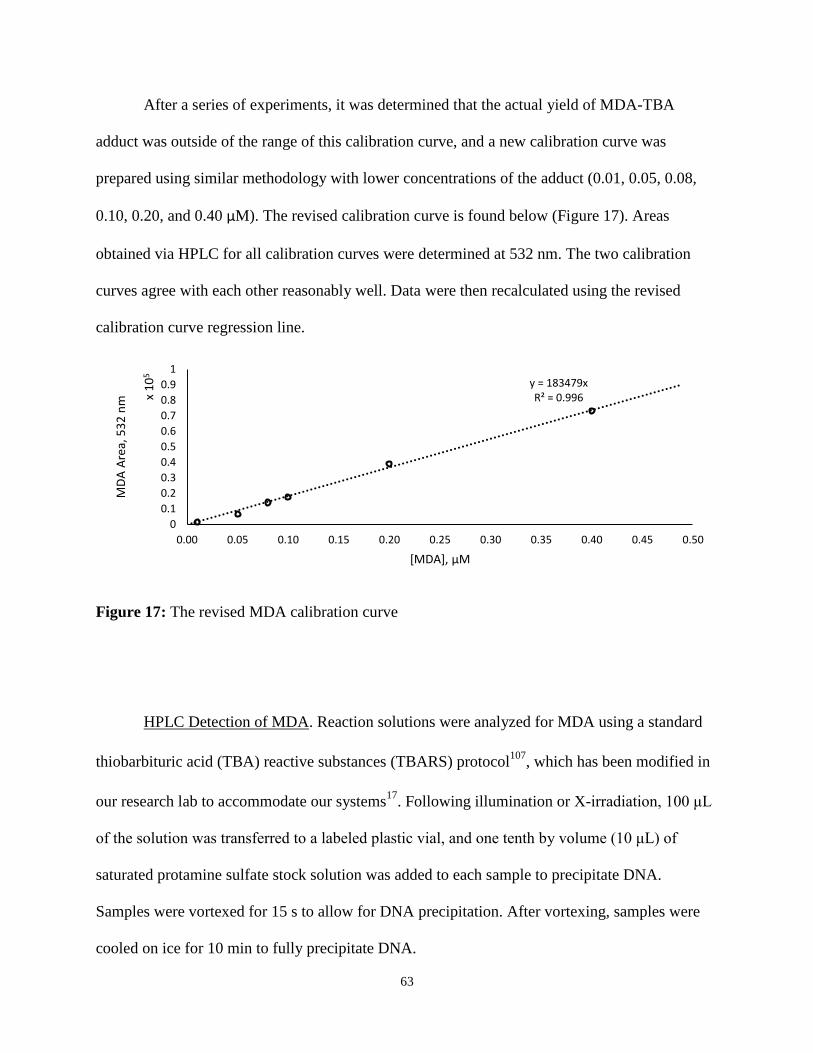
63
After a series of experiments, it was determined that the actual yield of MDA-TBA
adduct was outside of the range of this calibration curve, and a new calibration curve was
prepared using similar methodology with lower concentrations of the adduct (0.01, 0.05, 0.08,
0.10, 0.20, and 0.40 μM). The revised calibration curve is found below (Figure 17). Areas
obtained via HPLC for all calibration curves were determined at 532 nm. The two calibration
curves agree with each other reasonably well. Data were then recalculated using the revised
calibration curve regression line.
Figure 17: The revised MDA calibration curve
HPLC Detection of MDA. Reaction solutions were analyzed for MDA using a standard
thiobarbituric acid (TBA) reactive substances (TBARS) protocol107
, which has been modified in
our research lab to accommodate our systems17
. Following illumination or X-irradiation, 100 μL
of the solution was transferred to a labeled plastic vial, and one tenth by volume (10 μL) of
saturated protamine sulfate stock solution was added to each sample to precipitate DNA.
Samples were vortexed for 15 s to allow for DNA precipitation. After vortexing, samples were
cooled on ice for 10 min to fully precipitate DNA.
y = 183479xR² = 0.996
0
0.1
0.2
0.3
0.4
0.5
0.6
0.7
0.8
0.9
1
0.00 0.05 0.10 0.15 0.20 0.25 0.30 0.35 0.40 0.45 0.50
MD
A A
rea,
53
2 n
m x 1
05
[MDA], μM
64
Once the DNA was fully precipitated, samples were centrifuged and 80 μL of the
supernatant was transferred to a fresh plastic vial, and 80 μL of saturated (0.67% w/v)
thiobarbituric acid (TBA) was added. One tenth of the original volume of supernatant (8 μL) of 1
M HCl was added, and the samples were vortexed to mix thoroughly. Samples were then heated
in a 90°C water bath for 15 minutes to form the MDA-TBA adduct.
Following heating, samples were cooled on ice for 5 minutes, and 80 μL of the resulting
solution was transferred to HPLC vials for analysis. The extinction coefficient of the MDA-TBA
adduct is 1.56 x 10⁵ M-1 cm-1 at 532 nm108
, and chromatograms were analyzed at this wavelength.
Extraction of MDA with N-Butanol. After irradiation or illumination, 200 μL of DNA
solution was heated in a 70°C water bath to maximize the release of MDA from DNA into the
solution. The heated DNA solution was chilled on ice for 1 minute, and 10% of the original
volume of saturated protamine solution (20 μL) was added to each sample to precipitate DNA.
The samples were allowed to chill on ice for 15 minutes to fully precipitate DNA. The resulting
solution was centrifuged to pelletize the DNA. Equal volumes of the resulting supernatant and
saturated solution of TBA were combined in a clear centrifuge tube. To this solution was added
1/10 volume of 1 M HCl, and the solution was vortexed to ensure homogeneity. The reaction
solution was then heated for 15 minutes in a 90°C water bath. Following heating, the solution
was chilled on ice for 2 minutes.
200 μL of n-butanol was added to each centrifuge tube, and the mixture was vortexed
vigorously for 30 s. The MDA-TBA adduct is extracted nearly quantitatively by n-butanol.
Following extraction, the mixture was centrifuged for 1 min. 130-150 μL of each layer (aqueous
65
and organic) were transferred into a quartz cuvette, and the UV-vis spectra of the organic and
aqueous layers were recorded.
Determination of the MDA-TBA Extinction Coefficient in n-Butanol. MDA-TBA adduct
standards of varying concentrations were prepared from pure MDA-TBA adduct with OD532 of
approximately 0.2, 0.4, 0.6, 0.8, and 1.0. After spectrophotometric determination of the OD in
water for the given concentration, a 200 μL (1 volume) aliquot was combined with 1 volume of
n-butanol and 1/10 volume (20 μL) of 1 M HCl, and the samples were vortexed vigorously for
30 s. The resulting samples were centrifuged for 2 minutes to extract the MDA-TBA adduct into
the organic phase. Both the organic layer and the aqueous layer were measured
spectrophotometrically.
The OD532 from the larger aliquot was used to determine the concentration of MDA-TBA
adduct present prior to n-butanol extraction. Following the extraction by n-butanol, the OD532 of
the post-extraction aqueous layer was measured, and the concentration of the MDA-TBA adduct
remaining in the aqueous layer was calculated. The difference between the pre- and post- n-
butanol extraction concentrations was calculated by subtraction, and the resulting concentration
was used as the concentration of the adduct present in the organic layer. The OD532 in organic
layer was measured, and the concentration of MDA-TBA adduct was plotted versus the OD532 of
the organic layer. Least-squares linear regression of the plot yielded a line with a slope equal to
the extinction coefficient of MDA-TBA in n-butanol at 532 nm, 1.71 x 10⁵ M-1 cm-1.
66
DNA Denaturation
For preparation of single-stranded DNA solutions, approximately 3 mL of previously
prepared double-stranded DNA solution in 10 mM phosphate buffer, pH 6.9, was thermally
denatured in a 90°C water bath for 15 minutes. After this, the DNA solution was allowed to cool
gently to room temperature for 1 h. Following equilibration to room temperature, the single-
stranded DNA solution was placed on ice until needed.
HPLC Analysis
For all HPLC analysis programs, a two-solvent system was used: 40 mM aqueous
ammonium acetate buffer (solvent A) and 80% v/v aqueous acetonitrile (solvent B). Linear
acetonitrile gradients were applied to elute the products. The flow rate was 1 mL/min, the
column temperature was maintained at 30oC, and samples in the autosampler tray were kept at
4oC. Optical measurements were performed by a two-lamp photodiode array (PDA), composed
of a deuterium lamp (D) for the UV wavelength range, and a tungsten filament lamp (W) for
visible wavelengths.
HPLC Analysis of Lac, 5MF, Fur, and FBR. Typically, 100-200 μL of each sample was
transferred into a labeled HPLC vial containing a 200 μL plastic insert. Injection volumes were
typically 50-100 μL. The column was equilibrated for a minimum of 30 min with 100% Solvent
A. Equilibration was followed by a conditioning run (no sample injection).
All the low-molecular products mentioned in this section were eluted by a linear gradient
of Solvent B from 0% to 20% over 15 min, which corresponds to the linear increase of
acetonitrile from 0 to 16%. After 20 min from the beginning of the run the PDA detection was
stopped, and the concentration of acetonitrile was increased to 40% B to wash the column with a
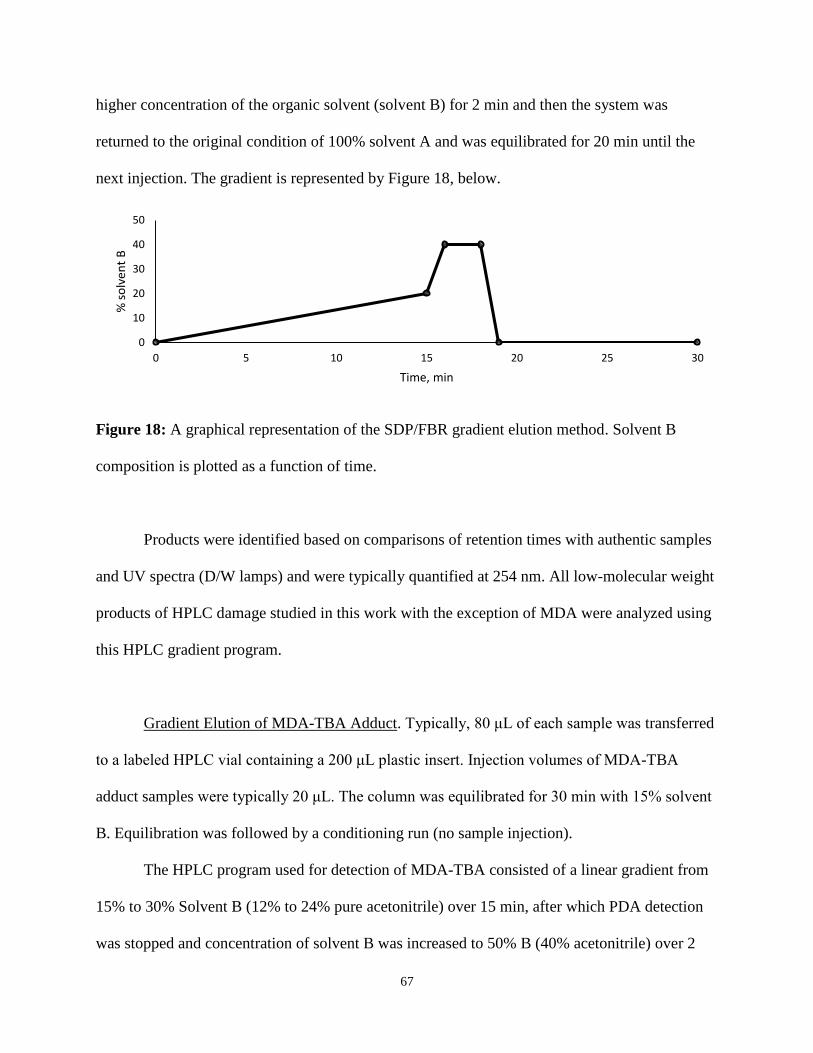
67
higher concentration of the organic solvent (solvent B) for 2 min and then the system was
returned to the original condition of 100% solvent A and was equilibrated for 20 min until the
next injection. The gradient is represented by Figure 18, below.
Figure 18: A graphical representation of the SDP/FBR gradient elution method. Solvent B
composition is plotted as a function of time.
Products were identified based on comparisons of retention times with authentic samples
and UV spectra (D/W lamps) and were typically quantified at 254 nm. All low-molecular weight
products of HPLC damage studied in this work with the exception of MDA were analyzed using
this HPLC gradient program.
Gradient Elution of MDA-TBA Adduct. Typically, 80 μL of each sample was transferred
to a labeled HPLC vial containing a 200 μL plastic insert. Injection volumes of MDA-TBA
adduct samples were typically 20 μL. The column was equilibrated for 30 min with 15% solvent
B. Equilibration was followed by a conditioning run (no sample injection).
The HPLC program used for detection of MDA-TBA consisted of a linear gradient from
15% to 30% Solvent B (12% to 24% pure acetonitrile) over 15 min, after which PDA detection
was stopped and concentration of solvent B was increased to 50% B (40% acetonitrile) over 2
0
10
20
30
40
50
0 5 10 15 20 25 30
% s
olv
ent
B
Time, min
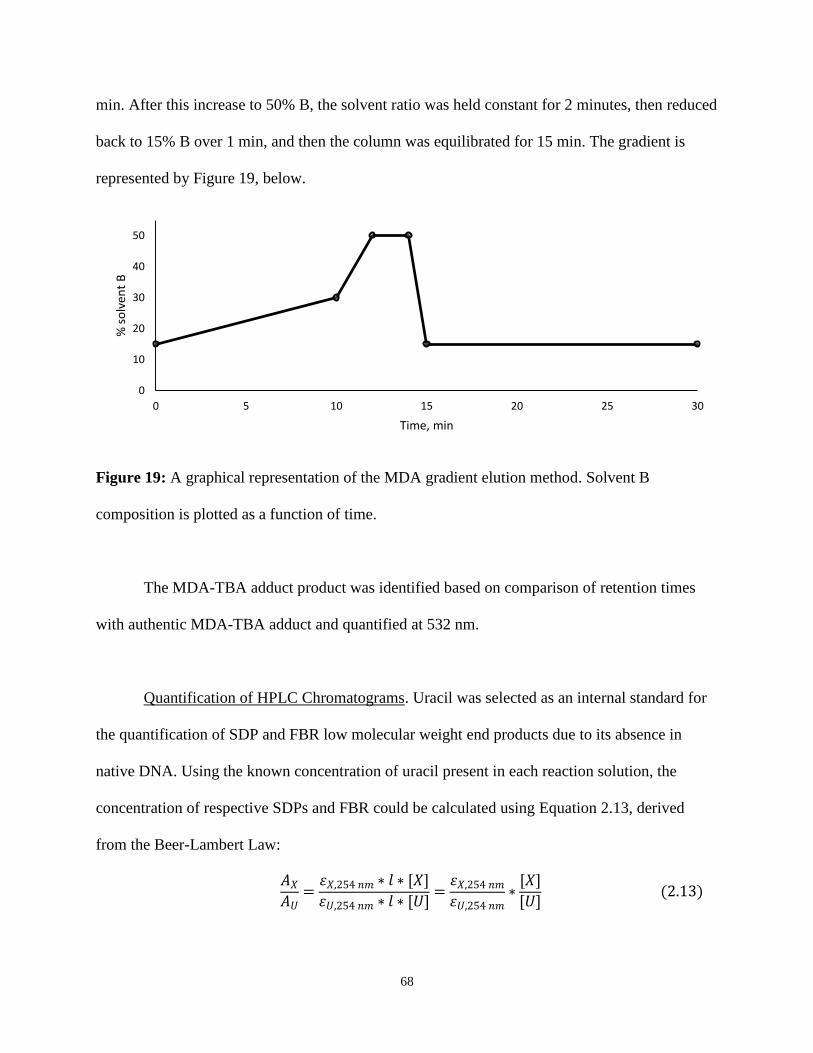
68
min. After this increase to 50% B, the solvent ratio was held constant for 2 minutes, then reduced
back to 15% B over 1 min, and then the column was equilibrated for 15 min. The gradient is
represented by Figure 19, below.
Figure 19: A graphical representation of the MDA gradient elution method. Solvent B
composition is plotted as a function of time.
The MDA-TBA adduct product was identified based on comparison of retention times
with authentic MDA-TBA adduct and quantified at 532 nm.
Quantification of HPLC Chromatograms. Uracil was selected as an internal standard for
the quantification of SDP and FBR low molecular weight end products due to its absence in
native DNA. Using the known concentration of uracil present in each reaction solution, the
concentration of respective SDPs and FBR could be calculated using Equation 2.13, derived
from the Beer-Lambert Law:
𝐴𝑋
𝐴𝑈=
𝜀𝑋,254 𝑛𝑚 ∗ 𝑙 ∗ [𝑋]
𝜀𝑈,254 𝑛𝑚 ∗ 𝑙 ∗ [𝑈]=
𝜀𝑋,254 𝑛𝑚
𝜀𝑈,254 𝑛𝑚∗
[𝑋]
[𝑈] (2.13)
0
10
20
30
40
50
0 5 10 15 20 25 30
% s
olv
ent
B
Time, min
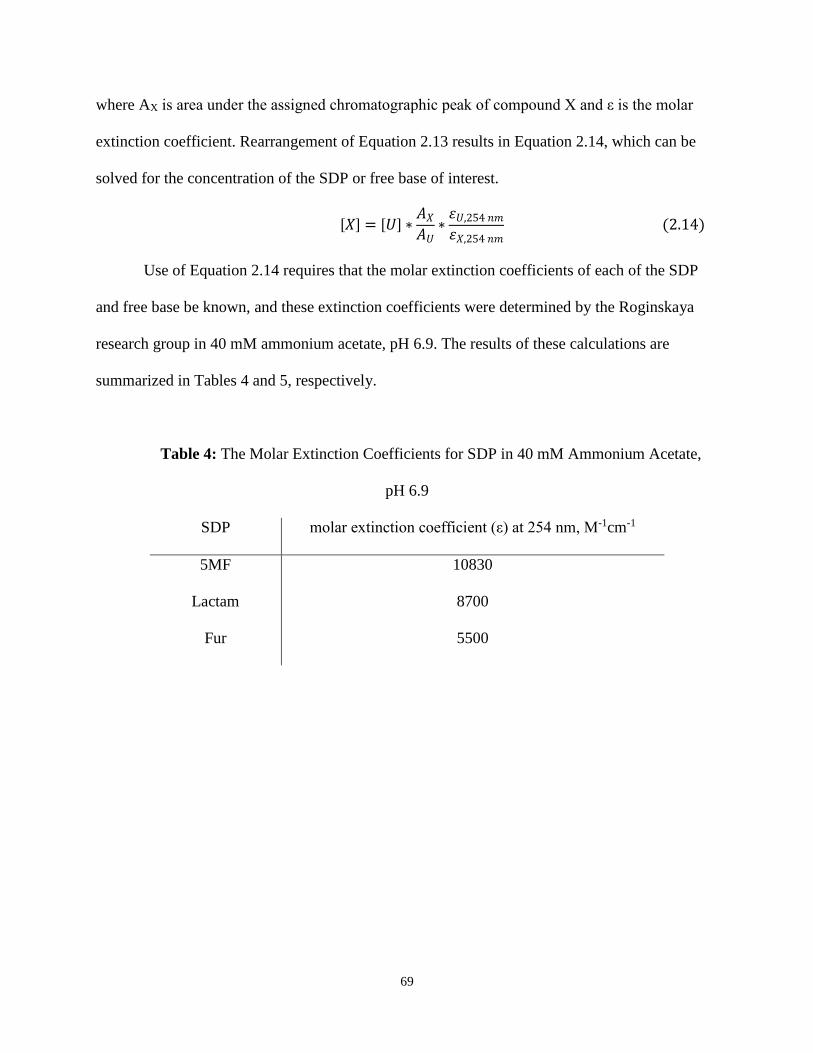
69
where AX is area under the assigned chromatographic peak of compound X and ε is the molar
extinction coefficient. Rearrangement of Equation 2.13 results in Equation 2.14, which can be
solved for the concentration of the SDP or free base of interest.
[𝑋] = [𝑈] ∗
𝐴𝑋
𝐴𝑈∗
𝜀𝑈,254 𝑛𝑚
𝜀𝑋,254 𝑛𝑚 (2.14)
Use of Equation 2.14 requires that the molar extinction coefficients of each of the SDP
and free base be known, and these extinction coefficients were determined by the Roginskaya
research group in 40 mM ammonium acetate, pH 6.9. The results of these calculations are
summarized in Tables 4 and 5, respectively.
Table 4: The Molar Extinction Coefficients for SDP in 40 mM Ammonium Acetate,
pH 6.9
SDP molar extinction coefficient (ε) at 254 nm, M-1cm-1
5MF 10830
Lactam 8700
Fur 5500
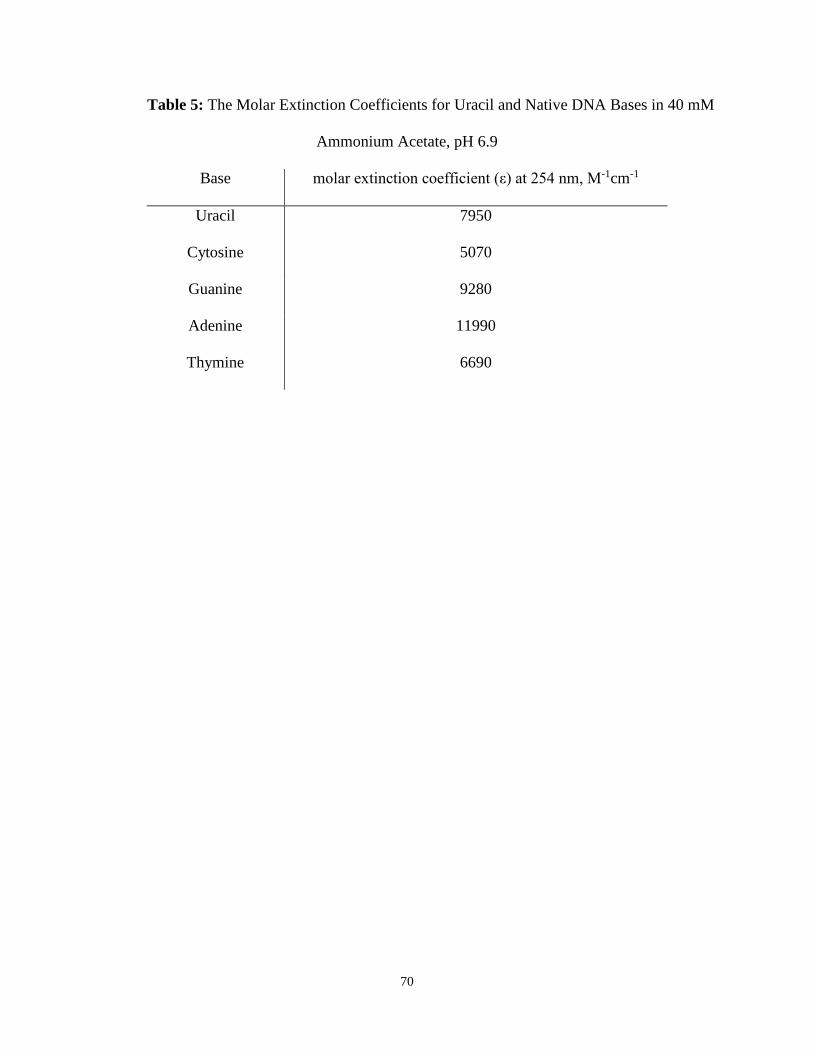
70
Table 5: The Molar Extinction Coefficients for Uracil and Native DNA Bases in 40 mM
Ammonium Acetate, pH 6.9
Base molar extinction coefficient (ε) at 254 nm, M-1cm-1
Uracil 7950
Cytosine 5070
Guanine 9280
Adenine 11990
Thymine 6690
71
CHAPTER 3
RESULTS AND DISCUSSION
Generation of CR by X-Irradiation of Bicarbonate Solutions
Hydroxyl radicals can react with bicarbonate anions to form water and the CR, as shown
in Reaction 1.8 (page 42). The reaction follows second-order kinetics, and the rate constant was
reported by Buxton et al. to be 1.0 x 10⁷ M-1 s-1 82
. Udovicic et al. reported that HO• reacts with
DNA with a second-order rate constant of 2.5 x 10⁸ M-1 s-1 109
, and the greater rate constant for
the reaction of HO• and DNA is indicative for the preference of HO• to react with DNA itself
rather than form CR. The working hypothesis of the experiments described in this section is that
with a less than one order of magnitude difference in rate constants, bicarbonate anions at
sufficiently high concentrations can successfully compete with DNA for the hydroxyl radical, so
the reaction may be redirected to follow the reaction pathway between HO• and HCO3-.
Solutions of 5 mM DNA and 0.5 M HCO3- were prepared following protocols described
in Chapter 2. These solutions were X-irradiated at the 10.9 Gy/s dose rate for doses over the
range from 0 to ~ 2 kGy. Following irradiation, samples were divided into two aliquots, and one
was heat treated in the presence of polyL to catalyze the formation of 5MF and Fur (Figures 12
and 13, respectively, p. 44). The other aliquot was heat treated in the presence of glycine to
derivatize the C4΄-OAS to Lac. Following heat treatment, all samples were analyzed by reverse
phase HPLC to quantify the yield of each respective sugar damage product (SDP).
Representative chromatograms for all post-irradiation treatments under these experimental
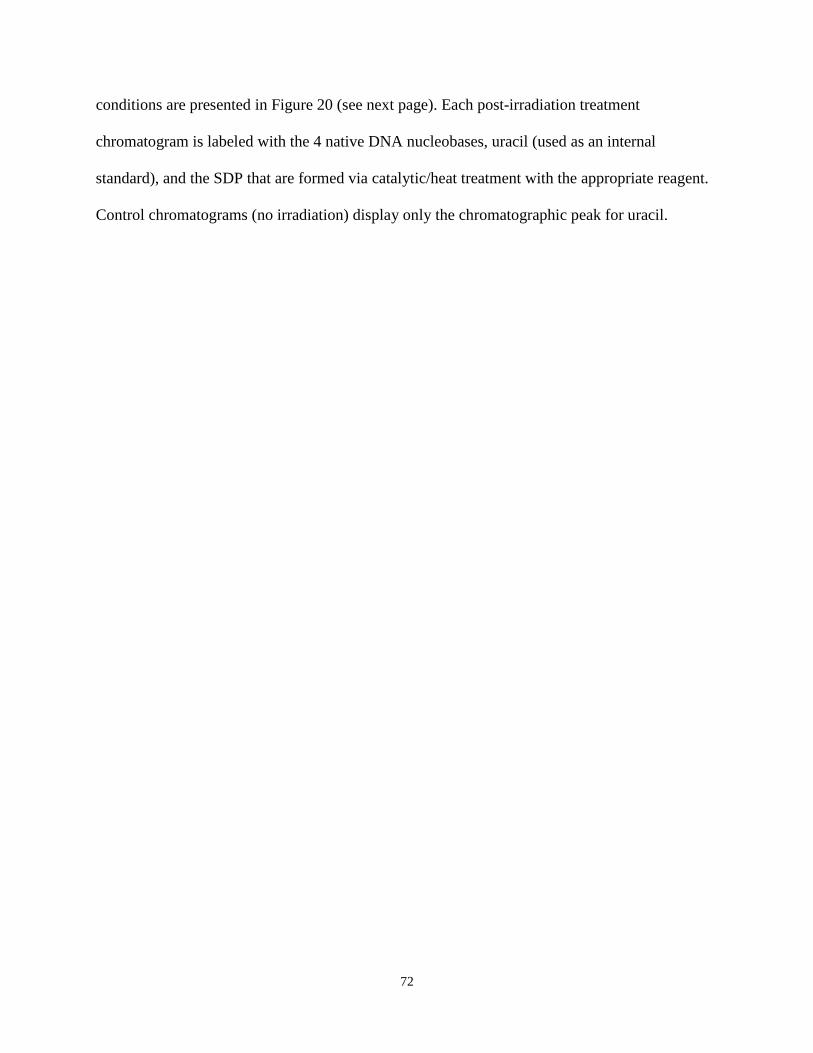
72
conditions are presented in Figure 20 (see next page). Each post-irradiation treatment
chromatogram is labeled with the 4 native DNA nucleobases, uracil (used as an internal
standard), and the SDP that are formed via catalytic/heat treatment with the appropriate reagent.
Control chromatograms (no irradiation) display only the chromatographic peak for uracil.
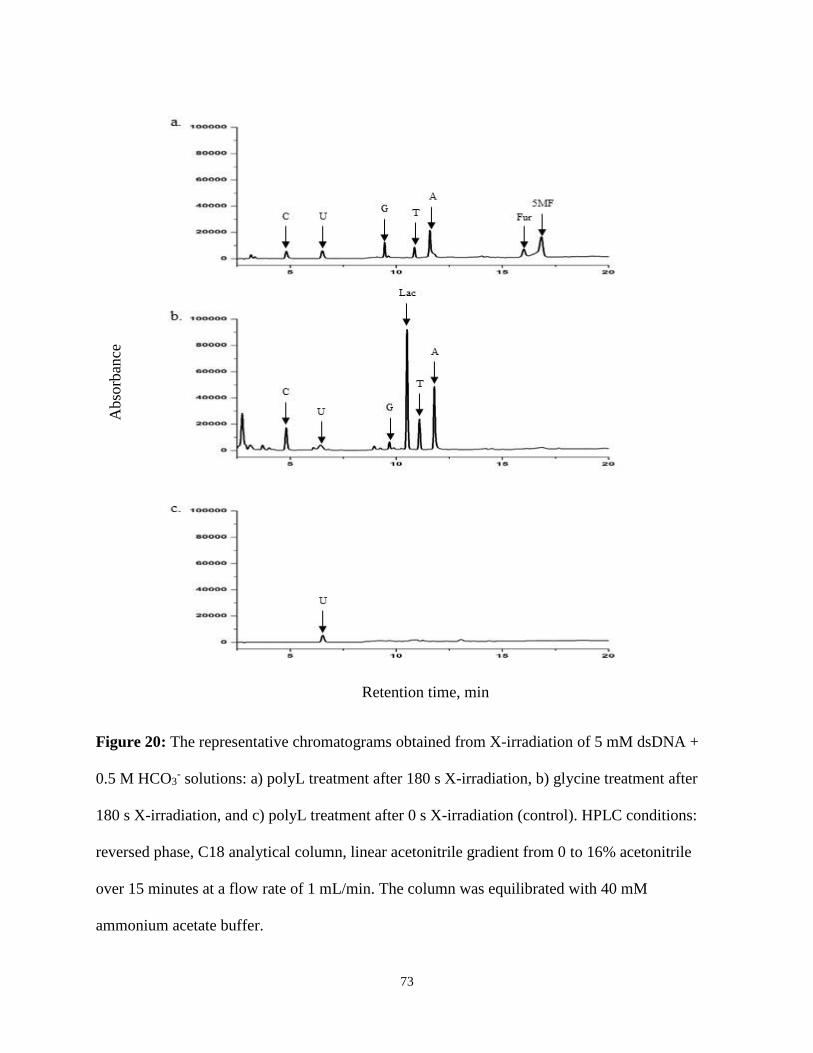
73
Figure 20: The representative chromatograms obtained from X-irradiation of 5 mM dsDNA +
0.5 M HCO3- solutions: a) polyL treatment after 180 s X-irradiation, b) glycine treatment after
180 s X-irradiation, and c) polyL treatment after 0 s X-irradiation (control). HPLC conditions:
reversed phase, C18 analytical column, linear acetonitrile gradient from 0 to 16% acetonitrile
over 15 minutes at a flow rate of 1 mL/min. The column was equilibrated with 40 mM
ammonium acetate buffer.
Retention time, min
Retention time, min
Absorbance
Abso
rban
ce
Ret
enti
on t
ime,
min
Abso
rban
ce
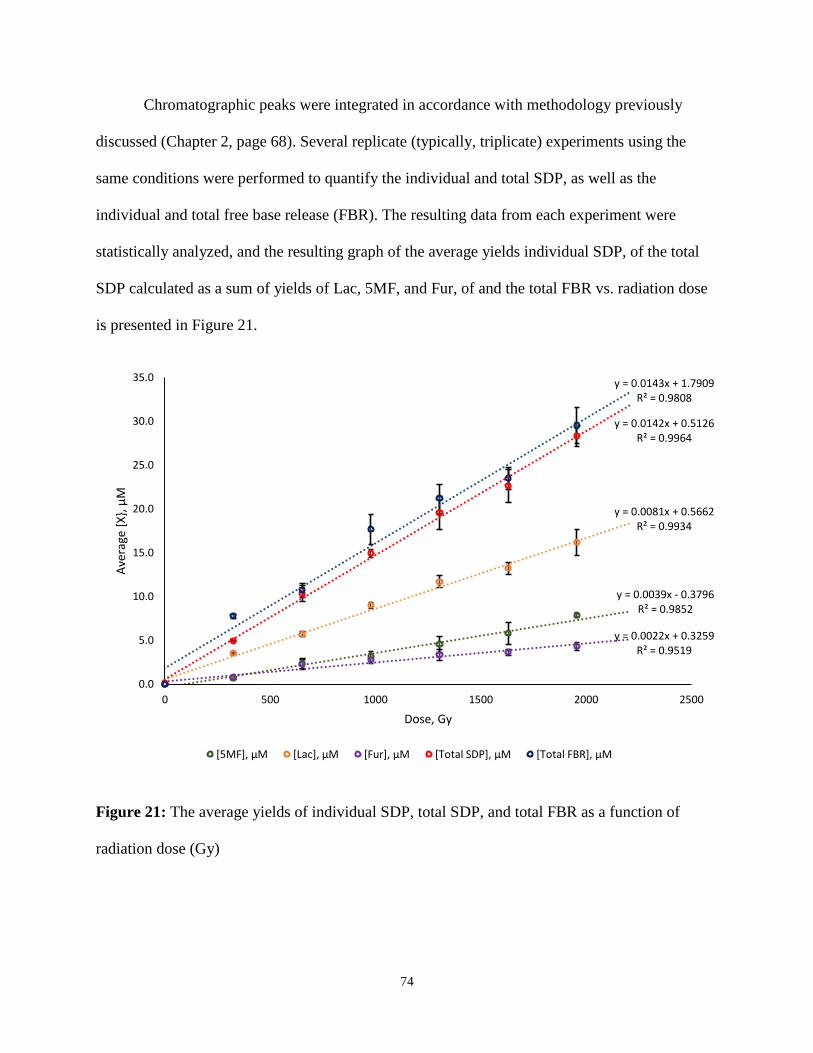
74
Chromatographic peaks were integrated in accordance with methodology previously
discussed (Chapter 2, page 68). Several replicate (typically, triplicate) experiments using the
same conditions were performed to quantify the individual and total SDP, as well as the
individual and total free base release (FBR). The resulting data from each experiment were
statistically analyzed, and the resulting graph of the average yields individual SDP, of the total
SDP calculated as a sum of yields of Lac, 5MF, and Fur, of and the total FBR vs. radiation dose
is presented in Figure 21.
Figure 21: The average yields of individual SDP, total SDP, and total FBR as a function of
radiation dose (Gy)
y = 0.0039x - 0.3796R² = 0.9852
y = 0.0081x + 0.5662R² = 0.9934
y = 0.0022x + 0.3259R² = 0.9519
y = 0.0142x + 0.5126R² = 0.9964
y = 0.0143x + 1.7909R² = 0.9808
0.0
5.0
10.0
15.0
20.0
25.0
30.0
35.0
0 500 1000 1500 2000 2500
Ave
rage
[X
}, μ
M
Dose, Gy
[5MF], μM [Lac], μM [Fur], μM [Total SDP], μM [Total FBR], μM
75
Radiation chemical yields (in nmol J-1) were calculated from the slopes of the regression
lines, assuming that the density of the solutions was near that of water (1 g/mL). The ratio of the
slope for the product of interest and for the total FBR slope gives a relative yield of each sugar
damage pathway (C1΄, C4΄, and C5΄). The slopes, radiation chemical yields, and relative yields
of each SDP are summarized in Table 6. The value of the slope for total FBR is normalized to
100%, and the relative yields of the product of interest are expressed as the ratio between the
slope values of this product and the total FBR. There is a very good agreement between the total
SDP and total FBR slopes, and the R2 values for all linear regression lines are
> 95%. It should be noted, however, that MDA, the product of the second pathway of C4`-OAS,
was not quantified in these experiments due to use of a different gradient for elution of the
MDA-TBA adduct.
Table 6: The Linear Regression Data and Radiation Chemical Yields (G) from the Plot of
Individual SDP, Total SDP, and Total FBR as a Function of Dose
Product Slope (μM/Gy) G (nmol J-1) Relative % Yield
5MF 0.0039 3.9 27%
Lac 0.0081 8.1 57%
Fur 0.0022 2.2 15%
Total SDP 0.0142 14.2 99%
Total FBR 0.0143 14.3 100% ‡Ratio of the G values for each species to the G value of Total FBR
Comparison of SDP with FBR was used in a manner consistent with previous studies
authored by our research group14-17
. The choice of FBR as the internal benchmark for irradiated
DNA solutions is a reasonable one due to the majority of free-radical initiated damage to the
DNA sugar-phosphate backbone being capable of destabilization of the glycosidic bond12
and
76
releasing a free, unaltered base in conjunction with formation of a deoxyribosyl radical17
. Base
propenals, which have been shown to be an exception to this rule, are not significant contributors
to radiation-induced DNA damage110,111
. Because other 2΄-deoxyribose lesions are FBR
generators (including abstraction of C5΄-hydrogen to form the 1, 4-dioxobutane lesion112
and
C3΄-hydrogen abstraction resulting in the formation of 2-methylenefuran-3-one)113,114
, the total
yield of FBR must be greater than or equal to the combined yield of all SDP and MDA, and any
deviation from this trend would be characteristic of a 2΄-deoxyribose lesion not accounted for in
the present work.
In these experiments, MDA was not measured, but yields of this type of lesion can be
estimated as ½ of the yield of Lac as an upper limit17
. This estimate is the upper limit for MDA
concentration, and in subsequent experiments the yield of MDA produced by CR-initiated DNA
sugar damage was found to be very low.
Relative yields of the three SDP indicate that the preferential locus of hydrogen
abstraction in this system is C4΄ > C1΄ > C5΄. This mirrors the trend for the reaction of X-ray-
generated hydroxyl radicals with DNA sugar described in our recent work17
, though the radiation
yields of products are lower (the yields of FBR are ~3.5-fold lower in the present experiment
than in Roginskaya et al.17
). Furthermore, the ratios of relative yields of Lac, 5MF, and Fur
obtained in this work (Lac: 5MF: Fur = 2.1 : 1 : 0.56) match rather closely the same ratios
obtained in our recent work17
under analogous conditions for the damage of DNA sugar by
hydroxyl radicals (Lac: 5MF: Fur = 1.9 : 1 : 0.74). While it is possible that CRs generated in
our system via Reaction 1.4 (see page 37) react with DNA sugar with selectivity similar to that
of hydroxyl radicals, it cannot be excluded from these data comparisons that bicarbonate anions
77
function mostly as hydroxyl radical scavengers in the bulk. The result of this radical scavenging
is to confer partial protection to DNA from the hydroxyl radical attack, instead of the intended
function of switching the role of a major oxidizer from HO• to CR. If this is the case then it
means that though Reaction 1.4 (p. 36) between HCO3- and HO• is efficient, resultant CRs might
not be able to compete for DNA sugar with remaining hydroxyl radicals. Further increase of the
concentration of bicarbonate would solve this problem, but it is not realistic since even at 0.5 M
of bicarbonate electrostatic interactions between DNA and positively charged DNA-binding
polyamines are significantly impaired, so that spermine can no longer be used as a catalyst of
5MF/Fur release due to its decreased DNA affinity observed as the absence of DNA
precipitation. Higher ionic strengths will likely cause disruption of DNA interaction for even
such as strong DNA binder as polyL.
To summarize, it is impossible to determine if the sugar damage observed in this system
is the result of the reaction with CRs or with HO•. This indicates that this system is not quite
suitable for studying the reactions of CR with DNA sugar.
Generation of CR by Photolysis of Persulfate + Bicarbonate Solutions
In most of their studies described in Chapter 1, Shafirovich et al. used the method of CR
generation based on photolysis of solutions of persulfate anions with a large excess of
bicarbonate anions (Reaction 1.6, p. 37). This research group compared the rate constant
between their model oligonucleotides and sulfate radicals ((3.2 ±0.3) x 109 M-1 s-1 87) to the rate
constant for the reaction between the sulfate radical and the bicarbonate anion
((4.6 ± 0.5) x 106 46
) in order to determine the optimal reaction conditions to reduce the oxidation

78
of DNA by SO4•-. The results of these optimization experiments by Shafirovich et al. determined
the optimal concentration of HCO3- to be 0.3 M, and this concentration was used in the present
work to determine the suitability of this persulfate/bicarbonate system for determining the ratio
of H-abstraction preference in CR attack of 2΄-deoxyribose. It is worth noting that the use of
oligonucleotides results in essentially homogenous solutions of DNA, but in the current work
polymerized DNA was used, which results in solutions that are highly viscous.
Exposure of persulfate anions to UV light (308 nm) results in the generation of sulfate
radicals (SR). This reaction (Reaction 1.6, page 38) follows second-order kinetics, and the rate
constant for the photolysis of persulfate was reported by Huie and Clifton as 2.8 x 10⁶ M-1 s-1 (as
ionic strength →0)115
. The quantum yield for this reaction at 308 nm is 0.55, as reported by
Ivanov et al.85
. Once formed in the presence of HCO3-, SR can proceed down one of two
pathways: a SR can recombine with another SR in a second-order reaction to re-form the initial
persulfate anion with a second-order rate constant of 1.6 x 10⁸ M-1 s-1, reported by Herrmann et
al.116
, or SR can react with HCO3- to generate a CR with a second-order rate constant of 2.8 x 10⁶
M-1 s-1 115
; this rate constant is in agreement with the one reported by Shafirovich et al. ((4.6 ±
0.5) x 106 46
). Because the CR-forming reaction occurs at a slower rate than the recombination
reaction, large concentrations of HCO3- can drive the reaction towards the CR-forming reaction.
However as ionic strength of the reaction solution increases, product yields of SDP decrease (see
Figure 24, p. 84). In order to optimize yield of SDP, 0.3 M solutions of bicarbonate were used in
these reactions.
79
Photolysis of Persulfate + 0.3 M Bicarbonate Solutions
Using the method adapted from the Shafirovich research group, solutions of 0.3 M HCO3-
and 10 mM S2O82- were illuminated with Xe lamp in the presence of 5 mM DNA (all final
concentrations). Following illumination, samples were neutralized with an equimolar amount of
glacial acetic acid and the resulting reaction solutions were analyzed via HPLC for individual
Lac, 5MF, Fur, and DNA free bases. As reported by Braunlin et al., the binding of small
polyamines like spermine, spermidine, and putrescine to DNA is disrupted in solutions where the
ionic strength is increased99
. Due to the high ionic strength of these reaction solutions, a stronger
DNA precipitating agent (polyL) was used in order to facilitate removal of DNA from solution
before HPLC analysis of C1΄ and C5΄ products.
Representative chromatograms for all post-illumination treatments under these
experimental conditions are shown in Figure 22. Each post-illumination treatment chromatogram
is labeled with the four native DNA nucleobases, uracil, and the sugar damage products that are
formed via catalytic/heat treatment with the appropriate reagent. Control chromatogram (no
irradiation) displays only the chromatographic peak for uracil. The chromatographic peaks were
integrated in line with previously described methods (see Quantification of HPLC
Chromatograms, p. 68).
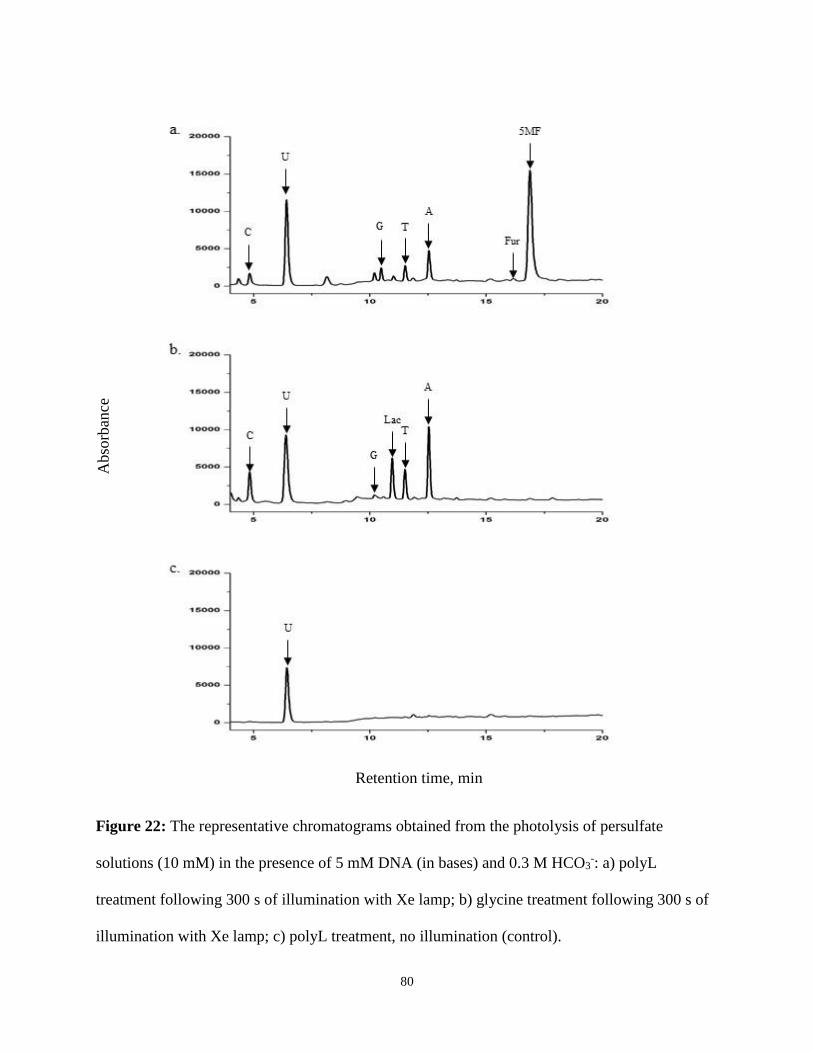
80
Figure 22: The representative chromatograms obtained from the photolysis of persulfate
solutions (10 mM) in the presence of 5 mM DNA (in bases) and 0.3 M HCO3-: a) polyL
treatment following 300 s of illumination with Xe lamp; b) glycine treatment following 300 s of
illumination with Xe lamp; c) polyL treatment, no illumination (control).
Retention time, min
Abso
rban
ce
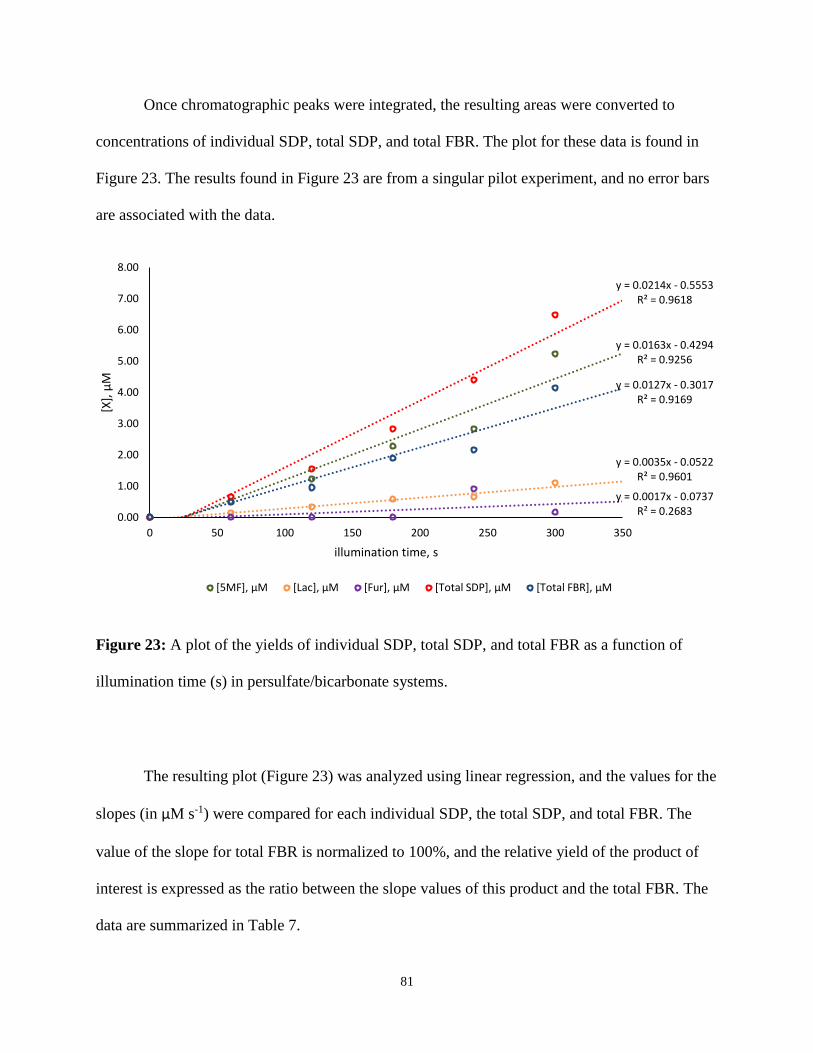
81
Once chromatographic peaks were integrated, the resulting areas were converted to
concentrations of individual SDP, total SDP, and total FBR. The plot for these data is found in
Figure 23. The results found in Figure 23 are from a singular pilot experiment, and no error bars
are associated with the data.
Figure 23: A plot of the yields of individual SDP, total SDP, and total FBR as a function of
illumination time (s) in persulfate/bicarbonate systems.
The resulting plot (Figure 23) was analyzed using linear regression, and the values for the
slopes (in μM s-1) were compared for each individual SDP, the total SDP, and total FBR. The
value of the slope for total FBR is normalized to 100%, and the relative yield of the product of
interest is expressed as the ratio between the slope values of this product and the total FBR. The
data are summarized in Table 7.
y = 0.0163x - 0.4294R² = 0.9256
y = 0.0035x - 0.0522R² = 0.9601
y = 0.0017x - 0.0737R² = 0.2683
y = 0.0214x - 0.5553R² = 0.9618
y = 0.0127x - 0.3017R² = 0.9169
0.00
1.00
2.00
3.00
4.00
5.00
6.00
7.00
8.00
0 50 100 150 200 250 300 350
[X],
μM
illumination time, s
[5MF], μM [Lac], μM [Fur], μM [Total SDP], μM [Total FBR], μM
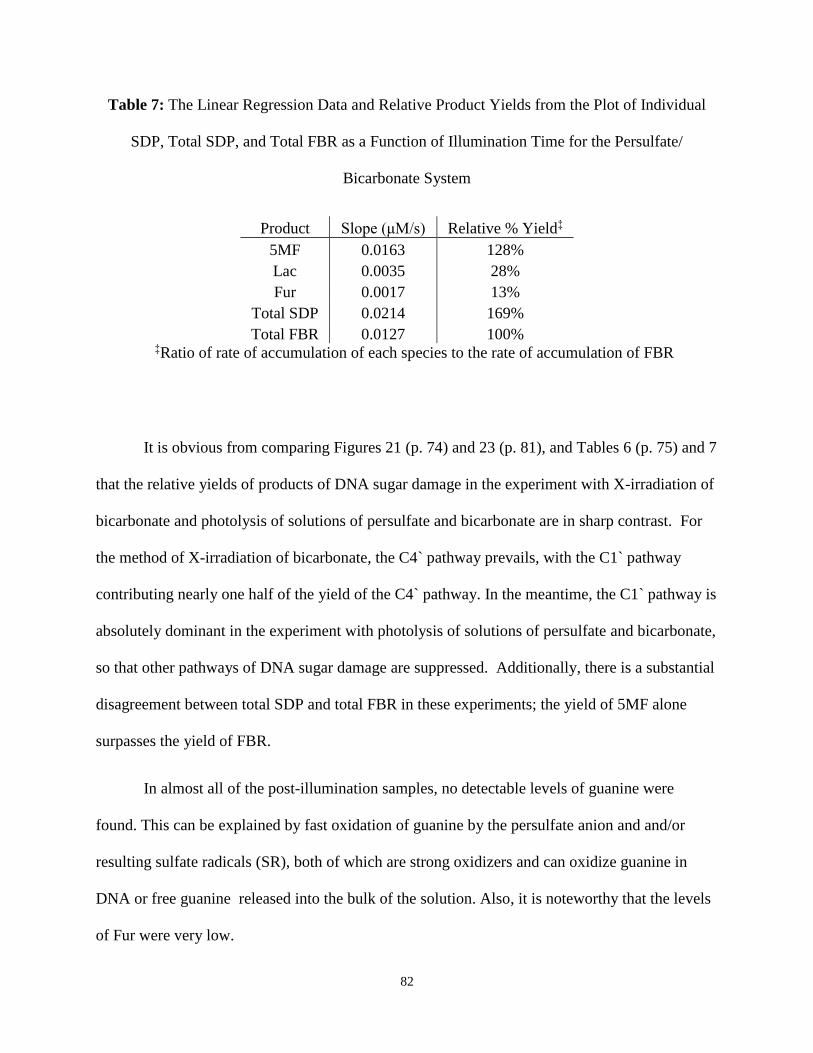
82
Table 7: The Linear Regression Data and Relative Product Yields from the Plot of Individual
SDP, Total SDP, and Total FBR as a Function of Illumination Time for the Persulfate/
Bicarbonate System
Product Slope (μM/s) Relative % Yield‡
5MF 0.0163 128%
Lac 0.0035 28%
Fur 0.0017 13%
Total SDP 0.0214 169%
Total FBR 0.0127 100% ‡Ratio of rate of accumulation of each species to the rate of accumulation of FBR
It is obvious from comparing Figures 21 (p. 74) and 23 (p. 81), and Tables 6 (p. 75) and 7
that the relative yields of products of DNA sugar damage in the experiment with X-irradiation of
bicarbonate and photolysis of solutions of persulfate and bicarbonate are in sharp contrast. For
the method of X-irradiation of bicarbonate, the C4` pathway prevails, with the C1` pathway
contributing nearly one half of the yield of the C4` pathway. In the meantime, the C1` pathway is
absolutely dominant in the experiment with photolysis of solutions of persulfate and bicarbonate,
so that other pathways of DNA sugar damage are suppressed. Additionally, there is a substantial
disagreement between total SDP and total FBR in these experiments; the yield of 5MF alone
surpasses the yield of FBR.
In almost all of the post-illumination samples, no detectable levels of guanine were
found. This can be explained by fast oxidation of guanine by the persulfate anion and and/or
resulting sulfate radicals (SR), both of which are strong oxidizers and can oxidize guanine in
DNA or free guanine released into the bulk of the solution. Also, it is noteworthy that the levels
of Fur were very low.
83
There are two potential reasons for the unexpected product yields observed in this
experiment: 1) aforementioned high oxidizing ability of the parent persulfate anion and the
generated sulfate radical anion and 2) high ionic strength associated with high concentrations of
bicarbonate required for the experimental conditions. Each factor individually, or a combination
of both, can contribute to the occurrence of undesired side reactions, which can seriously alter
the product yields. For example, released bases in the solution can be oxidized by persulfate
and/or by sulfate radical anion. Also, it is not clear if 0.3 M of bicarbonate is a sufficient
concentration in our system for the reaction of bicarbonate with sulfate radical anion (Reaction
1.7, p. 37) to successfully compete with the reaction of sulfate radical anion with DNA.
Shafirovich and co-workers used an essentially lower concentration of DNA oligonucleotides
(~100 M in bases) in their experiments87
.
Photolysis of Persulfate in the Presence of Varied Concentrations of HCO3-
This set of experiments was designed to study the effect of [HCO3-]/ionic strength on the
product yields and to examine whether the increase of [HCO3-] can modify the spectrum of the
product yields.
Reaction solutions were prepared with varying [HCO3-] to investigate the effect of
bicarbonate concentration/ionic strength of the reaction solution on the formation of SDP. DNA
solutions containing 0.3, 0.5, 0.8, and 1.0 mM bicarbonate were prepared and illuminated for 5
minutes under similar conditions from the fixed bicarbonate concentration. Following
illumination, samples were treated with polyL and glycine, and analyzed by HPLC as described
before. The results of this pilot experiment are found in Figure 24, below.

84
Figure 24: A plot of the yields of individual SDP, total SDP, and total FBR in photolyzed
persulfate solutions vs. the concentration of bicarbonate. All samples were illuminated for 5 min.
All other conditions are the same as indicated in Figure 23 (p. 81).
The plot indicates an approximately linear inverse relationship between the SDP yield
and [HCO3-]/ionic strength of the reaction solution. However, the general trend in the SDP ratio
still remains the same: 5MF still is a major product even at 1 M of bicarbonate, and the
imbalance between SDP and FBR still remains. These results indicate that while the increase of
[HCO3-] up to 1 M does not change the spectrum of DNA SDP, so that the competition between
SRs and bicarbonate is most likely not an issue even at 0.3 M of bicarbonate, high ionic strength
of reaction solutions might result in unexpected distortions of reaction mechanism, which is
reflected by the decrease in all product yields with [HCO3-], i.e. with the increase of ionic
strength.
0.00
1.00
2.00
3.00
4.00
5.00
6.00
0.2 0.3 0.4 0.5 0.6 0.7 0.8 0.9 1
[X],
μM
[HCO3-], M
[5MF], μM [Lactam], μM [Fur], μM [Total SDP], μM [Total FBR], μM
85
Logically, the next clarifying experiment would be the one on DNA concentration
dependence. However, at this point it was decided that this method of generation of CRs appears
to be inappropriate for the goal of HPLC detection of DNA SDP generated by CRs. Most likely,
much lower concentrations of DNA would be required to suppress the reaction of DNA with SR,
which cannot be afforded due to the limited HPLC sensitivity. High ionic strength is associated
with a decreased binding of DNA with other reagents, which causes an additional problem.
Finally, this experiment is overly labor-intensive. With all these considerations, further
experiments on this method were halted.
Generation of CR by Photolysis of the Carbonatopentaaminecobalt(III) Complex
As it was concluded in the first two sections of this chapter, the previous two methods of
CR generation are not suitable for our goal. The major problem with these methods is that in
both of them the formation of competing ROS, hydroxyl radical in the first method and sulfate
radical in the second method, does not allow for dissection of reactions of CRs with DNA sugar
based on HPLC product analysis. The deficiencies of the previous two methods of CR generation
are alleviated by the use of the method of photolysis of carbonatopentamminecobalt(III)
perchlorate solution. As illustrated by Busset et al.84
, no other ROS are formed as the result of
UV photolysis of carbonato-metal complexes except for the CR (Reaction 1.5, page 38). When
exposed to light with wavelengths in the range of the charge transfer band ( λ < 350 nm), the
carbonato-cobalt complexes undergo inner sphere charge transfer from the bound carbonate
ligand group to Co3+, which is immediately followed by the formation of a free CR (Reaction
1.5, page 38).
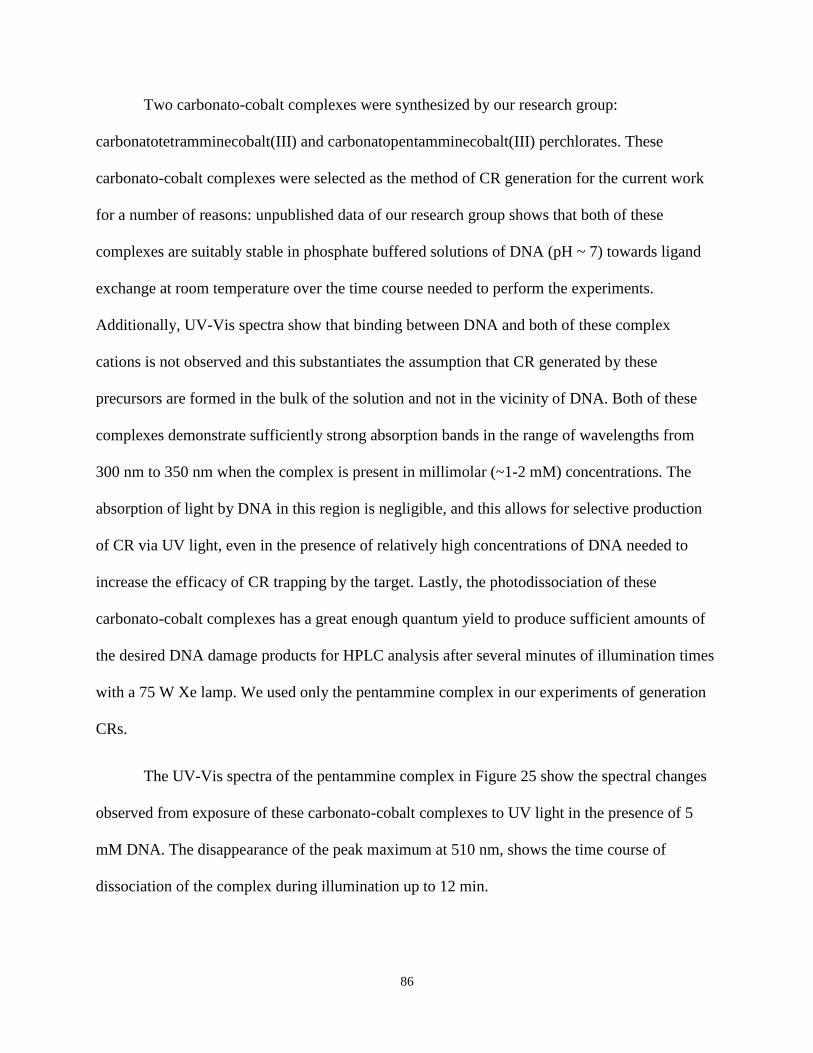
86
Two carbonato-cobalt complexes were synthesized by our research group:
carbonatotetramminecobalt(III) and carbonatopentamminecobalt(III) perchlorates. These
carbonato-cobalt complexes were selected as the method of CR generation for the current work
for a number of reasons: unpublished data of our research group shows that both of these
complexes are suitably stable in phosphate buffered solutions of DNA (pH ~ 7) towards ligand
exchange at room temperature over the time course needed to perform the experiments.
Additionally, UV-Vis spectra show that binding between DNA and both of these complex
cations is not observed and this substantiates the assumption that CR generated by these
precursors are formed in the bulk of the solution and not in the vicinity of DNA. Both of these
complexes demonstrate sufficiently strong absorption bands in the range of wavelengths from
300 nm to 350 nm when the complex is present in millimolar (~1-2 mM) concentrations. The
absorption of light by DNA in this region is negligible, and this allows for selective production
of CR via UV light, even in the presence of relatively high concentrations of DNA needed to
increase the efficacy of CR trapping by the target. Lastly, the photodissociation of these
carbonato-cobalt complexes has a great enough quantum yield to produce sufficient amounts of
the desired DNA damage products for HPLC analysis after several minutes of illumination times
with a 75 W Xe lamp. We used only the pentammine complex in our experiments of generation
CRs.
The UV-Vis spectra of the pentammine complex in Figure 25 show the spectral changes
observed from exposure of these carbonato-cobalt complexes to UV light in the presence of 5
mM DNA. The disappearance of the peak maximum at 510 nm, shows the time course of
dissociation of the complex during illumination up to 12 min.
87
Figure 25: The absorption changes induced in the UV-Vis spectrum of Co(NH3)5CO3+ by
photolysis in presence of 5 mM DNA. Numbers shown in the Figure are the exposure times in
min.
Double-Stranded DNA
5MF, Fur, Lac, and FBR Analysis. 5 mM dsDNA solutions were prepared with 2 mM
[Co(NH3)5CO3]+ ClO4
- in 10 mM phosphate buffer, pH 6.9 (all final concentrations). The
resulting solutions were subjected to UV illumination via high-pressure Hg(Xe) lamp, and the
resulting solutions were divided and treated with either 10 mM spermine or 200 mM glycine
(final concentrations) in a 70 °C water bath. Post-illumination solutions were analyzed by the
HPLC method previously discussed, and the areas of the resulting chromatographic peaks were
integrated manually.
Abso
rban
ce
Wavelength, nm
88
Representative chromatograms for all post-illumination treatments under these
experimental conditions are shown in Figure 26 (next page). Each post-illumination treatment
chromatogram is labeled with the four native DNA nucleobases, uracil (used as an internal
standard), and the SDP that are formed via catalytic/heat treatment with the appropriate reagent.
Control chromatograms (no illumination) display mostly the chromatographic peak for uracil.
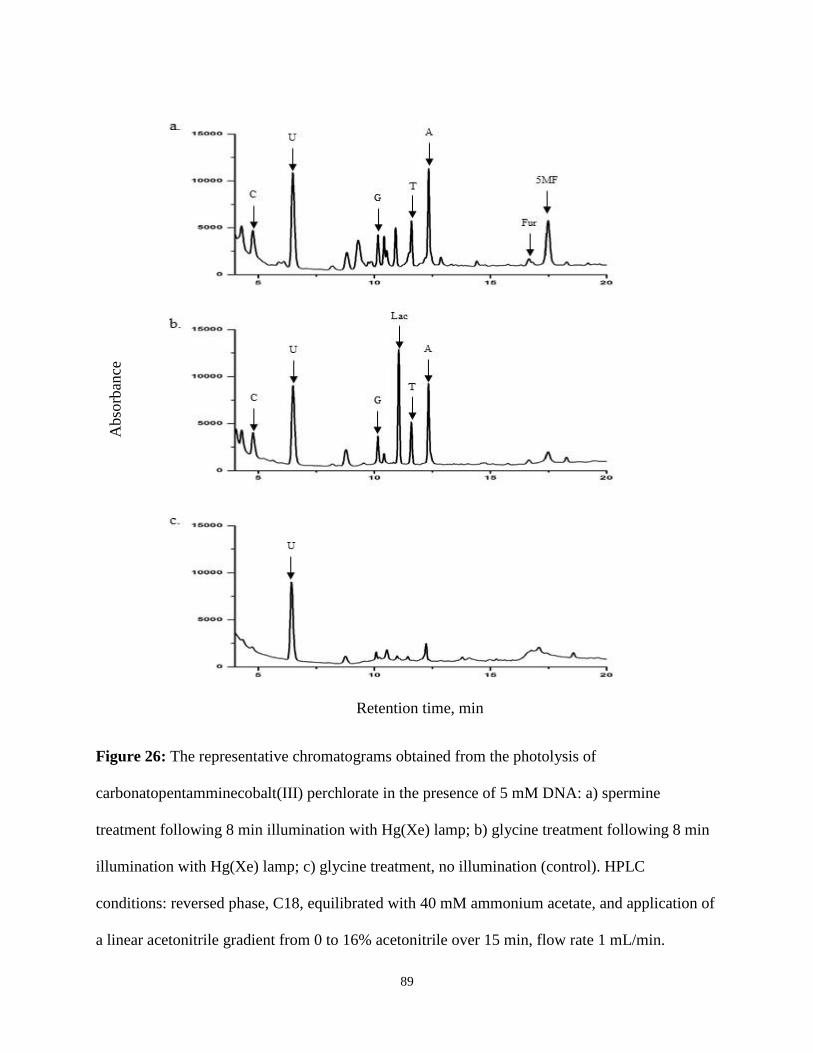
89
Figure 26: The representative chromatograms obtained from the photolysis of
carbonatopentamminecobalt(III) perchlorate in the presence of 5 mM DNA: a) spermine
treatment following 8 min illumination with Hg(Xe) lamp; b) glycine treatment following 8 min
illumination with Hg(Xe) lamp; c) glycine treatment, no illumination (control). HPLC
conditions: reversed phase, C18, equilibrated with 40 mM ammonium acetate, and application of
a linear acetonitrile gradient from 0 to 16% acetonitrile over 15 min, flow rate 1 mL/min.
Retention time, min
Abso
rban
ce
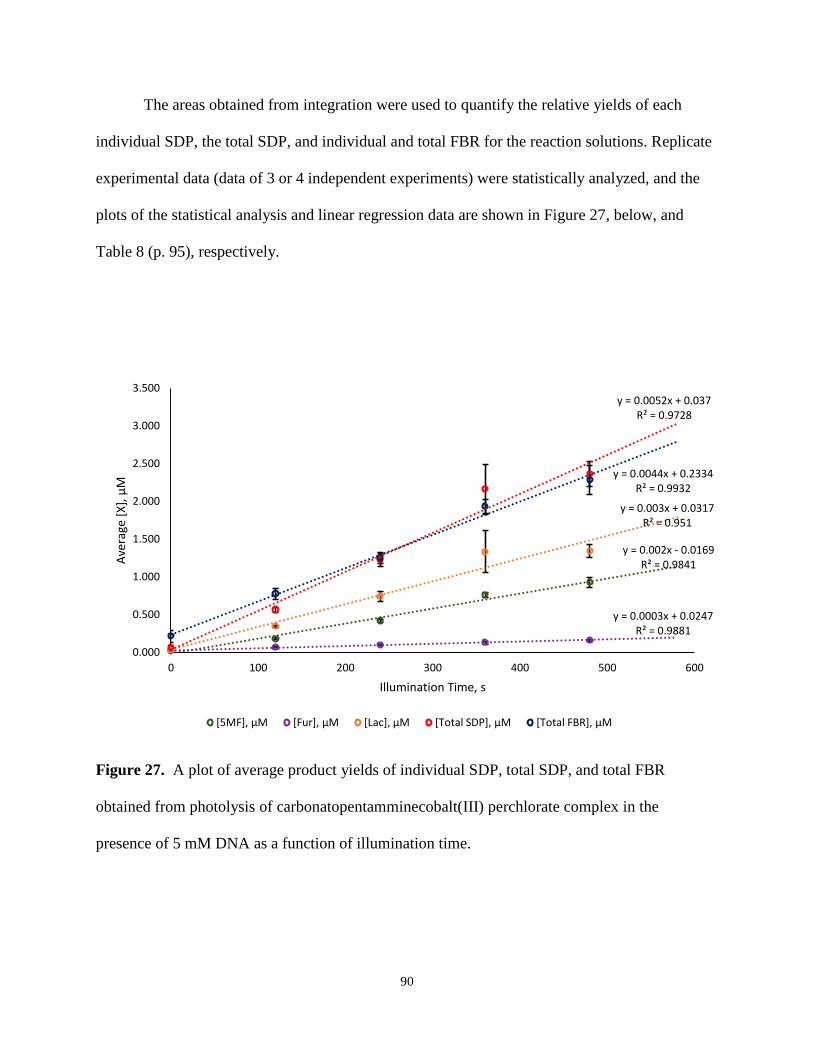
90
The areas obtained from integration were used to quantify the relative yields of each
individual SDP, the total SDP, and individual and total FBR for the reaction solutions. Replicate
experimental data (data of 3 or 4 independent experiments) were statistically analyzed, and the
plots of the statistical analysis and linear regression data are shown in Figure 27, below, and
Table 8 (p. 95), respectively.
Figure 27. A plot of average product yields of individual SDP, total SDP, and total FBR
obtained from photolysis of carbonatopentamminecobalt(III) perchlorate complex in the
presence of 5 mM DNA as a function of illumination time.
y = 0.002x - 0.0169R² = 0.9841
y = 0.0003x + 0.0247R² = 0.9881
y = 0.003x + 0.0317R² = 0.951
y = 0.0052x + 0.037R² = 0.9728
y = 0.0044x + 0.2334R² = 0.9932
0.000
0.500
1.000
1.500
2.000
2.500
3.000
3.500
0 100 200 300 400 500 600
Ave
rage
[X
], μ
M
Illumination Time, s
[5MF], μM [Fur], μM [Lac], μM [Total SDP], μM [Total FBR], μM
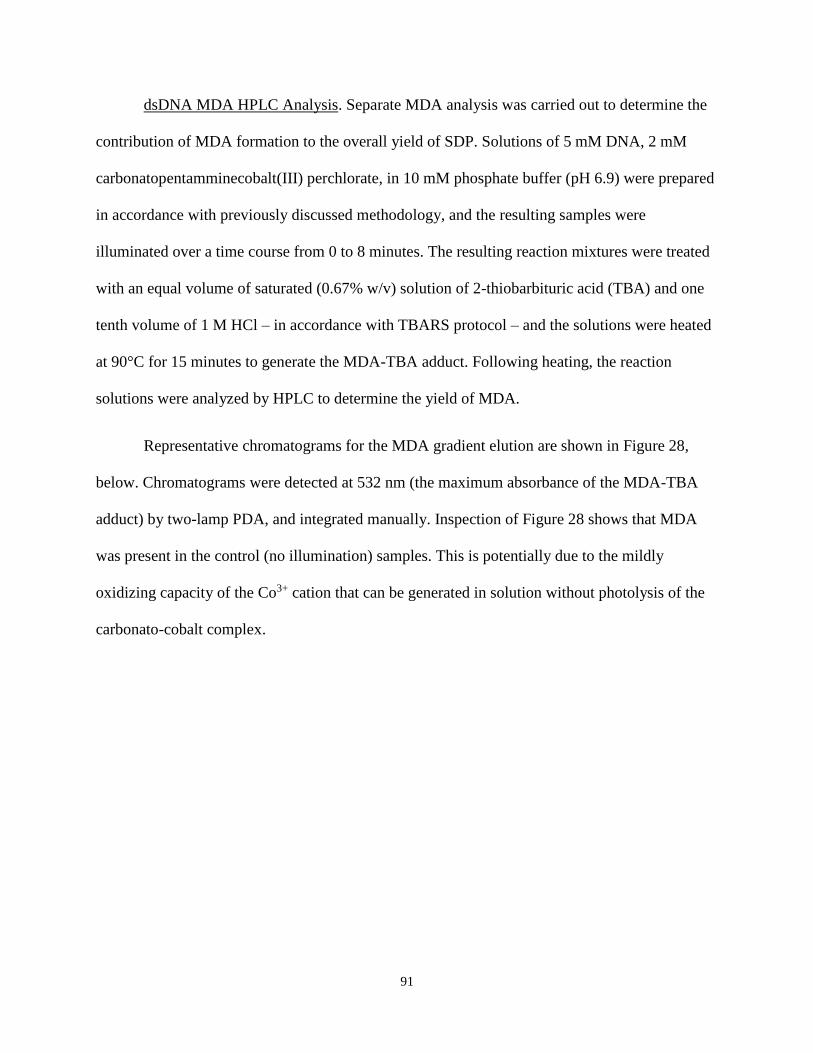
91
dsDNA MDA HPLC Analysis. Separate MDA analysis was carried out to determine the
contribution of MDA formation to the overall yield of SDP. Solutions of 5 mM DNA, 2 mM
carbonatopentamminecobalt(III) perchlorate, in 10 mM phosphate buffer (pH 6.9) were prepared
in accordance with previously discussed methodology, and the resulting samples were
illuminated over a time course from 0 to 8 minutes. The resulting reaction mixtures were treated
with an equal volume of saturated (0.67% w/v) solution of 2-thiobarbituric acid (TBA) and one
tenth volume of 1 M HCl – in accordance with TBARS protocol – and the solutions were heated
at 90°C for 15 minutes to generate the MDA-TBA adduct. Following heating, the reaction
solutions were analyzed by HPLC to determine the yield of MDA.
Representative chromatograms for the MDA gradient elution are shown in Figure 28,
below. Chromatograms were detected at 532 nm (the maximum absorbance of the MDA-TBA
adduct) by two-lamp PDA, and integrated manually. Inspection of Figure 28 shows that MDA
was present in the control (no illumination) samples. This is potentially due to the mildly
oxidizing capacity of the Co3+ cation that can be generated in solution without photolysis of the
carbonato-cobalt complex.
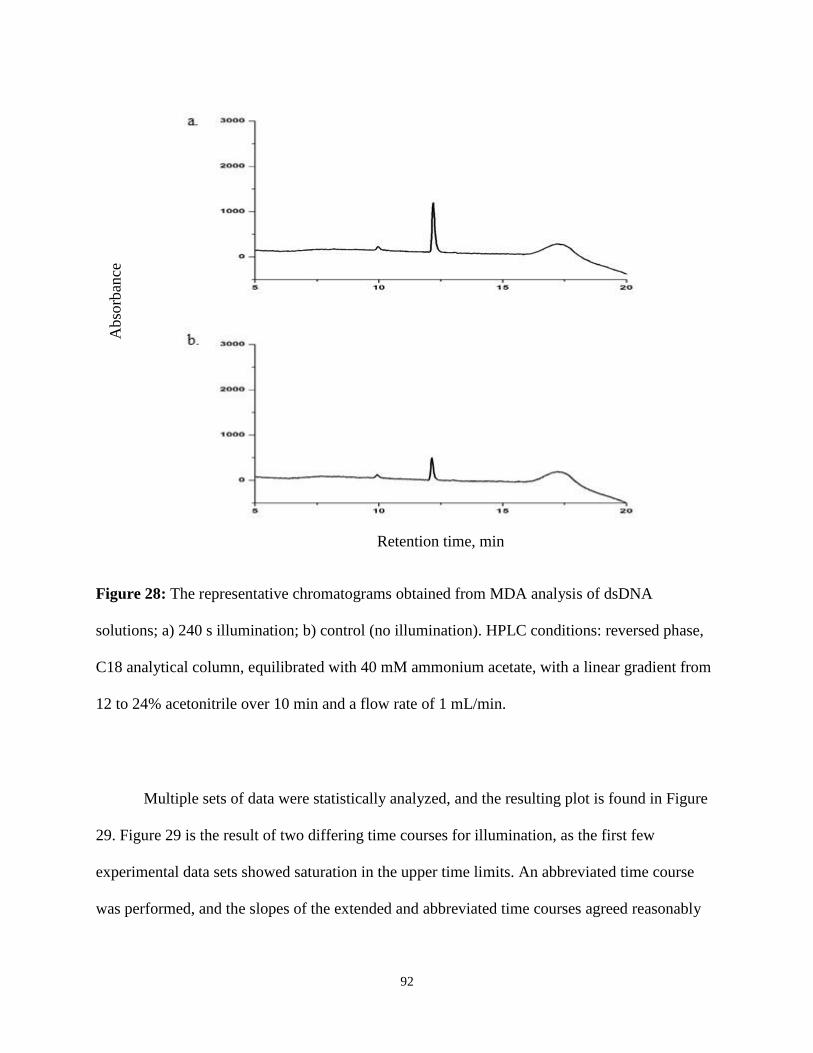
92
Figure 28: The representative chromatograms obtained from MDA analysis of dsDNA
solutions; a) 240 s illumination; b) control (no illumination). HPLC conditions: reversed phase,
C18 analytical column, equilibrated with 40 mM ammonium acetate, with a linear gradient from
12 to 24% acetonitrile over 10 min and a flow rate of 1 mL/min.
Multiple sets of data were statistically analyzed, and the resulting plot is found in Figure
29. Figure 29 is the result of two differing time courses for illumination, as the first few
experimental data sets showed saturation in the upper time limits. An abbreviated time course
was performed, and the slopes of the extended and abbreviated time courses agreed reasonably
Retention time, min
Abso
rban
ce

93
well with each other. The resulting data were plotted on one graph, and error bars for replicate
measurements have been included.
Figure 29: A plot of MDA concentration as a function of illumination time in solutions of 5 mM
dsDNA and 2 mM [Co(NH3)5CO3]+ClO4
- in 10 mM phosphate buffer, pH 6.9
MDA Analysis Using N-Butanol Extraction. The MDA pathway has been estimated to
contribute as much as one-third of all C4΄ damage by hydroxyl radicals in DNA solutions17
, but
the determined yields in these experiments were exceptionally low. In order to confirm the
magnitude of these yields, a liquid-liquid extraction of MDA with n-butanol was performed as a
confirmatory test. In order to spectroscopically determine the concentration of MDA present, the
molar absorptivity coefficient in n-butanol was calculated using a series of standards of known
concentration. The quantity of MDA-TBA adduct was determined in an aqueous solution using
the previously determined molar absorptivity coefficient for the adduct in water (1.56 x 10⁵ M-1
y = 0.0003x + 0.0824R² = 0.7981
0
0.05
0.1
0.15
0.2
0.25
0.3
0 100 200 300 400 500 600
Ave
rage
[M
DA
], μ
M
Illumination time, s
94
cm-1)108
, and then the samples of known concentration were extracted into n-butanol. The
resulting aqueous and organic layers were measured using Cary 100 UV-vis spectrophotometer,
and the molar absorptivity coefficient of the MDA-TBA adduct in n-butanol was calculated by
the difference between the known concentrations and the resulting aqueous and organic layers.
The resulting slope of the regression line (Figure 30) was taken to be the new n-butanol molar
absorptivity coefficient, or 1.78 x 10⁵ M-1 cm-1.
Figure 30: The determination of the molar absorptivity coefficient of the MDA-TBA adduct in
n-butanol
Once this value was calculated, a confirmatory set of samples of double-stranded DNA
and carbonatopentamminecobalt(III) perchlorate were prepared, and the MDA-TBA adduct
concentration was determined for each sample following 0, 30, and 180 s illuminations. The
resulting [MDA-TBA] was on the order of 0.06-0.11 μM in these samples, in agreement with the
y = 177747x - 0.0572R² = 0.9806
0
0.2
0.4
0.6
0.8
1
1.2
1.4
0.00E+00 1.00E-06 2.00E-06 3.00E-06 4.00E-06 5.00E-06 6.00E-06 7.00E-06 8.00E-06
OD
53
2
[MDA-TBA], M
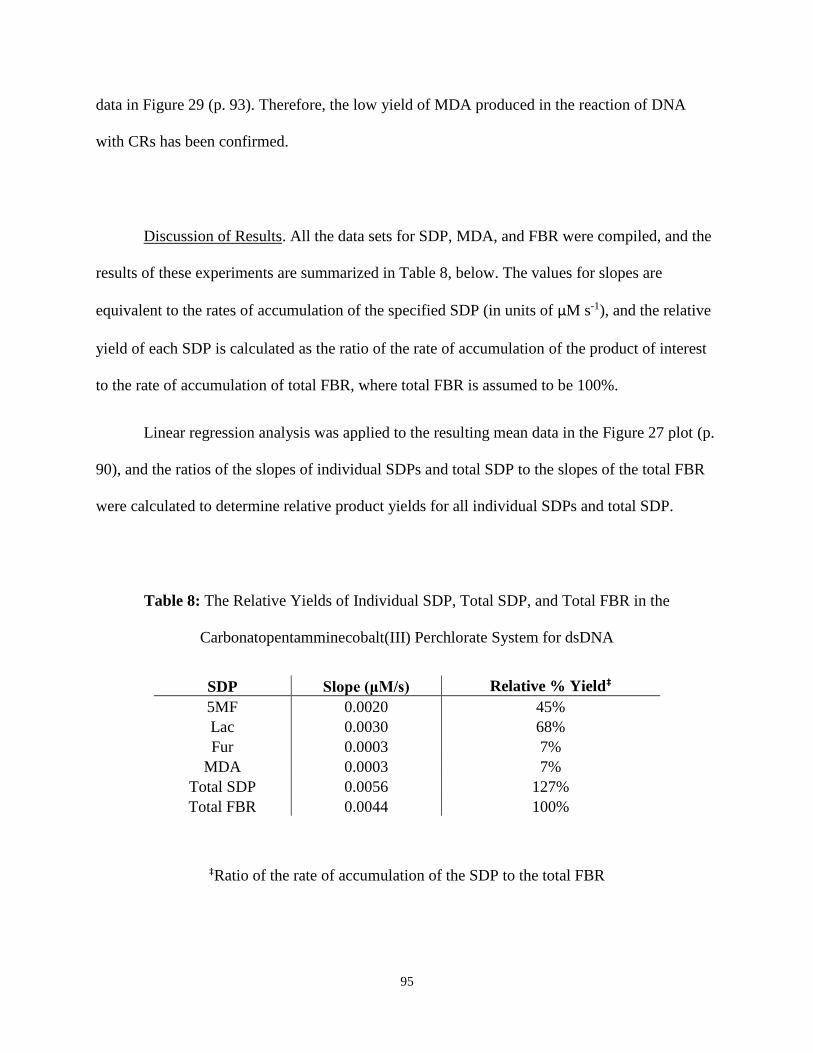
95
data in Figure 29 (p. 93). Therefore, the low yield of MDA produced in the reaction of DNA
with CRs has been confirmed.
Discussion of Results. All the data sets for SDP, MDA, and FBR were compiled, and the
results of these experiments are summarized in Table 8, below. The values for slopes are
equivalent to the rates of accumulation of the specified SDP (in units of μM s-1), and the relative
yield of each SDP is calculated as the ratio of the rate of accumulation of the product of interest
to the rate of accumulation of total FBR, where total FBR is assumed to be 100%.
Linear regression analysis was applied to the resulting mean data in the Figure 27 plot (p.
90), and the ratios of the slopes of individual SDPs and total SDP to the slopes of the total FBR
were calculated to determine relative product yields for all individual SDPs and total SDP.
Table 8: The Relative Yields of Individual SDP, Total SDP, and Total FBR in the
Carbonatopentamminecobalt(III) Perchlorate System for dsDNA
SDP Slope (μM/s) Relative % Yield‡
5MF 0.0020 45%
Lac 0.0030 68%
Fur 0.0003 7%
MDA 0.0003 7%
Total SDP 0.0056 127%
Total FBR 0.0044 100%
‡Ratio of the rate of accumulation of the SDP to the total FBR
96
These data show an overall C4΄preference (of which Lac and MDA are characteristic
products) in the photolyzed carbonatopentamminecobalt(III) perchlorate system, and the trend
follows C4΄ > C1΄ >> C5΄. The preferential order for hydrogen abstraction by CR matches that
for HO•. However, the actual yields of the products – and thus the contribution of each pathway
– are quite different than reported by our research group for HO•17
. The ratio of the contribution
of the C4΄ pathway (as measured by Lac + MDA) to the C1΄ pathway (as measured by 5MF) the
decreases from ~1.9 for the HO• damage17
to ~1.7 for the CR damage (present work). This
decrease may be explained by a greater selectivity of CR as a hydrogen abstractor and hence by a
more significant contribution of the thermodynamic control to the hydrogen abstraction kinetic
process. This results in a preferential formation of a more stable C1΄ radical in the case of CR
chemistry (thermodynamic control) rather than preferential abstraction of more surface
accessible C4΄ and C5΄ hydrogen in the case of the HO• chemistry (kinetic control). This model
also explains very low yields of Fur (the C5΄ chemistry product) in the reaction of CR with DNA
as compared to the reaction of HO•.
Interestingly, very low yields of MDA were observed in the present experiments. The
yield of MDA in the present work comprises only 10% of the yield of Lac, while in the reaction
of HO• with DNA sugar the contribution of MDA was much more significant: ~1/2 of the yield
of Lac. At first glance, this is a paradox since both products are believed to stem from the same
parent intermediate, C4΄-OAS (see Figure 5, page 26). In this case, one should not expect any
difference in the Lac-to-MDA ratio between the carbonate and hydroxyl radicals, since different
hydrogen abstracting selectivity of these two ROS would affect only the yield of C4΄-OAS but
not its further transformations. A likely explanation for the low relative yield of MDA in the
carbonatopentamminecobalt(III) solution is that cobalt(III) in the complex is a mild oxidant
97
capable of oxidizing a C4΄ radical into a carbocation (the left part of the scheme in Figure 5). As
a result, the pathway culminating in the C4΄-OAS formation dominates (the left part in Figure 5)
over the MDA pathway (the right part in Figure 5).
There is an appreciable imbalance between the FBR and total SDP yields, which leads to
an inflated value for total SDP of an unrealistic 127% in Table 8 (p. 95). This is most probably
the result of base modification reactions occurring in the reaction solution. Since the
methodology relies heavily on free unaltered base release to quantify the product yields, the
oxidation of these bases (most likely guanine to 8oxoG and its further oxidation products) can
artificially deflate the total amount of FBR present in the solution, and the combinative effect on
total SDP is that the yield of sugar damage products is greater than 100%.
It is very important to compare the rate of reactions of CRs with guanine reported by
Shafirovich with the cumulative rate of reactions of these species with DNA sugar. While base
damage by CRs have been extensively studied by the Shafirovich research group, this is the first
time that DNA sugar damage by CRs has been analyzed, and the comparison of rates is
necessary for further understanding of the mechanistic effect of CR-mediated oxidative damage
to DNA.
The Roginskaya research group (Roginskaya M, Ampadu-Boateng, D, and
Razskazovskiy, Y, unpublished data) has estimated the initial rate (during the first 10 s) of
accumulation of 8oxoG, a key indicator of guanine damage, to be ~ 4.5 μM/s (Figure 31). The
determination of 8oxoG yields was accomplished using the method of complete DNA hydrolysis
in hot (150°C) 88% formic acid for 90 min following lyophilization and reconstitution of the
precipitate in an HPLC buffer117
. It can be seen from Figure 31 that the kinetics of 8oxoG
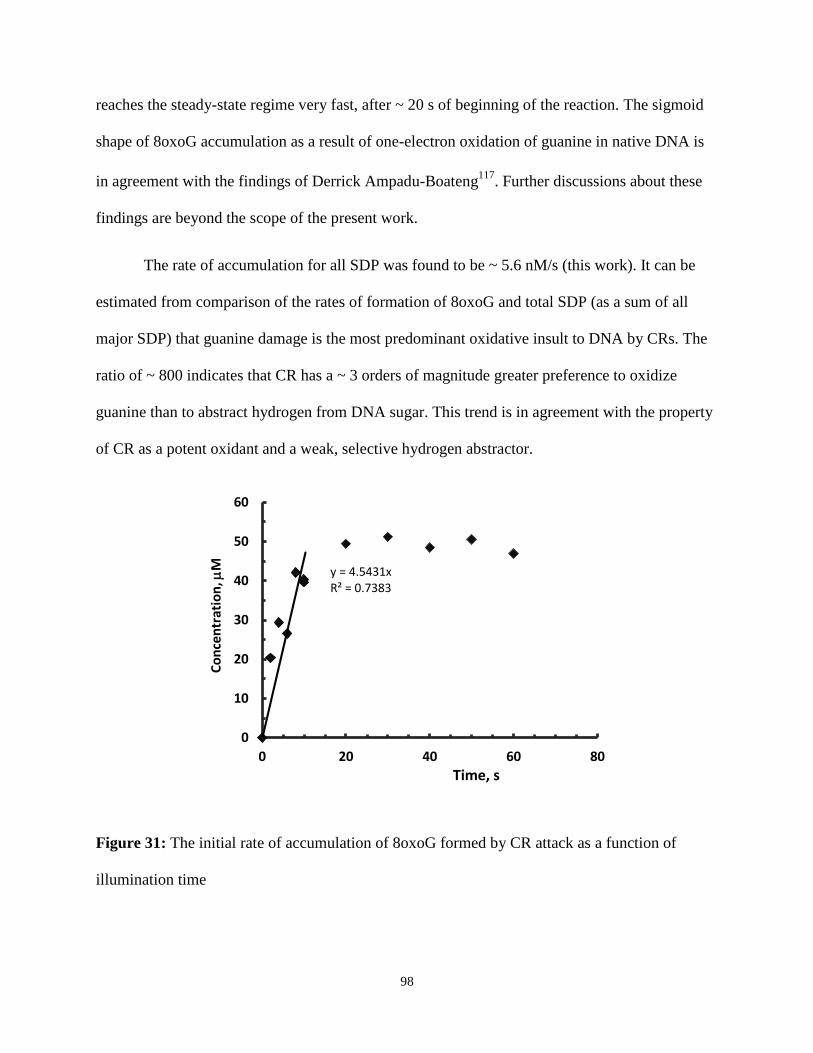
98
reaches the steady-state regime very fast, after ~ 20 s of beginning of the reaction. The sigmoid
shape of 8oxoG accumulation as a result of one-electron oxidation of guanine in native DNA is
in agreement with the findings of Derrick Ampadu-Boateng117
. Further discussions about these
findings are beyond the scope of the present work.
The rate of accumulation for all SDP was found to be ~ 5.6 nM/s (this work). It can be
estimated from comparison of the rates of formation of 8oxoG and total SDP (as a sum of all
major SDP) that guanine damage is the most predominant oxidative insult to DNA by CRs. The
ratio of ~ 800 indicates that CR has a ~ 3 orders of magnitude greater preference to oxidize
guanine than to abstract hydrogen from DNA sugar. This trend is in agreement with the property
of CR as a potent oxidant and a weak, selective hydrogen abstractor.
Figure 31: The initial rate of accumulation of 8oxoG formed by CR attack as a function of
illumination time
y = 4.5431xR² = 0.7383
0
10
20
30
40
50
60
0 20 40 60 80
Co
nce
ntr
atio
n,
M
Time, s
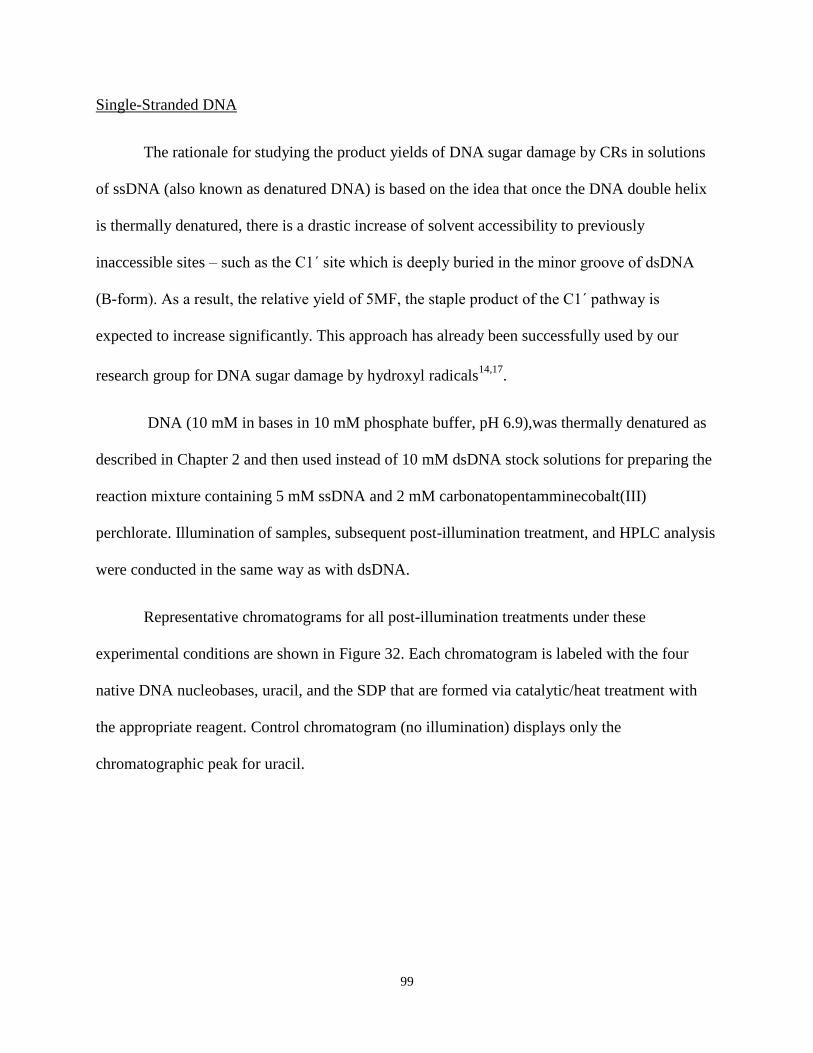
99
Single-Stranded DNA
The rationale for studying the product yields of DNA sugar damage by CRs in solutions
of ssDNA (also known as denatured DNA) is based on the idea that once the DNA double helix
is thermally denatured, there is a drastic increase of solvent accessibility to previously
inaccessible sites – such as the C1΄ site which is deeply buried in the minor groove of dsDNA
(B-form). As a result, the relative yield of 5MF, the staple product of the C1΄ pathway is
expected to increase significantly. This approach has already been successfully used by our
research group for DNA sugar damage by hydroxyl radicals14,17
.
DNA (10 mM in bases in 10 mM phosphate buffer, pH 6.9),was thermally denatured as
described in Chapter 2 and then used instead of 10 mM dsDNA stock solutions for preparing the
reaction mixture containing 5 mM ssDNA and 2 mM carbonatopentamminecobalt(III)
perchlorate. Illumination of samples, subsequent post-illumination treatment, and HPLC analysis
were conducted in the same way as with dsDNA.
Representative chromatograms for all post-illumination treatments under these
experimental conditions are shown in Figure 32. Each chromatogram is labeled with the four
native DNA nucleobases, uracil, and the SDP that are formed via catalytic/heat treatment with
the appropriate reagent. Control chromatogram (no illumination) displays only the
chromatographic peak for uracil.
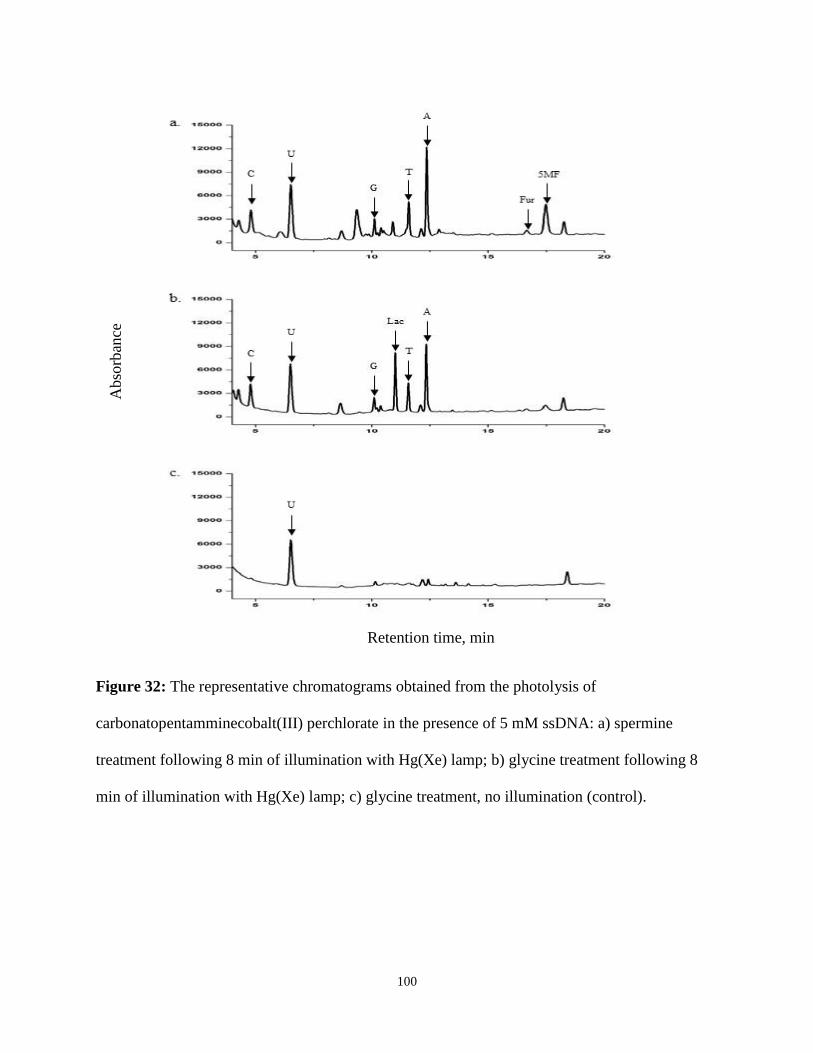
100
Figure 32: The representative chromatograms obtained from the photolysis of
carbonatopentamminecobalt(III) perchlorate in the presence of 5 mM ssDNA: a) spermine
treatment following 8 min of illumination with Hg(Xe) lamp; b) glycine treatment following 8
min of illumination with Hg(Xe) lamp; c) glycine treatment, no illumination (control).
Retention time, min
Abso
rban
ce
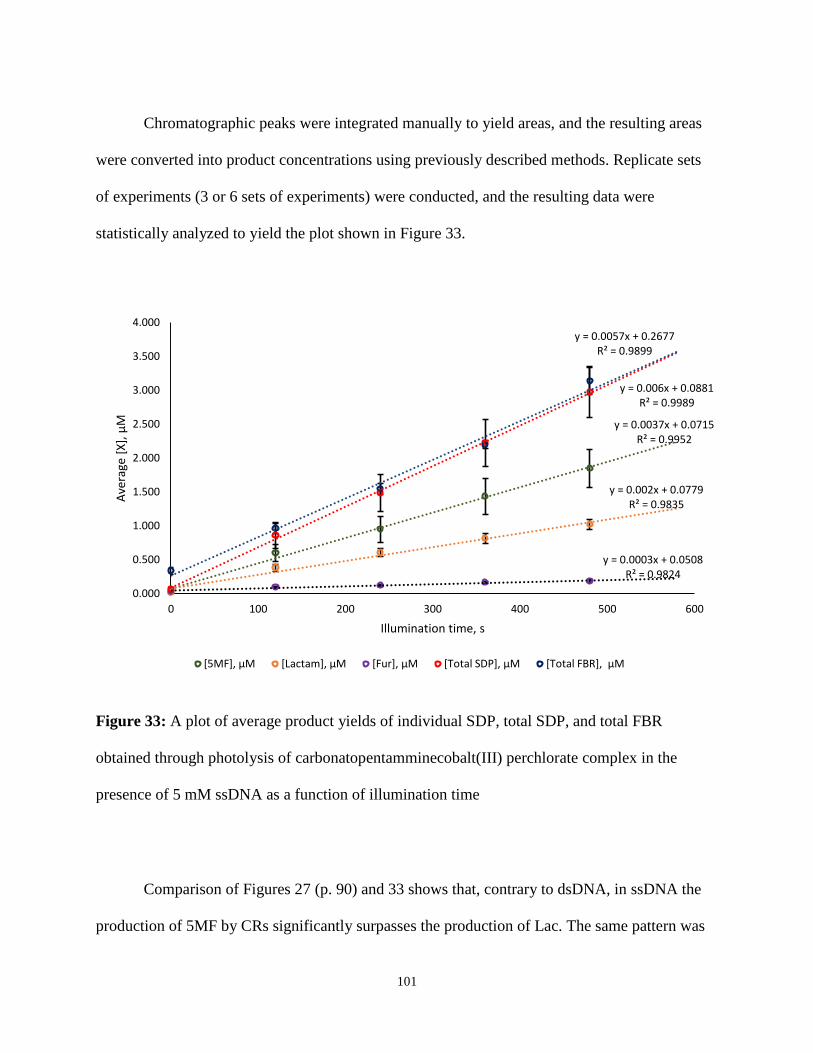
101
Chromatographic peaks were integrated manually to yield areas, and the resulting areas
were converted into product concentrations using previously described methods. Replicate sets
of experiments (3 or 6 sets of experiments) were conducted, and the resulting data were
statistically analyzed to yield the plot shown in Figure 33.
Figure 33: A plot of average product yields of individual SDP, total SDP, and total FBR
obtained through photolysis of carbonatopentamminecobalt(III) perchlorate complex in the
presence of 5 mM ssDNA as a function of illumination time
Comparison of Figures 27 (p. 90) and 33 shows that, contrary to dsDNA, in ssDNA the
production of 5MF by CRs significantly surpasses the production of Lac. The same pattern was
y = 0.0037x + 0.0715R² = 0.9952
y = 0.002x + 0.0779R² = 0.9835
y = 0.0003x + 0.0508R² = 0.9824
y = 0.006x + 0.0881R² = 0.9989
y = 0.0057x + 0.2677R² = 0.9899
0.000
0.500
1.000
1.500
2.000
2.500
3.000
3.500
4.000
0 100 200 300 400 500 600
Ave
rage
[X
], μ
M
Illumination time, s
[5MF], μM [Lactam], μM [Fur], μM [Total SDP], μM [Total FBR], μM
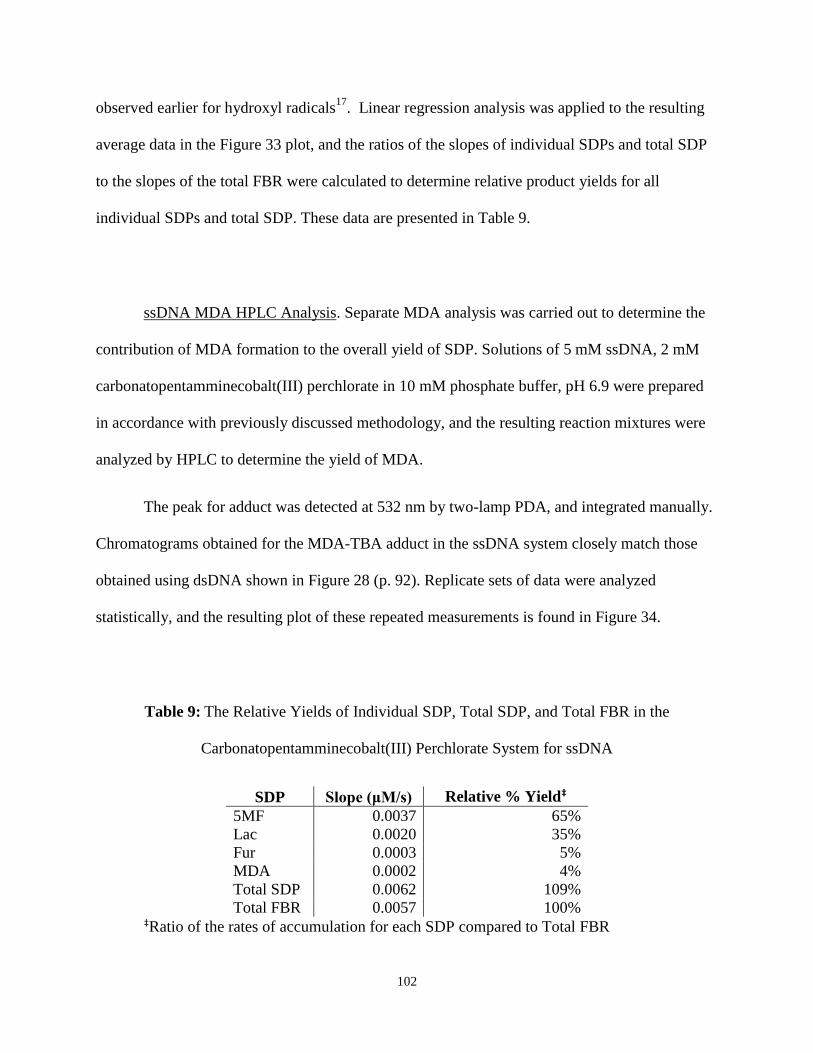
102
observed earlier for hydroxyl radicals17
. Linear regression analysis was applied to the resulting
average data in the Figure 33 plot, and the ratios of the slopes of individual SDPs and total SDP
to the slopes of the total FBR were calculated to determine relative product yields for all
individual SDPs and total SDP. These data are presented in Table 9.
ssDNA MDA HPLC Analysis. Separate MDA analysis was carried out to determine the
contribution of MDA formation to the overall yield of SDP. Solutions of 5 mM ssDNA, 2 mM
carbonatopentamminecobalt(III) perchlorate in 10 mM phosphate buffer, pH 6.9 were prepared
in accordance with previously discussed methodology, and the resulting reaction mixtures were
analyzed by HPLC to determine the yield of MDA.
The peak for adduct was detected at 532 nm by two-lamp PDA, and integrated manually.
Chromatograms obtained for the MDA-TBA adduct in the ssDNA system closely match those
obtained using dsDNA shown in Figure 28 (p. 92). Replicate sets of data were analyzed
statistically, and the resulting plot of these repeated measurements is found in Figure 34.
Table 9: The Relative Yields of Individual SDP, Total SDP, and Total FBR in the
Carbonatopentamminecobalt(III) Perchlorate System for ssDNA
SDP Slope (μM/s) Relative % Yield‡
5MF 0.0037 65%
Lac 0.0020 35%
Fur 0.0003 5%
MDA 0.0002 4%
Total SDP 0.0062 109%
Total FBR 0.0057 100% ‡Ratio of the rates of accumulation for each SDP compared to Total FBR
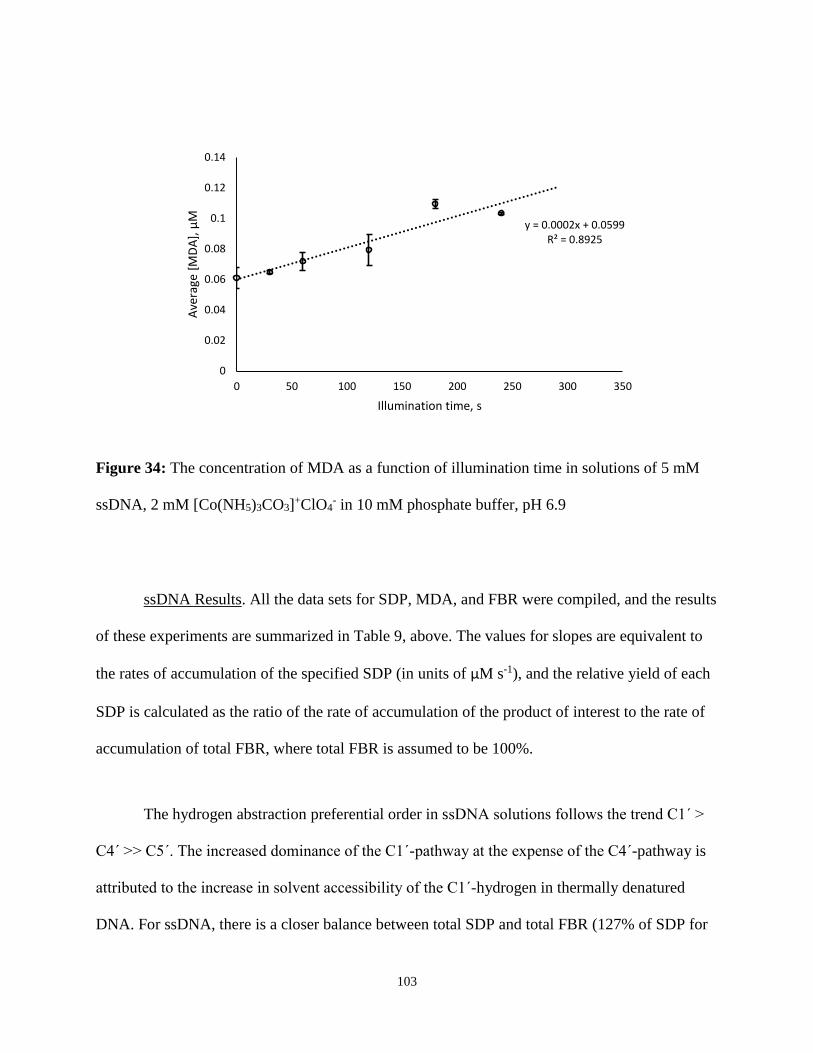
103
Figure 34: The concentration of MDA as a function of illumination time in solutions of 5 mM
ssDNA, 2 mM [Co(NH5)3CO3]+ClO4
- in 10 mM phosphate buffer, pH 6.9
ssDNA Results. All the data sets for SDP, MDA, and FBR were compiled, and the results
of these experiments are summarized in Table 9, above. The values for slopes are equivalent to
the rates of accumulation of the specified SDP (in units of μM s-1), and the relative yield of each
SDP is calculated as the ratio of the rate of accumulation of the product of interest to the rate of
accumulation of total FBR, where total FBR is assumed to be 100%.
The hydrogen abstraction preferential order in ssDNA solutions follows the trend C1΄ >
C4΄ >> C5΄. The increased dominance of the C1΄-pathway at the expense of the C4΄-pathway is
attributed to the increase in solvent accessibility of the C1΄-hydrogen in thermally denatured
DNA. For ssDNA, there is a closer balance between total SDP and total FBR (127% of SDP for
y = 0.0002x + 0.0599R² = 0.8925
0
0.02
0.04
0.06
0.08
0.1
0.12
0.14
0 50 100 150 200 250 300 350
Ave
rage
[M
DA
], μ
M
Illumination time, s
104
dsDNA and 109% of SDP for ssDNA). Interestingly, for hydroxyl radical-mediated damage of
DNA sugar, denaturation of DNA also resulted in a close to 100% balance between SDP and
FBR17
. This likely indicates that elimination of steric hindrances in ssDNA allows all DNA sites
to exhibit their 'true' reactivity towards a given ROS.
105
CHAPTER 4
CONCLUSIONS
Interest in the CR as an emerging ROS in biology and chemistry of oxidative stress has
been recently dramatically increased due to numerous findings during the last 10-15 years which
shed light on the great significance of this free radical oxidizing intermediate in physiological
processes and, in particular, in DNA damage during oxidative stress. While the reactions
between CR and DNA nucleobases have been extensively studied, the reactivity of this ROS
toward DNA 2΄-deoxyribose has never been reported. From the experimental data collection
described in Chapter 3, the following conclusions have been made:
1. The present work has demonstrated for the first time that CRs abstract hydrogens from
DNA 2΄-deoxyribose. These reactions have never been reported before, though they
could be predicted based on analogous reactions of CRs with other sugars such as
glucose92,93,95
and glycosaminoglycans90,91
, with the bimolecular reaction rate constants in
the order of 104 – 105 M-1 s1 92,95
.
2. While the general trend for CR-mediated hydrogen abstraction from DNA 2΄-deoxyribose
mirrors the observed trend for HO• (C4΄ > C1΄ > C5΄), the actual ratios of product yields
differ for CR as compared to HO•, which is indicative of a difference in hydrogen
abstracting selectivity between these two ROS. The relative contribution of pathways of
106
hydrogen abstraction from DNA 2΄-deoxyribose for CRs is: C1΄, 36%; C4΄, 59%, and
C5΄, 5% (present work), while for HO• it is C1΄, 22%; C4΄, 62%; and C5΄, 16% 17
. So,
while there is no essential difference in the relative contribution of the C4΄ pathway, in
CR-mediated DNA sugar damage there is a pronounced increase of the C1΄ pathway by
the expense of the C5΄ pathway as compared to the HO•-mediated damage. Because of
the lack of resonance stabilization in HO•, the hydroxyl radical is a more indiscriminate
hydrogen abstractor, while CR is a more selective hydrogen abstractor due to resonance
stabilization. As a result, CR tends to abstract hydrogen from the weakest C-H bond of
DNA 2΄-deoxyribose (at C1΄), so that the most stable 2΄-deoxyribosyl radical is formed,
as opposed to the tendency of HO• to abstract hydrogen from the most solvent-accessible
position in 2΄-deoxyribose (at C5΄). Thus in CR-mediated DNA 2΄-deoxyribose damage,
the C5΄ pathway is suppressed, and the C1΄ pathway is stimulated because accessibility
is no longer the most important factor while the stability of a 2΄-deoxyribosyl radical
becomes more significant.
3. Three techniques of CR generation have been tested in the present work to find the most
adequate system for use in our HPLC-based methods of analysis of low-molecular
products of DNA damage: X-irradiation of bicarbonate solutions, photolysis of
persulfate/bicarbonate solutions, and photolysis of carbonatopentamminecobalt(III)
complexes. Of the three techniques evaluated only in the latter method no ROS capable
of competing with CR were produced, which provided unequivocal certainty that
observed DNA sugar damage is inferred by CRs. Therefore, photolysis of
107
carbonatopentamminecobalt(III) complexes has been chosen as the optimal method of
CR generation in the present work.
4. It has been found that in the reaction of CR with DNA, the initial rate of accumulation of
8oxoG, a key product of guanine oxidation, exceeds the rate of accumulation of total
sugar damage products by a factor of ~ 800. Since 8oxoG is one of the major, but not the
only product of guanine oxidation, this ratio can be interpreted as a lower limit of the
branching ratio of two competing processes in the reaction of CR with DNA: a one-
electron oxidation of guanines and hydrogen abstraction from DNA sugar. This ~ 800-
fold preference of CR for guanines in DNA over DNA sugar as compared to only 2-fold
preference of hydroxyl radicals11
is not surprising taking into account an essential
difference in the rate constants of the hydrogen abstraction reactions of CR and HO•.
To summarize, it has been demonstrated for the first time that CRs react with 2΄-
deoxyribose via hydrogen abstraction reactions at the C1΄, C4΄, and C5΄ positions. The ratio of
rates of accumulation of 8oxoG and rates of accumulation of products of damage to 2΄-
deoxyribose has been estimated as ~800. These finding are in line with the hypothesis that CR is
a potent one-electron oxidant and a weak, selective hydrogen abstractor.
108
REFERENCES
1. Valko, M. M., H.; Cronin, M. T. D. Curr. Med. Chem. 2005, 12, 1161-1208.
2. Cadet, J. D., T.; Pouget, J. P.; Ravanat, J. L.; Sauvaigo, S. Curr. Probl. Dermatol. 2001,
29, 62-73.
3. Cook, J. A.; Gius, D.; Wink, D. A.; Krishna, M. C.; Russo, A.; Mitchell, J. B. Semin.
Radiat. Oncol. 2004, 14, 259-266.
4. Schmidt-Ullrich, R. K.; Dent, P.; Grant, S.; Mikkelsen, R. B.; Valerie, K. Radiat. Res.
2000, 153, 245-257.
5. Shirley, R. O., E. N. J.; Work, L. Antioxidants 2014, 3, 472-501.
6. Toyokuni, S. O., K.; Yodoi, J.; Hiai, H. FEBS Lett. 1995, 358, 1-3.
7. Gil-Mohapel, J.; Brocardo, P. S.; Christie, B. R. Curr. Drug Targets 2014, 15, 454-468.
8. Xing, S. S., D.; Chen, C.; Wang, J.; Yu, Z. Mol. Med. Rep. 2014, 10, 599-604.
9. Aoshiba, K. Z., F.; Tsuji, T.; Nagai, A. Eur. Respir. J. 2012, 39, 1368-1376.
10. Ishii, T.; Yasuda, K.; Akatsuka, A.; Hino, O.; Hartman, P. S.; Ishii, N. Cancer Res. 2005,
65, 203-209.
11. Xu, Y. J.; Kim, E. Y.; Demple, B. J. Biol. Chem. 1998, 273, 28837-28844.
12. Pogozelski, W. K.; Tullius, T. D. Chem. Rev. 1998, 98, 1089-1107.
13. Colson, A.-O.; Sevilla, M. D. J. Phys. Chem. 1995, 99, 3867-74.
14. Price, C. S.; Razskazovskiy, Y.; Bernhard, W. A. Radiat. Res. 2010, 174, 645-649.
15. Roginskaya, M.; Razskazovskiy, Y.; Bernhard, W. A. Angew. Chem. Int. Ed. (English)
2005, 44, 6210-6213.
109
16. Roginskaya, M.; Bernhard, W. A.; Marion, R. T.; Razskazovskiy, Y. Radiat. Res. 2005,
163, 85-89.
17. Roginskaya, M.; Mohseni, R.; Moore, T. J.; Bernhard, W. A.; Razskazovskiy, Y. Radiat.
Res. 2014, 181, 131-137.
18. Roginskaya, M. Oxidative Damage to DNA by Ionizing Radiation: Chemical Pathways
and Radioprotection; Ph. D. Dissertation, University of Rochester: Rochester, NY, 2006,
pp 231.
19. Miaskiewicz, K.; Osman, R. J. Am. Chem. Soc. 1994, 116, 232-238.
20. von Sonntag, C.; Hagen, U.; Schon-Bopp, A.; Schulte-Frohlinde, D. Adv. in Rad. Biol.
1981, 9, 109-142.
21. Stelter, L.; von Sonntag, C.; Schulte-Frohlinde, D. Int. J. Radiat. Biol. 1974, 25, 515.
22. Behrens, G.; Koltzenburg, G.; Ritler, A. Int. J. Radiat. Biol. 1978, 33, 163.
23. Giese, B.; Burger, J.; Kang, T. W.; Kesselheim, C.; Wittmer, T. J. Am. Chem. Soc. 1992,
114.
24. von Sonntag, C. The Chemical Basis of Radiation Biology; Taylor & Francis: London–
New York–Philadelphia, 1987.
25. Balasubramanian, B.; Pogozelski, W. K.; Tullius, T. D. Proc. Natl. Acad. Sci. U.S.A.
1998, 95(17), 9738-43.
26. Dizdaroglu, M.; von Sonntag, C.; Schulte-Frohlinde, D. J. Am. Chem. Soc. 1975, 97,
2277-2228.
27. Dizdaroglu, M.; von Sonntag, C.; Schulte-Frohlinde, D. Z. Naturforsch C 1975, 30, 826-
828.

110
28. Regulus, P.; Duroux, B.; Bayle, P. A.; Favier, A.; Cadet, J.; Ravanat, J. L. Proc. Natl.
Acad. Sci. U.S.A. 2007, 104, 14037-14037.
29. Sczepanski, J. T.; Jacobs, A. C.; Majumdar, A.; Greenberg, M. M. J. Am. Chem. Soc.
2009, 131.
30. Sczepanski, J. T.; Hiemstra, C. N.; Greenberg, M. M. Bioorg. Med. Chem. 2011, 19.
31. Greenberg, M. M.; Weledji, Y. N.; Kim, J.; Bales, B. C. Biochemistry 2004, 43, 8178-
8183.
32. Jacobs, A. C.; Kreller, C. R. Biochemistry 2011, 50, 136-143.
33. Dhar, S.; Kodama, T.; Greenberg, M. M. J. Am. Chem. Soc. 2007, 129, 8702-8703.
34. Chen, B.; Zhou, X.; Taghizadeh, K.; Chen, J.; Strubbe, J. A.; Dedon, P. C. Chem. Res.
Toxicol. 2007, 20, 1701-1708.
35. Giera, M.; Lingeman, H.; Niessen, W. M. A. Chromatographia 2012, 75, 433-440.
36. von Sonntag, C.; Rashid, R.; Langfinder, D.; Wagner, R.; Schuchmann, H.-P. Int. J.
Radiat. Biol. 1999, 75, 101-109.
37. Nair, V.; Turner, G. A. Lipids 1984, 19, 804-805.
38. Marnett, L. J.; Niedernhofer, L. J.; Daniels, J. S.; Rouzer, C. A.; Greene, R. E. J. Biol.
Chem. 2003, 278, 31426-31433.
39. Del Rio, D.; Stewart, A. J.; Pellegrini, N. Nutr. Metab. Cardiovasc. Dis. 2005, 15, 316-
328.
40. Nair, V.; Cooper, C. S.; Vietti, D. E.; Turner, G. A. Lipids 1986, 21, 6-10.
41. Crespo-Hernandez, C. E.; Close, D. M.; Gorb, L.; Leszczynski, J. J. Phys. Chem. 2007,
111, 5386-5395.
111
42. Fukuzumi, K.; Miyao, H.; Ohkubo, K.; Suenobu, T. J. Phys. Chem. A. 2005, 109, 3285-
3294.
43. Steenken, S. Free Radic. Res. Commun. 1992, 16, 349-379.
44. Reynisson, J.; Steenken, S. Phys. Chem. Chem. Phys. 2002, 4, 5346-5352.
45. Close, D. M. J. Phys. Chem. A 2013, 117, 473-480.
46. Shafirovich, V.; Dourandin, A.; Huang, W.; Geacintov, N. E. J. Biol. Chem. 2001, 276,
24261-24626.
47. Close, D. M.; Nelson, W. H.; Bernhard, W. A. J. Phys. Chem. A 2013, 117, 12608-12615.
48. Wang, W.; Razskazovskii, Y.; Sevilla, M. D. Int. J. Radiat. Biol. 1997, 71, 387-399.
49. Cai, Z.; Sevilla, M. D. Radiat. Res. 2003, 159, 411-419.
50. Saito, I.; Nakamura, T.; Nakatani, K.; Yoshioka, Y.; Yamaguchi, K.; Sugiyama, H. J.
Am. Chem. Soc. 1998, 120, 12686-12687.
51. Cadet, J.; Douki, T.; Gasparutto, D.; J-L., R. Mutat. Res. 2003, 531.
52. Douki, T.; Martini, R.; Ravanat, J.-L.; Turesky, R. J.; Cadet, J. Carcinogenesis 1997, 18,
2385-2391.
53. Rokhlenko, Y.; Geacintov, N. E.; Shafirovich, V. J. Am. Chem. Soc. 2012, 134, 4955-
4962.
54. Burrows, C. J.; Muller, J. G. Chem. Rev. 1998, 98, 1109-1151.
55. Cullis, P. M.; Malone, M. E.; Merson-Davies, L. A. J. Am. Chem. Soc. 1996, 118, 2775-
2781.
56. Doddridge, A. Z.; Cullis, P. M.; Jones, G. D. D.; Malone, M. E. J. Am. Chem. Soc. 1998,
120, 10998-10999.
112
57. Asami, S.; Hirano, T.; Yamaguchi, R.; Tomioka, Y.; Itoh, H.; Kasai, H. Cancer Res.
1996, 56, 2546-2549.
58. Kiyosawa, H.; Suko, M.; Okudiara, H.; Murata , K.; Miyamoto, T.; Chung, M. H.; Kasai,
H.; Nishimura, S. Free Radic. Res. Commun. 1990, 11, 23-27.
59. Jackson, J. H.; Schraufstatter, I. U.; Hyslop, P. A.; Vosbeck, K.; Sauerheber, R.;
Weitzman, S. A.; Cochrane, C. G. J. Clin. Invest. 1987, 80, 1090-1095.
60. Chen, Q.; Marsh, J.; Ames, B.; Mossman, B. Carcinogenesis 1996, 17, 2525-2527.
61. Valavandis, A.; Vlachogianni, T. J. Environ. Sci. Health., Part C. 2009, 27, 120-139.
62. Pope III, C. A.; Burnett, R. T.; Thun, M. J.; Calle, E. E.; Krewski, D.; Ito, K.; Thurston,
G. D. JAMA-J. Am. Med. Assoc. 2002, 287, 1132-1141.
63. Kasprzak, K. S. Free Radic. Biol. Med. 2002, 32, 958-967.
64. Marczynski, B.; Preuss, R.; Mensing, T.; Angerer, J.; Seidel, A.; El Mourabit, A.;
Wilhem, M.; Bruning, T. Int. Arch. Occup. Environ. Health 2005, 78, 97-108.
65. Marczynski, B.; Rihs, H.-P.; Rossbach, B.; Holzer, J.; Angerer, J.; Scherenberg, M.;
Hoffman, G.; Bruning, T.; Wilhelm, M. Carcinogenesis 2002, 23, 273-281.
66. Toraason, M.; Hayden, C.; Marlow, D.; Rinehart, R.; Mathias, P.; Werren, D.; Olsen, L.
D.; Neumeister, C. E.; Mathews, E. S.; Cheever, K. L.; Marlow, K. L.; Debord, D. G.;
Reid, T. M. Int. Arch. Occup. Environ. Health 2001, 74, 396-404.
67. Steenken, S.; Jovanovic, S. V.; Bietti, M.; Berhard, K. J. Am. Chem. Soc. 2000, 112,
2373-2374.
68. Delaney, S.; Neeley, W. L.; Delaney, J. C.; Essigmann, J. M. Biochemistry 2007, 46,
1448-1455.
113
69. Luo, W.; Muller, J. M.; Rachlin, E. M.; Burrow, C. J. Chem. Res. Toxicol. 2001, 14, 927-
938.
70. Duarte, V.; Muller, J. G.; Burrows, C. J. Nucleic Acids Res. 1999, 27, 496-502.
71. Sheu, C.; Foote, C. S. J. Am. Chem. Soc. 1995, 117, 474-477.
72. Sheu, C.; Foote, C. S. J. Am. Chem. Soc. 1995, 117, 6439-6442.
73. Medinas, D. B.; Cerchiaro, G.; Trindade, D. F.; Augusto, O. IUBMB Life 2007, 59, 255-
262.
74. Lymar, S. V.; Hurst, J. K. J. Am. Chem. Soc. 1995, 117, 8867-8868.
75. Augusto, O.; Bonini, M. G.; Amanso, A. M.; Linares, E.; Santos, C. C. X.; De Menezes,
S. L. Free Radic. Biol. Med. 2002, 32, 841-859.
76. Liochev, S. I.; Fridovich, I. Free Radic. Biol. Med. 2010, 48, 1565-1569.
77. Shafirovich, V.; Young, A. L.; Durandin, A.; Dedon, P. C.; Geacintov, N. E. J. Phys.
Chem. B. 2008, 112, 1834-1844.
78. Neta, P.; Huie, R. E.; Ross, A. B. J. Phys. Chem. Ref. Data 1988, 17, 1027-1284.
79. Czapski, G.; Lymar, S. V.; Schwarz, H. A. J. Phys. Chem. A 1999, 103.
80. Hodgson, E. K.; Fridovich, I. Arch. Biochem. Biophys. 1976, 172, 202-205.
81. Bonini, M. G.; Radi, R.; Ferrer-Sueta, G.; Ferreira, A. M. D. C.; Augusto, O. J. Biol.
Chem. 1999, 274, 10802-10806.
82. Buxton, G. V.; Wood, N. D.; Dyster, S. J. Chem. Soc., Faraday Trans. 1 1988, 84, 1113-
1121.
83. Warner, D. S.; Sheng, H.; Batinic-Haberle, I. J. Exp. Biol. 2004, 207, 3221-3231.
84. Busset, C. M., P; Sarakha, M.; De Laat, J. J. Photoch. Photobio. A. 2007, 185, 127-132.

114
85. Ivanov, K. L.; Glebov, E. M.; Plyusnin, V. F.; Ivanov, Y. V.; Grivnin, V. P.; Bazhin, N.
M. J. Photochem. Photobiol. A. 2000, 133.
86. Shafirovich, V.; Crean, C.; Lee, Y. A.; Yun, B. H.; Geacintov, N. E. ChemBioChem
2008, 9.
87. Joffe, A.; Geacintov, N. E.; Shafirovich, V. Chem. Res. Toxicol. 2003, 16, 1528-1538.
88. Crean, C.; Uvaydov, Y.; Geacintov, N. E.; Shafirovich, V. Nucleic Acids Res. 2008, 36,
742-755.
89. Yun, B. H.; Geacintov, N. E.; Shafirovich, V. Chem. Res. Toxicol. 2011, 24, 1144-1152.
90. Al-Assaf, S.; Navaratnam, S.; Parsons, B. J.; Phillips, G. O. Free Radic. Biol. Med. 2006,
40, 2018-2027.
91. Kennett, E. C.; Davies, M. J. Free Radic. Biol. Med. 2009, 47, 389-400.
92. Chen, S.; Hoffman, M. Z. Radiat. Res. 1973, 56, 40-47.
93. Carlsson, M. The Inter- and Intramolecular Selectivity of the Carbonate Radical Anion in
its Reaction with Lignin and Carbohydrates; Ph.D. Dissertation Kungliga Tekniska
Högskolan: Stockholm, 2005, pp 62.
94. Wardman, P. J. Phys. Chem. Ref 1989, Data 18, 1637-755.
95. Motohashi, N.; Saito, Y. Chem. Pharm. Bull. 1993, 41, 1842-1845.
96. Elliot, A. J.; Simsons, A. S. Radiat. Phys. Chem. 1984, 24, 229-231.
97. Chen, S.; Cope, V. W.; Hoffman, Z. J. Phys. Chem. 1972, 77, 1111-1116.
98. Ha, H. C.; Sirisoma, N. S.; Kuppusamy, P.; Zweier, J. L.; Woster, P. M.; Casero Jr., R. A.
Proc. Natl. Acad. Sci. U.S.A. 1998, 95, 11140-11145.
99. Braunlin, W. H.; Strick, T. J.; Record Jr., M. T. Biopolymers 1982, 21, 1301-1314.
100. Aso, M.; Kondo, M.; Suemune, H.; Hecht, S. M. J. Am. Chem. Soc. 1999, 121, 9023-9033.
115
101. Aso, M.; Usui, K.; Fukuda, M.; Kakihara, Y.; Goromaru, T.; Suemune, H. Org. Lett.
2006, 8, 3183-3186.
102. Usui, K.; Aso, M.; Fukuda, M.; Suemune, H. J. Org. Chem. 2008, 73, 241-248.
103. Scheffold, R.; Dubs, P. Helv. Chim. Acta 1967, 50, 798-808.
104. Basolo, F.; Murmann, R. K. Inorg. Synthesis 1953, 4, 173.
105. Allen, A. O. The Radiation Chemistry of Water and Aqueous Solutions; Van Nostrand:
Princeton, N.J., 1961.
106. Greenling, J. R. Fundamentals of Radiation Dosimetry; 2nd ed.; Taylor & Francis
Group: New York, 1985.
107. Kinter, M. J Chromatogr B 1995, 671, 223-236.
108. Uslu, C.; Taysi, S.; Bakan, N. Ann. Clin. Lab. Sci. 2003, 33, 18-22.
109. Udovicic, L.; Mark, F.; Bothe, E. Radiat. Res. 1994, 140, 166-171.
110. von Sonntag, C. Free-Radical-Induced DNA Damage and its Repair: A Chemical
Perspective.; Springer-Verlag: Berlin, 2006.
111. Breen, A.; Murphy, J. Free Radic. Biol. Med. 1995, 18, 1033-1077.
112. Chen, B.; Bohnert, T.; Zhou, X.; Dedon, P. C. Chem. Res. Toxicol. 2004, 17, 1406-1413.
113. Lahoud, G. A.; Hitt, A. L.; Bryant-Friedrich, A. C. Chem. Res. Toxicol. 2006, 19, 1630-
1636.
114. Chan, W.; Chen, B.; Wang, L.; Taghizadeh, K.; Demott, M. S.; Dedon, P. C. J. Am.
Chem. Soc. 2010, 132, 6145-6153.
116
115. Huie, R. E.; Clifton, C. L. J. Phys. Chem. 1990, 94, 8561-8567.
116. Herrmann, H.; Reese, A.; Zellner, R. J. Mol. Struct. 1995, 348, 183-186.
117. Ampadu-Boateng, D. A. Kinetics of Formation and Oxidation of 8-oxo-7,8-
dihydroguanine (8oxoG); Master’s Thesis.; East Tennessee State University: Johnson
City, TN, 2014, pp 105.
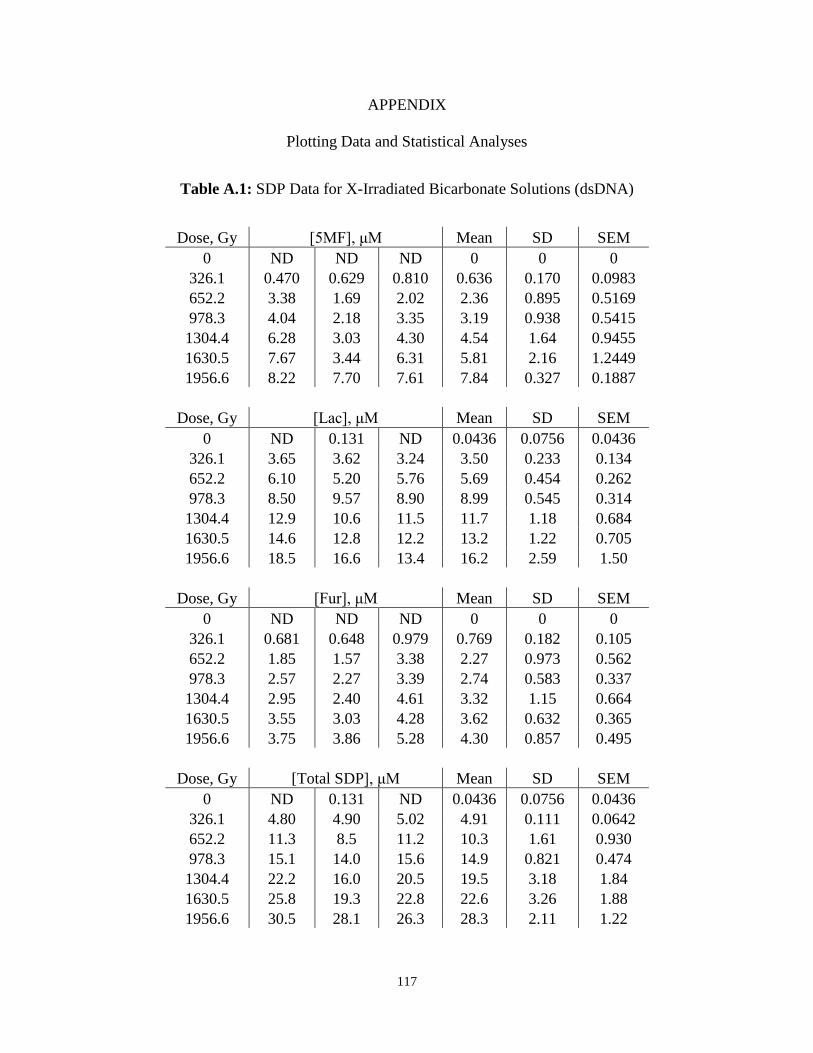
117
APPENDIX
Plotting Data and Statistical Analyses
Table A.1: SDP Data for X-Irradiated Bicarbonate Solutions (dsDNA)
Dose, Gy [5MF], μM Mean SD SEM
0 ND ND ND 0 0 0
326.1 0.470 0.629 0.810 0.636 0.170 0.0983
652.2 3.38 1.69 2.02 2.36 0.895 0.5169
978.3 4.04 2.18 3.35 3.19 0.938 0.5415
1304.4 6.28 3.03 4.30 4.54 1.64 0.9455
1630.5 7.67 3.44 6.31 5.81 2.16 1.2449
1956.6 8.22 7.70 7.61 7.84 0.327 0.1887
Dose, Gy [Lac], μM Mean SD SEM
0 ND 0.131 ND 0.0436 0.0756 0.0436
326.1 3.65 3.62 3.24 3.50 0.233 0.134
652.2 6.10 5.20 5.76 5.69 0.454 0.262
978.3 8.50 9.57 8.90 8.99 0.545 0.314
1304.4 12.9 10.6 11.5 11.7 1.18 0.684
1630.5 14.6 12.8 12.2 13.2 1.22 0.705
1956.6 18.5 16.6 13.4 16.2 2.59 1.50
Dose, Gy [Fur], μM Mean SD SEM
0 ND ND ND 0 0 0
326.1 0.681 0.648 0.979 0.769 0.182 0.105
652.2 1.85 1.57 3.38 2.27 0.973 0.562
978.3 2.57 2.27 3.39 2.74 0.583 0.337
1304.4 2.95 2.40 4.61 3.32 1.15 0.664
1630.5 3.55 3.03 4.28 3.62 0.632 0.365
1956.6 3.75 3.86 5.28 4.30 0.857 0.495
Dose, Gy [Total SDP], μM Mean SD SEM
0 ND 0.131 ND 0.0436 0.0756 0.0436
326.1 4.80 4.90 5.02 4.91 0.111 0.0642
652.2 11.3 8.5 11.2 10.3 1.61 0.930
978.3 15.1 14.0 15.6 14.9 0.821 0.474
1304.4 22.2 16.0 20.5 19.5 3.18 1.84
1630.5 25.8 19.3 22.8 22.6 3.26 1.88
1956.6 30.5 28.1 26.3 28.3 2.11 1.22
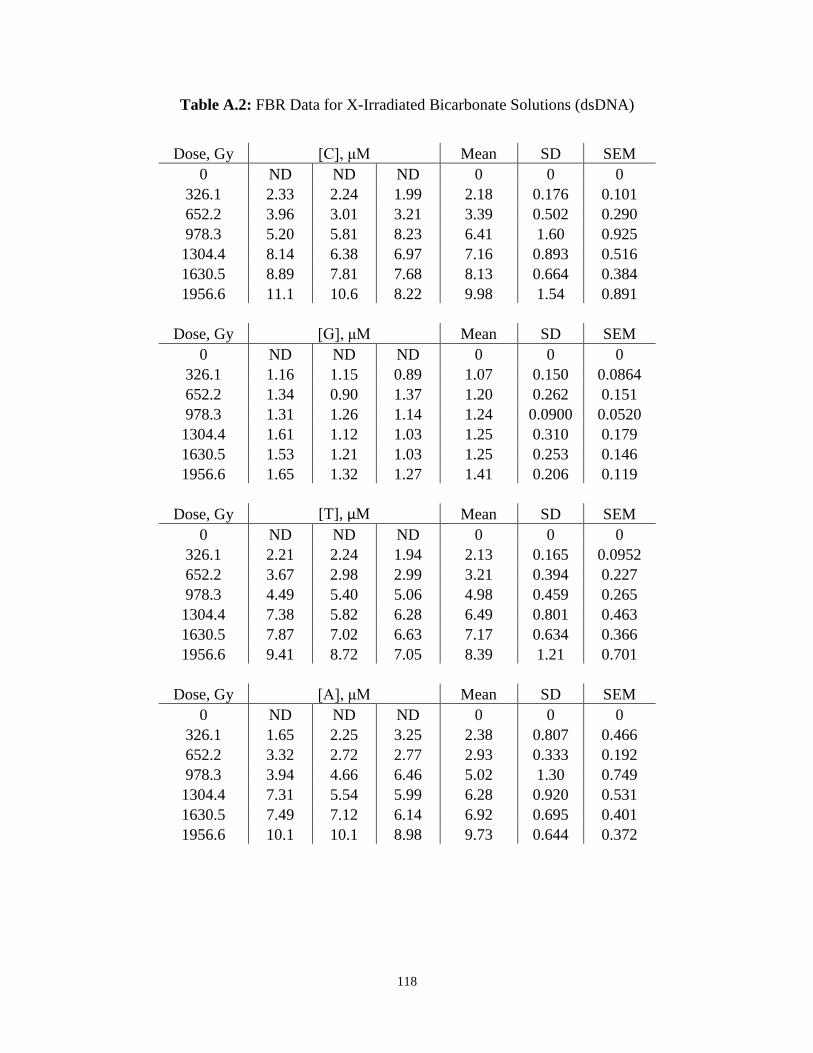
118
Table A.2: FBR Data for X-Irradiated Bicarbonate Solutions (dsDNA)
Dose, Gy [C], μM Mean SD SEM
0 ND ND ND 0 0 0
326.1 2.33 2.24 1.99 2.18 0.176 0.101
652.2 3.96 3.01 3.21 3.39 0.502 0.290
978.3 5.20 5.81 8.23 6.41 1.60 0.925
1304.4 8.14 6.38 6.97 7.16 0.893 0.516
1630.5 8.89 7.81 7.68 8.13 0.664 0.384
1956.6 11.1 10.6 8.22 9.98 1.54 0.891
Dose, Gy [G], μM Mean SD SEM
0 ND ND ND 0 0 0
326.1 1.16 1.15 0.89 1.07 0.150 0.0864
652.2 1.34 0.90 1.37 1.20 0.262 0.151
978.3 1.31 1.26 1.14 1.24 0.0900 0.0520
1304.4 1.61 1.12 1.03 1.25 0.310 0.179
1630.5 1.53 1.21 1.03 1.25 0.253 0.146
1956.6 1.65 1.32 1.27 1.41 0.206 0.119
Dose, Gy [T], μM Mean SD SEM
0 ND ND ND 0 0 0
326.1 2.21 2.24 1.94 2.13 0.165 0.0952
652.2 3.67 2.98 2.99 3.21 0.394 0.227
978.3 4.49 5.40 5.06 4.98 0.459 0.265
1304.4 7.38 5.82 6.28 6.49 0.801 0.463
1630.5 7.87 7.02 6.63 7.17 0.634 0.366
1956.6 9.41 8.72 7.05 8.39 1.21 0.701
Dose, Gy [A], μM Mean SD SEM
0 ND ND ND 0 0 0
326.1 1.65 2.25 3.25 2.38 0.807 0.466
652.2 3.32 2.72 2.77 2.93 0.333 0.192
978.3 3.94 4.66 6.46 5.02 1.30 0.749
1304.4 7.31 5.54 5.99 6.28 0.920 0.531
1630.5 7.49 7.12 6.14 6.92 0.695 0.401
1956.6 10.1 10.1 8.98 9.73 0.644 0.372
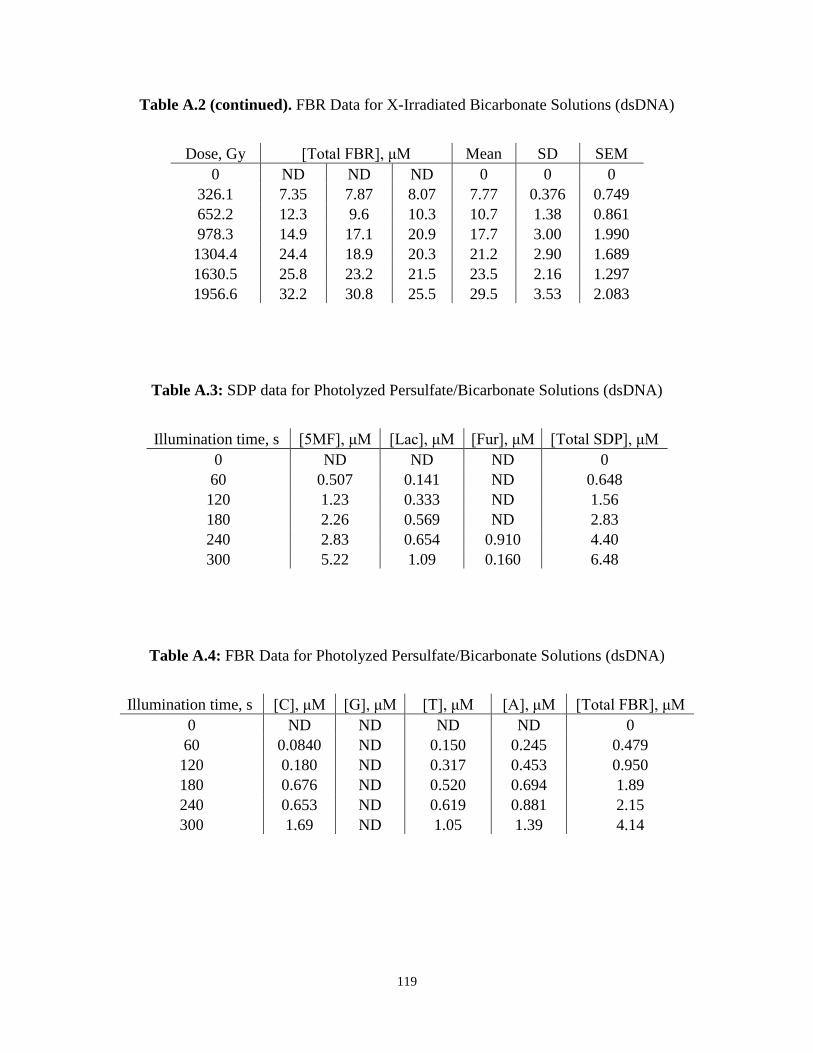
119
Table A.2 (continued). FBR Data for X-Irradiated Bicarbonate Solutions (dsDNA)
Dose, Gy [Total FBR], μM Mean SD SEM
0 ND ND ND 0 0 0
326.1 7.35 7.87 8.07 7.77 0.376 0.749
652.2 12.3 9.6 10.3 10.7 1.38 0.861
978.3 14.9 17.1 20.9 17.7 3.00 1.990
1304.4 24.4 18.9 20.3 21.2 2.90 1.689
1630.5 25.8 23.2 21.5 23.5 2.16 1.297
1956.6 32.2 30.8 25.5 29.5 3.53 2.083
Table A.3: SDP data for Photolyzed Persulfate/Bicarbonate Solutions (dsDNA)
Illumination time, s [5MF], μM [Lac], μM [Fur], μM [Total SDP], μM
0 ND ND ND 0
60 0.507 0.141 ND 0.648
120 1.23 0.333 ND 1.56
180 2.26 0.569 ND 2.83
240 2.83 0.654 0.910 4.40
300 5.22 1.09 0.160 6.48
Table A.4: FBR Data for Photolyzed Persulfate/Bicarbonate Solutions (dsDNA)
Illumination time, s [C], μM [G], μM [T], μM [A], μM [Total FBR], μM
0 ND ND ND ND 0
60 0.0840 ND 0.150 0.245 0.479
120 0.180 ND 0.317 0.453 0.950
180 0.676 ND 0.520 0.694 1.89
240 0.653 ND 0.619 0.881 2.15
300 1.69 ND 1.05 1.39 4.14

120
Table A.5: SDP Data for Photolyzed [Co(NH3)5CO3]+ClO4
- Solutions (dsDNA)
Illumination time, s [5MF], μM Mean SD SEM
0 0.0141 0.0289 0.0240 0.0224 0.00753 0.00435
120 0.150 0.195 0.187 0.177 0.0241 0.0139
240 0.460 0.391 0.405 0.419 0.0365 0.0211
360 0.827 0.712 0.744 0.761 0.0591 0.0341
480 1.039 0.941 0.796 0.925 0.1220 0.0704
Illumination time, s [Lac], μM Mean SD SEM
0 0.0241 0.0186 0.0360 0.0262 0.00893 0.00516
120 0.322 0.361 0.340 0.341 0.0199 0.0115
240 0.861 0.694 0.665 0.740 0.106 0.0611
360 1.88 1.04 1.07 1.33 0.479 0.277
480 1.50 1.28 1.24 1.34 0.140 0.0811
Illumination time, s [Fur], μM Mean SD SEM
0 0.0179 0.0126 0.0221 0.0175 0.00475 0.00275
120 0.0527 0.0725 0.0676 0.0643 0.0103 0.00596
240 0.0925 0.0985 0.105 0.0987 0.00626 0.00362
360 0.0894 0.137 0.157 0.128 0.0349 0.0201
480 0.173 0.163 0.133 0.156 0.0207 0.0119
Illumination time, s [Total SDP], μM Mean SD SEM
0 0.0561 0.0601 0.0751 0.0638 0.00999 0.0122
120 0.524 0.629 0.544 0.566 0.0558 0.0314
240 1.41 1.18 1.07 1.224 0.173 0.0858
360 2.80 1.89 1.80 2.164 0.553 0.331
480 2.71 2.38 1.99 2.362 0.364 0.163

121
Table A.6. FBR data for photolyzed [Co(NH3)5CO3]+ClO4
- solutions (dsDNA).
Illumination time, s [C], μM Mean SD SEM
0 0.0203 0.0302 0.0721 0.0408 0.0275 0.0159
120 0.180 0.301 0.238 0.239 0.0607 0.0351
240 0.419 0.380 0.426 0.408 0.0249 0.0144
360 0.632 0.683 0.652 0.656 0.0255 0.0147
480 0.873 0.885 0.701 0.819 0.103 0.0596
Illumination time, s [G], μM Mean SD SEM
0 0.0428 0.0499 0.0794 0.0573 0.0194 0.0112
120 0.128 0.124 0.134 0.128 0.00503 0.0029
240 0.227 0.143 0.225 0.198 0.0479 0.0277
360 0.326 0.191 0.290 0.269 0.0700 0.0404
480 0.347 0.246 0.289 0.294 0.0508 0.0293
Illumination time, s [T], μM Mean SD SEM
0 0.00477 0.0257 0.0149 0.0151 0.0105 0.00604
120 0.119 0.173 0.156 0.149 0.0277 0.0160
240 0.294 0.249 0.244 0.262 0.0277 0.0160
360 0.453 0.405 0.355 0.404 0.0490 0.0283
480 0.589 0.501 0.374 0.488 0.108 0.0625
Illumination time, s [A], μM Mean SD SEM
0 0.0568 0.0572 0.189 0.101 0.0765 0.0441
120 0.225 0.295 0.256 0.259 0.0351 0.0203
240 0.416 0.361 0.382 0.386 0.0281 0.0162
360 0.592 0.613 0.611 0.605 0.0118 0.00684
480 0.750 0.668 0.628 0.682 0.0621 0.0359
Illumination time, s [Total FBR], μM Mean SD SEM
0 0.125 0.163 0.356 0.214 0.124 0.0773
120 0.652 0.893 0.783 0.776 0.121 0.0743
240 1.36 1.13 1.28 1.25 0.114 0.0742
360 2.00 1.89 1.91 1.93 0.0599 0.0903
480 2.56 2.30 1.99 2.28 0.284 0.187
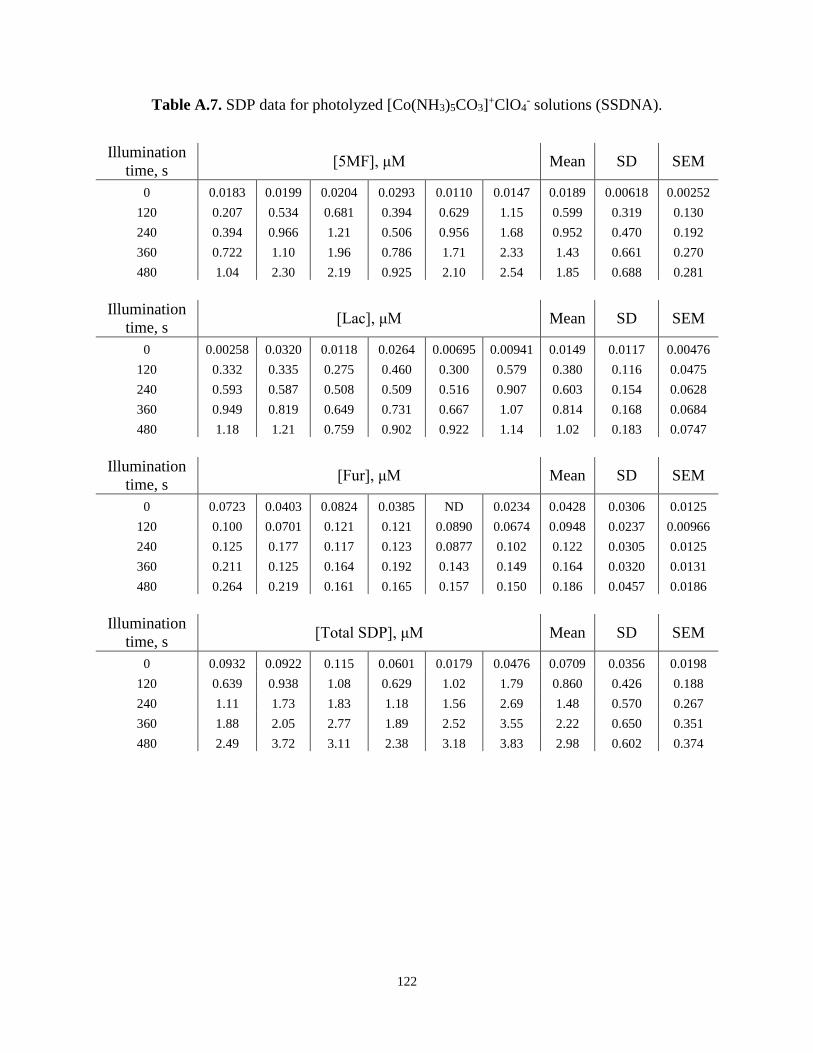
122
Table A.7. SDP data for photolyzed [Co(NH3)5CO3]+ClO4
- solutions (SSDNA).
Illumination
time, s [5MF], μM Mean SD SEM
0 0.0183 0.0199 0.0204 0.0293 0.0110 0.0147 0.0189 0.00618 0.00252
120 0.207 0.534 0.681 0.394 0.629 1.15 0.599 0.319 0.130
240 0.394 0.966 1.21 0.506 0.956 1.68 0.952 0.470 0.192
360 0.722 1.10 1.96 0.786 1.71 2.33 1.43 0.661 0.270
480 1.04 2.30 2.19 0.925 2.10 2.54 1.85 0.688 0.281
Illumination
time, s [Lac], μM Mean SD SEM
0 0.00258 0.0320 0.0118 0.0264 0.00695 0.00941 0.0149 0.0117 0.00476
120 0.332 0.335 0.275 0.460 0.300 0.579 0.380 0.116 0.0475
240 0.593 0.587 0.508 0.509 0.516 0.907 0.603 0.154 0.0628
360 0.949 0.819 0.649 0.731 0.667 1.07 0.814 0.168 0.0684
480 1.18 1.21 0.759 0.902 0.922 1.14 1.02 0.183 0.0747
Illumination
time, s [Fur], μM Mean SD SEM
0 0.0723 0.0403 0.0824 0.0385 ND 0.0234 0.0428 0.0306 0.0125
120 0.100 0.0701 0.121 0.121 0.0890 0.0674 0.0948 0.0237 0.00966
240 0.125 0.177 0.117 0.123 0.0877 0.102 0.122 0.0305 0.0125
360 0.211 0.125 0.164 0.192 0.143 0.149 0.164 0.0320 0.0131
480 0.264 0.219 0.161 0.165 0.157 0.150 0.186 0.0457 0.0186
Illumination
time, s [Total SDP], μM Mean SD SEM
0 0.0932 0.0922 0.115 0.0601 0.0179 0.0476 0.0709 0.0356 0.0198
120 0.639 0.938 1.08 0.629 1.02 1.79 0.860 0.426 0.188
240 1.11 1.73 1.83 1.18 1.56 2.69 1.48 0.570 0.267
360 1.88 2.05 2.77 1.89 2.52 3.55 2.22 0.650 0.351
480 2.49 3.72 3.11 2.38 3.18 3.83 2.98 0.602 0.374
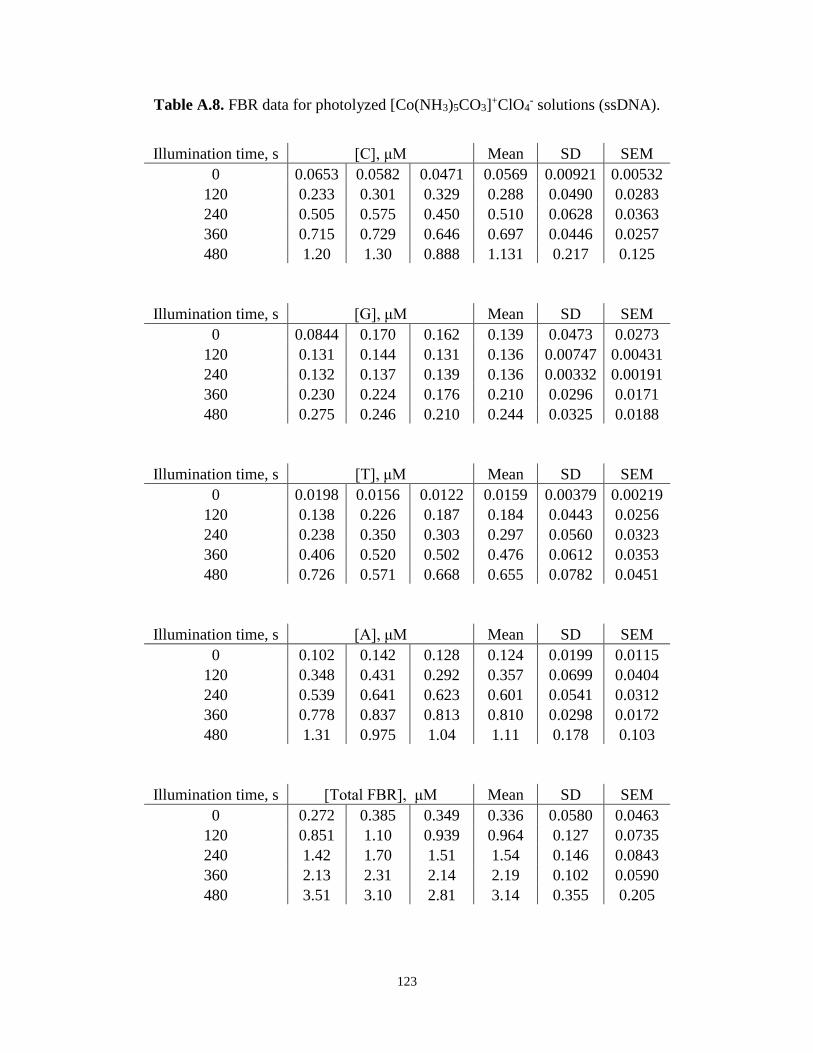
123
Table A.8. FBR data for photolyzed [Co(NH3)5CO3]+ClO4
- solutions (ssDNA).
Illumination time, s [C], μM Mean SD SEM
0 0.0653 0.0582 0.0471 0.0569 0.00921 0.00532
120 0.233 0.301 0.329 0.288 0.0490 0.0283
240 0.505 0.575 0.450 0.510 0.0628 0.0363
360 0.715 0.729 0.646 0.697 0.0446 0.0257
480 1.20 1.30 0.888 1.131 0.217 0.125
Illumination time, s [G], μM Mean SD SEM
0 0.0844 0.170 0.162 0.139 0.0473 0.0273
120 0.131 0.144 0.131 0.136 0.00747 0.00431
240 0.132 0.137 0.139 0.136 0.00332 0.00191
360 0.230 0.224 0.176 0.210 0.0296 0.0171
480 0.275 0.246 0.210 0.244 0.0325 0.0188
Illumination time, s [T], μM Mean SD SEM
0 0.0198 0.0156 0.0122 0.0159 0.00379 0.00219
120 0.138 0.226 0.187 0.184 0.0443 0.0256
240 0.238 0.350 0.303 0.297 0.0560 0.0323
360 0.406 0.520 0.502 0.476 0.0612 0.0353
480 0.726 0.571 0.668 0.655 0.0782 0.0451
Illumination time, s [A], μM Mean SD SEM
0 0.102 0.142 0.128 0.124 0.0199 0.0115
120 0.348 0.431 0.292 0.357 0.0699 0.0404
240 0.539 0.641 0.623 0.601 0.0541 0.0312
360 0.778 0.837 0.813 0.810 0.0298 0.0172
480 1.31 0.975 1.04 1.11 0.178 0.103
Illumination time, s [Total FBR], μM Mean SD SEM
0 0.272 0.385 0.349 0.336 0.0580 0.0463
120 0.851 1.10 0.939 0.964 0.127 0.0735
240 1.42 1.70 1.51 1.54 0.146 0.0843
360 2.13 2.31 2.14 2.19 0.102 0.0590
480 3.51 3.10 2.81 3.14 0.355 0.205
124
VITA
TERENCE JOSHUA MOORE
Education: B.B.A. Management, East Tennessee State University, Johnson
City, Tennessee, 2008
B.S. Chemistry, East Tennessee State University, Johnson City,
Tennessee, 2012
M.S. Chemistry, East Tennessee State University, Johnson City,
Tennessee, 2014
Professional Experience: Graduate Assistant, East Tennessee State University, College of
Arts and Sciences, 2012-2013
Teaching Assistant, East Tennessee State University, College of
Arts and Sciences, 2013-2014
Adjunct Faculty, East Tennessee State University, College of
Arts and Sciences, 2014
Publication: Roginskaya, M., Mohseni, R., Moore, T. J., Bernhard, W. A.,
and Razskazovskiy, Y. Radiat. Res. 2014, 181, 131-137.
Honors and Awards: Phi Sigma Pi National Honor Fraternity – Epsilon Xi Chapter,
Southern Appalachian Alumni Chapter
Golden Key International Honour Society
Outstanding Teaching Assistant, Chemistry Department (2013,
2014)
Dean’s List
2nd Place, Oral Presentations – Master’s Candidates, Natural
Sciences Division, 2014 Appalachian Student Research Forum