Embed Size (px)
Citation preview
Kathleen Beegle
Luc Christ iaensen
Andrew Dabalen
Is i s Gaddis
OVERVIEW
AFRICAPOVERTYREPORT
IN APOVERTYRISING AFRICA

Kathleen Beegle, Luc Christiaensen, Andrew Dabalen, and Isis Gaddis
OVERVIEW
AFRICAPOVERTYREPORT
IN APOVERTYRISING AFRICA
This booklet contains the overview from Poverty in a Rising Africa, Africa Poverty Report doi: 10.1596/978-1-4648-0723-7. The PDF of the final, full-length book, once published, will be available at https://openknowledge.worldbank.org/ and print copies can be ordered at http://Amazon.com. Please use the final version of the book for citation, reproduction, and adaptation purposes.
© 2016 International Bank for Reconstruction and Development / The World Bank1818 H Street NW, Washington DC 20433Telephone: 202-473-1000; Internet: www.worldbank.org
Some rights reserved
This work is a product of the staff of The World Bank with external contributions. The findings, interpre-tations, and conclusions expressed in this work do not necessarily reflect the views of The World Bank, its Board of Executive Directors, or the governments they represent. The World Bank does not guarantee the accuracy of the data included in this work. The boundaries, colors, denominations, and other information shown on any map in this work do not imply any judgment on the part of The World Bank concerning the legal status of any territory or the endorsement or acceptance of such boundaries.
Nothing herein shall constitute or be considered to be a limitation upon or waiver of the privileges and immunities of The World Bank, all of which are specifically reserved.
Rights and Permissions
This work is available under the Creative Commons Attribution 3.0 IGO license (CC BY 3.0 IGO)http://creativecommons.org/licenses/by/3.0/igo. Under the Creative Commons Attribution license, you are free to copy, distribute, transmit, and adapt this work, including for commercial purposes, under the follow-ing conditions:
Attribution—Please cite the work as follows: Beegle, Kathleen, Luc Christiaensen, Andrew Dabalen, and Isis Gaddis. 2016. “Poverty in a Rising Africa, Africa Poverty Report” Overview. World Bank, Washington, DC. License: Creative Commons Attribution CC BY 3.0 IGO
Translations—If you create a translation of this work, please add the following disclaimer along with the attribution: This translation was not created by The World Bank and should not be considered an official World Bank translation. The World Bank shall not be liable for any content or error in this translation.
Adaptations—If you create an adaptation of this work, please add the following disclaimer along with the attribution: This is an adaptation of an original work by The World Bank. Views and opinions expressed in the adaptation are the sole responsibility of the author or authors of the adaptation and are not endorsed by The World Bank.
Third-party content—The World Bank does not necessarily own each component of the content contained within the work. The World Bank therefore does not warrant that the use of any third-party-owned indi-vidual component or part contained in the work will not infringe on the rights of those third parties. The risk of claims resulting from such infringement rests solely with you. If you wish to re-use a component of the work, it is your responsibility to determine whether permission is needed for that re-use and to obtain permission from the copyright owner. Examples of components can include, but are not limited to, tables, figures, or images.
All queries on rights and licenses should be addressed to the Publishing and Knowledge Division, The World Bank, 1818 H Street NW, Washington, DC 20433, USA; fax: 202-522-2625; e-mail: [email protected].
Cover design: Bill Pragluski, Critical Stages LLC. Cover image: Africa Footprints, lithograph © Richard Long/World Bank Art Program. Further permission required for reuse.
Contents
Foreword . . . . . . . . . . . . . . . . . . . . . . . . . . . . . . . . . . . . . . . . . . . . . . . . . . . . . . . . . . . . . . . . . . . . . . v
Acknowledgments . . . . . . . . . . . . . . . . . . . . . . . . . . . . . . . . . . . . . . . . . . . . . . . . . . . . . . . . . . . . . . vii
Key Messages . . . . . . . . . . . . . . . . . . . . . . . . . . . . . . . . . . . . . . . . . . . . . . . . . . . . . . . . . . . . . . 1
Overview . . . . . . . . . . . . . . . . . . . . . . . . . . . . . . . . . . . . . . . . . . . . . . . . . . . . . . . . . . . . . . . . . . . 3Assessing the Data Landscape . . . . . . . . . . . . . . . . . . . . . . . . . . . . . . . . . . . . . . . . . . . . . . . . . . 4Improving Data on Poverty . . . . . . . . . . . . . . . . . . . . . . . . . . . . . . . . . . . . . . . . . . . . . . . . . . . . . 6Revisiting Poverty Trends . . . . . . . . . . . . . . . . . . . . . . . . . . . . . . . . . . . . . . . . . . . . . . . . . . . . . . 7Profiling the Poor . . . . . . . . . . . . . . . . . . . . . . . . . . . . . . . . . . . . . . . . . . . . . . . . . . . . . . . . . . . . 10Taking a Nonmonetary Perspective . . . . . . . . . . . . . . . . . . . . . . . . . . . . . . . . . . . . . . . . . . . . . . 11Measuring Inequality . . . . . . . . . . . . . . . . . . . . . . . . . . . . . . . . . . . . . . . . . . . . . . . . . . . . . . . . 15Notes . . . . . . . . . . . . . . . . . . . . . . . . . . . . . . . . . . . . . . . . . . . . . . . . . . . . . . . . . . . . . . . . . . . . . 18References . . . . . . . . . . . . . . . . . . . . . . . . . . . . . . . . . . . . . . . . . . . . . . . . . . . . . . . . . . . . . . . . . 18
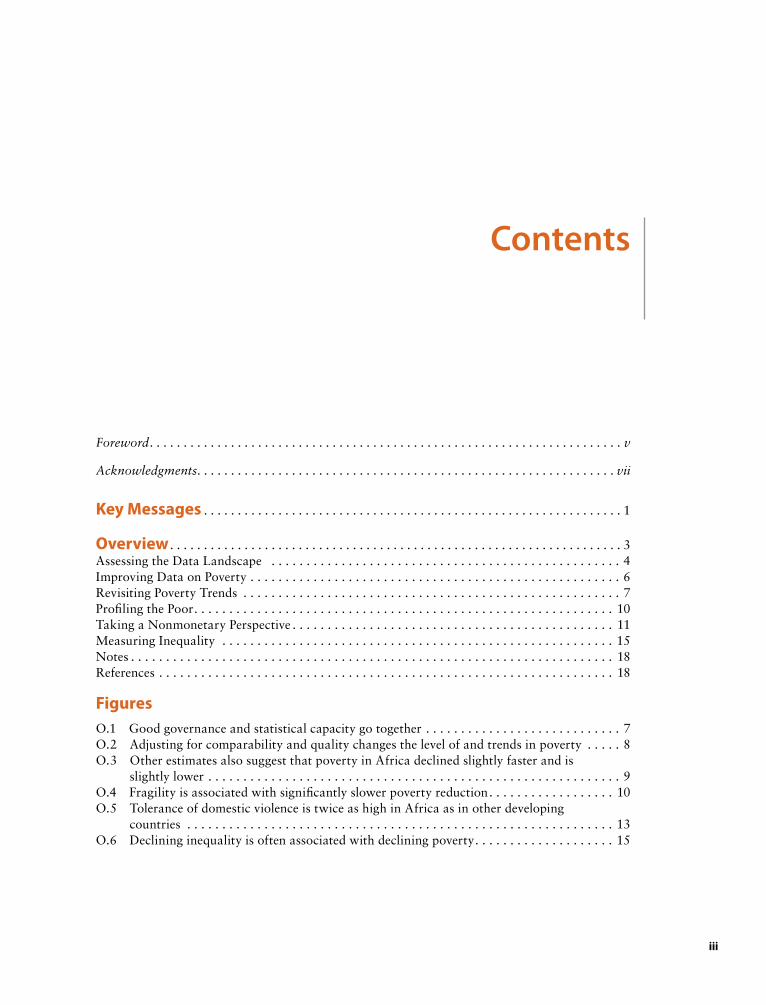
FiguresO.1 Good governance and statistical capacity go together . . . . . . . . . . . . . . . . . . . . . . . . . . . . 7O.2 Adjusting for comparability and quality changes the level of and trends in poverty . . . . . 8O.3 Other estimates also suggest that poverty in Africa declined slightly faster and is
slightly lower . . . . . . . . . . . . . . . . . . . . . . . . . . . . . . . . . . . . . . . . . . . . . . . . . . . . . . . . . . . 9O.4 Fragility is associated with significantly slower poverty reduction . . . . . . . . . . . . . . . . . . 10O.5 Tolerance of domestic violence is twice as high in Africa as in other developing
countries . . . . . . . . . . . . . . . . . . . . . . . . . . . . . . . . . . . . . . . . . . . . . . . . . . . . . . . . . . . . . 13O.6 Declining inequality is often associated with declining poverty . . . . . . . . . . . . . . . . . . . . 15
iii
iv C o n t e n t s
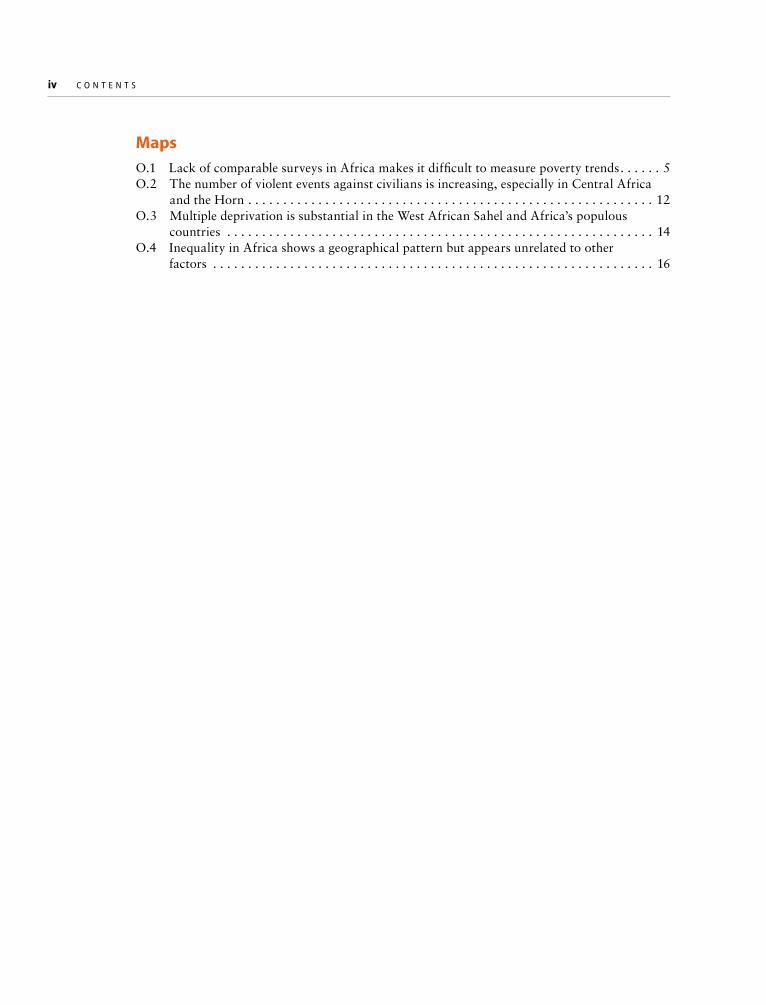
MapsO.1 Lack of comparable surveys in Africa makes it difficult to measure poverty trends . . . . . . 5O.2 The number of violent events against civilians is increasing, especially in Central Africa
and the Horn . . . . . . . . . . . . . . . . . . . . . . . . . . . . . . . . . . . . . . . . . . . . . . . . . . . . . . . . . . 12O.3 Multiple deprivation is substantial in the West African Sahel and Africa’s populous
countries . . . . . . . . . . . . . . . . . . . . . . . . . . . . . . . . . . . . . . . . . . . . . . . . . . . . . . . . . . . . . 14O.4 Inequality in Africa shows a geographical pattern but appears unrelated to other
factors . . . . . . . . . . . . . . . . . . . . . . . . . . . . . . . . . . . . . . . . . . . . . . . . . . . . . . . . . . . . . . . 16
After two decades of unprecedented economic g row th , how much have the lives of African families
improved? The latest estimates from the World Bank suggest that the share of the African population in extreme poverty did decline—from 56 percent in 1990 to 43 per-cent in 2012. At the same time, however, Africa’s population continued to expand rapidly. As a result, the number of people living in extreme poverty still increased by more than 100 million. These are stagger-ing numbers. Further, it is projected that the world’s extreme poor will be increasingly concentrated in Africa.
With the adoption of the Sustainable Development Goals, including the eradica-tion of extreme poverty by 2030, successful implementation of the post-2015 develop-ment agenda will require a solid understand-ing of poverty and inequality in the region, across countries and population groups, and in different dimensions.
Poverty in a Rising Africa, Africa Poverty Report is the first of two sequential reports aimed at better understanding progress in poverty reduction in Africa and articulat-ing a policy agenda to accelerate it. This first report has a modest, but important, objec-tive: to document the data challenges and
systematically review the evidence on core measures of poverty and inequality, along both monetary and nonmonetary dimen-sions. The findings are both encouraging and sobering.
Considerable progress has been made in terms of data for measuring the well-being of the population. The availability and qual-ity of household survey data in Africa has improved. At the same time, not all coun-tries have multi ple and comparable surveys to track poverty trends. Reevaluating the trends in poverty, taking into account these data concerns, suggests that poverty in Africa may be lower than what current estimates suggest. In addition, Africa’s population saw progress in nonmonetary dimensions of well-being, particularly in terms of health indicators and freedom from violence. While the avail-able data do not suggest a systematic increase in inequality within countries in Africa, the number of extremely wealthy Africans is increasing. Overall, notwithstanding these broad trends, caution remains as data chal-lenges multiply when attempting to measure inequality.
While these findings on progress are encouraging, major poverty challenges remain, especially in light of the region’s rapid population growth. Consider this: even
Foreword
v
vi F o r e w o r d
under the most optimistic scenario, there are still many more Africans living in pov-erty (more than 330 million in 2012) than in 1990 (about 280 million). Despite improve-ments in primary school enrollment rates, the poor quality of learning outcomes, as evidenced by the fact that two in five adults are illiterate, highlights the urgency of poli-cies to improve educational outcomes, par-ticularly for girls. Perpetuation of inequality, in the absence of intergenerational mobility in education, further highlights the long-run consequences of failure to do so. Not surpris-ingly, poverty reduction has been slowest in fragile states. This trend is compounded by the fact that violence against civilians is once again on the rise, after a decade of relative peace. There is also the paradoxical fact that citizens in resource-rich countries are expe-riencing systematically lower outcomes in all human welfare indicators controlling for their income level. Clearly, policies matter beyond resource availability.
To maintain and accelerate the momen-tum of progress of the past two decades, con-certed and collective efforts are also needed to further improve the quality and timeliness of poverty statistics in the region. Domestic political support for statistics can be the most important factor in the quest for better data. Development partners and the international community also have an important role to play in terms of promoting regional coop-eration, new financing models, open access policies, and clearer international standards. This volume is intended to contribute toward improving the scope, quality, and relevance of poverty statistics. Because in the fight against poverty in Africa, (good) data will make a difference. Better data will make for better decisions and better lives.
Makhtar DiopVice President, Africa RegionWorld Bank
This volume is part of the African Regional Studies Program, an initiative of the Africa Region Vice Presidency at the World Bank. This series of studies aims to combine high levels of analytical rigor and policy relevance, and to apply them to various topics impor-tant for the social and economic development of Sub-Saharan Africa. Quality control and oversight are provided by the Office of the Chief Economist for the Africa Region.
This report was prepared by a core team led by Kathleen Beegle, Luc Christiaensen, Andrew Dabalen, and Isis Gaddis. It would not have been possible without the relentless efforts and inputs of Nga Thi Viet Nguyen and Shinya Takamatsu (chapters 1 and 2), Umberto Cattaneo and Agnes Said (chapter 3), and Camila Galindo-Pardo (chapters 3 and 4). Rose Mungai coordinated the massive effort to harmonize data files; Wei Guo, Yunsun Li, and Ayago Esmubancha Wambile provided valuable research assis-tance. Administrative support by Kenneth Omondi and Joyce Rompas is most grate-fully acknowledged.
Francisco H. G. Ferreira provided gen-eral direction and guidance to the team.
Additional contributions were made by Isa-bel Almeida, Prospere Backiny-Yetna, Yele Batana, Abdoullahi Beidou, Paolo Brun-ori, Hai-Anh Dang, Johannes Hoogeveen, La-Bhus Jirasavetakul, Christoph Lakner, Jean-François Maystadt, Annamaria Mila-zzo, Flaviana Palmisano, Vito Peragine, Dominique van de Walle, Philip Verwimp, and Eleni Yitbarek.
The team benefited from the valuable advice and feedback of Carlos Batarda, Haroon Bhorat, Laurence Chandy, Pablo Fajnzylber, Jed Friedman, John Gibson, Ruth Hill, and Frederick Solt. Valentina Stoevska and colleagues from the ILO provided valu-able data.
Stephan Klasen, Peter Lanjouw, Jacques Morisset, and one anonymous reviewer pro-vided detailed and careful peer review comments.
The World Bank’s Publishing and Knowl-edge team coordinated the design, type-setting, printing, and dissemination of the report. Special thanks to Janice Tuten, Stephen McGroarty, Nancy Lammers, and Abdia Mohamed. The report was edited by Robert Zimmermann and Barbara Karni.
Acknowledgments
vii

1
Measuring poverty in Africa remains a challenge. • The coverage, comparability, and quality of household surveys to monitor living standards
have improved. Still, in 2012, only 25 of the region’s 48 countries had conducted at least two surveys over the past decade to track poverty.
• Regular and good quality GDP, price, and census data are also lacking.• Technical approaches can fill in some gaps, but there is no good alternative to regular and
good quality data. A regionwide effort to strengthen Africa’s statistics is called for.
Poverty in Africa may be lower than current estimates suggest, but more people are poor today than in 1990. • The share of Africans who are poor fell from 56 percent in 1990 to 43 percent in 2012.
Limiting estimates to comparable surveys, drawing on nonconsumption surveys, and apply-ing alternative price deflators suggest that poverty may have declined by even more.
• Nonetheless, even given the most optimistic estimates, still many more people are poor, due to population growth: more than 330 million in 2012, up from about 280 million in 1990.
• Poverty reduction has been slowest in fragile countries, and rural areas remain much poorer, although the urban-rural gap has narrowed. Chronic poverty is substantial.
Nonmonetary dimensions of poverty have been improving. • Health, nutrition, education, and empowerment have improved, and violence has diminished. • But the challenges remain enormous: more than two in five adults are still illiterate and the
quality of schooling is often low; after a decade of relative peace, conflict is on the rise. • Nonmonetary welfare indicators are weaker in resource-rich countries, conditional on
income, pointing to the unmet potential of natural resource wealth.
Inequality in Africa has many dimensions. • The data do not reveal a systematic increase in inequality across countries in Africa. But these
data do not capture extremely wealthy Africans, whose numbers and wealth are increasing.• Spatial inequalities (differences between urban and rural areas and across regions) are large. • Intergenerational mobility in areas such as education and occupation has improved, but
mobility is still low and perpetuates inequality.
Key Messages

3
Overview
Perceptions of Africa changed dramati-cally over the past 20 years. Viewed as a continent of wars, famines, and
entrenched poverty in the late 1990s, there is now a focus on “Africa rising” and an “African 21st century.”1 At 4.5 percent a year, average economic growth was remark-ably robust, especially when contrasted with the continuous decline during the 1970s and 1980s.
Substantial improvements in well-being should have accompanied this expansion. Whether or not they did, remains unclear given the poor quality of the data (Devara-jan 2013; Jerven 2013), the nature of the growth process (especially the role of natural resources) (de la Briere and others 2015), the emergence of extreme wealth (Oxfam 2015), the heterogeneity of the region, and persis-tent population growth of 2.7 percent a year (Canning, Raja, and Yazbeck 2015).
Expectations are also rising. All develop-ing regions except Africa have reached the Millennium Development Goal (MDG) of halving poverty between 1990 and 2015 (UN 2015). Attention will now shift to the set of new global development goals (the Sus-tainable Development Goals [SDGs]), which include the ambitious target of eradicating poverty worldwide by 2030. The poten-tial for a slowdown in economic growth
and projections that the world’s poor will be increasingly concentrated in Africa even if the average 1995–2014 growth rates are maintained, suggest the need to focus the global poverty agenda on Africa.
This report is the first of a two-part vol-ume on Poverty in Africa. This study docu-ments the data challenges and revisits the core broad facts about poverty in Africa; the second report will explore ways to accelerate its reduction.
The report takes a broad, multidimen-sional view of poverty, assessing progress over the past two decades along both mon-etary and nonmonetary dimensions. The dearth of comparable, good-quality house-hold consumption surveys makes assessing monetary poverty especially challenging. The report scrutinizes the data used to assess monetary poverty in the region and explores how adjustments for data issues affect poverty trends.2
At the same time, the remarkable expan-sion of standardized household surveys on nonmonetary dimensions of well-being, including opinions and perceptions, opens up new opportunities. The report examines progress in education and health, the extent to which people are free from violence and able to shape their lives, and the joint occur-rence of various types of deprivation. It also
4 P O V E R T Y I N A R I S I N G A F R I C A A F R I C A P O V E R T Y R E P O R T
reviews the distributional aspects of poverty, by studying various dimensions of inequality.
To shed light on Africa’s diversity, the report examines differences in performance across countries, by location, and by gen-der. Countries are characterized along four dimensions that have been shown to affect growth and poverty: resource richness, fra-gility, landlockedness (to capture geographic openness and potential for trade), and income status (low, lower-middle, upper-middle, and high income).
Assessing the Data Landscape According to World Bank estimates from household surveys, the share of people liv-ing on less than $1.90 a day (in 2011 inter-national purchasing power parity [PPP]) fell from 56 percent in 1990 to 43 percent in 2012, while the number of poor still increased by more than 100 million (from 284 to 388 million).
These estimates are based on consumption surveys in a subsample of countries cover-ing between one-half and two-thirds of the region’s population. Poverty rates for the rest of the countries are imputed from surveys that are often several years old using GDP trends, raising questions about the accuracy of the estimates. On average only 3.8 consump-tion surveys per country were conducted in Africa between 1990 and 2014, or one every 6.1 years. In the rest of the world, one con-sumption survey was conducted every 2.8 years. The average also masks quite uneven coverage across countries. For five countries that together represent 5 percent of the Afri-can population, no data to measure poverty are available (either because no household surveys were conducted or because the data that were collected are not accessible, or, as in the case of one survey for Zimbabwe, col-lected during a period of hyperinflation and unsuitable for poverty measurement). As of 2012, only 25 of 48 countries had at least two surveys available to track poverty trends over the past decade.
To be sure, the number of household sur-veys in Africa has been rising, especially since
the 2000s. Africa now ranks second to South Asia in terms of the number of household surveys per country, according to the Inter-national Household Survey Network cata-log. The region has an average of 24 surveys per country conducted between 1990 and 2012—more than the developing world aver-age of about 20. This expansion was confined almost entirely to surveys that do not collect consumption data, however.
The increase in household consump-tion surveys, which are the building blocks for measuring poverty and inequality, was sluggish, though coverage increased. Since 2009 only 2 countries did not conduct a single consumption survey over the past decade (down from 12 in 1990–99). The number of countries that either did not conduct a consumption survey or do not allow access to the microdata declined from 18 in 1990–99 to 4 in 2003–12; and the number of countries with at least two consumption surveys increased, from 13 in 1990–99 to 25 in 2003–12. Many frag-ile states—namely, Chad, the Democratic Republic of Congo, Sierra Leone, and Togo—were part of this new wave of sur-veys. Nonetheless, fragile states still tend to be the most data deprived.
The lack of consumption surveys and accessibility to the underlying data are obvi-ous impediments to monitoring poverty. But the problems do not end there. Even when available, surveys are often not comparable with other surveys within the country or are of poor quality (including as a result of mis-reporting and deficiencies in data handling). Consequently, countries that appear to be data rich (or have multiple surveys) can still be unable to track poverty over time (exam-ples include Guinea and Mali, with four sur-veys each that are not comparable).
At a country level, lack of comparability between survey rounds and questions about quality issues often prompt intense techni-cal debates about methodological choices and poverty estimates within countries (see World Bank 2012 for Niger, World Bank 2013 for Burkina Faso). But much regional work in Africa and elsewhere disregards
O V E R V I E W 5
these important differences, relying on data-bases such as the World Bank’s PovcalNet that has not consistently vetted surveys on the basis of comparability or quality.
If surveys that are not nationally represen-tative (covering only urban or rural areas, for example), that were not conducted at simi-lar times of the year (in order to control for seasonality in consumption patterns), and that collected consumption data using dif-ferent instruments or reporting periods are dropped, the typical African country con-ducted only 1.6 comparable surveys in the 22 years between 1990 and 2012.
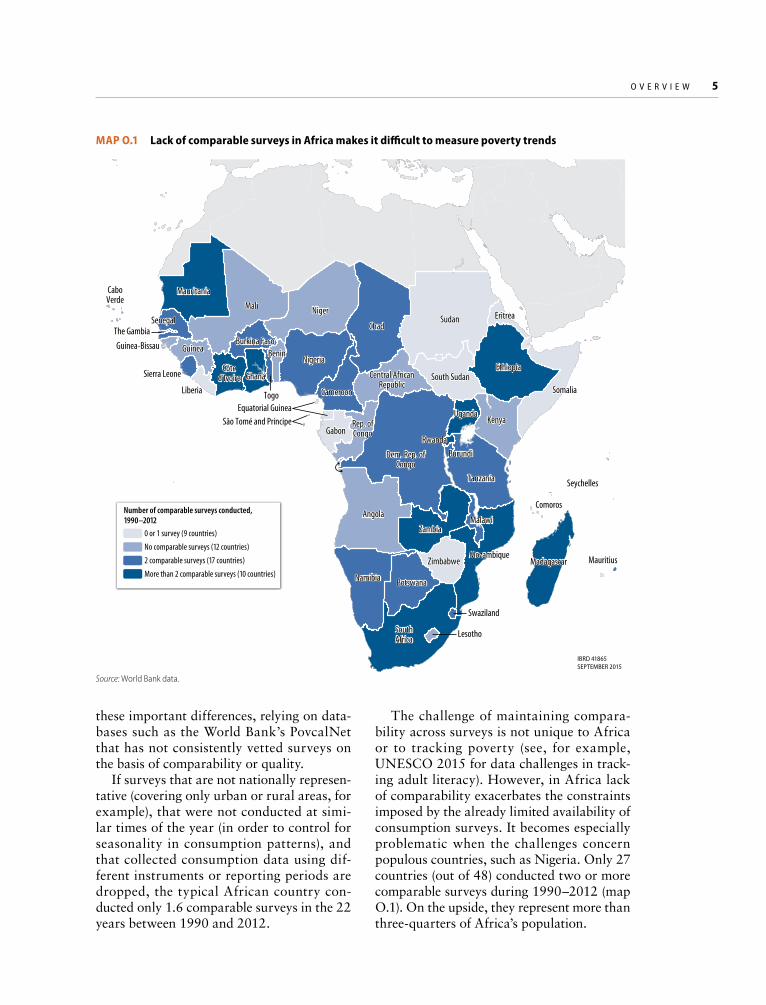
The challenge of maintaining compara-bility across surveys is not unique to Africa or to tracking poverty (see, for example, UNESCO 2015 for data challenges in track-ing adult literacy). However, in Africa lack of comparability exacerbates the constraints imposed by the already limited availability of consumption surveys. It becomes especially problematic when the challenges concern populous countries, such as Nigeria. Only 27 countries (out of 48) conducted two or more comparable surveys during 1990–2012 (map O.1). On the upside, they represent more than three-quarters of Africa’s population.
MAP O.1 Lack of comparable surveys in Africa makes it difficult to measure poverty trends
Source: World Bank data.
IBRD 41865SEPTEMBER 2015
MauritiusMadagascar
Seychelles
Comoros
LesothoSouthAfrica
Swaziland
BotswanaNamibia
ZimbabweMozambique
MalawiZambia
Angola
Dem. Rep. ofCongo
Rwanda
Burundi
Tanzania
KenyaUganda
Somalia
Ethiopia
GabonRep. ofCongo
Central AfricanRepublic
Cameroon
Sudan
South Sudan
EritreaChad
NigerMali
Burkina FasoBenin
Nigeria
TogoEquatorial Guinea
São Tomé and Princípe
GhanaCôte
d’IvoireLiberia
Sierra Leone
GuineaGuinea-Bissau
Senegal
Mauritania
The Gambia
CaboVerde
MauritiusMadagascar
Seychelles
Comoros
LesothoSouthAfrica
Swaziland
BotswanaNamibia
ZimbabweMozambique
MalawiZambia
Angola
Dem. Rep. ofCongo
Rwanda
Burundi
Tanzania
KenyaUganda
Somalia
Ethiopia
GabonRep. ofCongo
Central AfricanRepublic
Cameroon
Sudan
South Sudan
EritreaChad
NigerMali
Burkina FasoBenin
Nigeria
TogoEquatorial Guinea
São Tomé and Príncipe
GhanaCôte
d’IvoireLiberia
Sierra Leone
GuineaGuinea-Bissau
Senegal
Mauritania
The Gambia
CaboVerde
IBRD 41865SEPTEMBER 2015
0 or 1 survey (9 countries)
No comparable surveys (12 countries)
2 comparable surveys (17 countries)
More than 2 comparable surveys (10 countries)
Number of comparable surveys conducted,1990–2012
6 P O V E R T Y I N A R I S I N G A F R I C A A F R I C A P O V E R T Y R E P O R T
The estimation of poverty also requires data on price changes, to convert nominal consumption into comparable real values for comparison with the international poverty line in 2011. The main method used to make this adjustment is the consumer price index (CPI), which relies on both the collection of country-specific price data and basket weights of consumer items to measure inflation. The CPI suffers from three specific problems in Africa, in addition to the more general techni-cal difficulties. First, in many countries prices are collected only from urban markets. Sec-ond, the basket weights rely on dated house-hold surveys and sometimes only on market purchases (excluding home-produced foods). Third, computational errors sometimes bias the data, as in Tanzania (Adam and others 2012; Hoogeveen 2007) and Ghana (IMF 2003, 2007).3
Across the globe, when surveys are not available in a given year, researchers use GDP to compute annual poverty estimates. Mis-sing data are interpolated (between surveys) and extrapolated (to years before and after the last and latest surveys) using GDP growth rates (see World Bank 2015). Not all of these GDP data are reliable, however. Ghana, for example, leapt from low-income to low-middle-income country classification after rebasing its GDP in 2010; following rebasing, Nigeria surpassed South Africa overnight as the biggest economy in Africa. These exam-ples suggest that GDP growth rates—and by extension the extrapolated poverty reduc-tions—may be underestimated.
Another issue is that imputation based on GDP growth rates assumes that GDP growth translates one-to-one into household con-sumption and that all people see their con-sumption expand at the same pace. But GDP includes much more than private household consumption: on average across a large sam-ple of African countries, household consump-tion surveys captured just 61 percent of GDP per capita. The assumption that growth is evenly distributed can also be tenuous when growth is driven by capital-intensive sectors such as mining and oil production (Loayza
and Raddatz 2010) and may lead to poverty reduction being overestimated. Caution is therefore counseled, especially when extrapo-lating to a distant future (or past).
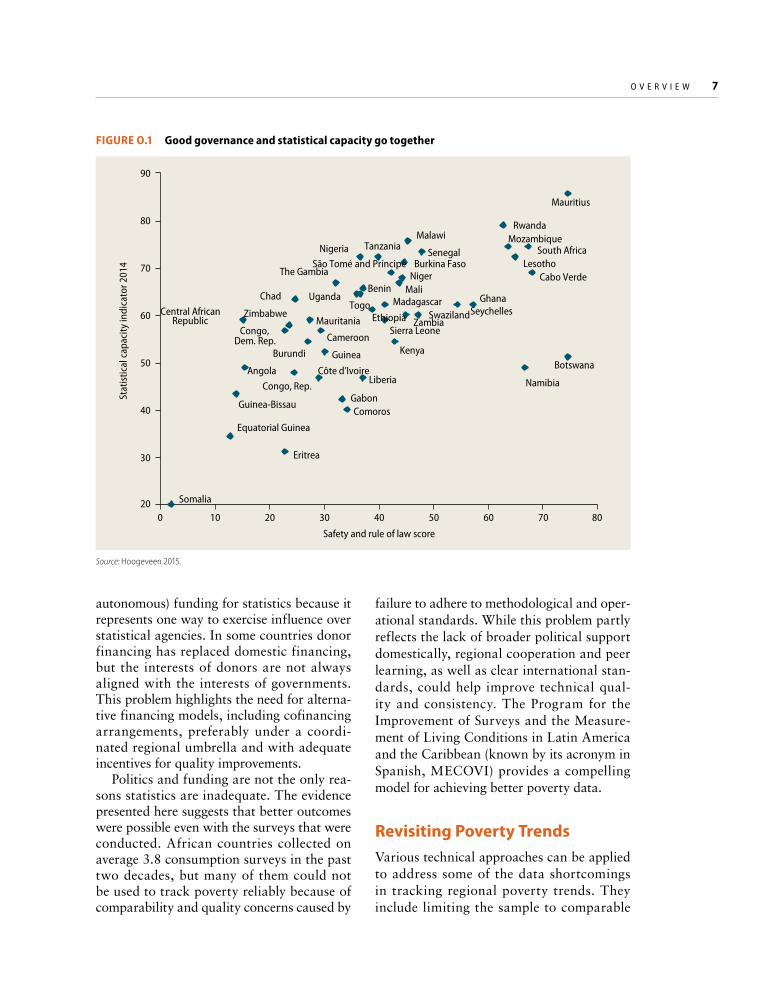
Improving Data on PovertyLack of funding and low capacity are often cited as main drivers for the data gaps in Africa. But national income is not associated with the number of consumption surveys a country conducts, and countries receiv-ing more development aid do not have more or higher-quality poverty data. In terms of capacity, the production of high-quality con-sumption surveys and statistics is technically complex, involving the mobilization of finan-cial and human resources on a large scale and requiring the establishment of robust quality control mechanisms. But many coun-tries that do not conduct household surveys to measure poverty undertake other activities that are more or equally complex (deliver-ing antiretroviral drugs to people with AIDS and conducting national elections, for exam-ple) (Hoogeveen 2015). Good governance is strongly correlated with higher-quality data (figure O.1). Countries that have better scores on safety and rule of law also have superior statistical capacity.
Many researchers have recently suggested that problems with the availability, compara-bility, and quality of data reflect the political preferences of elites (Carletto, Jolliffe, and Banerjee 2015; CGD 2014; Devarajan 2013; Florian and Byiers 2014; Hoogeveen 2015; Jerven 2013). Political elites may not favor good-quality statistics for several reasons. First, where clientelism and access to poli-tics are limited, a record of achievement that can be supported by good-quality statistics is unnecessary because support from a small group of power brokers suffices. Second, maintaining a patronage network is costly, and high-quality statistics come at a high opportunity cost. Third, poor-quality sta-tistics reduce accountability. The prevailing political arrangements thus favor less (or less
O V E R V I E W 7
autonomous) funding for statistics because it represents one way to exercise influence over statistical agencies. In some countries donor financing has replaced domestic financing, but the interests of donors are not always aligned with the interests of governments. This problem highlights the need for alterna-tive financing models, including cofinancing arrangements, preferably under a coordi-nated regional umbrella and with adequate incentives for quality improvements.
Politics and funding are not the only rea-sons statistics are inadequate. The evidence presented here suggests that better outcomes were possible even with the surveys that were conducted. African countries collected on average 3.8 consumption surveys in the past two decades, but many of them could not be used to track poverty reliably because of comparability and quality concerns caused by
failure to adhere to methodological and oper-ational standards. While this problem partly reflects the lack of broader political support domestically, regional cooperation and peer learning, as well as clear international stan-dards, could help improve technical qual-ity and consistency. The Program for the Improvement of Surveys and the Measure-ment of Living Conditions in Latin America and the Caribbean (known by its acronym in Spanish, MECOVI) provides a compelling model for achieving better poverty data.
Revisiting Poverty TrendsVarious technical approaches can be applied to address some of the data shortcomings in tracking regional poverty trends. They include limiting the sample to comparable
FIGURE O.1 Good governance and statistical capacity go together
Source: Hoogeveen 2015.
Angola
Benin
Botswana
Burkina Faso
Burundi
Cabo Verde
Cameroon
Central African Republic
Chad
Comoros
Congo, Dem. Rep.
Congo, Rep.Côte d’Ivoire
Equatorial Guinea
Eritrea
Ethiopia
Gabon
The Gambia
Ghana
Guinea
Guinea-Bissau
Kenya
Lesotho
Liberia
Madagascar
Malawi
Mali
Mauritania
Mauritius
Mozambique
Namibia
Niger
Nigeria
Rwanda
São Tomé and Príncipe Senegal
Seychelles
Sierra Leone
Somalia
South Africa
Swaziland
Tanzania
TogoUganda
ZambiaZimbabwe
20
30
40
50
60
70
80
90
0 10 20 30 40 50 60 70 80
Stat
istic
al c
apac
ity in
dica
tor 2
014
Safety and rule of law score
8 P O V E R T Y I N A R I S I N G A F R I C A A F R I C A P O V E R T Y R E P O R T
surveys of good quality, using trends in other nonconsumption data rather than GDP to impute missing poverty estimates, and gaug-ing inflation using alternative econometric techniques.
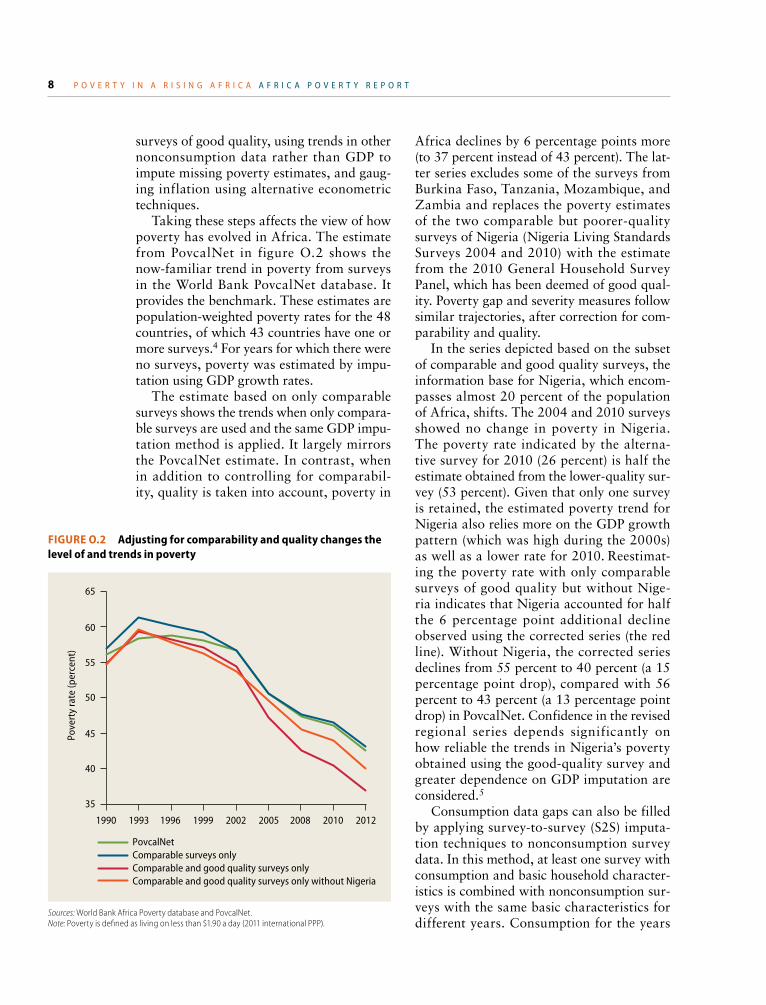
Taking these steps affects the view of how poverty has evolved in Africa. The estimate from PovcalNet in figure O.2 shows the now-familiar trend in poverty from surveys in the World Bank PovcalNet database. It provides the benchmark. These estimates are population-weighted poverty rates for the 48 countries, of which 43 countries have one or more surveys.4 For years for which there were no surveys, poverty was estimated by impu-tation using GDP growth rates.
The estimate based on only comparable surveys shows the trends when only compara-ble surveys are used and the same GDP impu-tation method is applied. It largely mirrors the PovcalNet estimate. In contrast, when in addition to controlling for comparabil-ity, quality is taken into account, poverty in
Africa declines by 6 percentage points more (to 37 percent instead of 43 percent). The lat-ter series excludes some of the surveys from Burkina Faso, Tanzania, Mozambique, and Zambia and replaces the poverty estimates of the two comparable but poorer-quality surveys of Nigeria (Nigeria Living Standards Surveys 2004 and 2010) with the estimate from the 2010 General Household Survey Panel, which has been deemed of good qual-ity. Poverty gap and severity measures follow similar trajectories, after correction for com-parability and quality.
In the series depicted based on the subset of comparable and good quality surveys, the information base for Nigeria, which encom-passes almost 20 percent of the population of Africa, shifts. The 2004 and 2010 surveys showed no change in poverty in Nigeria. The poverty rate indicated by the alterna-tive survey for 2010 (26 percent) is half the estimate obtained from the lower-quality sur-vey (53 percent). Given that only one survey is retained, the estimated poverty trend for Nigeria also relies more on the GDP growth pattern (which was high during the 2000s) as well as a lower rate for 2010. Reestimat-ing the poverty rate with only comparable surveys of good quality but without Nige-ria indicates that Nigeria accounted for half the 6 percentage point additional decline observed using the corrected series (the red line). Without Nigeria, the corrected series declines from 55 percent to 40 percent (a 15 percentage point drop), compared with 56 percent to 43 percent (a 13 percentage point drop) in PovcalNet. Confidence in the revised regional series depends significantly on how reliable the trends in Nigeria’s poverty obtained using the good-quality survey and greater dependence on GDP imputation are considered.5
Consumption data gaps can also be filled by applying survey-to-survey (S2S) imputa-tion techniques to nonconsumption survey data. In this method, at least one survey with consumption and basic household character-istics is combined with nonconsumption sur-veys with the same basic characteristics for different years. Consumption for the years
Sources: World Bank Africa Poverty database and PovcalNet.Note: Poverty is defined as living on less than $1.90 a day (2011 international PPP).
FIGURE O.2 Adjusting for comparability and quality changes the level of and trends in poverty
65
60
55
45
50
40
35
1990 1993 1996 1999 2002 2005 2008 2010 2012
Pove
rty
rate
(per
cent
)
Comparable and good quality surveys only
PovcalNet
Comparable and good quality surveys only without Nigeria
Comparable surveys only
O V E R V I E W 9
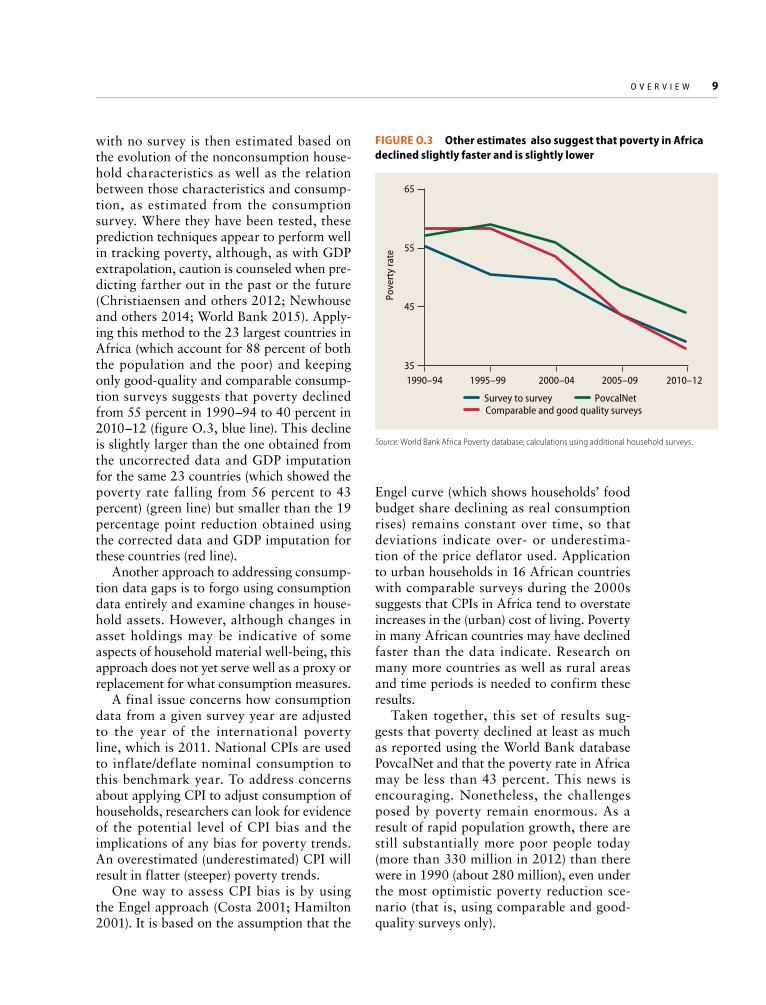
with no survey is then estimated based on the evolution of the nonconsumption house-hold characteristics as well as the relation between those characteristics and consump-tion, as estimated from the consumption survey. Where they have been tested, these prediction techniques appear to perform well in tracking poverty, although, as with GDP extrapolation, caution is counseled when pre-dicting farther out in the past or the future (Christiaensen and others 2012; Newhouse and others 2014; World Bank 2015). Apply-ing this method to the 23 largest countries in Africa (which account for 88 percent of both the population and the poor) and keeping only good-quality and comparable consump-tion surveys suggests that poverty declined from 55 percent in 1990–94 to 40 percent in 2010–12 (figure O.3, blue line). This decline is slightly larger than the one obtained from the uncorrected data and GDP imputation for the same 23 countries (which showed the poverty rate falling from 56 percent to 43 percent) (green line) but smaller than the 19 percentage point reduction obtained using the corrected data and GDP imputation for these countries (red line).
Another approach to addressing consump-tion data gaps is to forgo using consumption data entirely and examine changes in house-hold assets. However, although changes in asset holdings may be indicative of some aspects of household material well-being, this approach does not yet serve well as a proxy or replacement for what consumption measures.
A final issue concerns how consumption data from a given survey year are adjusted to the year of the international poverty line, which is 2011. National CPIs are used to inflate/deflate nominal consumption to this benchmark year. To address concerns about applying CPI to adjust consumption of households, researchers can look for evidence of the potential level of CPI bias and the implications of any bias for poverty trends. An overestimated (underestimated) CPI will result in flatter (steeper) poverty trends.
One way to assess CPI bias is by using the Engel approach (Costa 2001; Hamilton 2001). It is based on the assumption that the
Source: World Bank Africa Poverty database; calculations using additional household surveys.
FIGURE O.3 Other estimates also suggest that poverty in Africa declined slightly faster and is slightly lower
65
55
45
35
Pove
rty
rate
1990–94 1995–99 2000–04 2005–09 2010–12
PovcalNetSurvey to surveyComparable and good quality surveys
Engel curve (which shows households’ food budget share declining as real consumption rises) remains constant over time, so that deviations indicate over- or underestima-tion of the price deflator used. Application to urban households in 16 African countries with comparable surveys during the 2000s suggests that CPIs in Africa tend to overstate increases in the (urban) cost of living. Poverty in many African countries may have declined faster than the data indicate. Research on many more countries as well as rural areas and time periods is needed to confirm these results.
Taken together, this set of results sug-gests that poverty declined at least as much as reported using the World Bank database PovcalNet and that the poverty rate in Africa may be less than 43 percent. This news is encouraging. Nonetheless, the challenges posed by poverty remain enormous. As a result of rapid population growth, there are still substantially more poor people today (more than 330 million in 2012) than there were in 1990 (about 280 million), even under the most optimistic poverty reduction sce-nario (that is, using comparable and good-quality surveys only).
10 P O V E R T Y I N A R I S I N G A F R I C A A F R I C A P O V E R T Y R E P O R T
This exercise also underscores the need for more reliable and comparable consump-tion data to help benchmark and track prog-ress toward eradicating poverty by 2030, as envisioned under the SDGs. More gener-ally, it counsels against overinterpreting the accuracy conveyed by point estimates of poverty—or other region- or country-wide statistics of well-being. These estimates pro-vide only an order of magnitude of levels and changes, albeit one that becomes more pre-cise the more comparable and reliable is the underlying database.
Profiling the PoorWhat distinguishes countries that have suc-ceeded in reducing poverty from those that have failed? What are the effects of income status, resource richness, landlockedness, and fragility?
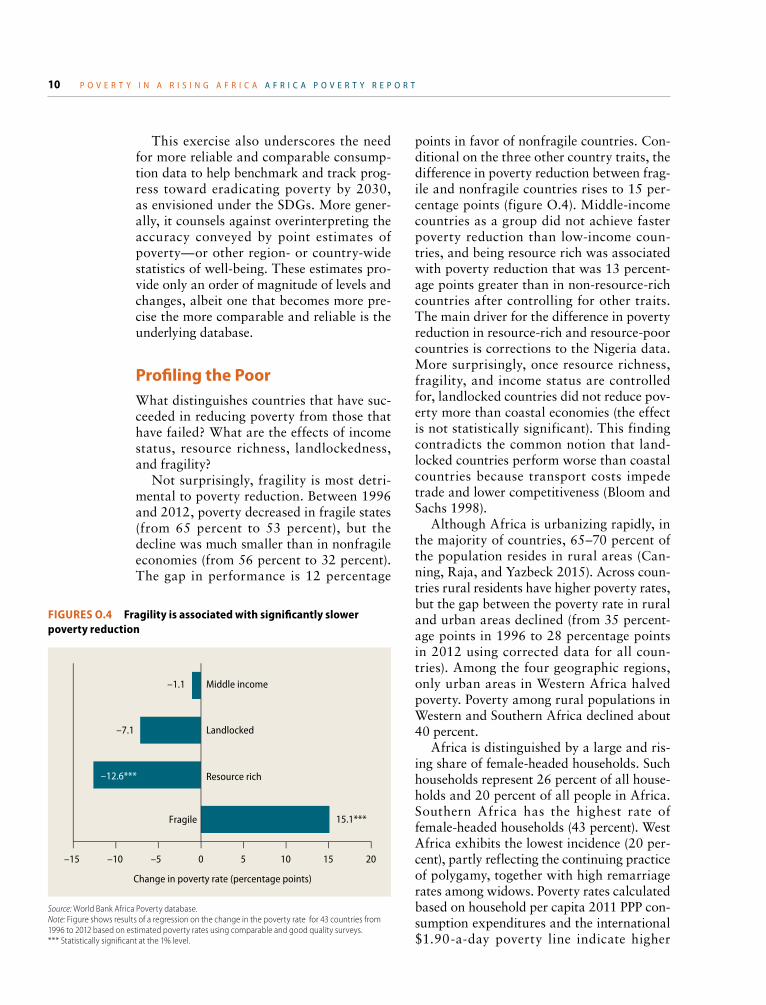
Not surprisingly, fragility is most detri-mental to poverty reduction. Between 1996 and 2012, poverty decreased in fragile states (from 65 percent to 53 percent), but the decline was much smaller than in nonfragile economies (from 56 percent to 32 percent). The gap in performance is 12 percentage
FIGURES O.4 Fragility is associated with significantly slower poverty reduction
Source: World Bank Africa Poverty database. Note: Figure shows results of a regression on the change in the poverty rate for 43 countries from 1996 to 2012 based on estimated poverty rates using comparable and good quality surveys. *** Statistically significant at the 1% level.
–15 –10
Middle income
Landlocked
Resource rich
Fragile 15.1***
–7.1
–1.1
–5 0
Change in poverty rate (percentage points)
5 10 15 20
–12.6***
points in favor of nonfragile countries. Con-ditional on the three other country traits, the difference in poverty reduction between frag-ile and nonfragile countries rises to 15 per-centage points (figure O.4). Middle-income countries as a group did not achieve faster poverty reduction than low-income coun-tries, and being resource rich was associated with poverty reduction that was 13 percent-age points greater than in non-resource-rich countries after controlling for other traits. The main driver for the difference in poverty reduction in resource-rich and resource-poor countries is corrections to the Nigeria data. More surprisingly, once resource richness, fragility, and income status are controlled for, landlocked countries did not reduce pov-erty more than coastal economies (the effect is not statistically significant). This finding contradicts the common notion that land-locked countries perform worse than coastal countries because transport costs impede trade and lower competitiveness (Bloom and Sachs 1998).
Although Africa is urbanizing rapidly, in the majority of countries, 65–70 percent of the population resides in rural areas (Can-ning, Raja, and Yazbeck 2015). Across coun-tries rural residents have higher poverty rates, but the gap between the poverty rate in rural and urban areas declined (from 35 percent-age points in 1996 to 28 percentage points in 2012 using corrected data for all coun-tries). Among the four geographic regions, only urban areas in Western Africa halved poverty. Poverty among rural populations in Western and Southern Africa declined about 40 percent.
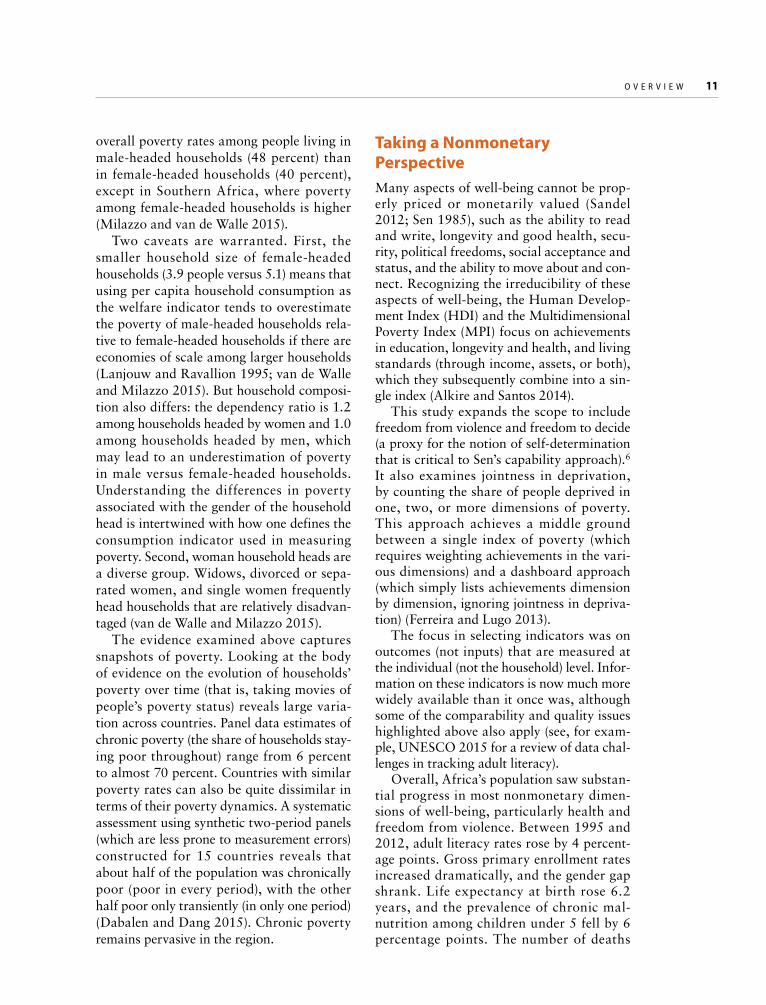
Africa is distinguished by a large and ris-ing share of female-headed households. Such households represent 26 percent of all house-holds and 20 percent of all people in Africa. Southern Africa has the highest rate of female-headed households (43 percent). West Africa exhibits the lowest incidence (20 per-cent), partly reflecting the continuing practice of polygamy, together with high remarriage rates among widows. Poverty rates calculated based on household per capita 2011 PPP con-sumption expenditures and the international $1.90-a-day poverty line indicate higher
O V E R V I E W 11
overall poverty rates among people living in male-headed households (48 percent) than in female-headed households (40 percent), except in Southern Africa, where poverty among female-headed households is higher (Milazzo and van de Walle 2015).
Two caveats are warranted. First, the smaller household size of female-headed households (3.9 people versus 5.1) means that using per capita household consumption as the welfare indicator tends to overestimate the poverty of male-headed households rela-tive to female-headed households if there are economies of scale among larger households (Lanjouw and Ravallion 1995; van de Walle and Milazzo 2015). But household composi-tion also differs: the dependency ratio is 1.2 among households headed by women and 1.0 among households headed by men, which may lead to an underestimation of poverty in male versus female-headed households. Understanding the differences in poverty associated with the gender of the household head is intertwined with how one defines the consumption indicator used in measuring poverty. Second, woman household heads are a diverse group. Widows, divorced or sepa-rated women, and single women frequently head households that are relatively disadvan-taged (van de Walle and Milazzo 2015).
The evidence examined above captures snapshots of poverty. Looking at the body of evidence on the evolution of households’ poverty over time (that is, taking movies of people’s poverty status) reveals large varia-tion across countries. Panel data estimates of chronic poverty (the share of households stay-ing poor throughout) range from 6 percent to almost 70 percent. Countries with similar poverty rates can also be quite dissimilar in terms of their poverty dynamics. A systematic assessment using synthetic two-period panels (which are less prone to measurement errors) constructed for 15 countries reveals that about half of the population was chronically poor (poor in every period), with the other half poor only transiently (in only one period) (Dabalen and Dang 2015). Chronic poverty remains pervasive in the region.
Taking a Nonmonetary PerspectiveMany aspects of well-being cannot be prop-erly priced or monetarily valued (Sandel 2012; Sen 1985), such as the ability to read and write, longevity and good health, secu-rity, political freedoms, social acceptance and status, and the ability to move about and con-nect. Recognizing the irreducibility of these aspects of well-being, the Human Develop-ment Index (HDI) and the Multidimensional Poverty Index (MPI) focus on achievements in education, longevity and health, and living standards (through income, assets, or both), which they subsequently combine into a sin-gle index (Alkire and Santos 2014).
This study expands the scope to include freedom from violence and freedom to decide (a proxy for the notion of self-determination that is critical to Sen’s capability approach).6 It also examines jointness in deprivation, by counting the share of people deprived in one, two, or more dimensions of poverty. This approach achieves a middle ground between a single index of poverty (which requires weighting achievements in the vari-ous dimensions) and a dashboard approach (which simply lists achievements dimension by dimension, ignoring jointness in depriva-tion) (Ferreira and Lugo 2013).
The focus in selecting indicators was on outcomes (not inputs) that are measured at the individual (not the household) level. Infor-mation on these indicators is now much more widely available than it once was, although some of the comparability and quality issues highlighted above also apply (see, for exam-ple, UNESCO 2015 for a review of data chal-lenges in tracking adult literacy).
Overall, Africa’s population saw substan-tial progress in most nonmonetary dimen-sions of well-being, particularly health and freedom from violence. Between 1995 and 2012, adult literacy rates rose by 4 percent-age points. Gross primary enrollment rates increased dramatically, and the gender gap shrank. Life expectancy at birth rose 6.2 years, and the prevalence of chronic mal-nutrition among children under 5 fell by 6 percentage points. The number of deaths
12 P O V E R T Y I N A R I S I N G A F R I C A A F R I C A P O V E R T Y R E P O R T
from politically motivated violence declined by 75 percent, and both the incidence and tolerance of gender-based domestic violence dropped. Scores on voice and account-ability indicators rose slightly, and there was a trend toward greater participation of women in household decision-making processes.
These improvements notwithstanding, the levels of achievement remain low in all domains, and the rate of progress is leveling off.7 Despite the increase in school enroll-ment, today still more than two out of five adults are unable to read or write. About three-quarters of sixth graders in Malawi and Zambia cannot read for meaning—just one example of the challenge of providing good-quality schooling. The need to rein-vigorate efforts to tackle Africa’s basic educa-tional challenge is urgent.
Health outcomes mirror the results for lit-eracy: progress is happening, but outcomes remain the worst in the world. Increases in immunization and bednet coverage are slow-ing. Nearly two in five children are malnour-ished, and one in eight women is underweight.
At the other end of the spectrum, obesity is emerging as a new health concern.
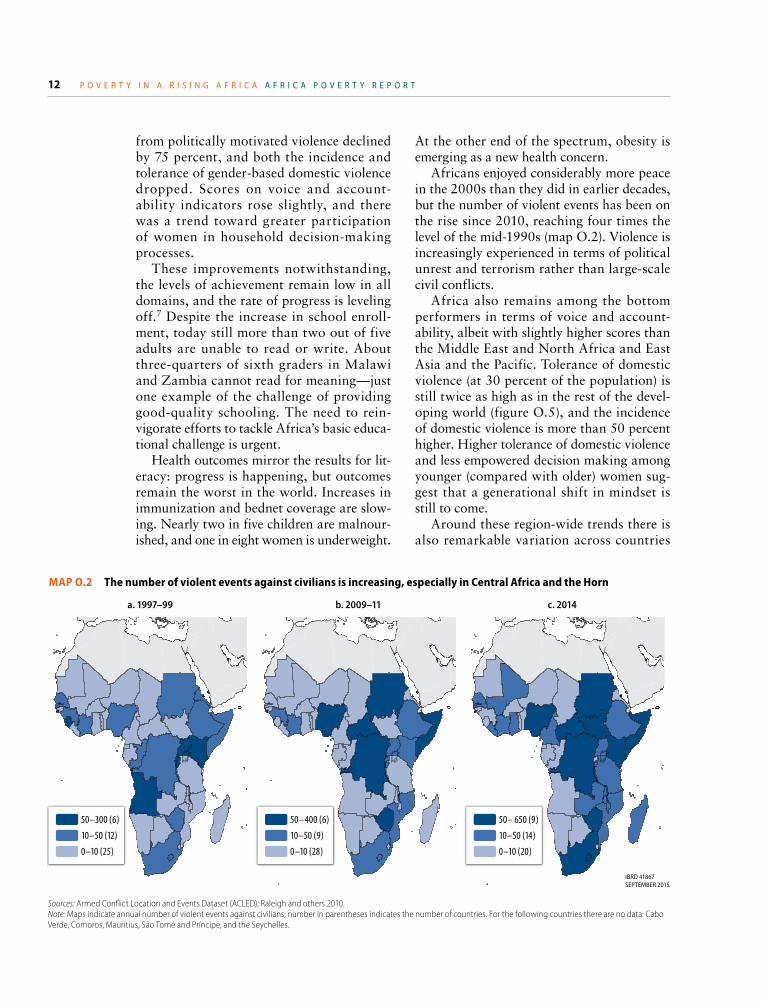
Africans enjoyed considerably more peace in the 2000s than they did in earlier decades, but the number of violent events has been on the rise since 2010, reaching four times the level of the mid-1990s (map O.2). Violence is increasingly experienced in terms of political unrest and terrorism rather than large-scale civil conflicts.
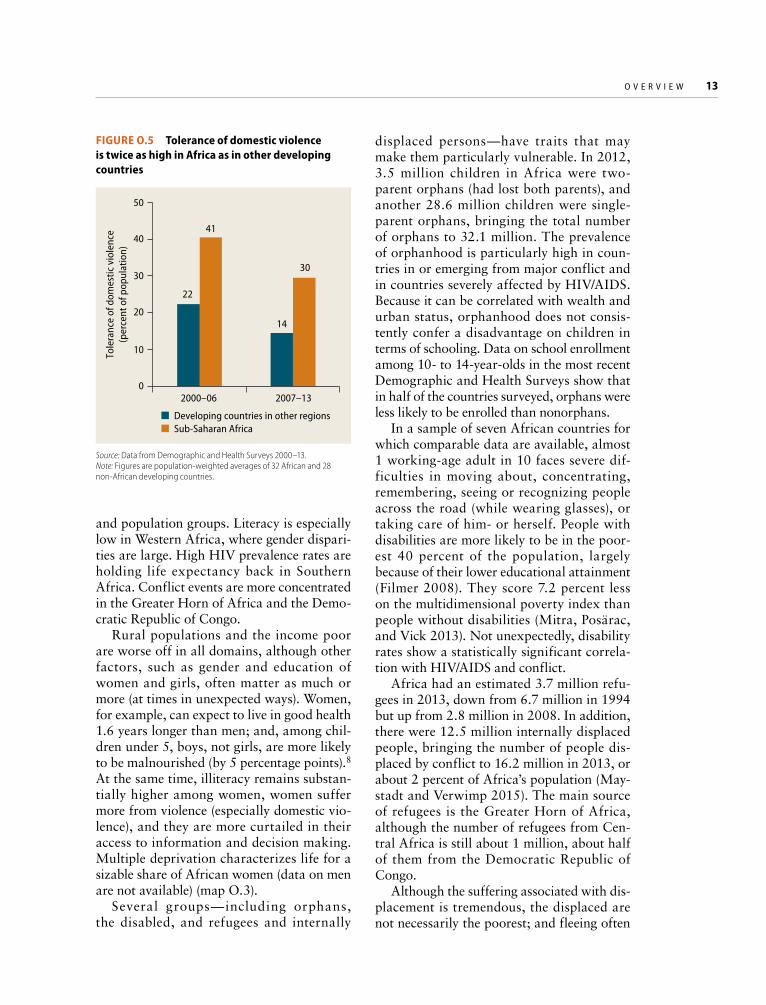
Africa also remains among the bottom performers in terms of voice and account-ability, albeit with slightly higher scores than the Middle East and North Africa and East Asia and the Pacific. Tolerance of domestic violence (at 30 percent of the population) is still twice as high as in the rest of the devel-oping world (figure O.5), and the incidence of domestic violence is more than 50 percent higher. Higher tolerance of domestic violence and less empowered decision making among younger (compared with older) women sug-gest that a generational shift in mindset is still to come.
Around these region-wide trends there is also remarkable variation across countries
IBRD 41867SEPTEMBER 2015
Sources: Armed Conflict Location and Events Dataset (ACLED); Raleigh and others 2010. Note: Maps indicate annual number of violent events against civilians; number in parentheses indicates the number of countries. For the following countries there are no data: Cabo Verde, Comoros, Mauritius, São Tomé and Príncipe, and the Seychelles.
50–300 (6)
10–50 (12)
0–10 (25)
50–400 (6)
10–50 (9)
0–10 (28)
50– 650 (9)
10–50 (14)
0–10 (20)
MAP O.2 The number of violent events against civilians is increasing, especially in Central Africa and the Horn
a. 1997–99 b. 2009–11 c. 2014
O V E R V I E W 13
and population groups. Literacy is especially low in Western Africa, where gender dispari-ties are large. High HIV prevalence rates are holding life expectancy back in Southern Africa. Conflict events are more concentrated in the Greater Horn of Africa and the Demo-cratic Republic of Congo.
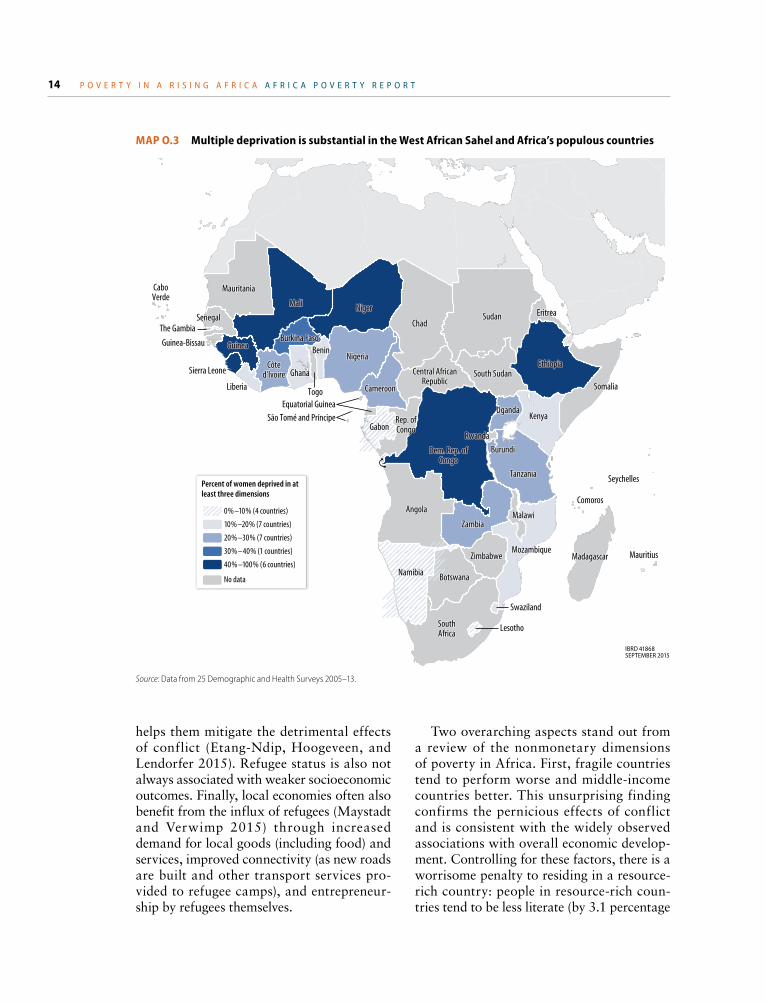
Rural populations and the income poor are worse off in all domains, although other factors, such as gender and education of women and girls, often matter as much or more (at times in unexpected ways). Women, for example, can expect to live in good health 1.6 years longer than men; and, among chil-dren under 5, boys, not girls, are more likely to be malnourished (by 5 percentage points).8 At the same time, illiteracy remains substan-tially higher among women, women suffer more from violence (especially domestic vio-lence), and they are more curtailed in their access to information and decision making. Multiple deprivation characterizes life for a sizable share of African women (data on men are not available) (map O.3).
Several groups—including orphans, the disabled, and refugees and internally
FIGURE O.5 Tolerance of domestic violence is twice as high in Africa as in other developing countries
Source: Data from Demographic and Health Surveys 2000–13.Note: Figures are population-weighted averages of 32 African and 28 non-African developing countries.
50
22
41
14
30
40
30
20
10
0
Tole
ranc
e of
dom
estic
vio
lenc
e(p
erce
nt o
f pop
ulat
ion)
2000–06 2007–13
Developing countries in other regionsSub-Saharan Africa
displaced persons—have traits that may make them particularly vulnerable. In 2012, 3.5 million children in Africa were two- parent orphans (had lost both parents), and another 28.6 million children were single-parent orphans, bringing the total number of orphans to 32.1 million. The prevalence of orphanhood is particularly high in coun-tries in or emerging from major conflict and in countries severely affected by HIV/AIDS. Because it can be correlated with wealth and urban status, orphanhood does not consis-tently confer a disadvantage on children in terms of schooling. Data on school enrollment among 10- to 14-year-olds in the most recent Demographic and Health Surveys show that in half of the countries surveyed, orphans were less likely to be enrolled than nonorphans.
In a sample of seven African countries for which comparable data are available, almost 1 working-age adult in 10 faces severe dif-ficulties in moving about, concentrating, remembering, seeing or recognizing people across the road (while wearing glasses), or taking care of him- or herself. People with disabilities are more likely to be in the poor-est 40 percent of the population, largely because of their lower educational attainment (Filmer 2008). They score 7.2 percent less on the multidimensional poverty index than people without disabilities (Mitra, Posärac, and Vick 2013). Not unexpectedly, disability rates show a statistically significant correla-tion with HIV/AIDS and conflict.
Africa had an estimated 3.7 million refu-gees in 2013, down from 6.7 million in 1994 but up from 2.8 million in 2008. In addition, there were 12.5 million internally displaced people, bringing the number of people dis-placed by conflict to 16.2 million in 2013, or about 2 percent of Africa’s population (May-stadt and Verwimp 2015). The main source of refugees is the Greater Horn of Africa, although the number of refugees from Cen-tral Africa is still about 1 million, about half of them from the Democratic Republic of Congo.
Although the suffering associated with dis-placement is tremendous, the displaced are not necessarily the poorest; and fleeing often
14 P O V E R T Y I N A R I S I N G A F R I C A A F R I C A P O V E R T Y R E P O R T
helps them mitigate the detrimental effects of conflict (Etang-Ndip, Hoogeveen, and Lendorfer 2015). Refugee status is also not always associated with weaker socioeconomic outcomes. Finally, local economies often also benefit from the influx of refugees (Maystadt and Verwimp 2015) through increased demand for local goods (including food) and services, improved connectivity (as new roads are built and other transport services pro-vided to refugee camps), and entrepreneur-ship by refugees themselves.
Two overarching aspects stand out from a review of the nonmonetary dimensions of poverty in Africa. First, fragile countries tend to perform worse and middle-income countries better. This unsurprising finding confirms the pernicious effects of conflict and is consistent with the widely observed associations with overall economic develop-ment. Controlling for these factors, there is a worrisome penalty to residing in a resource-rich country: people in resource-rich coun-tries tend to be less literate (by 3.1 percentage
MauritiusargascaMMMadagascaadagas rradagascaMM
Seychelles
roComoros
LesothoSouthAfrica
Swaziland
BotswanamibmmmmmmmmmmmNamibbbamibiam bbbbbbbbbbbbbbbbbN ibiiiibiii
ZimbabweambiqueamMozam eza bo quez mMozambi
wMaa awMaa iZambia
Angola
Dem. Rep. ofCongo
RwandandaaRwand
BurundBurundBBB i
Tanzania
KenyagandaUgUgUUUUUganda
mmSomSo aliaSom iS
Ethiopia
nnnonobGGGG bbbooooooaaaaGaGaGabonononboboonGRep. offRep. of
goCongC ggCongooo ooCongC
Central AfricanC iRepublicRepublic
Cameroon
Sudan
South Sudan
rreritreErit aEr treatitChad
NigerMali
Burkina FasoBurkinnBenBBenin
Nigeria
TogoEquatorial Guinea
São Tomé and Princípe
nnGhGhanaGCôte
d’IvoireLiberiaib i
Sierra Leone
GuineaGuinea-Bissau
gSeeenegS gaSennegaS
Mauritania
The Gambia
CaboVerde
MauritiusMadagascar
Seychelles
Comoros
LesothoSouthAfrica
Swaziland
BotswanaNamibia
ZimbabweMozambique
MalawiZambia
Angola
Dem. Rep. ofCongo
Rwanda
Burundi
Tanzania
KenyaUganda
Somalia
Ethiopia
GabonRep. ofCongo
Central AfricanRepublic
Cameroon
Sudan
South Sudan
EritreaChad
NigerMali
Burkina FasoBenin
Nigeria
TogoEquatorial Guinea
São Tomé and Príncipe
GhanaCôte
d’IvoireLiberia
Sierra Leone
GuineaGuinea-Bissau
Senegal
Mauritania
The Gambia
CaboVerde
0% –10% (4 countries)
10% –20% (7 countries)
20% –30% (7 countries)
30% –40% (1 countries)
40% –100% (6 countries)
No data
Percent of women deprived in atleast three dimensions
MAP O.3 Multiple deprivation is substantial in the West African Sahel and Africa’s populous countries
Source: Data from 25 Demographic and Health Surveys 2005–13.
IBRD 41868SEPTEMBER 2015
O V E R V I E W 15
points), have shorter life expectancy (by 4.5 years) and higher rates of malnutrition among women (by 3.7 percentage points) and children (by 2.1 percentage points), suffer more from domestic violence (by 9 percent-age points), and live in countries that rank low in voice and accountability measures.
Second, better-educated women (second-ary schooling and above) and children in households with better-educated women score decisively better across dimensions (health, violence, and freedom in decision). More rapidly improving female education and women’s socioeconomic opportunities will be game changing in increasing Africa’s capability achievement.
Measuring Inequality Although not all aspects of inequality are necessarily bad (rewarding effort and risk taking can promote growth), high levels of inequality can impose heavy socioeconomic costs on society. Mechanically, higher initial inequality results in less poverty reduction for a given level of growth. Tentative evidence also suggests that inequality leads to lower and less sustainable growth and thus less poverty reduction (Berg, Ostry, and Zettel-meyer 2012) (if, for example, wealth is used to engage in rent-seeking or other distortion-ary economic behaviors [Stiglitz 2012]). The pathway by which inequality evolves thus matters for poverty reduction and growth.
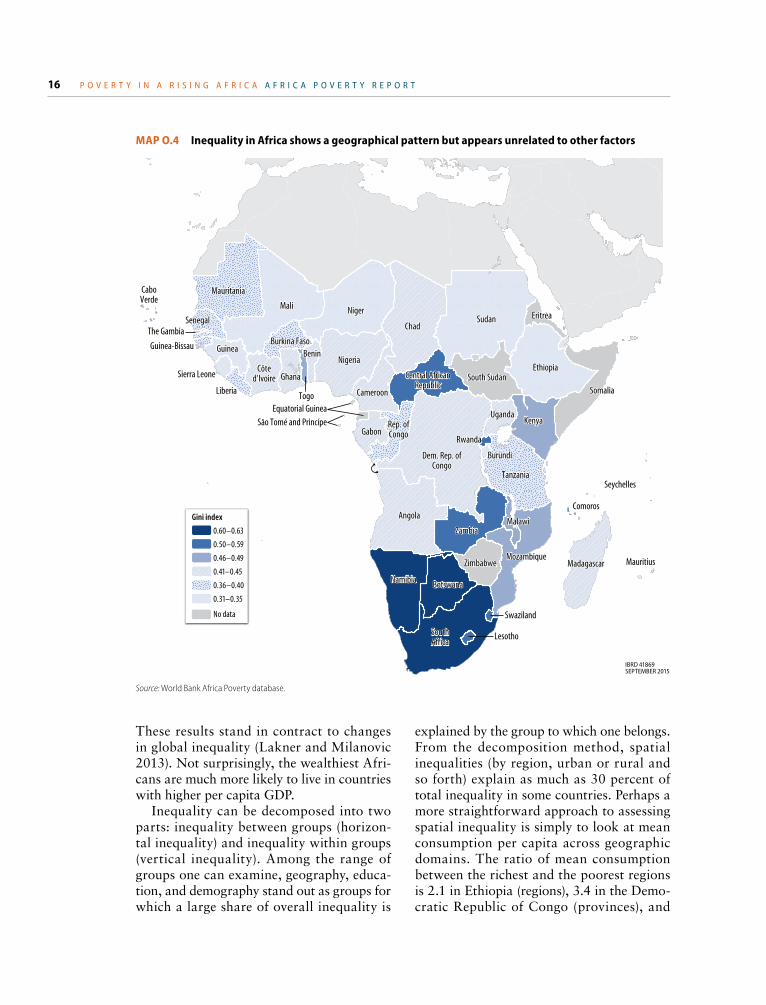
The report measures inequality using the Gini index, which ranges from 0 (perfect equality) to 1 (perfect inequality). It shows that inequality is especially high in Southern Africa (Botswana, Lesotho, Namibia, South Africa, Swaziland, and Zambia), where Gini indices are well above 0.5 (map O.4).
Of the 10 most unequal countries in the world today, 7 are in Africa. Excluding these countries (five of which have popula-tions of less than 5 million and all of which are in Southern Africa) and controlling for country-level income, Africa has inequality levels comparable to developing countries
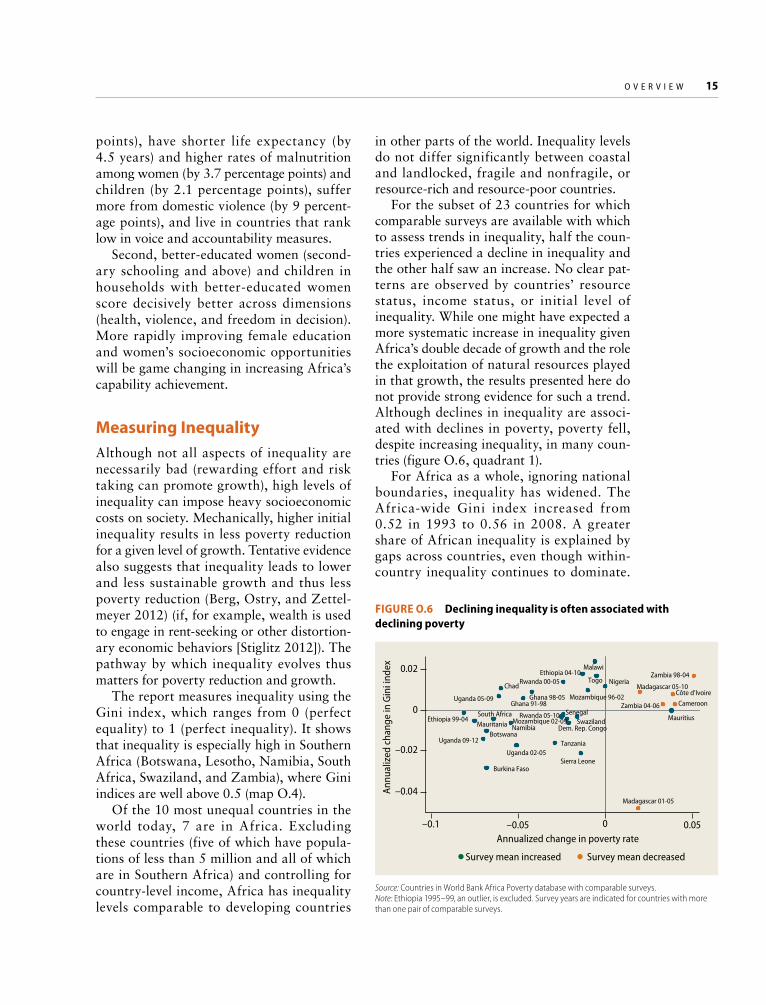
FIGURE O.6 Declining inequality is often associated with declining poverty
Source: Countries in World Bank Africa Poverty database with comparable surveys.Note: Ethiopia 1995–99, an outlier, is excluded. Survey years are indicated for countries with more than one pair of comparable surveys.
Survey mean increased
Annualized change in poverty rate
Annu
aliz
ed c
hang
e in
Gin
i ind
ex
Survey mean decreased
Burkina Faso
BotswanaDem. Rep. Congo
Ethiopia 99-04
Ethiopia 04-10
Ghana 91-98Ghana 98-05 Mozambique 96-02
Mozambique 02-09MauritaniaMauritius
Malawi
Namibia
NigeriaRwanda 00-05
Rwanda 05-10 Senegal
Sierra Leone
Swaziland
ChadTogo
TanzaniaUganda 02-05
Uganda 05-09
Uganda 09-12
South Africa
Côte d’IvoireCameroon
Madagascar 01-05
Madagascar 05-10
Zambia 98-04
Zambia 04-06
–0.04
–0.02
0
0.02
–0.1 –0.05 0 0.05
in other parts of the world. Inequality levels do not differ significantly between coastal and landlocked, fragile and nonfragile, or resource-rich and resource-poor countries.
For the subset of 23 countries for which comparable surveys are available with which to assess trends in inequality, half the coun-tries experienced a decline in inequality and the other half saw an increase. No clear pat-terns are observed by countries’ resource status, income status, or initial level of inequality. While one might have expected a more systematic increase in inequality given Africa’s double decade of growth and the role the exploitation of natural resources played in that growth, the results presented here do not provide strong evidence for such a trend. Although declines in inequality are associ-ated with declines in poverty, poverty fell, despite increasing inequality, in many coun-tries (figure O.6, quadrant 1).
For Africa as a whole, ignoring national boundaries, inequality has widened. The Africa-wide Gini index increased from 0.52 in 1993 to 0.56 in 2008. A greater share of African inequality is explained by gaps across countries, even though within- country inequality continues to dominate.
16 P O V E R T Y I N A R I S I N G A F R I C A A F R I C A P O V E R T Y R E P O R T
MauritiusMadagascar
Seychelles
Comoros
LesothoSouthAfrica
Swaziland
BotswanaNamibia
ZimbabweMozambique
MalawiZambia
Angola
Dem. Rep. ofCongo
Rwanda
Burundi
Tanzania
KenyaUganda
Somalia
Ethiopia
GabonRep. ofCongo
Central AfricanRepublic
Cameroon
Sudan
South Sudan
EritreaChad
NigerMali
Burkina FasoBenin
Nigeria
TogoEquatorial Guinea
São Tomé and Princípe
GhanaCôte
d’IvoireLiberia
Sierra Leone
GuineaGuinea-Bissau
Senegal
Mauritania
The Gambia
CaboVerde
IBRD 41869SEPTEMBER 2015
0.60–0.63
0.50–0.59
0.46–0.49
0.41–0.45
0.36–0.40
0.31–0.35
No data
Gini index
These results stand in contract to changes in global inequality (Lakner and Milanovic 2013). Not surprisingly, the wealthiest Afri-cans are much more likely to live in countries with higher per capita GDP.
Inequality can be decomposed into two parts: inequality between groups (horizon-tal inequality) and inequality within groups (vertical inequality). Among the range of groups one can examine, geography, educa-tion, and demography stand out as groups for which a large share of overall inequality is
explained by the group to which one belongs. From the decomposition method, spatial inequalities (by region, urban or rural and so forth) explain as much as 30 percent of total inequality in some countries. Perhaps a more straightforward approach to assessing spatial inequality is simply to look at mean consumption per capita across geographic domains. The ratio of mean consumption between the richest and the poorest regions is 2.1 in Ethiopia (regions), 3.4 in the Demo-cratic Republic of Congo (provinces), and
MAP O.4 Inequality in Africa shows a geographical pattern but appears unrelated to other factors
Source: World Bank Africa Poverty database.
IBRD 41869SEPTEMBER 2015
O V E R V I E W 17
more than 4.0 in Nigeria (states). Price differ-ences across geographic areas drive some of this gap; adjusted for price differences, spa-tial inequalities fall but are still large.
Education of the household head is asso-ciated with even larger consumption gaps between households. In Rwanda, South Africa, and Zambia, educational attain-ment of the household head explains about 40 percent of overall inequality. Countries with higher inequality tend to have a high share of their inequality driven by unequal education, which is an association that is not observed for most of the other socioeconomic groupings.
The demographic composition of the household also explains a large share of inequality (30 percent in Senegal and 32 per-cent in Botswana). In countries for which data are available to study trends in horizontal inequality from the mid-1990s to the present, the main drivers—geography, education, and demographics—have not changed, though some variations exist at the country level.
Inequality in Africa is the product of many forces. The circumstances in which one is born (for example, in a rural area, to unedu-cated parents) can be critical. Inequality of opportunity (what sociologists call ascrip-tive inequality)—the extent to which such circumstances dictate a large part of the out-comes among individuals in adulthood—vio-lates principles of fairness.
The evidence on inequality of economic opportunity in Africa has been limited. This report draws on surveys of 10 African countries to explore the level of inequality of economic opportunity by looking at such circumstances as ethnicity, parental educa-tion and occupation, and region of birth. The share of consumption inequality that is attributed to inequality of opportunity is as high as 20 percent (in Malawi) (because of data limitations, this estimate is a lower bound). But inequality of opportunity is not necessarily associated with higher overall inequality.
Another approach to measuring inequality of opportunity is to examine persistence in
intergenerational education and occupation. Does the educational attainment of a child’s parents affect a child’s schooling less than it did 50 years ago? Is a farmer’s son less likely to be a farmer than he was a generation ago?
Among recent cohorts, an additional year of schooling of one’s parents has a lower association with one’s own schooling than it did for older generations, suggesting more equal educational opportunities for younger cohorts. Intergenerational mobility trends are comparable to trends estimated for other developing countries. For occupation the findings are more mixed for the five coun-tries for which data are available. Intergener-ational occupational mobility has been rising rapidly in the Comoros and Rwanda. In con-trast, it remains rigid in Guinea. The shift in the structure of occupations in the economy (sometimes called structural change) is not the sole reason for changes in intergenera-tional occupational mobility. Other factors, such as discrimination, social norms, and impediments to mobility (poor infrastruc-ture, conflict, and so forth), are also chang-ing in ways that increase can affect mobility.
These results tell only part of the story because household surveys are not suited to measuring extreme wealth. Data on holders of extreme wealth are difficult to collect, but such people are increasingly on the radar in discussions of inequality around the globe.
Africa had 19 billionaires in 2014 accord-ing to the Forbe’s list of “The World’s Billion-aires.” Aggregate billionaire wealth increased steadily between 2010 and 2014 in Nigeria (from 0.3 percent to 3.2 percent of GDP) and South Africa (from 1.6 percent to 3.9 percent). The number of ultra-high-net-worth individu-als (people worth at least $30 million) also rose. Few detailed studies explore the level of extreme wealth of nationals. One exception comes from Kenya, where 8,000 people are estimated to own 62 percent of the country’s wealth (New World Wealth 2014). The share of extreme wealth derived from areas prone to political capture, including extractives, has been declining, while the share derived from services and investment has been increasing.
18 P O V E R T Y I N A R I S I N G A F R I C A A F R I C A P O V E R T Y R E P O R T
Between 2011 and 2014, 4 out of 20 billion-aires in Africa derived their wealth mainly or partially from telecommunications. Data lim-itations make it difficult to draw conclusions about whether the emergence of extreme wealth in Africa is driven less by political connections than it used to be.
Notes1. Throughout this report, Africa refers to Sub-
Saharan Africa.2. The focus is on a range of measurement issues,
including the limited availability, comparabil-ity, and quality of consumption data and the remedies used to overcome these constraints. For a range of other measurement issues—including the measurement of service flows from housing and durable goods, the conver-sion of household into individual consumption measures (to account for differential needs and economies of scale), and methodological differences in constructing poverty lines—the report adopted standard approaches.
3. An additional aspect is measuring cross- country poverty, which requires converting local currency measures into a common cur-rency. This report adopts the new international poverty line of $1.90/day in 2011 based on the latest round of the purchasing power parity (PPP) exercise and discusses the complicated set of issues that PPPs entail.
4. The five countries for which no survey data are available to estimate poverty (Eritrea, Equato-rial Guinea, Somalia, South Sudan, and Zim-babwe) were assigned the regional poverty rate based on the other 43 countries.
5. Exclusion of noncomparable and poor-qual-ity surveys induces greater reliance on GDP imputation.
6. Sen’s capability approach provides the philo-sophical foundations for the nonmonetary perspective.
7. Below-average performance in Africa’s three most populous countries (Nigeria, the Demo-cratic Republic of Congo, and Ethiopia) partly drives the high levels of nonmonetary poverty in the region.
8. Higher life expectancy for women is possible even in an environment that is disadvantageous to them, given that women are genetically pre-disposed to live longer (Sen 2002; World Bank 2011).
ReferencesACLED (Armed Conflict Location and Event
Data Project) http://www.acleddata.com /about-acled/. Accessed in April 2015.
Adam, Christopher, David Kwimbere, Wilfred Mbowe, and Stephen O’Connell. 2012. “Food Prices and Inflation in Tanzania.” Working Paper, International Growth Center. London.
Alkire, Sabina, and Maria Emma Santos. 2014. “Measuring Acute Poverty in the Developing World: Robustness and Scope of the Multidi-mensional Poverty Index.” World Develop-ment 59: 251–74.
Berg, Andrew, Jonathan D. Ostry, and Jeromin Zettelmeyer. 2012. “What Makes Growth Sustained?” Journal of Development Econom-ics 98 (2): 149–66.
Bloom, David, and Jeffrey Sachs. 1998. “Geog-raphy, Demography, and Economic Growth in Africa.” Brookings Papers on Economic Activity 2: 207–95.
Canning, David, Sangeeta Raja, and Abdo Yazbeck, eds. 2015. Africa’s Demographic Transition: Dividend or Disaster? Africa Development Forum Series. Washington, DC: World Bank.
Carletto, Calogero, Dean Jolliffe, and Raka Banerjee. 2015. “From Tragedy to Renais-sance: Improving Agriculture Data for Better Policy.” Policy Research Working Paper 7150, World Bank, Washington, DC.
CGD (Center for Global Development). 2014. Delivering on the Data Revolution in Sub-Saharan Africa. Final Report of the Data for African Development Working Group. Center for Global Development and African Popula-tion and Health Research Center, Washington, DC.
Christiaensen, Luc, Peter Lanjouw, Jill Luoto, and David Stifel. 2012. “Small Area Estimation-Based Prediction Methods to Track Poverty: Validation and Applications.” Journal of Eco-nomic Inequality 10 (2): 267–97.
Costa, Dora L. 2001. “Estimating Real Income in the United States from 1888 to 1994: Correct-ing CPI Bias Using Engel Curves.” Journal of Political Economy 109 (6): 1288–310.
Dabalen, Andrew, and Hai-Anh Dang. 2015. “The Transition of Welfare over Time for Africa: Evidence from Synthetic Panel Analy-sis.” Background paper prepared for this report, World Bank, Washington, DC.
O V E R V I E W 19
de la Briere, Benedicte, Deon Filmer, Dena Ringold, Dominic Rohner, Karelle Samuda, and Anastasiya Denisova. 2015. From Mines to Minds: Turning Sub-Saharan’s Mineral Wealth into Human Capital. Washington DC: World Bank.
Demographic and Health Surveys. 2015. Calver-ton, MD: ICF International.
Devarajan, Shantayanan. 2013. “Africa’s Statisti-cal Tragedy.” Review of Income and Wealth 59 (S1): S9–S15.
Etang-Ndip, Alvin, Johannes Hoogeveen, and Julia Lendorfer. 2015. “Socioeconomic Impact of the Crisis in North Mali on Displaced Peo-ple.” Policy Research Working Paper 7253, World Bank, Washington, DC.
Ferreira, Francisco H. G., and María Ana Lugo. 2013. “Multidimensional Poverty Analysis: Looking for a Middle Ground.” World Bank Research Observer 28 (2): 220–35.
Filmer, Deon. 2008. “Disability, Poverty, and Schooling in Developing Countries: Results from 14 Household Surveys.” World Bank Economic Review 22 (1): 141–63.
Florian, Krätke, and Bruce Byiers. 2014. “The Political Economy of Official Statistics: Implications for the Data Revolution in Sub- Saharan Africa.” Discussion Paper 5, Partner-ship in Statistics for Development in the 21st Century, Paris.
Hamilton, Bruce W. 2001. “Using Engel’s Law to Estimate CPI Bias.” American Economic Review 91 (3): 619–30.
Hoogeveen, Johannes. 2007. “Underreporting of Consumer Price Inflation in Tanzania 2002–2006.” Policy Note, World Bank, Wash-ington, DC.
———. 2015. “Statistics Reform in Africa: Align-ing Incentives with Results.” Background paper prepared for this study, World Bank, Washington, DC.
IMF (International Monetary Fund). 2003. Ghana: First Review under the Three-Year Arrangement under the Poverty Reduction and Growth Facility. IMF Country Report 03/395, Washington DC.
———. 2007. Ghana: Article IV Consultation: Staff Report. IMF Country Report 07/210, Washington DC.
Jerven, Morten. 2013. “Comparability of GDP Estimates in Sub-Saharan Africa: The Effect of Revisions in Sources and Methods since Struc-tural Adjustment.” Review of Income and Wealth 59 (S1): S16–S36.
Lakner, Christoph, and Branko Milanovic. 2013. “Global Income Distribution: From the Fall of the Berlin Wall to the Great Recession.” Policy Research Working Paper 6719. World Bank, Washington, DC.
Lanjouw, Peter, and Martin Ravallion. 1995. “Poverty and Household Size.” Economic Journal 105 (433): 1415–34.
Loayza, Norman V., and Claudio Raddatz. 2010. “The Composition of Growth Matters for Poverty Alleviation.” Journal of Development Economics 93 (1): 137–51.
Maystadt, Jean-François, and Philip Verwimp. 2015. “Forced Displacement and Refugees in Sub-Saharan Africa: An Economic Inquiry.” Background paper prepared for this study, World Bank, Washington DC.
Milazzo, Annamaria, and Dominique van de Walle. 2015. “Women Left Behind? Poverty and Headship in Africa.” Policy Research Working Paper 7331, World Bank, Washing-ton D.C.
Mitra, Sophie, Aleksandra Posärac, and Brandon Vick. 2013. “Disability and Poverty in Devel-oping Countries: A Multidimensional Study.” World Development 41: 1–18.
New World Wealth. 2014. Wealth in Kenya: The Future of Kenyan HNWIs. Johannesburg.
Newhouse, David, S. Shivakumaran, Shinya Takamatsu, and Nobuo Yoshida. 2014. “How Survey-to-Survey Imputation Can Fail.” Policy Research Working Paper 6961, World Bank, Washington, DC.
Raleigh, Clionadh, Andrew Linke, Håvard Hegre, and Joakim Karlsen. 2010. “Introducing ACLED-Armed Conflict Location and Event Data.” Journal of Peace Research 47 (5): 1–10.
Oxfam. 2015. “Wealth: Having It All and Want-ing More.” Oxfam Issue Briefing, January. Oxford.
Sandel, Michael J. 2012. What Money Can’t Buy: The Moral Limits of Markets. New York: Farrar, Straus and Giroux.
Sen, Amartya. 1985. Commodities and Capabili-ties. Amsterdam: North-Holland.
———. 2002. “Why Health Equity?” Health Economics 11 (8): 659–66.
Stiglitz, Joseph E. 2012. The Price of Inequality: How Today’s Divided Society Endangers Our Future. New York: W. W. Norton.
UN (United Nations). 2015. The Millennium Development Goals Report 2015. New York: United Nations.
20 P O V E R T Y I N A R I S I N G A F R I C A A F R I C A P O V E R T Y R E P O R T
UNESCO (United Nations Educational, Scientific and Cultural Organization). 2015. Education for All 2000–2015: Achievements and Chal-lenges. EFA Global Monitoring Report. Paris: UNESCO.
van de Walle, Dominique, and Annamaria Mila-zzo. 2015. “Are Female-Headed Households Poorer? New Evidence for Africa.” mimeo, DECRG. World Bank, Washington, DC.
World Bank. 2011. World Development Report 2012: Gender and Development. Washington, DC: World Bank.
———. 2012. Niger: Investing for Prosperity: A Poverty Assessment. Washington, DC.
———. 2013. “Burkina Faso: A Policy Note: Poverty Trends and Profile for 2003–2009.” World Bank, Washington, DC.
———. 2015. A Measured Approach to End-ing Poverty and Boosting Shared Prosperity: Concept, Data and the Twin Goals. Policy Research Report, World Bank, Washington, DC.
ECO-AUDIT
Environmental Benefits StatementThe World Bank Group is committed to reducing its environmental footprint. In support of this commitment, the Publishing and Knowledge Division leverages electronic publishing options and print-on-demand technology, which is located in regional hubs worldwide. Together, these initiatives enable print runs to be lowered and shipping distances decreased, resulting in reduced paper consump-tion, chemical use, greenhouse gas emissions, and waste.
The Publishing and Knowledge Division follows the recommended standards for paper use set by the Green Press Initiative. The majority of our books are printed on Forest Stewardship Council (FSC)–certified paper, with nearly all con-taining 50–100 percent recycled content. The recycled fiber in our book paper is either unbleached or bleached using totally chlorine free (TCF), processed chlorine free (PCF), or enhanced elemental chlorine free (EECF) processes.
More information about the Bank’s environmental philosophy can be found at http://crinfo.worldbank.org/wbcrinfo/node/4.


SKU 32962