Embed Size (px)
Citation preview

Overview: Physics Modules
Global Climate Change Education for Alabama
NASA/Auburn/ALSDE/ASIM

4 Modules included:
1. Graphing NASA Climate Data2. Fluid Density3. Fluid Pressure4. Seawater Intrusion Simulations

Objectives:
To help students understand the dynamics of saltwater intrusion that
results from sea level change.

Climate change:
1. Students hear about this from a variety of sources.
2. May or may not study it in their science classes.
3. All sources may not be scientifically accurate.
4. Students need to be better informed so they can make informed decisions about the future.

These modules are:
Based on the 5E learning cycle: EngageExploreExplainExtendEvaluate
….. to improve student learning.

Contain skills targeted by the Partnership for
21st Century Skills
- Skills that help students prepare to participate successfully in the 21st
century - their future!
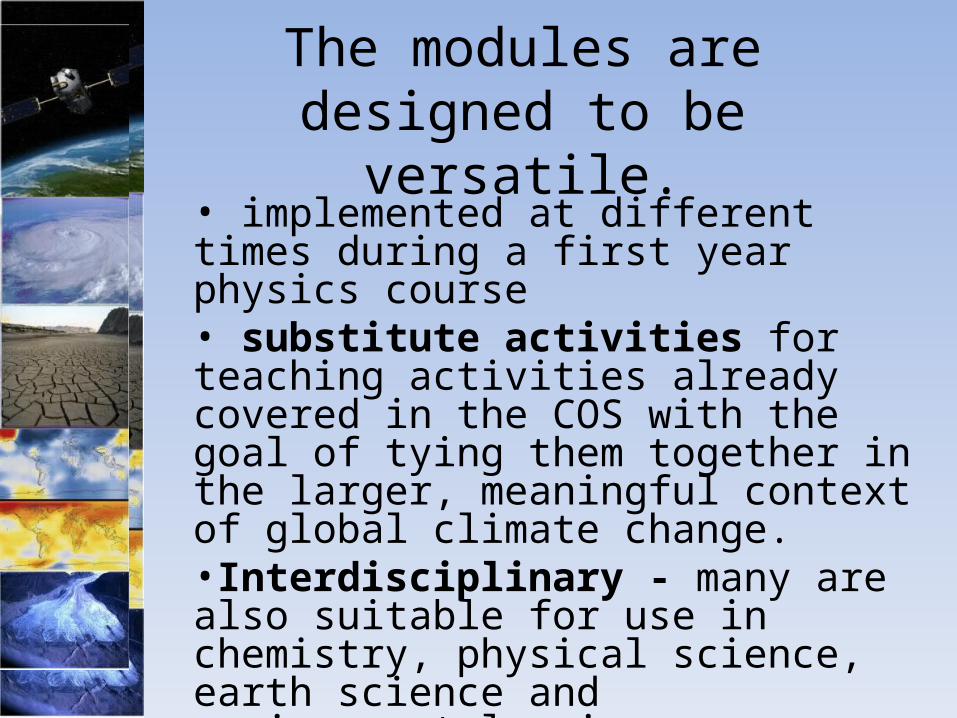
The modules are designed to be versatile.
• implemented at different times during a first year physics course• substitute activities for teaching activities already covered in the COS with the goal of tying them together in the larger, meaningful context of global climate change. •Interdisciplinary - many are also suitable for use in chemistry, physical science, earth science and environmental science.

Activity 1: Graphing NASA Climate Data
Engage: Students get to be NASA scientists for the day- graphing real data.Explore: Students learn to import ASCII data in Excel and also learn a general method for analyzing data. They will graph, treat and analyze the data provided.

Explain: Students explain the trend line they see in their assigned data set.
Extend: Students can extend their knowledge by visiting “My NASA Data” a website specifically designed to allow students graphical access to NASA climate data. mynasadata.larc.nasa.gov/

Evaluate: Students come together and evaluate the data they have graphed, thereby allowing for discussion of cause/effect relationships and how these factors affect the future.

Activity 2: Fluid Density
Engage: The differences in densities between regular and diet soda can lead to a discussion on density, sinking and floating.
Explore: Students explore density in a qualitative manner using a layering technique to observe the density of fresh water and simulated seawater.

Explain: Students should explain that seawater is denser than freshwater. They are then prompted to define density and name equipment need to measure it.
Extend: Students elaborate on the topic of density by developing, recording and following a procedure for determining the density of a fluid. They construct a data table for recording data.

Evaluate: Students evaluate their work by using reference materials to find the accepted values for the densities of fresh and seawater, and then assess their accuracy by calculating the percent error of their value as compared to the accepted value.

Activity 3: Fluid Pressure
-May be used after Newton’s laws to reinforce how mathematical relationships can be discovered through experimental data-May also be used in Chemistry during the section on gas laws (manometers, barometers, atmospheric pressure, etc.)-May be used to examine fluid behavior (States of Matter chapter)

Engage: The principle objective of this activity is to help students understand how the pressure (P) of a fluid depends upon the density (ρ= rho) and the depth of the fluid (h). To engage the students, a large soda bottle with holes drilled vertically along its side is filled with water, demonstrating that the pressure of a fluid increases with depth.

Explore: Students are divided into 4 groups and each are assigned a fluid. Using a manometer, hand pump, pressure sensor and a GLX, students collect height of fluid data over various pressures.

Explain: Once students understand that the pressure is proportional to both the height and density of the fluid, students use the density of their fluid to eventually derive the equation for pressure as a function of depth, density and g.
Extend: Students discuss the gravitational constant, g – why each group was able to calculate it, and how the experiment would change if conducted on another planet.

Evaluate: Students evaluate what they’ve learned when asked how a changing sea level (along with changing pressures) may impact coastal regions.

Activity 4: Saltwater Intrusion Simulations
• As the final activity, this culminating activity helps students understand the interaction between saltwater and freshwater in coastal regions. •The simulation software allows students to manipulate variables to model changes in groundwater systems and draw conclusions.

Engage: Students view NASA night-time photo of the US and are asked to predict what would happen for three scenarios:
1. Sea level rises 1 m, fresh water remains constant
2. Sea level remains constant and fresh water table is pumped lowering water table by 1 m
3. Sea level rises 1 m, fresh water is pumped lowering water table by 1 m

Explore: Students develop a mathematical model for saltwater intrusion.
1.027
40.0

Explain: Students are now in a position to explain what they have learned from their exploration.
Extend: Using the US Geological Ground Water website http://pubs.usgs.gov/ha/ha730/ch_g/G-text4.html students can access good information on sea level rise and its impact on coastal Florida cities.

Summary – the benefits• Relate physics to the issue of global climate change•Improve skills that are useful in other subjects and later in college (Excel, etc.)•Deeper learning (depth not breadth…)•Demonstrates the benefits of modeling (both mathematical and computer) •Encourage students toward STEM careers