Embed Size (px)
Citation preview
NATIONAL PETROLEUM INSTITUTE
OVERVIEW OF OIL AND GAS IN MOZAMBIQUE
IPAD - MOZAMBIQUE POWER AND GAS FORUM
Maputo, October 2013
INTRODUCTION
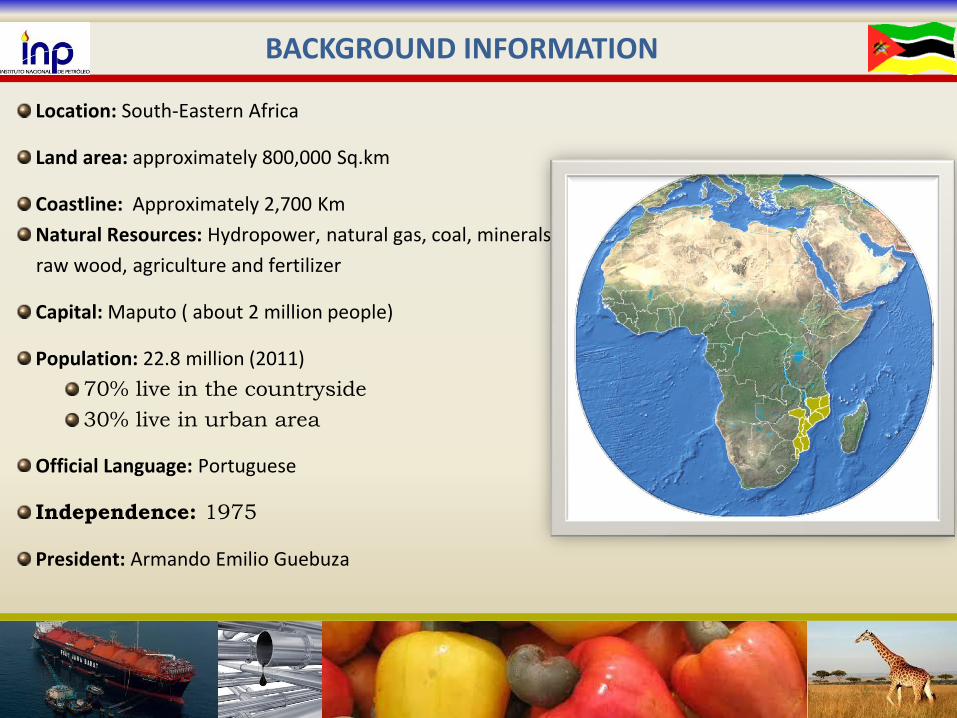
Location: South-Eastern Africa
Land area: approximately 800,000 Sq.km
Coastline: Approximately 2,700 Km
Natural Resources: Hydropower, natural gas, coal, minerals,
raw wood, agriculture and fertilizer
Capital: Maputo ( about 2 million people)
Population: 22.8 million (2011)
70% live in the countryside
30% live in urban area
Official Language: Portuguese
Independence: 1975
President: Armando Emilio Guebuza
BACKGROUND INFORMATION
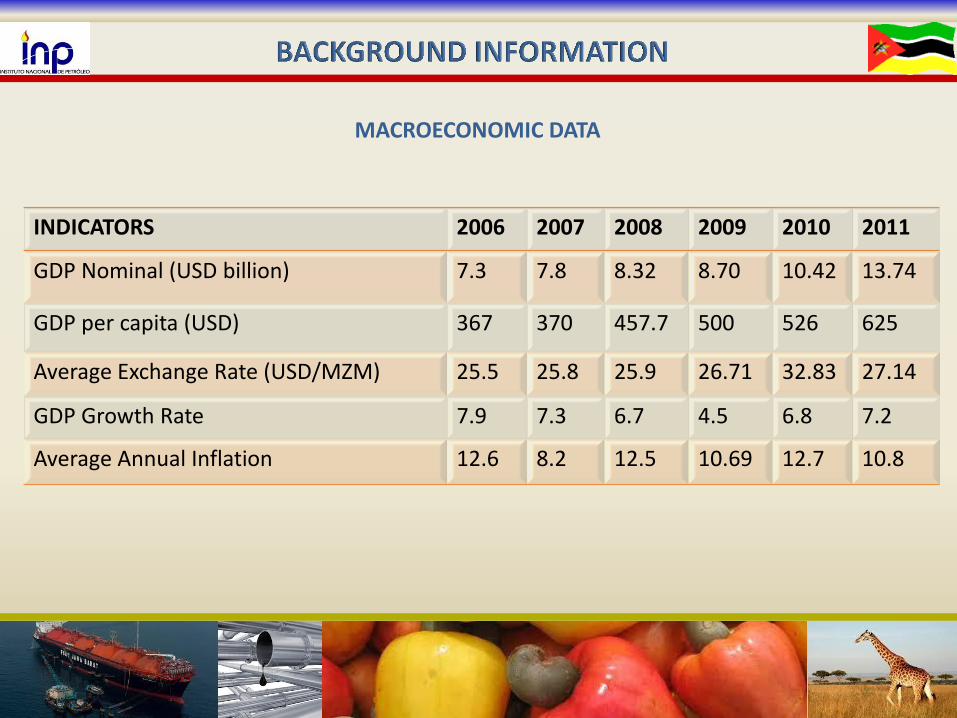
MACROECONOMIC DATA
INDICATORS 2006 2007 2008 2009 2010 2011
GDP Nominal (USD billion) 7.3 7.8 8.32 8.70 10.42 13.74
GDP per capita (USD) 367 370 457.7 500 526 625
Average Exchange Rate (USD/MZM) 25.5 25.8 25.9 26.71 32.83 27.14
GDP Growth Rate 7.9 7.3 6.7 4.5 6.8 7.2
Average Annual Inflation 12.6 8.2 12.5 10.69 12.7 10.8
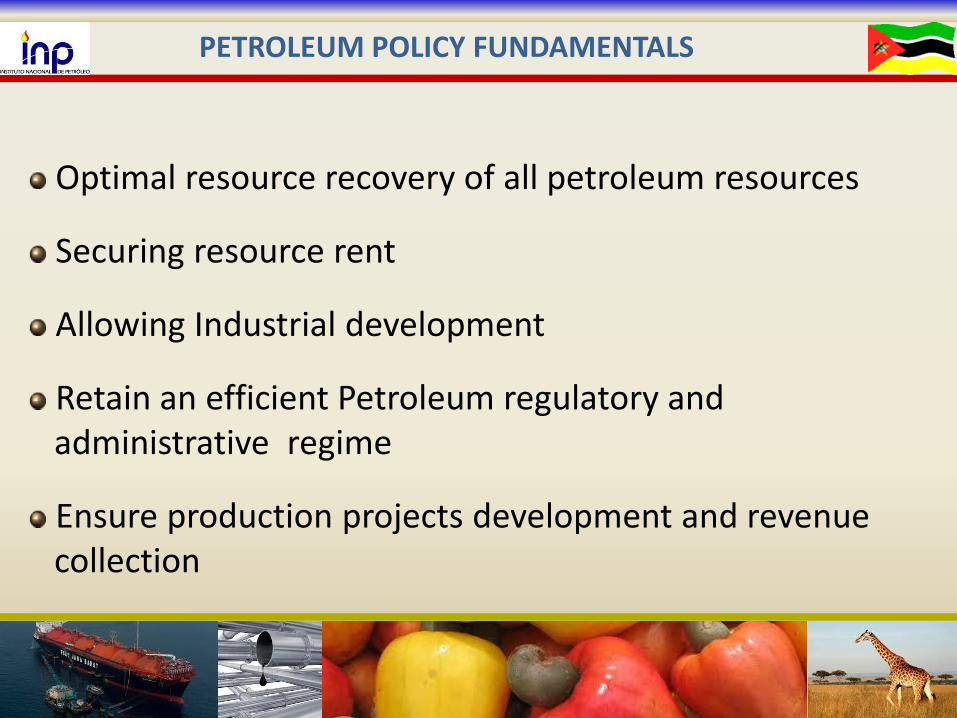
Optimal resource recovery of all petroleum resources
Securing resource rent
Allowing Industrial development
Retain an efficient Petroleum regulatory and administrative regime
Ensure production projects development and revenue collection
PETROLEUM POLICY FUNDAMENTALS
INSTITUTIONAL/REGULATORY
FRAMEWORK
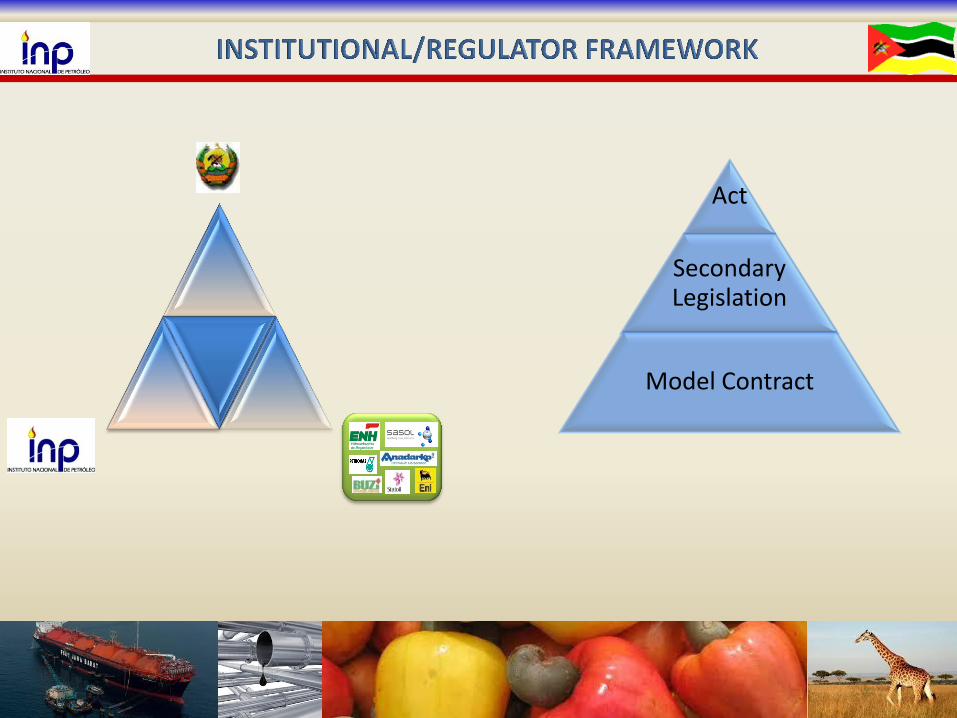
Act
Secondary Legislation
Model Contract
EXPLORATION ACTIVITIES
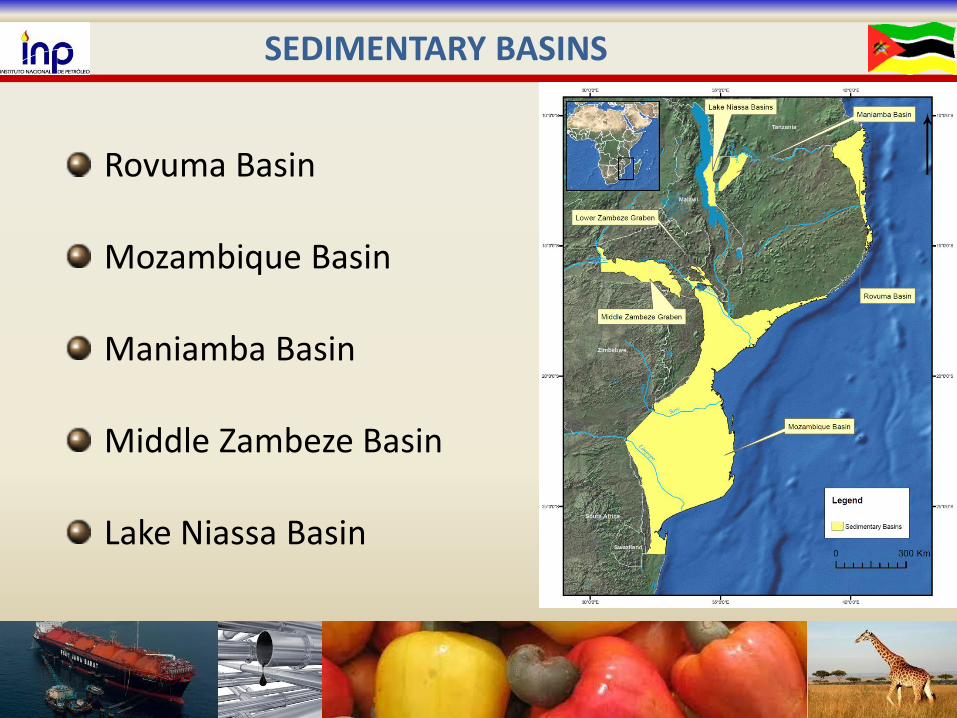
SEDIMENTARY BASINS
Rovuma Basin
Mozambique Basin
Maniamba Basin
Middle Zambeze Basin
Lake Niassa Basin
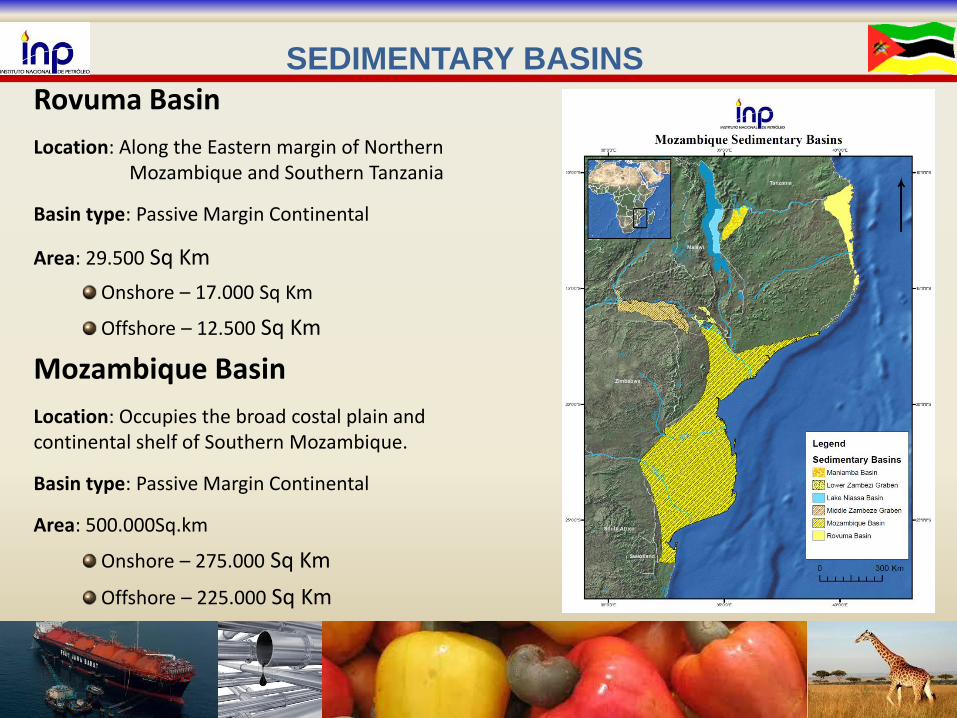
Mozambique Basin
Location: Occupies the broad costal plain and continental shelf of Southern Mozambique.
Basin type: Passive Margin Continental
Area: 500.000Sq.km
Onshore – 275.000 Sq Km
Offshore – 225.000 Sq Km
Rovuma Basin
Location: Along the Eastern margin of Northern Mozambique and Southern Tanzania
Basin type: Passive Margin Continental
Area: 29.500 Sq Km
Onshore – 17.000 Sq Km
Offshore – 12.500 Sq Km
SEDIMENTARY BASINS
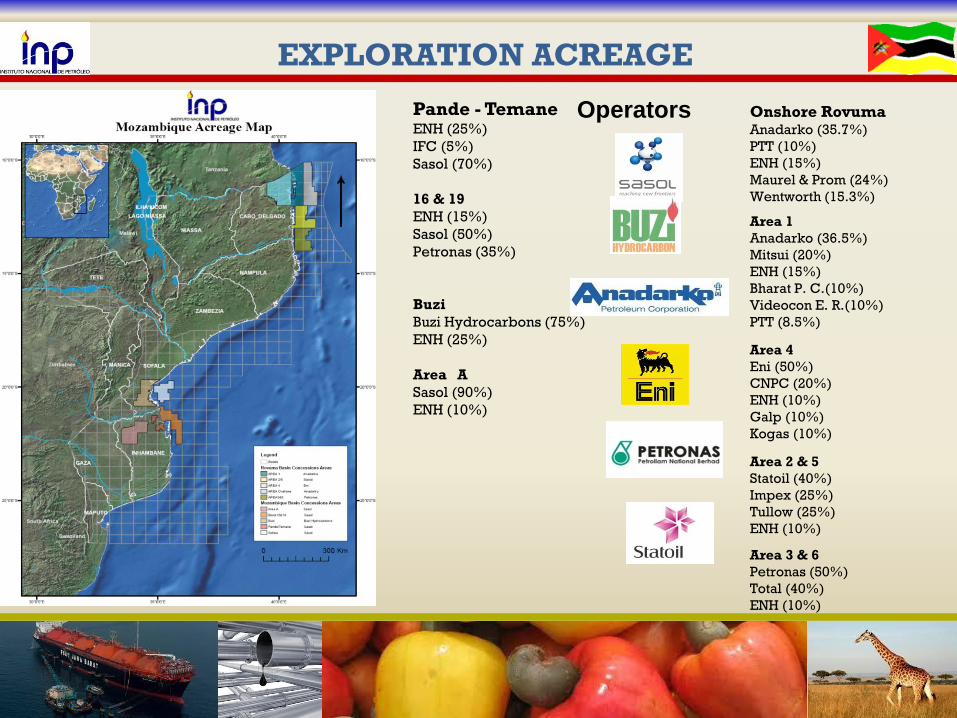
Onshore Rovuma Anadarko (35.7%)
PTT (10%)
ENH (15%)
Maurel & Prom (24%)
Wentworth (15.3%)
Area 1
Anadarko (36.5%)
Mitsui (20%)
ENH (15%)
Bharat P. C.(10%)
Videocon E. R.(10%)
PTT (8.5%)
Area 4
Eni (50%)
CNPC (20%)
ENH (10%)
Galp (10%)
Kogas (10%)
Area 2 & 5
Statoil (40%)
Impex (25%)
Tullow (25%)
ENH (10%)
Area 3 & 6
Petronas (50%)
Total (40%)
ENH (10%)
Pande - Temane ENH (25%)
IFC (5%)
Sasol (70%)
16 & 19
ENH (15%)
Sasol (50%)
Petronas (35%)
Buzi
Buzi Hydrocarbons (75%)
ENH (25%)
Area A
Sasol (90%)
ENH (10%)
Operators
EXPLORATION ACREAGE
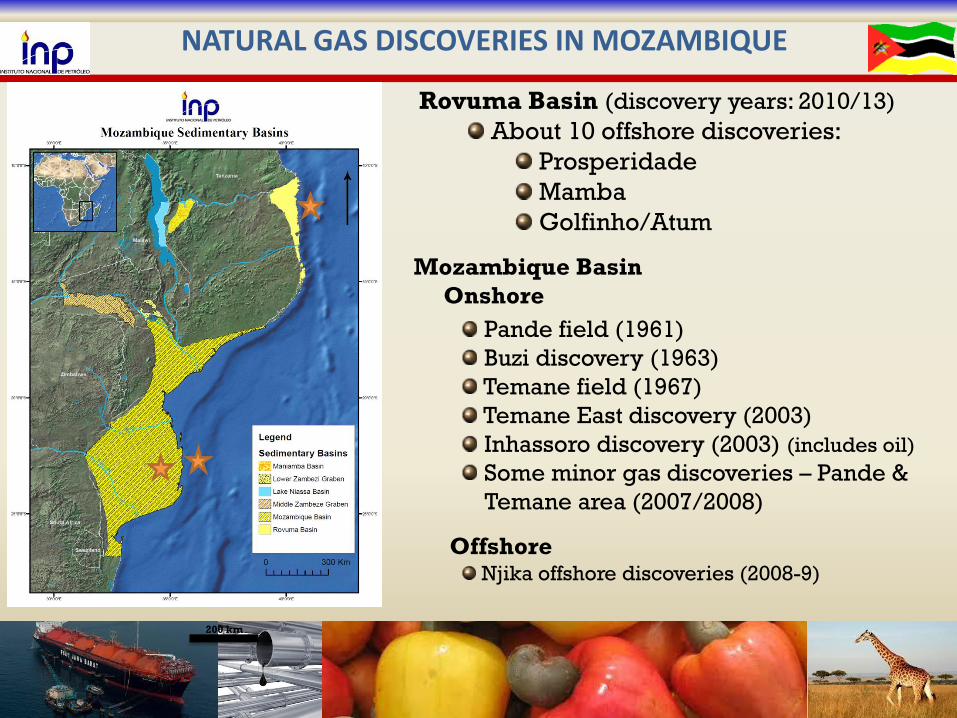
NATURAL GAS DISCOVERIES IN MOZAMBIQUE
Rovuma Basin (discovery years: 2010/13)
About 10 offshore discoveries:
Prosperidade
Mamba
Golfinho/Atum
Mozambique Basin
Onshore
Pande field (1961)
Buzi discovery (1963)
Temane field (1967)
Temane East discovery (2003)
Inhassoro discovery (2003) (includes oil)
Some minor gas discoveries – Pande &
Temane area (2007/2008)
Offshore Njika offshore discoveries (2008-9)
200 km
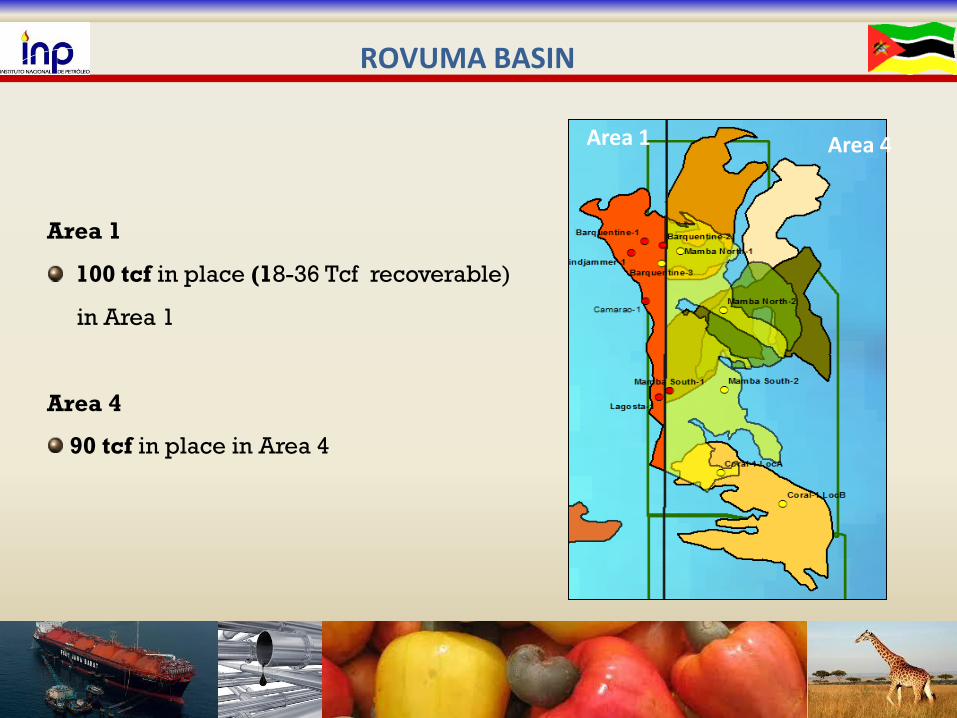
Area 1
100 tcf in place (18-36 Tcf recoverable)
in Area 1
Area 4
90 tcf in place in Area 4
ROVUMA BASIN
Area 1 Area 4
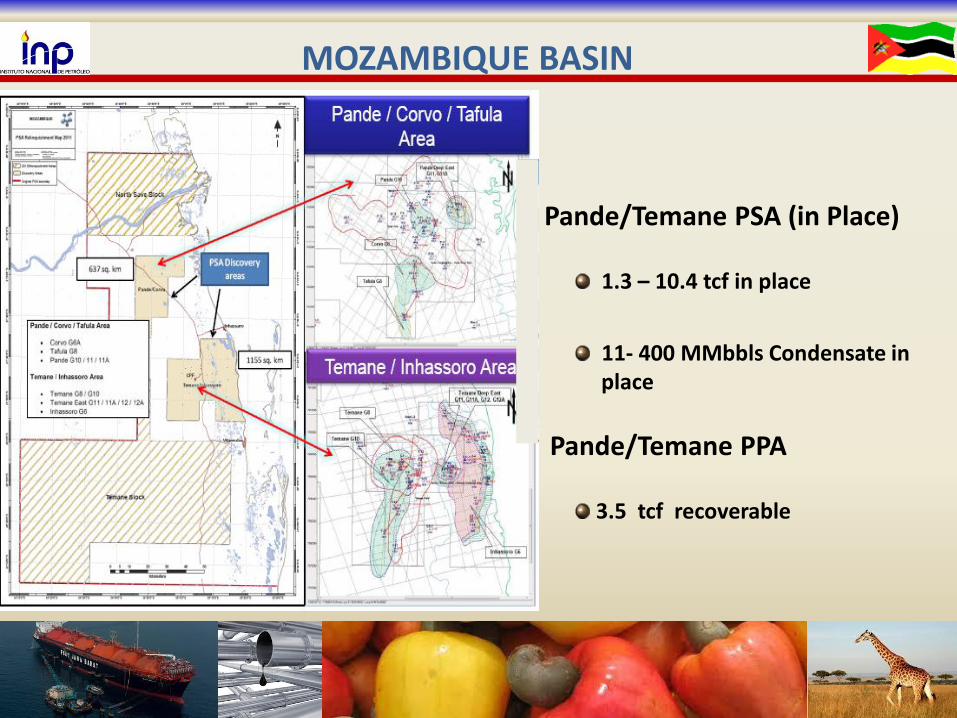
MOZAMBIQUE BASIN
Pande/Temane PSA (in Place)
1.3 – 10.4 tcf in place
11- 400 MMbbls Condensate in
place
Pande/Temane PPA
3.5 tcf recoverable
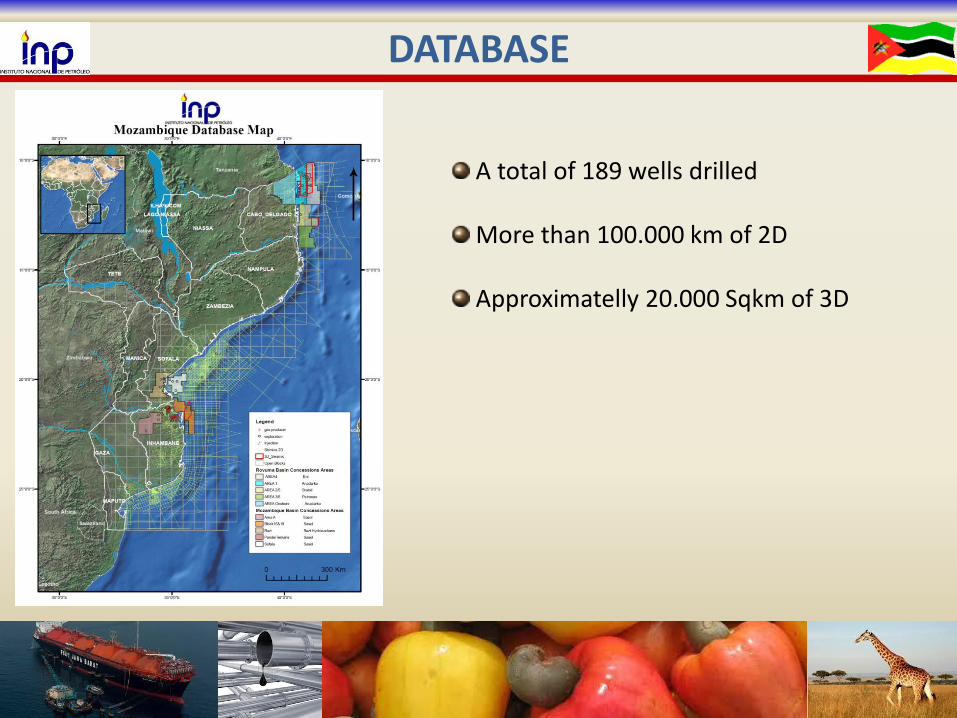
DATABASE
A total of 189 wells drilled
More than 100.000 km of 2D
Approximatelly 20.000 Sqkm of 3D
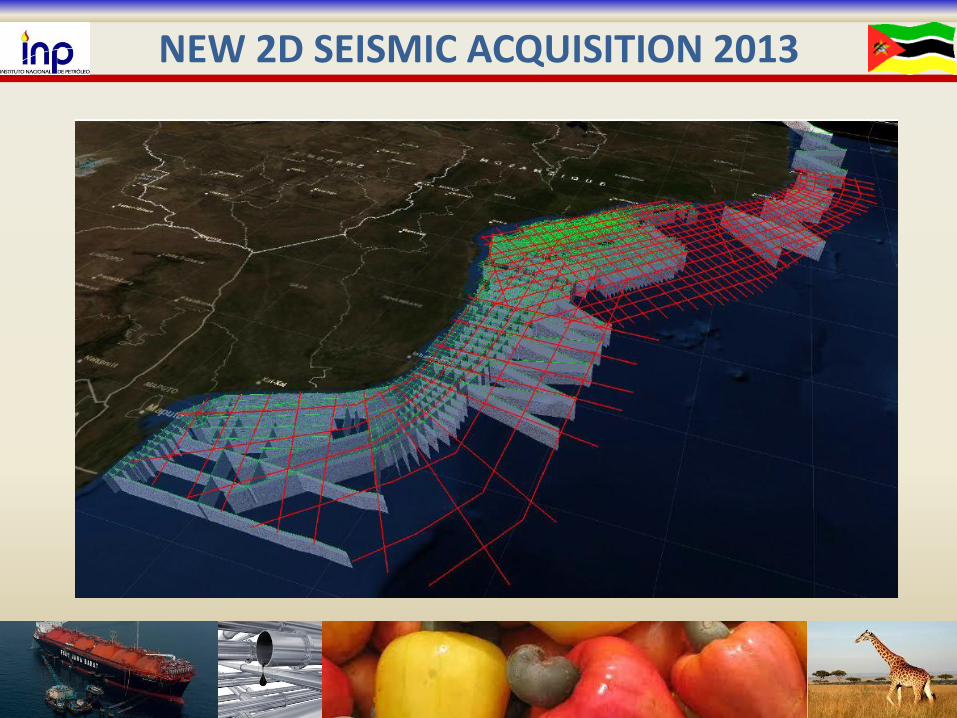
NEW 2D SEISMIC ACQUISITION 2013
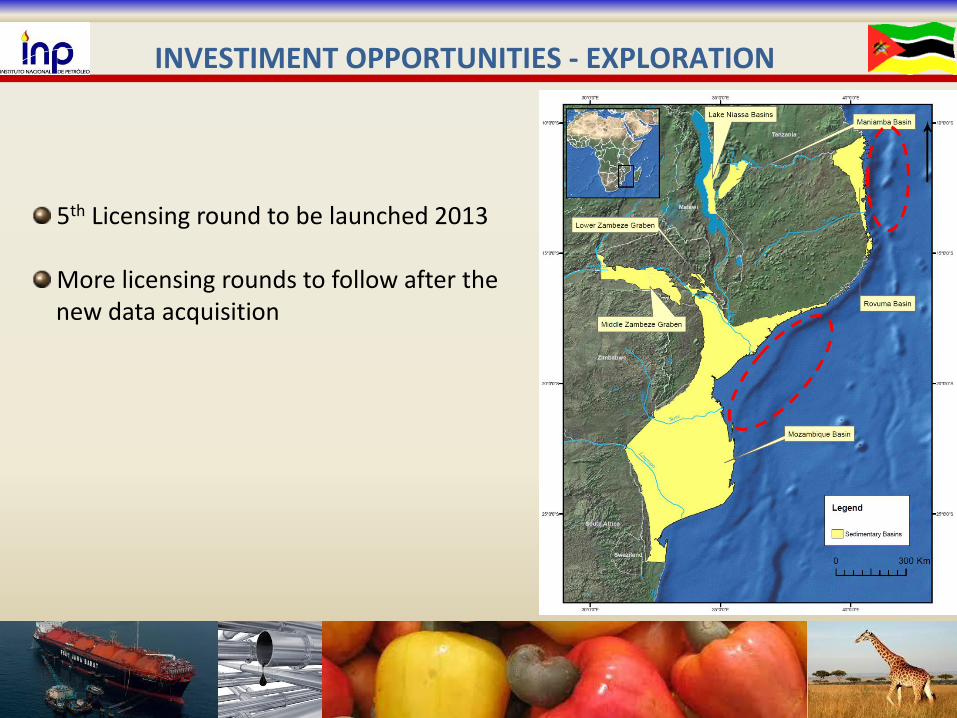
INVESTIMENT OPPORTUNITIES - EXPLORATION
5th Licensing round to be launched 2013
More licensing rounds to follow after the
new data acquisition
NATURAL GAS VENTURE
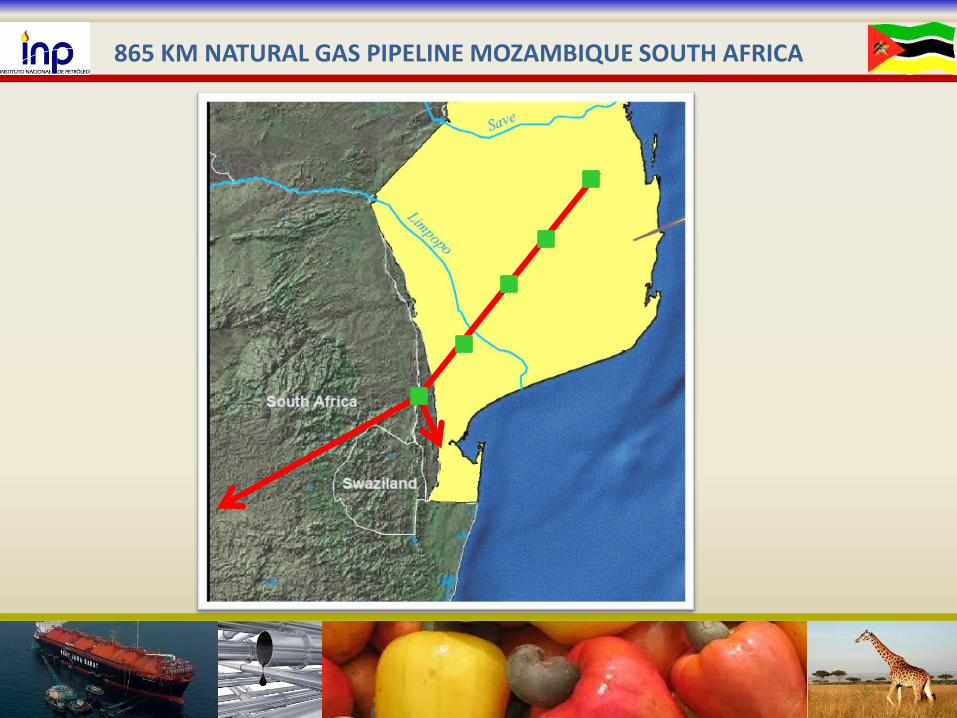
865 KM NATURAL GAS PIPELINE MOZAMBIQUE SOUTH AFRICA
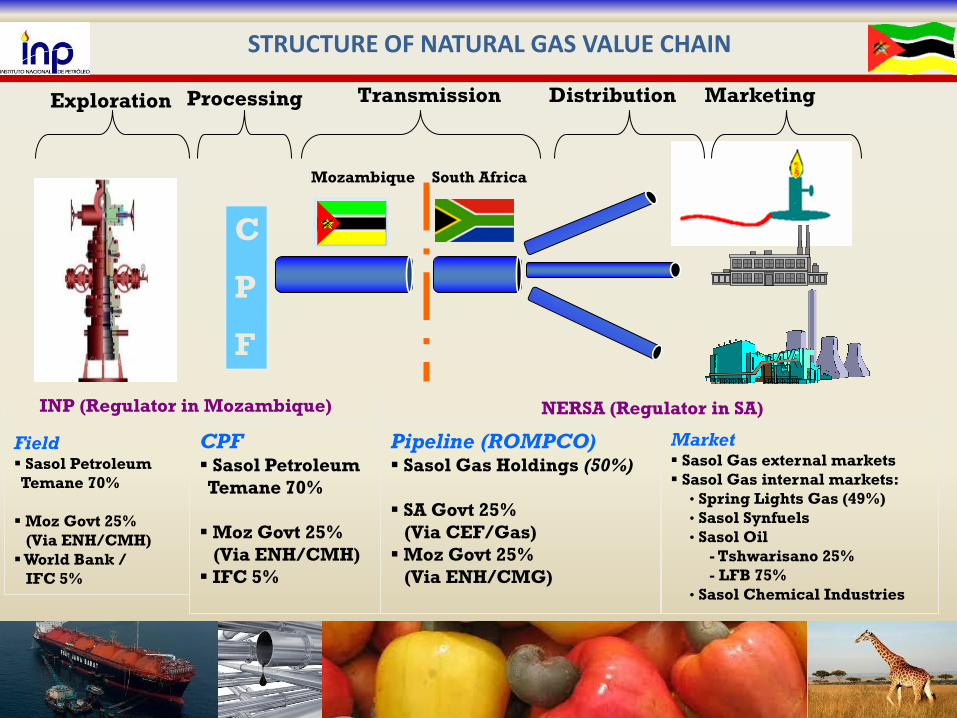
STRUCTURE OF NATURAL GAS VALUE CHAIN
C
P
F
Transmission Distribution
Field Sasol Petroleum
Temane 70%
Moz Govt 25%
(Via ENH/CMH)
World Bank /
IFC 5%
CPF Sasol Petroleum
Temane 70%
Moz Govt 25%
(Via ENH/CMH)
IFC 5%
Pipeline (ROMPCO) Sasol Gas Holdings (50%)
SA Govt 25%
(Via CEF/Gas)
Moz Govt 25%
(Via ENH/CMG)
Exploration Processing Marketing
Market Sasol Gas external markets
Sasol Gas internal markets:
• Spring Lights Gas (49%)
• Sasol Synfuels
• Sasol Oil
- Tshwarisano 25%
- LFB 75%
• Sasol Chemical Industries
Mozambique South Africa
INP (Regulator in Mozambique) NERSA (Regulator in SA)
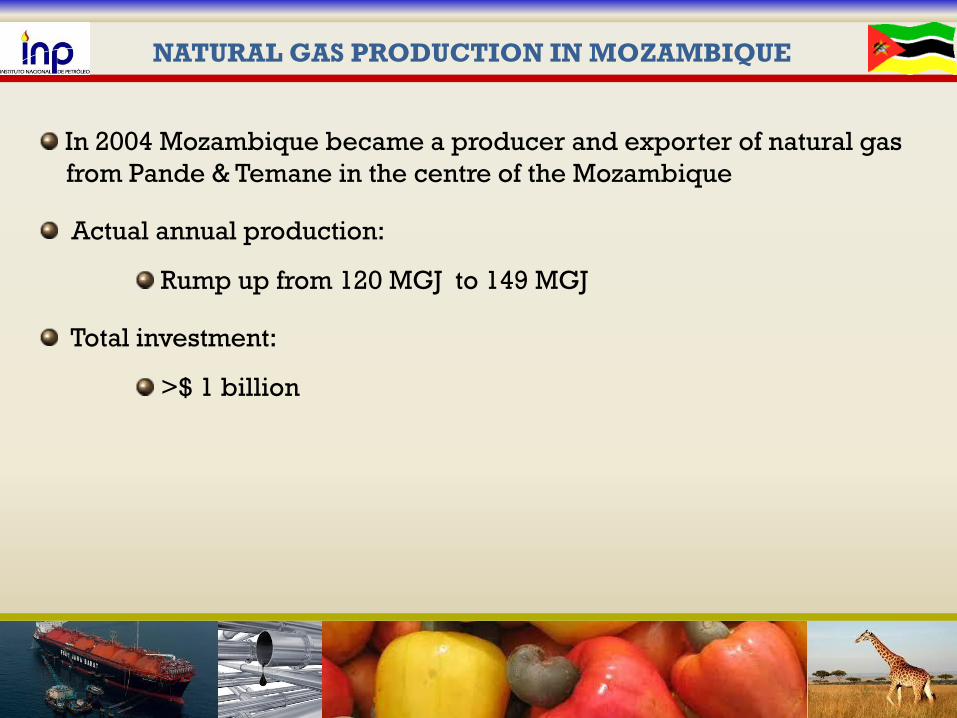
NATURAL GAS PRODUCTION IN MOZAMBIQUE
In 2004 Mozambique became a producer and exporter of natural gas
from Pande & Temane in the centre of the Mozambique
Actual annual production:
Rump up from 120 MGJ to 149 MGJ
Total investment:
>$ 1 billion
UTILIZATION OF NATURAL GAS
LNG PROJECTS
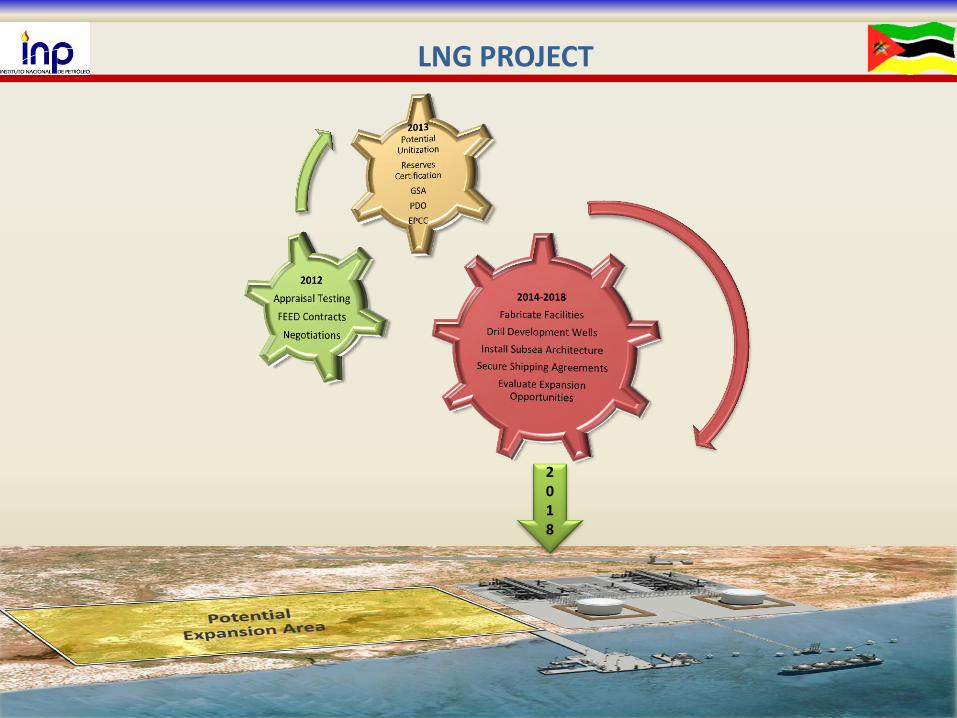
LNG PROJECT
-25- Mayer Brown
2018
INVESTMENT OPPORTUNITIES-LNG
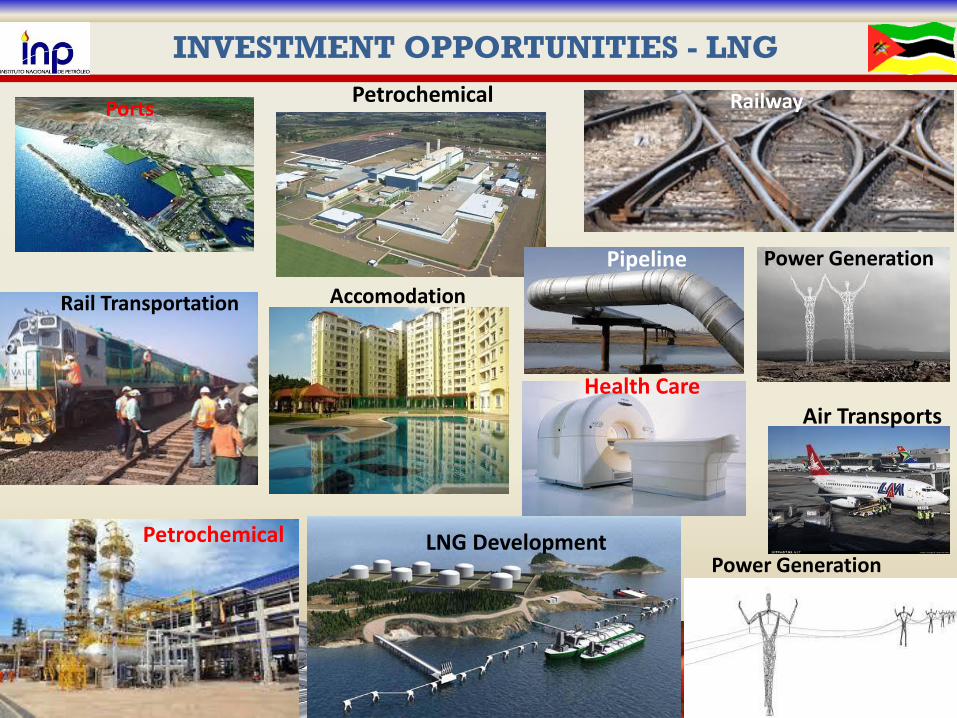
INVESTMENT OPPORTUNITIES - LNG
Petrochemical
Petrochemical
Pipeline
LNG Development
Air Transports
Power Generation
Railway Ports
Rail Transportation
Health Care
Power Generation
Accomodation

GAS MASTER PLAN
Objectives:
An understanding of gas-utilization sector (net-back analysis) to
assess the options for local development in Mozambique
A strategy for the optimal location of gas off-take and development
poles consistent with current development planning
Address optimal pricing structures and mechanisms for the use of gas
revenue streams by Mozambican interests (GoM and others)
A roadmap for promoting social improvements (employment,
education, environmental protection, tourism) consistent with GoM Plans.
CHALLENGES
Construction of natural gas pipelines and LNG facilities
Distribution systems (villages and remote locations)
Local processing of natural gas in different industrial products
Guarantee competitive prices for the natural gas in the local market
Training and employment of local staff in natural gas related industries
Ensure local content in provision of goods and services

FINAL REMARKS
FINAL REMARKS
-33-
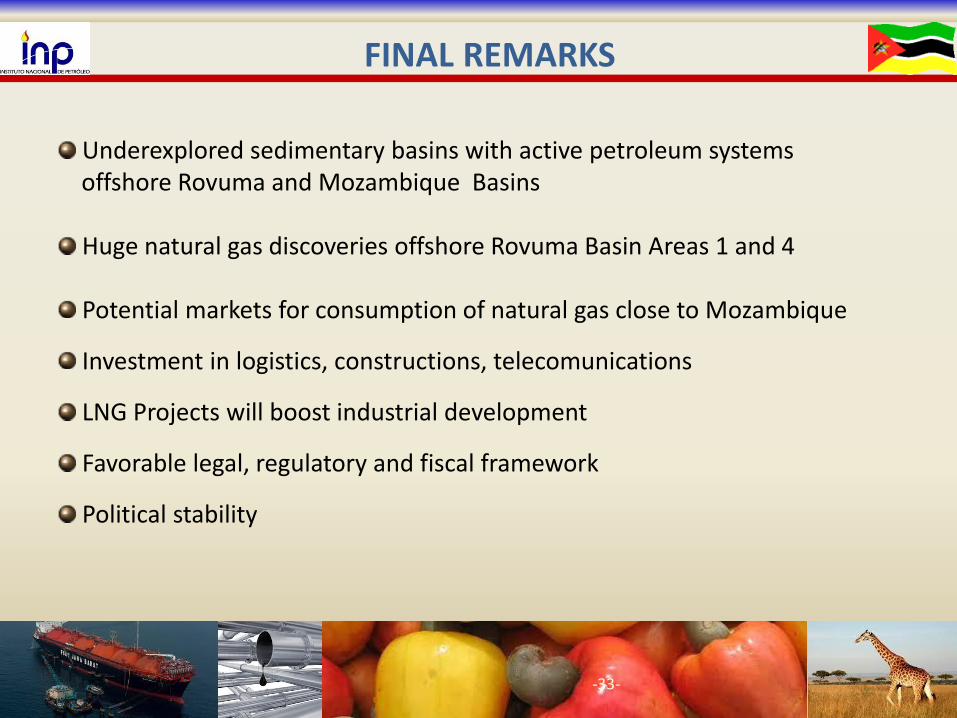
Underexplored sedimentary basins with active petroleum systems
offshore Rovuma and Mozambique Basins Huge natural gas discoveries offshore Rovuma Basin Areas 1 and 4 Potential markets for consumption of natural gas close to Mozambique
Investment in logistics, constructions, telecomunications
LNG Projects will boost industrial development
Favorable legal, regulatory and fiscal framework
Political stability
34
THANK YOU VERY MUCH