Embed Size (px)
Citation preview

Oversampling Selective Accumulation Trapped Ion MobilitySpectrometry Coupled to FT-ICR MS: Fundamentals and ApplicationsPaolo Benigni† and Francisco Fernandez-Lima*,†,‡
†Department of Chemistry and Biochemistry and ‡Biomolecular Sciences Institute, Florida International University, Miami, Florida33199, United States
*S Supporting Information
ABSTRACT: In the present paper, we describe the fundamentals and analyticaladvantages of Oversampling Selective Accumulation Trapped Ion MobilitySpectrometry (OSA-TIMS) when coupled to ultrahigh resolution mass analyzers(e.g., FT-ICR MS). During TIMS analysis, ion packages are spatially resolved basedon their mobilities along the TIMS analyzer axis and multiple strategies can be utilizedduring the trapping and elution of the ion population of interest. In the case of OSA-TIMS-FT-ICR MS, the TIMS operation sequence, trapping conditions, andoperations are optimized to increase the signal-to-noise and the number of pointsacross the mobility domain, which leads to more accurate mobility and massmeasurements. Experimental results show that accurate ion-neutral collision crosssections (<1%) can be measured using OSA-TIMS-FT-ICR MS with high mobilityresolving powers (RIMS up to 250), high mass accuracy (<1 ppm), and ultrahigh massresolution (RMS up to 600−1200k at m/z 400) in a single analysis. The analyticaladvantages of OSA-TIMS over SA-TIMS were illustrated for the analysis of structuralpeptide isomers (SDGRG and GRGDS [M + H]+), conformational isomers (AT-hook peptide 3 KRGRGRPRK [M + 2H]+2),and a complex mixture of polyaromatic hydrocarbons (PAH) from coal tar. Baseline separation of the structural peptide isomersSDGRG and GRGDS, [M + H]+, was observed, and three conformations were identified for the AT-hook peptide 3KRGRGRPRK [M + 2H]+2 during OSA-TIMS-FT-ICR MS. A 2-fold increase in the number of molecular features and a 2−6-fold signal-to-noise increase was observed for OSA-TIMS when compared with SA-TIMS during the PAH analysis. This workprovides the proof-of-principle for further application of OSA-TIMS-FT-ICR MS for the unsupervised analysis of complexmixtures based on the characterization of the conformational space and the assignment of chemical formulas in a single analysis.
Typical operation of ultrahigh resolution mass spectrom-eters involves the storage of ions prior to analysis. In order
to achieve very high sensitivity and resolution during FT-ICRMS measurements, the time-dependent ion signal can bemeasured for a very long time (tens to hundreds of seconds),thus, allowing for precise determination of the ion cyclotronfrequencies.1,2 With the advent of new generation ICR celldesigns,3−19 higher field magnets,20,21 and processing modes(e.g., absorption mode),22−27 the characterization of complexmixtures in a single analysis using FT-ICR MS is increasinglybecoming the method of choice over shorter analysis time. Theloss of coherence (dephasing) of the ion package during FT-ICR MS leads to dampening or decrease of the signal ofinterest, thus, limiting the sensitivity and resolution.28−31 Thisloss is typically associated with ion collisions with backgroundmolecules, inhomogenieties in the magnetic and electric field,and coalescence of the ion signal due to Coulombic interactionsbetween the ions.32−35 The Coulombic interaction can alsoreduce the number of ions that can be effectively trapped andmeasured (space charge effects), thus, limiting the dynamicrange and sensitivity in the analysis of complex mixtures.Previous work has shown alternatives to reduce the spacecharge effects in the ICR cell by changing the duration of theionization event,36 preselection of the ions of interest using a
mass analyzer,37,38 ejection of high abundance species,38−40 orselectively accumulating ions directly in the FT-ICR cell.41 Ionselection has also been performed within the FT-ICR cellutilizing phase selective excitation−de-excitation pulses, termed2D-FT-ICR MS, in order to select and fragment targetmolecules by infrared multiphoton dissociation (IRMPD) orelectron capture dissociation (ECD)42−47 or blackbody infraredradiation dissociation (BIRD).48−51 Alternatively, the use of gasand liquid chromatography, as well as the choice of theionization source, has also shown an increase in sensitivity anddynamic range while typically increasing the total analyst timeto tens of minutes.52−55
In a different approach to effectively reduce the space chargeeffects, scanning and time-dispersive ion mobility spectrometrymethods have been successfully coupled to FT-ICR MS.56−63
In particular, a low pressure drift tube based IMS (DT-IMS)was coupled to FT-ICR MS to study ion−molecule reactionchemistry.62 High-field asymmetric waveform ion mobilityspectrometry (FA-IMS) has also been used with FT-ICR MS
Received: May 18, 2016Accepted: June 24, 2016Published: June 24, 2016
Article
pubs.acs.org/ac
© 2016 American Chemical Society 7404 DOI: 10.1021/acs.analchem.6b01946Anal. Chem. 2016, 88, 7404−7412
resulting in increased sensitivity, lower detection limits, andincreased dynamic range for the analysis of poly(ethyleneglycol),60 proteins,57−59 and glycans56 as a consequence of areduction of the adverse Coulombic effects by mobility-selective injection in the FT-ICR MS. Atmospheric pressuredrift tube based IMS (DT-IMS) was also successfully coupledto FT-ICR MS using a dual gate system for the separation ofisomeric phosphopeptides and measurements of reducedmobility constants.61 In a recent report, we described the useof selective accumulation trapped ion mobility spectrometry(SA-TIMS) coupled to FT-ICR MS for targeted analysis ofcompounds of interest in complex mixtures using accuratereduced mobility (RIMS = 70−120) and mass measurements(<10 ppb) for the case of endocrine disruptors in a complexenvironmental matrix.63 The SA-TIMS operation is based onthe trapping of a mobility range prior to injection into the FT-ICR MS; scanning of the mobility range allows for thegeneration of the 2D-IMS-MS plots of complex mixtures andthe performance of mobility separated FT-ICR MS/MSexperiments.63,64 While SA-TIMS-FT-ICR MS presentedmultiple advantages over previously reported IMS approaches,its analytical application for unsupervised molecular featureidentification was mostly limited to the search for molecularformulas in the MS domain with limited identification in theIMS domain due to the number of points per mobility band(e.g., typically few points across a peak in an IMS band using ahigh mobility resolution scan mode).63,65
In the present work, we describe for the first time the use ofoversampling SA-TIMS (OSA-TIMS) coupled to FT-ICR MS.The OSA-TIMS fundamental mode of operation and theiranalytical application for the detection of molecular features inthe IMS and MS domain are shown, as well as their advantagesover previously described IMS FT-ICR MS methods. We alsodescribe the advantages for the study of structural andconformational biomolecular isomers and the analysis of acomplex mixture using unsupervised molecular featuredetection. In particular, the advantages on mobility resolvingpower, signal-to-noise and number of molecular featuresdetermine from a 2D-IMS-MS plot are illustrated withexperimental data.
■ EXPERIMENTAL SECTIONMaterials and Reagents. A Tuning Mix calibration
standard (G24221A) was obtained from Agilent Technologies(Santa Clara, CA) and used as received. The SDGRG andGRGDS and KRGRGRPRK (AT-Hook peptide 3, ATHP3)peptides were purchased from Sigma-Aldrich (St. Louis, MO)and Advanced ChemTech Inc. (Louisville, KY), respectively.All peptide standards were received as a lyophilized powder andreconstituted in 10 mM ammonium acetate in water to a finalconcentration of 10 μM. A standard reference material ofpolycyclic aromatic hydrocarbons (PAHs) in coal tar (SRM1597a) was purchased from the National Institute of Standardsand Technology (Baltimore, MA) and was diluted 1:100 in50:50 v/v methanol/toluene. All solvents and ammonium saltsutilized in this study were analytical grade or better andpurchased from Fisher Scientific (Pittsburgh, PA).Instrumentation. For this study, an orthogonal custom-
built nano electrospray ionization (nanoESI) source based on apulled glass capillary was placed on the front of a single bore,resistively coated glass capillary allowing aerodynamic focusingand desolvation of ions prior injection into the TIMS analyzer.The coal tar analysis was performed with an atmospheric
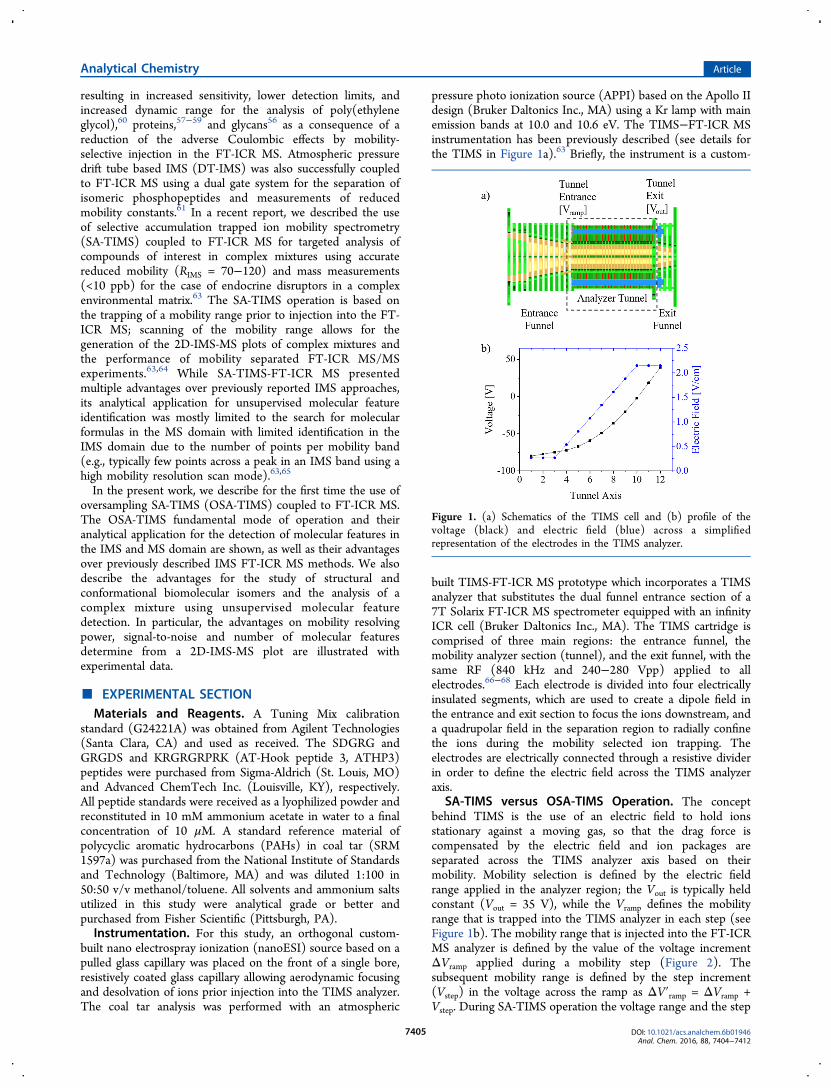
pressure photo ionization source (APPI) based on the Apollo IIdesign (Bruker Daltonics Inc., MA) using a Kr lamp with mainemission bands at 10.0 and 10.6 eV. The TIMS−FT-ICR MSinstrumentation has been previously described (see details forthe TIMS in Figure 1a).63 Briefly, the instrument is a custom-
built TIMS-FT-ICR MS prototype which incorporates a TIMSanalyzer that substitutes the dual funnel entrance section of a7T Solarix FT-ICR MS spectrometer equipped with an infinityICR cell (Bruker Daltonics Inc., MA). The TIMS cartridge iscomprised of three main regions: the entrance funnel, themobility analyzer section (tunnel), and the exit funnel, with thesame RF (840 kHz and 240−280 Vpp) applied to allelectrodes.66−68 Each electrode is divided into four electricallyinsulated segments, which are used to create a dipole field inthe entrance and exit section to focus the ions downstream, anda quadrupolar field in the separation region to radially confinethe ions during the mobility selected ion trapping. Theelectrodes are electrically connected through a resistive dividerin order to define the electric field across the TIMS analyzeraxis.
SA-TIMS versus OSA-TIMS Operation. The conceptbehind TIMS is the use of an electric field to hold ionsstationary against a moving gas, so that the drag force iscompensated by the electric field and ion packages areseparated across the TIMS analyzer axis based on theirmobility. Mobility selection is defined by the electric fieldrange applied in the analyzer region; the Vout is typically heldconstant (Vout = 35 V), while the Vramp defines the mobilityrange that is trapped into the TIMS analyzer in each step (seeFigure 1b). The mobility range that is injected into the FT-ICRMS analyzer is defined by the value of the voltage incrementΔVramp applied during a mobility step (Figure 2). Thesubsequent mobility range is defined by the step increment(Vstep) in the voltage across the ramp as ΔV′ramp = ΔVramp +Vstep. During SA-TIMS operation the voltage range and the step
Figure 1. (a) Schematics of the TIMS cell and (b) profile of thevoltage (black) and electric field (blue) across a simplifiedrepresentation of the electrodes in the TIMS analyzer.
Analytical Chemistry Article
DOI: 10.1021/acs.analchem.6b01946Anal. Chem. 2016, 88, 7404−7412
7405

increment are the same ΔVramp = Vstep. That is, the voltagerange that is scanned by Vramp defines the mobility range, whilethe size of ΔVramp and Vstep determines how that range issampled. Notice that in SA-TIMS the mobility resolution islimited to the voltage range in the ramp (and in the step). Atypical ΔVramp of 0.5−2 V is utilized in SA-TIMS;63 the lowerthe range the higher the mobility resolution and the lower thesensitivity. In an alternative approach, if the Vstep ≪ ΔVramp,each mobility ion package can be sampled multiple times; thismode of operation is called oversampling SA-TIMS (OSA-TIMS). During OSA-TIMS, the number of measured pointscan be significantly increased across a mobility ion packagewhich enables the use of more accurate molecular featureprocessing tools. In addition, the mobility resolution is nolonger limited to the size of the ΔVramp, is time-independent,and is mainly defined by the trapping conditions on the TIMSanalyzer (e.g., bath gas velocity, electric field strength, and RFconfinement).Mobility and Collision Cross Section Calculations. The
mobility of an ion can be calculated using first-principles in aTIMS analyzer.66−70 Each ion eluting after trapping from theTIMS cell can be described by a trapping window E ± ΔE valuethat is directly related to the ion mobility K ± ΔK and thevelocity of the gas vg. Therefore, the mobility of an ion can bedescribed by
= =−
Kv
EA
V Vg
elution out (1)
where A is a calibration constant, Velution is the voltage in theVramp sweep when ions elute, and Vout is the voltage applied tothe tunnel exit. The calibration constant A was determinedfrom previously reported mobility values for Tuning Mixcalibration standard (G24221A, Agilent Technologies, SantaClara, CA) in nitrogen (m/z 322, K0 = 1.376 cm2 V−1 s−1 andm/z 622, K0 = 1.013 cm2 V−1 s−1).68
Reduced mobility values (K0) were correlated with CCS (Ω)using the Mason-Schamp equation:
πΩ = +⎡⎣⎢
⎤⎦⎥
zek T m m K N
(18 )16 ( )
1 1 1 11/2
B1/2
I b
1/2
0 (2)
where z is the charge of the ion, kB is the Boltzmann constant,N is the number density, and mI and mb refer to the masses ofthe ion and bath gas, respectively.71
The mobility resolving power (R) values reported hereinwere determined from Gaussian peak fits of the features in theTIMS distributions using OriginPro (version 8.0) by
= ΔR CCS/ CCS (3)
where CCS and ΔCCS are the IMS peak center and fwhm,respectively.
Experimental Parameters. A custom-built, pulled capillaryorthogonal nano electrospray ionization (nanoESI) source wasutilized for the biomolecular experiments. Quartz glasscapillaries (O.D.: 1.0 mm and I.D.: 0.70 mm) were pulledutilizing a P-2000 micropipette laser puller (Sutter Instruments,Novato, CA) and loaded with a 10 μL aliquot of the samplesolution. A typical nanoESI source voltage of 600−1200 V wasapplied between the pulled capillary tips and the TIMS-FT-ICRMS instrument inlet.An orthogonal, commercial atmospheric pressure photo-
ionization (APPI) source based on the Apollo II design (BrukerDaltonics, Inc., MA) was used. Briefly, sample solutions wereintroduced into the nebulizer at a rate of 300 μL/min using anexternal syringe pump. Typical APPI operating conditions were900 V capillary voltage, −900 V end-cap capillary offset voltage,2 L/min dry gas flow rate, 0.5 bar nebulizer gas pressure, a 220°C dry gas temperature, and a 300 °C vaporizer temperature.Ions from the nanoESI and APPI source are introduced via a0.6 mm inner diameter, single-bore glass capillary tube, which isresistively coated across its length, allowing the nebulizer to bemaintained at ground potential, while the exit end of thecapillary can be independently biased (typical values are 60−180 V).TIMS separation utilized nitrogen as a bath gas at about 300
K with the gas flow velocity controlled by the pressuredifference between the entrance funnel P1 = 2.6−3.0 mbar andthe exit funnel P2 = 1.5−1.6 mbar. TIMS voltage sequenceswere controlled using in-house software written in NationalInstruments Lab VIEW (2012, V. 12.0f3) and synchronizedwith the FT-ICR MS acquisition program. The TIMS cell wasoperated using a fill/trap/elute/quench sequence of 300/50/40/10 ms, collecting a single FT-ICR MS spectrum for eachmobility trapping step. FT-ICR MS operation was optimized
Figure 2. Comparison of the analysis sequence, electric field, and voltage applied in the TIMS analyzer during SA-TIMS (top) and OSA-TIMS(bottom) for the analysis of the same mobility range using 5 elution steps and 20 elution steps. Notice that in SA-TIMS ΔVramp = Vstep and in OSA-TIMS ΔVramp > Vstep.
Analytical Chemistry Article
DOI: 10.1021/acs.analchem.6b01946Anal. Chem. 2016, 88, 7404−7412
7406

for ion transmission in the m/z 300−1500 range and processedusing sin-squared windowing in magnitude mode. For theevaluation of the SA-TIMS versus OSA-TIMS performance, aΔVramp of 0.5, 1, and 5 V was used in the −25 to −180 V range,a Vstep of 0.1, 0.2, 1, and 5 V, and single mobility experimentswere accumulated in the collision cell prior to injection in theFT-ICR MS cell. The total analyst time for the SA-TIMSexperiments was 73, 35, and 12 s for a ΔVramp of 0.5, 1, and 5 Vcompared to 5.2 min for a 400 step with 0.1 V acquisition OSA-TIMS experiments. For the analysis of the coal tar sample,multiple mobility steps (∼30) were accumulated in the collisioncell prior injection in the FT-ICR MS cell and acquired at 8−16Mword (6−12 s transient and RMS= 600−1200 k at m/z =400, using an average of 100 scans) and 512kword (RMS = 35kat m/z = 400, using single scan) for FT-ICR MS and TIMS-FT-ICR MS analysis, respectively.OSA-TIMS-FT-ICR MS Data Processing. For targeted
analysis, the reduced number of peaks of interest permits themanual extraction of the ion mobility spectra for accurate m/zmeasurements (<1 ppm) and further calibration of the OSA-TIMS scan step into mobility based on eq 1 using knownmobility standards (see more details in refs 66−68). Foruntargeted analysis, the mobility calibration procedure is similarbut the list of molecular ions of interest is generated from a
single mass spectrum acquisition during a parallel acquisitionusing ultrahigh resolution FT-ICR MS with multiple averagingand longer transient times (e.g., ∼100 scan averages at 8−16Mword). The FT-ICR MS spectra are externally andinternally calibrated using a Tuning Mix standard (Tunemix,G2421A, Agilent Technologies, Santa Clara, CA) and knownpolyaromatic hydrocarbon series, respectively. The peak listsare generated, allowing for a S/N ratio of 6. The formulascalculations from the exact mass domain are performed usingData Analysis Smart Formula package (Version v. 4.2, BrukerDa l t on i c s , CA) w i t h a max imum fo rmu l a o fC1−100H1−100N0−2O0−2S0−2, odd and even electron configura-tions allowed, and a mass tolerance of less than 1 ppm. Thepeak list is used for extraction of the ion mobility spectra fromthe OSA-TIMS-FT-ICR MS data set using batch processing inthe data analysis package (Version v. 4.2, Bruker Daltonics,CA), followed by mobility calibration. Peak features aredetected using a custom-built software package in Pythonv2.7 and Octave v4.0 from the mobility spectra using“asymmetric least squares smoothing” baseline correction,72
peak detection (“findpeak,” and “peakfit.m” functions73,74 usingGaussian fit functions with a fwhm criteria determined frommobility of known standards with less than 5% error as criteria
Figure 3. Theoretical IMS profiles utilizing a single and a double simulated peak with a fwhm of 1 V using selective accumulation SA (left) andoversampling OSA (right). Notice the number of points across the IMS peaks based on the trapping voltage (Vramp) and the voltage steps (Vstep):SA-TIMS Vramp = Vstep and OSA-TIMS Vramp ≫ Vstep.
Analytical Chemistry Article
DOI: 10.1021/acs.analchem.6b01946Anal. Chem. 2016, 88, 7404−7412
7407
for fit goodness), and a final generation of [m/z; chemicalformula; K; CCS] data sets.
■ RESULTS AND DISCUSSIONThe basis for OSA-TIMS relies on the fact that during TIMSanalysis ion packages are spatially resolved based on theirmobilities in the TIMS analyzer axis. Then, the question ariseson how one can effectively sample an ion package in the TIMSanalyzer axis using discrete elution steps.66−68,75 Since themobility separation in the TIMS cell is time-independent,multiple strategies can be utilized during ion trapping andelution depending on the analytical challenge. An analogy canbe made between OSA-TIMS and mass spectrometry imaging(MSI). For example, in MSI ion packages are injected into theMS analyzer from spatially resolved origins during independentevents and it has been previously shown that oversampling(acquiring signal from adjacent positions spaced by distancessmaller than the sample probe) is routinely used to avoidundersampling and to enhance the spatial imaging resolu-tion.76,77 To further illustrate the OSA-TIMS process,simulations of the OSA-TIMS read-out from a theoreticalpeak centered at 90 and 1 V fwhm was studied as a function ofthe ramp and the step size voltages (Figure 3, left). Closerinspection of Figure 3 shows that ΔVramp influences the widthof the read-out peak and the step size determines the numberof points across the read-out peak. When ΔVramp = Vstep (SA-TIMS), the number of points across the read-out peak can belimited to few points if the width of the peak is on the order ofthe sampling step. For example, if ΔVramp = 5, 1, and 0.5 V theread-out peak has 1−2, 2−4, and 6−8 points for a 1 V fwhmsimulated peak during SA-TIMS, respectively; as the ΔVrampdecreases the width of the read-out peak tends to moreaccurately reflect the original distribution. When Vstep ≪ΔVramp (OSA-TIMS), the number of points across the peakincreases, which permits better sampling of the original peakdistribution. Theoretical simulations for the case of two peakscentered around 90 and 92 V (1 V fwhm) further illustrate theOSA-TIMS read out (Figure 3, right). This case, which isequivalent to two structural/conformational isomers, showsthat the two signals can only be resolved when ΔVramp = 0.5 V
during SA-TIMS analysis or with ΔVramp = 1−3 V with OSA-TIMS, while their separation further increases as ΔVrampdecreases (ΔVramp = 0.5 V).The OSA-TIMS concept was studied experimentally for the
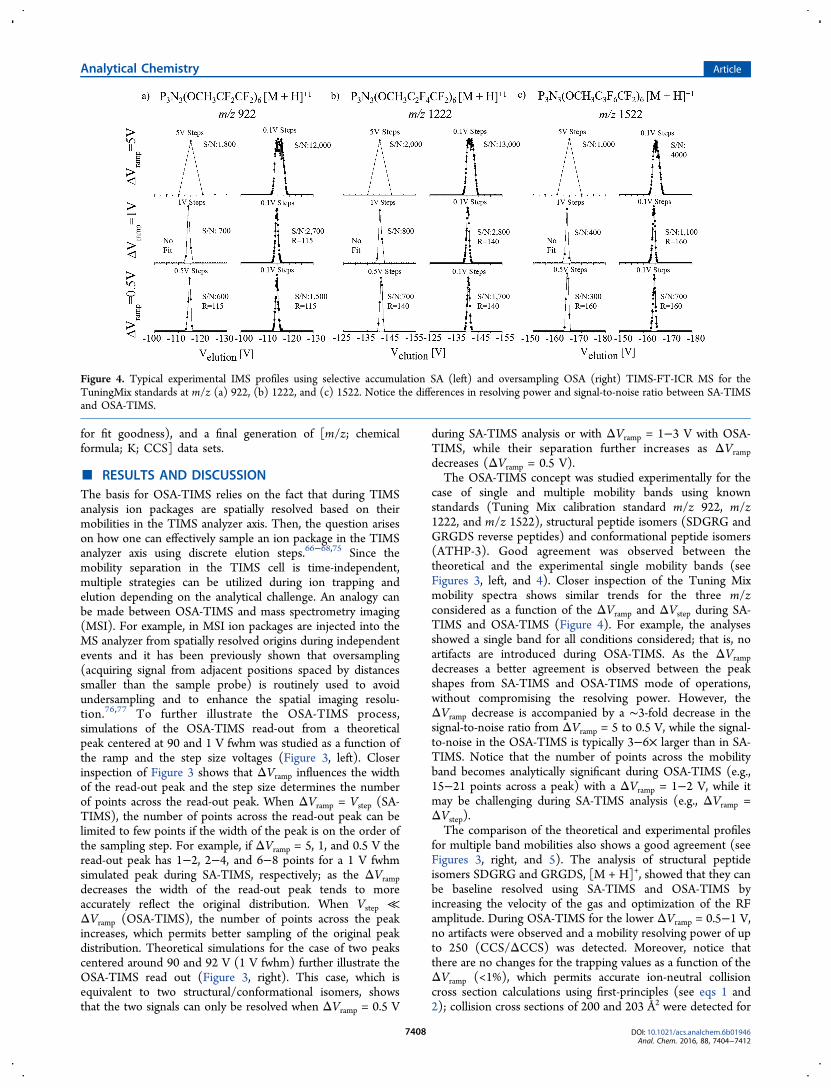
case of single and multiple mobility bands using knownstandards (Tuning Mix calibration standard m/z 922, m/z1222, and m/z 1522), structural peptide isomers (SDGRG andGRGDS reverse peptides) and conformational peptide isomers(ATHP-3). Good agreement was observed between thetheoretical and the experimental single mobility bands (seeFigures 3, left, and 4). Closer inspection of the Tuning Mixmobility spectra shows similar trends for the three m/zconsidered as a function of the ΔVramp and ΔVstep during SA-TIMS and OSA-TIMS (Figure 4). For example, the analysesshowed a single band for all conditions considered; that is, noartifacts are introduced during OSA-TIMS. As the ΔVrampdecreases a better agreement is observed between the peakshapes from SA-TIMS and OSA-TIMS mode of operations,without compromising the resolving power. However, theΔVramp decrease is accompanied by a ∼3-fold decrease in thesignal-to-noise ratio from ΔVramp = 5 to 0.5 V, while the signal-to-noise in the OSA-TIMS is typically 3−6× larger than in SA-TIMS. Notice that the number of points across the mobilityband becomes analytically significant during OSA-TIMS (e.g.,15−21 points across a peak) with a ΔVramp = 1−2 V, while itmay be challenging during SA-TIMS analysis (e.g., ΔVramp =ΔVstep).The comparison of the theoretical and experimental profiles
for multiple band mobilities also shows a good agreement (seeFigures 3, right, and 5). The analysis of structural peptideisomers SDGRG and GRGDS, [M + H]+, showed that they canbe baseline resolved using SA-TIMS and OSA-TIMS byincreasing the velocity of the gas and optimization of the RFamplitude. During OSA-TIMS for the lower ΔVramp = 0.5−1 V,no artifacts were observed and a mobility resolving power of upto 250 (CCS/ΔCCS) was detected. Moreover, notice thatthere are no changes for the trapping values as a function of theΔVramp (<1%), which permits accurate ion-neutral collisioncross section calculations using first-principles (see eqs 1 and2); collision cross sections of 200 and 203 Å2 were detected for
Figure 4. Typical experimental IMS profiles using selective accumulation SA (left) and oversampling OSA (right) TIMS-FT-ICR MS for theTuningMix standards at m/z (a) 922, (b) 1222, and (c) 1522. Notice the differences in resolving power and signal-to-noise ratio between SA-TIMSand OSA-TIMS.
Analytical Chemistry Article
DOI: 10.1021/acs.analchem.6b01946Anal. Chem. 2016, 88, 7404−7412
7408
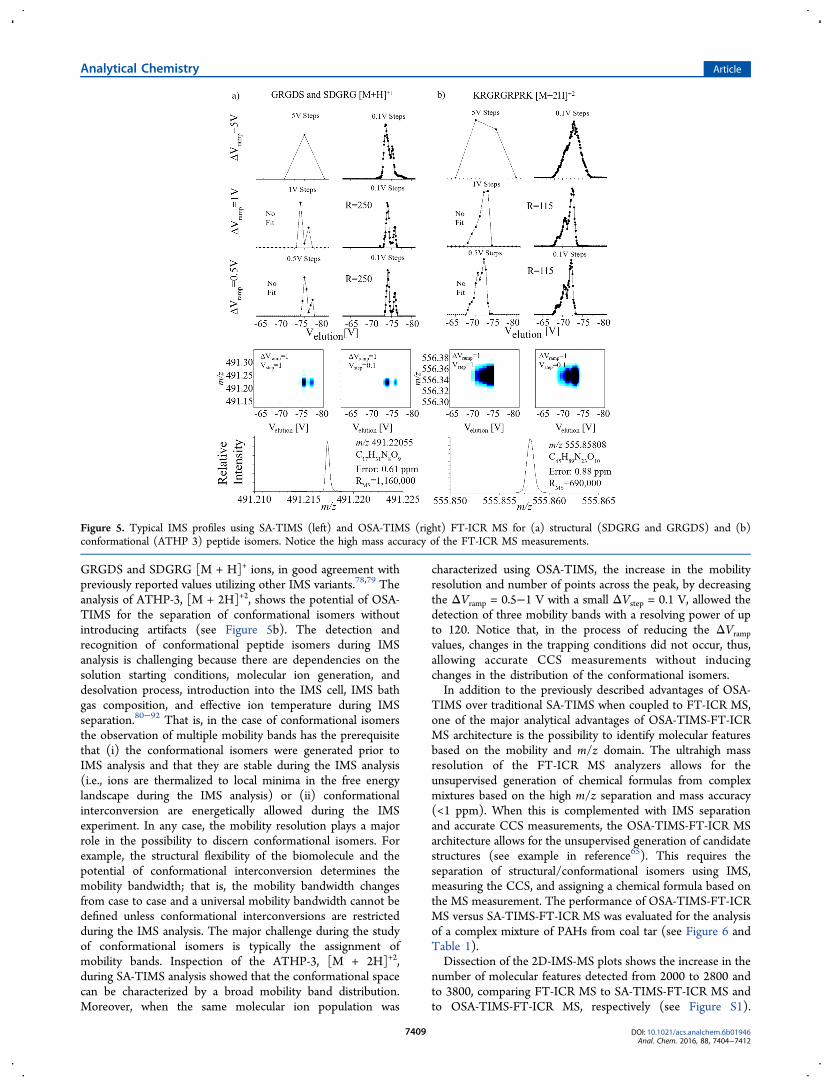
GRGDS and SDGRG [M + H]+ ions, in good agreement withpreviously reported values utilizing other IMS variants.78,79 Theanalysis of ATHP-3, [M + 2H]+2, shows the potential of OSA-TIMS for the separation of conformational isomers withoutintroducing artifacts (see Figure 5b). The detection andrecognition of conformational peptide isomers during IMSanalysis is challenging because there are dependencies on thesolution starting conditions, molecular ion generation, anddesolvation process, introduction into the IMS cell, IMS bathgas composition, and effective ion temperature during IMSseparation.80−92 That is, in the case of conformational isomersthe observation of multiple mobility bands has the prerequisitethat (i) the conformational isomers were generated prior toIMS analysis and that they are stable during the IMS analysis(i.e., ions are thermalized to local minima in the free energylandscape during the IMS analysis) or (ii) conformationalinterconversion are energetically allowed during the IMSexperiment. In any case, the mobility resolution plays a majorrole in the possibility to discern conformational isomers. Forexample, the structural flexibility of the biomolecule and thepotential of conformational interconversion determines themobility bandwidth; that is, the mobility bandwidth changesfrom case to case and a universal mobility bandwidth cannot bedefined unless conformational interconversions are restrictedduring the IMS analysis. The major challenge during the studyof conformational isomers is typically the assignment ofmobility bands. Inspection of the ATHP-3, [M + 2H]+2,during SA-TIMS analysis showed that the conformational spacecan be characterized by a broad mobility band distribution.Moreover, when the same molecular ion population was
characterized using OSA-TIMS, the increase in the mobilityresolution and number of points across the peak, by decreasingthe ΔVramp = 0.5−1 V with a small ΔVstep = 0.1 V, allowed thedetection of three mobility bands with a resolving power of upto 120. Notice that, in the process of reducing the ΔVramp
values, changes in the trapping conditions did not occur, thus,allowing accurate CCS measurements without inducingchanges in the distribution of the conformational isomers.In addition to the previously described advantages of OSA-
TIMS over traditional SA-TIMS when coupled to FT-ICR MS,one of the major analytical advantages of OSA-TIMS-FT-ICRMS architecture is the possibility to identify molecular featuresbased on the mobility and m/z domain. The ultrahigh massresolution of the FT-ICR MS analyzers allows for theunsupervised generation of chemical formulas from complexmixtures based on the high m/z separation and mass accuracy(<1 ppm). When this is complemented with IMS separationand accurate CCS measurements, the OSA-TIMS-FT-ICR MSarchitecture allows for the unsupervised generation of candidatestructures (see example in reference65). This requires theseparation of structural/conformational isomers using IMS,measuring the CCS, and assigning a chemical formula based onthe MS measurement. The performance of OSA-TIMS-FT-ICRMS versus SA-TIMS-FT-ICR MS was evaluated for the analysisof a complex mixture of PAHs from coal tar (see Figure 6 andTable 1).Dissection of the 2D-IMS-MS plots shows the increase in the
number of molecular features detected from 2000 to 2800 andto 3800, comparing FT-ICR MS to SA-TIMS-FT-ICR MS andto OSA-TIMS-FT-ICR MS, respectively (see Figure S1).
Figure 5. Typical IMS profiles using SA-TIMS (left) and OSA-TIMS (right) FT-ICR MS for (a) structural (SDGRG and GRGDS) and (b)conformational (ATHP 3) peptide isomers. Notice the high mass accuracy of the FT-ICR MS measurements.
Analytical Chemistry Article
DOI: 10.1021/acs.analchem.6b01946Anal. Chem. 2016, 88, 7404−7412
7409
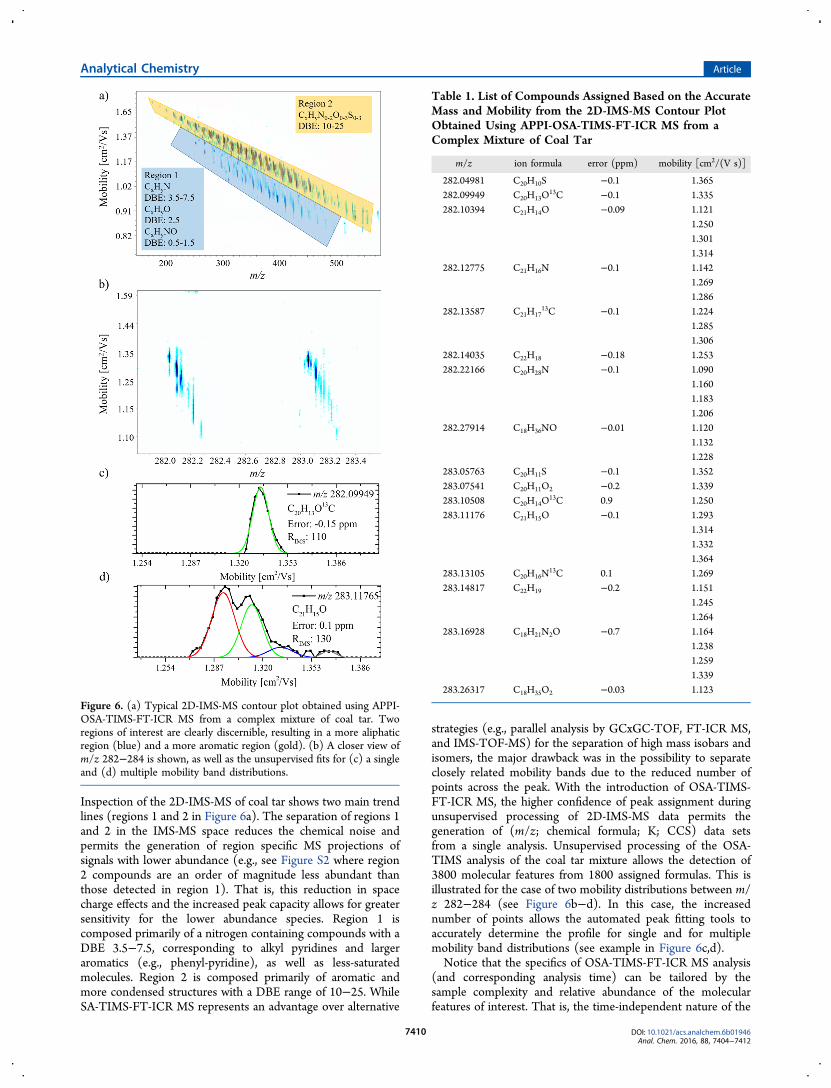
Inspection of the 2D-IMS-MS of coal tar shows two main trendlines (regions 1 and 2 in Figure 6a). The separation of regions 1and 2 in the IMS-MS space reduces the chemical noise andpermits the generation of region specific MS projections ofsignals with lower abundance (e.g., see Figure S2 where region2 compounds are an order of magnitude less abundant thanthose detected in region 1). That is, this reduction in spacecharge effects and the increased peak capacity allows for greatersensitivity for the lower abundance species. Region 1 iscomposed primarily of a nitrogen containing compounds with aDBE 3.5−7.5, corresponding to alkyl pyridines and largeraromatics (e.g., phenyl-pyridine), as well as less-saturatedmolecules. Region 2 is composed primarily of aromatic andmore condensed structures with a DBE range of 10−25. WhileSA-TIMS-FT-ICR MS represents an advantage over alternative
strategies (e.g., parallel analysis by GCxGC-TOF, FT-ICR MS,and IMS-TOF-MS) for the separation of high mass isobars andisomers, the major drawback was in the possibility to separateclosely related mobility bands due to the reduced number ofpoints across the peak. With the introduction of OSA-TIMS-FT-ICR MS, the higher confidence of peak assignment duringunsupervised processing of 2D-IMS-MS data permits thegeneration of (m/z; chemical formula; K; CCS) data setsfrom a single analysis. Unsupervised processing of the OSA-TIMS analysis of the coal tar mixture allows the detection of3800 molecular features from 1800 assigned formulas. This isillustrated for the case of two mobility distributions between m/z 282−284 (see Figure 6b−d). In this case, the increasednumber of points allows the automated peak fitting tools toaccurately determine the profile for single and for multiplemobility band distributions (see example in Figure 6c,d).Notice that the specifics of OSA-TIMS-FT-ICR MS analysis
(and corresponding analysis time) can be tailored by thesample complexity and relative abundance of the molecularfeatures of interest. That is, the time-independent nature of the
Figure 6. (a) Typical 2D-IMS-MS contour plot obtained using APPI-OSA-TIMS-FT-ICR MS from a complex mixture of coal tar. Tworegions of interest are clearly discernible, resulting in a more aliphaticregion (blue) and a more aromatic region (gold). (b) A closer view ofm/z 282−284 is shown, as well as the unsupervised fits for (c) a singleand (d) multiple mobility band distributions.
Table 1. List of Compounds Assigned Based on the AccurateMass and Mobility from the 2D-IMS-MS Contour PlotObtained Using APPI-OSA-TIMS-FT-ICR MS from aComplex Mixture of Coal Tar
m/z ion formula error (ppm) mobility [cm2/(V s)]
282.04981 C20H10S −0.1 1.365282.09949 C20H13O
13C −0.1 1.335282.10394 C21H14O −0.09 1.121
1.2501.3011.314
282.12775 C21H16N −0.1 1.1421.2691.286
282.13587 C21H1713C −0.1 1.224
1.2851.306
282.14035 C22H18 −0.18 1.253282.22166 C20H28N −0.1 1.090
1.1601.1831.206
282.27914 C18H36NO −0.01 1.1201.1321.228
283.05763 C20H11S −0.1 1.352283.07541 C20H11O2 −0.2 1.339283.10508 C20H14O
13C 0.9 1.250283.11176 C21H15O −0.1 1.293
1.3141.3321.364
283.13105 C20H16N13C 0.1 1.269
283.14817 C22H19 −0.2 1.1511.2451.264
283.16928 C18H21N2O −0.7 1.1641.2381.2591.339
283.26317 C18H35O2 −0.03 1.123
Analytical Chemistry Article
DOI: 10.1021/acs.analchem.6b01946Anal. Chem. 2016, 88, 7404−7412
7410

OSA-TIMS separation allows for the selective analysis of themobility space of interest with varying degrees of mobilityresolution and number of points across the peak; the higher theresolution and number of peaks, the longer the analysis time. Inthe case of the analysis of the coal tar by OSA-TIMS-FT-ICRMS, the analysis was completed in 85 min. In addition, asshown in the case of the PAH analysis, the number of OSA-TIMS steps that are accumulated and injected into the ICR cellcan be tailored, which allows for better optimization of the ICRparameters, leading to higher mass resolution and better massaccuracy.
■ CONCLUSIONSDuring TIMS analysis, ion packages are spatially resolved basedon their mobilities along the TIMS analyzer axis and multiplestrategies can be utilized to optimized the analyticalapplicability. In the present paper, we described thefundamentals and applicability of OSA-TIMS when coupledto ultrahigh resolution mass analyzers (e.g., FT-ICR MS). Inparticular, the analytical advantages during the analysis ofstructural/conformational isomers as well as for the un-supervised analysis of complex mixtures utilizing the mobilityand m/z domain were illustrated. Results showed that accurateion-neutral collision cross sections (<1%) can be measuredusing OSA-TIMS-FT-ICR MS with high mobility resolvingpowers (RIMS up to 250), high mass accuracy (<1 ppm), andultrahigh mass resolution (RMS up to 600−1200k at m/z 400)in a single analysis. A 2-fold increase in the number ofmolecular features and a 2−6-fold signal-to-noise increase wereobserved for OSA-TIMS when compared with SA-TIMS. Thiswork provides the proof-of-principle for further application ofOSA-TIMS-FT-ICR MS for the unsupervised analysis ofcomplex mixtures based on the characterization of theconformational space and the assignment of chemical formulasin a single analysis.
■ ASSOCIATED CONTENT*S Supporting InformationThe Supporting Information is available free of charge on theACS Publications website at DOI: 10.1021/acs.anal-chem.6b01946.
Additional information as noted in the text (Figures S-1and S-2; PDF).
■ AUTHOR INFORMATIONCorresponding Author*Ph.: 305-348-2037. Fax: 305-348-3772. E-mail: [email protected] authors declare no competing financial interest.
■ ACKNOWLEDGMENTSThis work was supported by National Institute of Health(Grant No. R00GM106414 to F.F.-L.). The authors would liketo acknowledge the helpful discussion with Dr. Tom C.O’Haver (UMD) and Mr. Steven Silvester (Oct2PY) duringthe development of the 2D-IMS-MS processing tools. Theauthors will also like to acknowledge the helpful discussionsand technical support from Dr. Mark E. Ridgeway, Dr.Christopher J. Thompson, and Dr. Melvin A. Park from BrukerDaltonics Inc. during the development and installation of thecustom-built TIMS-FT-ICR MS instrument.
■ REFERENCES(1) Xian, F.; Hendrickson, C. L.; Marshall, A. G. Anal. Chem. 2012,84, 708−719.(2) Nikolaev, E. N.; Kostyukevich, Y. I.; Vladimirov, G. N. MassSpectrom. Rev. 2016, 35, 219−258.(3) Leach, F. E., III; Norheim, R.; Anderson, G.; Pasa-Tolic, L. J. Am.Soc. Mass Spectrom. 2014, 25, 2069−2072.(4) Boldin, I. A.; Nikolaev, E. N. Rapid Commun. Mass Spectrom.2011, 25, 122−126.(5) Frankevich, V.; Zenobi, R. Int. J. Mass Spectrom. 2001, 207, 57−67.(6) Weisbrod, C. R.; Kaiser, N. K.; Skulason, G. E.; Bruce, J. E. Anal.Chem. 2010, 82, 6281−6286.(7) Weisbrod, C. R.; Kaiser, N. K.; Skulason, G. E.; Bruce, J. E. Anal.Chem. 2008, 80, 6545−6553.(8) Brustkern, A. M.; Rempel, D. L.; Gross, M. L. J. Am. Soc. MassSpectrom. 2008, 19, 1281−1285.(9) Brustkern, A. M.; Rempel, D. L.; Gross, M. L. J. Am. Soc. MassSpectrom. 2010, 21, 451−454.(10) Nikolaev, E. N.; Boldin, I. A.; Jertz, R.; Baykut, G. J. Am. Soc.Mass Spectrom. 2011, 22, 1125−1133.(11) Kostyukevich, Y. I.; Vladimirov, G. N.; Nikolaev, E. N. J. Am.Soc. Mass Spectrom. 2012, 23, 2198−2207.(12) Kaiser, N. K.; Savory, J. J.; McKenna, A. M.; Quinn, J. P.;Hendrickson, C. L.; Marshall, A. G. Anal. Chem. 2011, 83, 6907−6910.(13) Tolmachev, A. V.; Robinson, E. W.; Wu, S.; Smith, R. D.; Pasa-Toli, L. J. Am. Soc. Mass Spectrom. 2011, 22, 1334−1342.(14) Tolmachev, A. V.; Robinson, E. W.; Wu, S.; Pasa-Tolic, L.;Smith, R. D. Int. J. Mass Spectrom. 2009, 287, 32−38.(15) Tolmachev, A. V.; Robinson, E. W.; Smith, R. D.; Leach, F. E.;Futrell, J. H.; Pasa-Tolic, L. Int. J. Mass Spectrom. 2012, 325, 45−50.(16) Nagornov, K. O.; Kozhinov, A. N.; Tsybin, O. Y.; Tsybin, Y. O.J. Am. Soc. Mass Spectrom. 2015, 26, 741−751.(17) Tolmachev, A. V.; Robinson, E. W.; Wu, S.; Kang, H.; Lourette,N. M.; Pasa-Tolic, L.; Smith, R. D. J. Am. Soc. Mass Spectrom. 2008, 19,586−597.(18) Tolmachev, A. V.; Robinson, E. W.; Wu, S.; Smith, R. D.;Futrell, J. H.; Pasa-Tolic, L. J. Am. Soc. Mass Spectrom. 2012, 23, 1169−1172.(19) Popov, I. A.; Nagornov, K.; Vladimirov, G. N.; Kostyukevich, Y.I.; Nikolaev, E. N. J. Am. Soc. Mass Spectrom. 2014, 25, 790−799.(20) Marshall, A. G.; Guan, S. Rapid Commun. Mass Spectrom. 1996,10, 1819−1823.(21) Hendrickson, C. L.; Quinn, J. P.; Kaiser, N. K.; Smith, D. F.;Blakney, G. T.; Chen, T.; Marshall, A. G.; Weisbrod, C. R.; Beu, S. C.J. Am. Soc. Mass Spectrom. 2015, 26, 1626−1632.(22) Cho, Y.; Qi, Y.; O’Connor, P. B.; Barrow, M. P.; Kim, S. J. Am.Soc. Mass Spectrom. 2014, 25, 154−157.(23) Qi, Y.; Li, H.; Wills, R. H.; Perez-Hurtado, P.; Yu, X.; Kilgour,D. P.; Barrow, M. P.; Lin, C.; O’Connor, P. B. J. Am. Soc. MassSpectrom. 2013, 24, 828−834.(24) Qi, Y.; Witt, M.; Jertz, R.; Baykut, G.; Barrow, M. P.; Nikolaev,E. N.; O’Connor, P. B. Rapid Commun. Mass Spectrom. 2012, 26,2021−2026.(25) Qi, Y.; Barrow, M. P.; Li, H.; Meier, J. E.; Van Orden, S. L.;Thompson, C. J.; O’Connor, P. B. Anal. Chem. 2012, 84, 2923−2929.(26) Kilgour, D. P.; Nagornov, K. O.; Kozhinov, A. N.; Zhurov, K.O.; Tsybin, Y. O. Rapid Commun. Mass Spectrom. 2015, 29, 1087−1093.(27) Kilgour, D. P.; Wills, R.; Qi, Y.; O’Connor, P. B. Anal. Chem.2013, 85, 3903−3911.(28) Nakata, M. T.; Hart, G. W.; Peterson, B. G. J. Am. Soc. MassSpectrom. 2010, 21, 1712−1719.(29) Mitchell, D. W.; Smith, R. D. Phys. Rev. E: Stat. Phys., Plasmas,Fluids, Relat. Interdiscip. Top. 1995, 52, 4366−4386.(30) Boldin, I. A.; Nikolaev, E. N. Rapid Commun. Mass Spectrom.2009, 23, 3213−3219.(31) Nikolaev, E. N. Int. J. Mass Spectrom. 2015, 377, 421−431.
Analytical Chemistry Article
DOI: 10.1021/acs.analchem.6b01946Anal. Chem. 2016, 88, 7404−7412
7411

(32) Comisarow, M. B.; Marshall, A. G. J. Chem. Phys. 1976, 64,110−119.(33) Guan, S.; Li, G.-Z.; Marshall, A. G. Int. J. Mass Spectrom. IonProcesses 1997, 167, 185−193.(34) Mitchell, D. W. J. Am. Soc. Mass Spectrom. 1999, 10, 136−152.(35) Nikolaev, E. N.; Heeren, R. M.; Popov, A. M.; Pozdneev, A. V.;Chingin, K. S. Rapid Commun. Mass Spectrom. 2007, 21, 3527−3546.(36) Stafford, G. C., Jr; Taylor, D. M.; Bradshaw, S. C. US5107109 A,1992.(37) Senko, M. W.; Hendrickson, C. L.; Emmett, M. R.; Shi, S. D.-H.;Marshall, A. G. J. Am. Soc. Mass Spectrom. 1997, 8, 970−976.(38) Belov, M. E.; Anderson, G. A.; Angell, N. H.; Shen, Y.; Tolic, N.;Udseth, H. R.; Smith, R. D. Anal. Chem. 2001, 73, 5052−5060.(39) Pasa-Tolic, L.; Harkewicz, R.; Anderson, G. A.; Tolic, N.; Shen,Y.; Zhao, R.; Thrall, B.; Masselon, C.; Smith, R. D. J. Am. Soc. MassSpectrom. 2002, 13, 954−963.(40) Harkewicz, R.; Belov, M. E.; Anderson, G. A.; Pasa-Tolic, L.;Masselon, C. D.; Prior, D. C.; Udseth, H. R.; Smith, R. D. J. Am. Soc.Mass Spectrom. 2002, 13, 144−154.(41) Bruce, J. E.; Anderson, G. A.; Hofstadler, S. A.; Van Orden, S.L.; Sherman, M. S.; Rockwood, A. L.; Smith, R. D. Rapid Commun.Mass Spectrom. 1993, 7, 914−919.(42) van Agthoven, M. A.; Barrow, M. P.; Chiron, L.; Coutouly, M.A.; Kilgour, D.; Wootton, C. A.; Wei, J.; Soulby, A.; Delsuc, M. A.;Rolando, C.; O’Connor, P. B. J. Am. Soc. Mass Spectrom. 2015, 26,2105−2114.(43) van Agthoven, M. A.; Chiron, L.; Coutouly, M. A.; Delsuc, M.A.; Rolando, C. Anal. Chem. 2012, 84, 5589−5595.(44) van Agthoven, M. A.; Chiron, L.; Coutouly, M.-A.; Sehgal, A. A.;Pelupessy, P.; Delsuc, M.-A.; Rolando, C. Int. J. Mass Spectrom. 2014,370, 114−124.(45) van Agthoven, M. A.; Delsuc, M. A.; Bodenhausen, G.; Rolando,C. Anal. Bioanal. Chem. 2013, 405, 51−61.(46) van Agthoven, M. A.; Delsuc, M.-A.; Rolando, C. Int. J. MassSpectrom. 2011, 306, 196−203.(47) van Agthoven, M. A.; Wootton, C. A.; Chiron, L.; Coutouly, M.A.; Soulby, A.; Wei, J.; Barrow, M. P.; Delsuc, M. A.; Rolando, C.;O’Connor, P. B. Anal. Chem. 2016, 88, 4409−4417.(48) Dunbar, R. C. Mass Spectrom. Rev. 2004, 23, 127−158.(49) Laskin, J. Principles of Mass Spectrometry Applied to Biomolecules;John Wiley & Sons, Inc.: Hoboken, NJ, U.S.A., 2006; pp 619−665.(50) Klassen, J. S.; Schnier, P. D.; Williams, E. R. J. Am. Soc. MassSpectrom. 1998, 9, 1117−1124.(51) Felitsyn, N.; Kitova, E. N.; Klassen, J. S. Anal. Chem. 2001, 73,4647−4661.(52) Barrow, M. P.; Peru, K. M.; Headley, J. V. Anal. Chem. 2014, 86,8281−8288.(53) Lababidi, S.; Panda, S. K.; Andersson, J. T.; Schrader, W. Anal.Chem. 2013, 85, 9478−9485.(54) Lababidi, S.; Schrader, W. Rapid Commun. Mass Spectrom. 2014,28, 1345−1352.(55) Benigni, P.; DeBord, J. D.; Thompson, C. J.; Gardinali, P.;Fernandez-Lima, F. Energy Fuels 2016, 30, 196−203.(56) Kailemia, M. J.; Park, M.; Kaplan, D. A.; Venot, A.; Boons, G. J.;Li, L.; Linhardt, R. J.; Amster, I. J. J. Am. Soc. Mass Spectrom. 2014, 25,258−268.(57) Robinson, E. W.; Leib, R. D.; Williams, E. R. J. Am. Soc. MassSpectrom. 2006, 17, 1469−1479.(58) Robinson, E. W.; Sellon, R. E.; Williams, E. R. Int. J. MassSpectrom. 2007, 259, 87−95.(59) Robinson, E. W.; Williams, E. R. J. Am. Soc. Mass Spectrom.2005, 16, 1427−1437.(60) Robinson, E. W.; Garcia, D. E.; Leib, R. D.; Williams, E. R. Anal.Chem. 2006, 78, 2190−2198.(61) Tang, X.; Bruce, J. E.; Hill, H. H., Jr. Rapid Commun. MassSpectrom. 2007, 21, 1115−1122.(62) Bluhm, B. K.; Gillig, K. J.; Russell, D. H. Rev. Sci. Instrum. 2000,71, 4078−4086.
(63) Benigni, P.; Thompson, C. J.; Ridgeway, M. E.; Park, M. A.;Fernandez-Lima, F. Anal. Chem. 2015, 87, 4321−4325.(64) Pu, Y.; Ridgeway, M. E.; Glaskin, R. S.; Park, M. A.; Costello, C.E.; Lin, C. Anal. Chem. 2016, 88, 3440−3443.(65) Benigni, P.; Marin, R.; Fernandez-Lima, F. Int. J. Ion MobilitySpectrom. 2015, 18, 151−157.(66) Fernandez-Lima, F. A.; Kaplan, D. A.; Park, M. A. Rev. Sci.Instrum. 2011, 82, 126106.(67) Fernandez-Lima, F.; Kaplan, D. A.; Suetering, J.; Park, M. A. Int.J. Ion Mobility Spectrom. 2011, 14, 93−98.(68) Hernandez, D. R.; Debord, J. D.; Ridgeway, M. E.; Kaplan, D.A.; Park, M. A.; Fernandez-Lima, F. Analyst 2014, 139, 1913−1921.(69) Benigni, P.; Marin, R.; Molano-Arevalo, J. C.; Garabedian, A.;Wolff, J. J.; Ridgeway, M. E.; Park, M. A.; Fernandez-Lima, F. Int. J. IonMobility Spectrom. 2016, 1−10.(70) Adams, K. J.; Montero, D.; Aga, D.; Fernandez-Lima, F. Int. J.Ion Mobility Spectrom. 2016, 1−8.(71) McDaniel, E. W.; Mason, E. A. Mobility and Diffusion of Ions inGases; John Wiley and Sons, Inc., New York, 1973; p 381.(72) Eilers, P. H.; Boelens, H. F. Leiden University Medical CentreReport, 2005.(73) O’Haver, T. A Pragmatic Introduction to Signal Processing, 2nded.; Self published, Printed by CreateSpace Independent PublishingPlatform, 2016.(74) Thomas C, O. H. Interactive Peak Fitter, https://terpconnect.umd.edu/~toh/spectrum/InteractivePeakFitter.htm (accessed Apr, 11,2016).(75) Ridgeway, M. E.; Wolff, J. J.; Silveira, J. A.; Lin, C.; Costello, C.E.; Park, M. A. Int. J. Ion Mobility Spectrom. 2016, 1−9.(76) Todd, P. J.; Schaaff, T. G.; Chaurand, P.; Caprioli, R. M. J. MassSpectrom. 2001, 36, 355−369.(77) Jurchen, J. C.; Rubakhin, S. S.; Sweedler, J. V. J. Am. Soc. MassSpectrom. 2005, 16, 1654−1659.(78) Giles, K.; Williams, J. P.; Campuzano, I. Rapid Commun. MassSpectrom. 2011, 25, 1559−1566.(79) Bush, M. F.; Hall, Z.; Giles, K.; Hoyes, J.; Robinson, C. V.;Ruotolo, B. T. Anal. Chem. 2010, 82, 9557−9565.(80) Schenk, E. R.; Almeida, R.; Miksovska, J.; Ridgeway, M. E.; Park,M. A.; Fernandez-Lima, F. J. Am. Soc. Mass Spectrom. 2015, 26, 555−563.(81) McKenzie-Coe, A.; DeBord, J. D.; Ridgeway, M.; Park, M.;Eiceman, G.; Fernandez-Lima, F. Analyst 2015, 140, 5692−5699.(82) Schenk, E. R.; Ridgeway, M. E.; Park, M. A.; Leng, F.;Fernandez-Lima, F. Anal. Chem. 2014, 86, 1210−1214.(83) Molano-Arevalo, J. C.; Hernandez, D. R.; Gonzalez, W. G.;Miksovska, J.; Ridgeway, M. E.; Park, M. A.; Fernandez-Lima, F. Anal.Chem. 2014, 86, 10223−10230.(84) Fernandez-Lima, F. A.; Wei, H.; Gao, Y. Q.; Russell, D. H. J.Phys. Chem. A 2009, 113, 8221−8234.(85) Morsa, D.; Gabelica, V.; De Pauw, E. J. Am. Soc. Mass Spectrom.2014, 25, 1384−1393.(86) Morsa, D.; Gabelica, V.; De Pauw, E. Anal. Chem. 2011, 83,5775−5782.(87) Shi, L.; Holliday, A. E.; Glover, M. S.; Ewing, M. A.; Russell, D.H.; Clemmer, D. E. J. Am. Soc. Mass Spectrom. 2016, 27, 22−30.(88) Shi, H.; Clemmer, D. E. J. Phys. Chem. B 2014, 118, 3498−3506.(89) Silveira, J. A.; Fort, K. L.; Kim, D.; Servage, K. A.; Pierson, N. A.;Clemmer, D. E.; Russell, D. H. J. Am. Chem. Soc. 2013, 135, 19147−19153.(90) Shi, H.; Pierson, N. A.; Valentine, S. J.; Clemmer, D. E. J. Phys.Chem. B 2012, 116, 3344−3352.(91) Pierson, N. A.; Chen, L.; Valentine, S. J.; Russell, D. H.;Clemmer, D. E. J. Am. Chem. Soc. 2011, 133, 13810−13813.(92) Pierson, N. A.; Valentine, S. J.; Clemmer, D. E. J. Phys. Chem. B2010, 114, 7777−7783.
Analytical Chemistry Article
DOI: 10.1021/acs.analchem.6b01946Anal. Chem. 2016, 88, 7404−7412
7412