Embed Size (px)
Citation preview
Overall executive summary
UK design industry has grown since 2005, despite the recession There are 232,0001 designers, 29% more than in 2005 and earnings have increased by £3.4bn. The combined budget of in-house teams and fee income of freelances and consultancies is £15bn.
Growth supported by an increase in numbers of freelances There are now 65,900 freelances, 39% more than in 2005. Overall freelance designer fee incomes have climbed by 22%.
More designers in fewer consultancies There are 82,500 designers working in design consultancies, 35% more than in 2005. However, this growth in employment has occurred whilst the total number of consultancies has declined to an estimated 10,800. Our results suggest that the proportion of larger consultancies has fallen therefore employment growth must be attributed to growth amongst the smaller consultancies.
In-house teams retained despite budget cuts The number of in-house teams has increased by 10% - and 8% more designers are employed by them (83,600 in total) – despite their overall combined budget reducing by 34% compared to 2005. This is a positive indication that employers are holding on to creative employees despite downward pressure on budgets.
Industry concentrated in London and South East The capital accounts for almost a quarter (23%) of design businesses. The South East region is home to one in six design businesses.
Most design businesses work in communication design and digital and multimedia designThere is a trend towards a combined offer in these disciplines.
Industry composed mainly of small, young businesses with incomes to match
– Well over half (60%) of design consultancies employ fewer than five people and over a further quarter (27%) have less than ten staff. In-house teams tend to be larger than consultancies, over a third (37%) of in-house teams comprise five or more designers.
– Many of these businesses are relatively young: well over a quarter, at least 29%, in every region or country of the UK have been in business for three years or less. 55% of design consultancies have an annual fee income of between £100,000 and £500,000, 58% of freelancers have an annual fee income of less than £50,000.
Industry lacks diversityThe average UK designer is male, white and 38 years old.
Increasing demand for servicesThe broadly positive picture for the design industry despite the recession is reinforced by the reported demand for design services. 61% of digital and multimedia design firms reported increased demand since 2005, followed by 41% of communications design businesses saying demand has increased.
Main competition is UK basedThe main competition for most (92%) design businesses comes from within the UK and in many instances is local to the business. More than two-thirds of design businesses think competition has increased over the past three years. Overseas competition is more prevalent amongst in-house teams.
Design supply chainsDesigners collaborate both with other design businesses and non design businesses. Lots of work is won by designers, some of which is then passed on to subcontractors. Around half of design businesses said they collaborate with other design firms – usually on short-term projects.
QualificationsJust over half (51%2) of designers have a degree or equivalent qualification. This is an increase of 10% since 2003. Interestingly, 37% of design consultancies and in-house teams require a degree whilst 32% of the same grouping do not require a base level design qualification.
Low levels of recruitmentBut overall fewer businesses are recruiting. Over two thirds haven’t recruited designers in the past year – and 6% of consultancies have made redundancies over the past year; this was also true in 9% of in-house teams.
Business PracticesBusiness practices remain similar to results from 2005. Most design businesses work on a fixed fee or day rate basis, in comparison only 4% work on a client retainer. 66% of designers do not take any action to protect their IP and almost 60% of designers feel either very or quite well equipped to advise their clients on sustainable design however only 18% of designers consider it as an important factor in winning business
MembershipMost designers are not members of national design bodies. Designers rarely join networks, but are most likely to be members of business organisations like the Federation of Small Businesses (14%) and the British Chamber of Commerce (12%). Beyond this, they are also more likely to have joined a regional design network or forum (9%) than a national design body.
1. Source: Labour Force Survey 20082. Source: Labour Force Survey 2008
In autumn 2009 the Design Council conducted its second comprehensive survey of the UK design industry. The survey covered over 2,200 design businesses including in-house design teams, design consultancies and freelance designers working across communications, digital & multimedia, interior & exhibition, product & industrial, fashion and service design disciplines. Design businesses were asked about the profile and size of their businesses, their clients and the competition they face, their business practices and the education, training and skills of their employees. The key findings from the research can be found below and a series of individual factsheets provide more detail on research findings.
Uk design industry
This factsheet presents the overall research findings for UK design businesses (freelance designers, design consultancies and in-house design teams). For detailed information on specific business types, see the relevant factsheets.
The UK design industry has experienced healthy growth over the last five years. It is estimated that there are now 232,000 designers working in the UK, an increase of 29% since 2005. The overall annual earnings of UK design businesses are estimated at £15bn – this includes design consultancy and freelance fee incomes as well as in-house design team budgets – an increase of approximately 15% since 2005, taking inflation into account. The financial picture is positive for some, with 37% of design businesses reporting a rise in fee income/budget, but challenging for others, with 26% reporting a drop in income. The industry remains clustered around London and the South East, with 40% of design businesses based here. The majority of design businesses work in communications design and in digital and multimedia design.
How many designers are there in the Uk? There are an estimated 232,0001 designers in the UK. This is a 29% increase on 2005. Just over a quarter of UK designers are freelance, just over a third work in design consultancies and the same proportion work in in-house design teams2.
Number of As percentage of all designers ‘09 Uk designers
Freelance designers 65,900 28%
Design consultancies 82,500 36%
In-house design teams (100+ employees) 83,600 36%
How many design businesses are there in the Uk? The number of freelance designers in the UK has increased significantly since 2005 and the number of in-house design teams has also increased slightly. By comparison the number of design consultancies has decreased.
– 65,900 freelance design businesses (an increase of 39% since 2005)
– 10,800 design consultancies (a decrease of 13% compared to 2005)
– 6,500 in-house design teams (in businesses with 100+ employees) (an increase of 10% since 2005)
Size and shape of the UK design industry
1. Source: Labour Force Survey 2008 and Design Council Survey 2009.2. In businesses with 100+ employees.
What is the combined total of consultancy and freelance fee income, plus in-house design budgets? The collective fee incomes and budgets of UK design businesses amounts to £15bn. This represents an increase of almost 30% since 2005, although around half of this can be attributed to inflation.
The £15bn figure breaks down as follow:
– £7.6bn (51%) – design consultancies’ total annual fee income
– £3.6bn (24%) – freelances’ total annual fee income
– £3.8bn (25%) – in-house design teams’ total annual budget
Communications
Digital and Multimedia
Profile of UK design businesses
Financial performance of the UK design industry
3. Source: Labour Force Survey 2008. 4. Financial performance refers to annual fee income for design consultancies and freelancers, and budget for in house design teams.
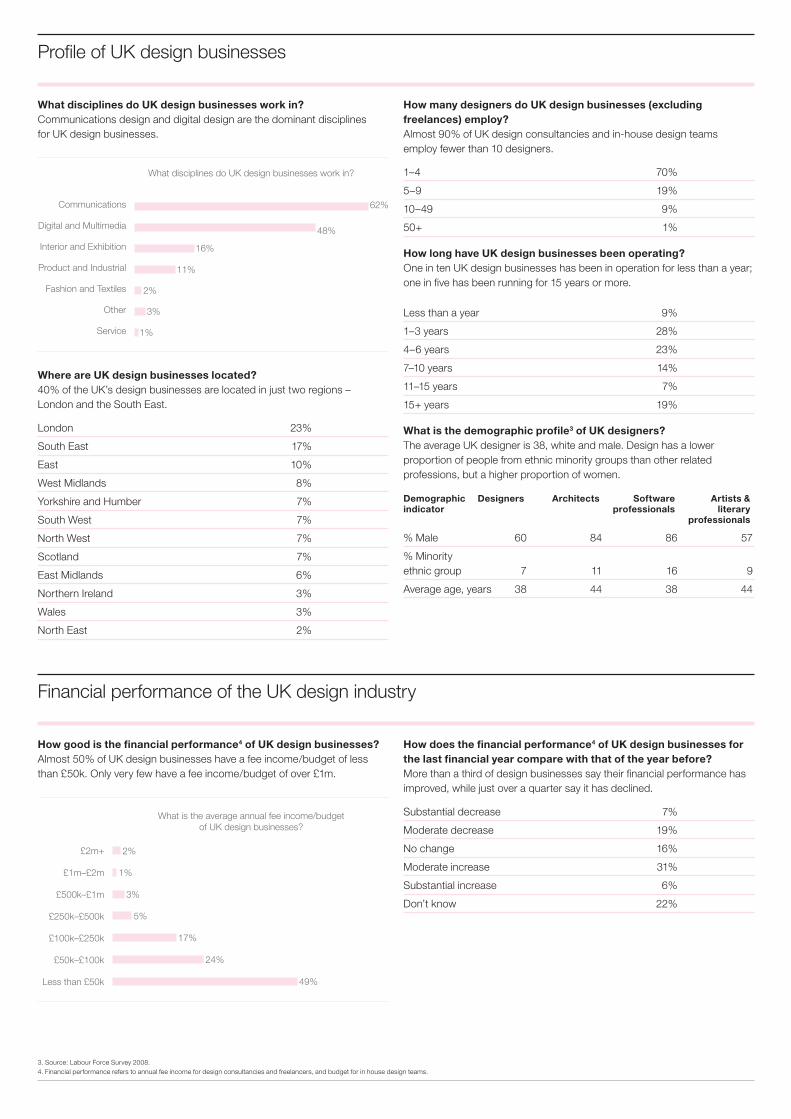
What disciplines do UK design businesses work in? Communications design and digital design are the dominant disciplines for UK design businesses.
Where are UK design businesses located? 40% of the UK’s design businesses are located in just two regions – London and the South East.
London 23%
South East 17%
East 10%
West Midlands 8%
Yorkshire and Humber 7%
South West 7%
North West 7%
Scotland 7%
East Midlands 6%
Northern Ireland 3%
Wales 3%
North East 2%
How many designers do UK design businesses (excluding freelances) employ? Almost 90% of UK design consultancies and in-house design teams employ fewer than 10 designers.
1–4 70%
5–9 19%
10–49 9%
50+ 1%
How long have UK design businesses been operating? One in ten UK design businesses has been in operation for less than a year; one in five has been running for 15 years or more.
Less than a year 9%
1–3 years 28%
4–6 years 23%
7–10 years 14%
11–15 years 7%
15+ years 19%
What is the demographic profile3 of UK designers? The average UK designer is 38, white and male. Design has a lower proportion of people from ethnic minority groups than other related professions, but a higher proportion of women.
Demographic Designers Architects Software Artists & indicator professionals literary professionals
% Male 60 84 86 57
% Minority ethnic group 7 11 16 9
Average age, years 38 44 38 44
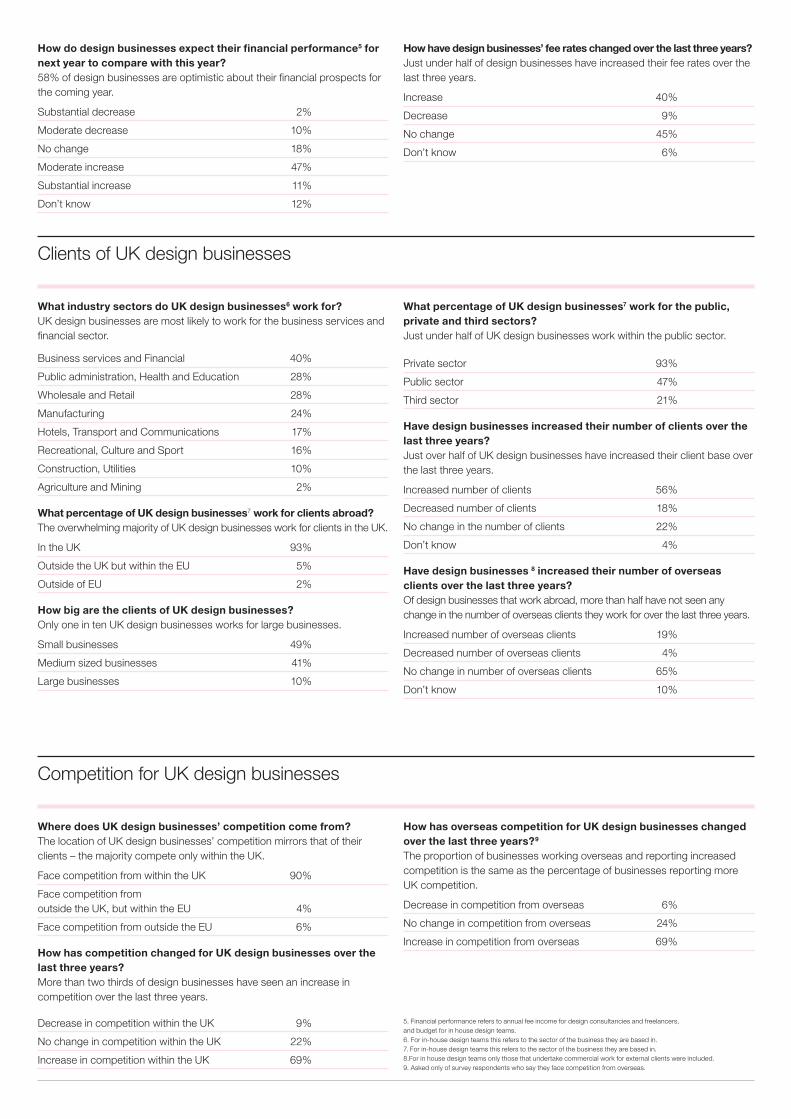
How good is the financial performance4 of UK design businesses? Almost 50% of UK design businesses have a fee income/budget of less than £50k. Only very few have a fee income/budget of over £1m.
How does the financial performance4 of UK design businesses for the last financial year compare with that of the year before? More than a third of design businesses say their financial performance has improved, while just over a quarter say it has declined.
Substantial decrease 7%
Moderate decrease 19%
No change 16%
Moderate increase 31%
Substantial increase 6%
Don’t know 22%
What disciplines do UK design businesses work in?
62%
48%
16%
11%
2%
3%
1%
Communications
Digital and Multimedia
Interior and Exhibition
Product and Industrial
Fashion and Textiles
Other
Service
What is the average annual fee income/budget of UK design businesses?
£2m+ 2%
1%
3%
5%
17%
24%
49%
£1m–£2m
£500k–£1m
£250k–£500k
£100k–£250k
£50k–£100k
Less than £50k
How do design businesses expect their financial performance5 for next year to compare with this year? 58% of design businesses are optimistic about their financial prospects for the coming year. Substantial decrease 2%
Moderate decrease 10%
No change 18%
Moderate increase 47%
Substantial increase 11%
Don’t know 12%
How have design businesses’ fee rates changed over the last three years? Just under half of design businesses have increased their fee rates over the last three years. Increase 40%
Decrease 9%
No change 45%
Don’t know 6%
Clients of UK design businesses
What industry sectors do UK design businesses6 work for? UK design businesses are most likely to work for the business services and financial sector. Business services and Financial 40%
Public administration, Health and Education 28%
Wholesale and Retail 28%
Manufacturing 24%
Hotels, Transport and Communications 17%
Recreational, Culture and Sport 16%
Construction, Utilities 10%
Agriculture and Mining 2%
What percentage of UK design businesses7 work for clients abroad? The overwhelming majority of UK design businesses work for clients in the UK. In the UK 93%
Outside the UK but within the EU 5%
Outside of EU 2%
How big are the clients of UK design businesses? Only one in ten UK design businesses works for large businesses. Small businesses 49%
Medium sized businesses 41%
Large businesses 10%
What percentage of UK design businesses7 work for the public, private and third sectors? Just under half of UK design businesses work within the public sector. Private sector 93%
Public sector 47%
Third sector 21%
Have design businesses increased their number of clients over the last three years? Just over half of UK design businesses have increased their client base over the last three years. Increased number of clients 56%
Decreased number of clients 18%
No change in the number of clients 22%
Don’t know 4%
Have design businesses 8 increased their number of overseas clients over the last three years? Of design businesses that work abroad, more than half have not seen any change in the number of overseas clients they work for over the last three years. Increased number of overseas clients 19%
Decreased number of overseas clients 4%
No change in number of overseas clients 65%
Don’t know 10%
Competition for UK design businesses
Where does UK design businesses’ competition come from? The location of UK design businesses’ competition mirrors that of their clients – the majority compete only within the UK. Face competition from within the UK 90%
Face competition from outside the UK, but within the EU 4%
Face competition from outside the EU 6%
How has competition changed for UK design businesses over the last three years?More than two thirds of design businesses have seen an increase in competition over the last three years. Decrease in competition within the UK 9%
No change in competition within the UK 22%
Increase in competition within the UK 69%
How has overseas competition for UK design businesses changed over the last three years?9
The proportion of businesses working overseas and reporting increased competition is the same as the percentage of businesses reporting more UK competition.
Decrease in competition from overseas 6%
No change in competition from overseas 24%
Increase in competition from overseas 69%
5. Financial performance refers to annual fee income for design consultancies and freelancers, and budget for in house design teams. 6. For in-house design teams this refers to the sector of the business they are based in. 7. For in-house design teams this refers to the sector of the business they are based in.8.For in house design teams only those that undertake commercial work for external clients were included. 9. Asked only of survey respondents who say they face competition from overseas.
Job market for the UK design industry
What percentage of UK design businesses are recruiting? 31% of design businesses recruited at least one designer last year.
What percentage of UK design businesses are making redundancies? 7% of design businesses made at least one redundancy last year.
Data sources– All data is drawn from the Design Council’s Design Industry Survey conducted from September to November 2009, unless otherwise specified. More detailed information on the methodology for this survey can be found in the document ‘Design Industry Research Survey Glossary and Methodology’ on the Design Council’s website.
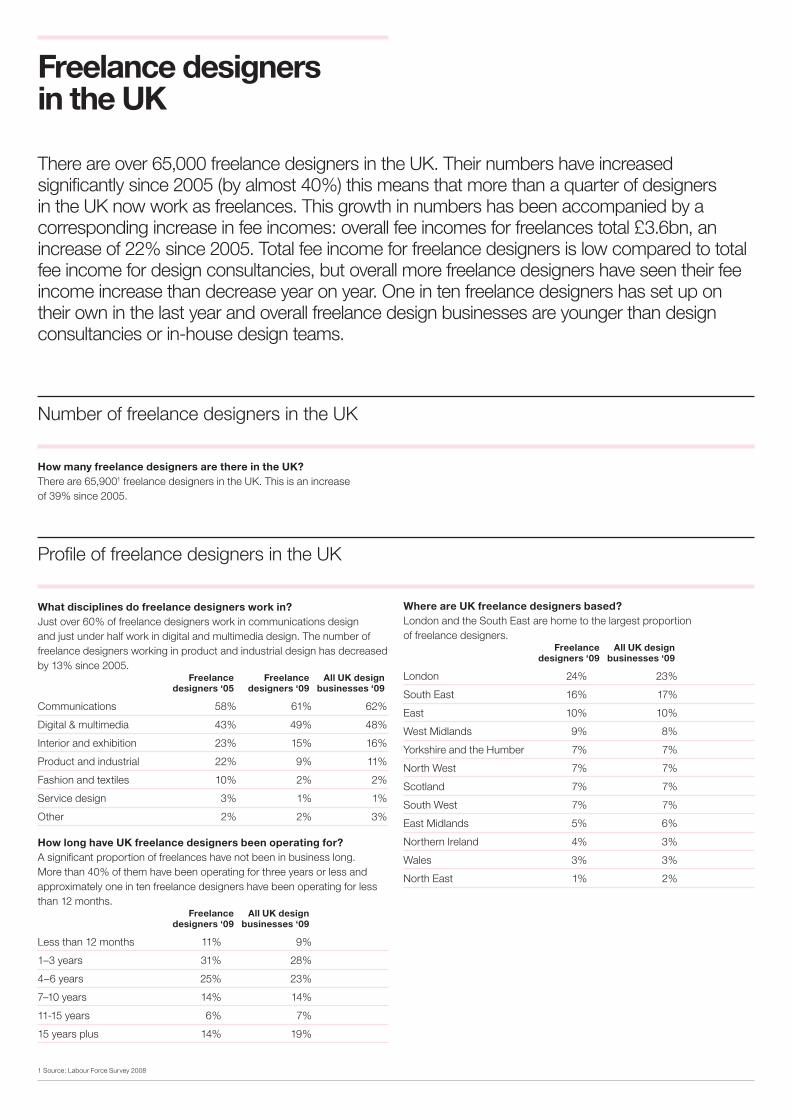
Freelance designers in the UK
There are over 65,000 freelance designers in the UK. Their numbers have increased significantly since 2005 (by almost 40%) this means that more than a quarter of designers in the UK now work as freelances. This growth in numbers has been accompanied by a corresponding increase in fee incomes: overall fee incomes for freelances total £3.6bn, an increase of 22% since 2005. Total fee income for freelance designers is low compared to total fee income for design consultancies, but overall more freelance designers have seen their fee income increase than decrease year on year. One in ten freelance designers has set up on their own in the last year and overall freelance design businesses are younger than design consultancies or in-house design teams.
How many freelance designers are there in the UK? There are 65,9001 freelance designers in the UK. This is an increase of 39% since 2005.
What disciplines do freelance designers work in? Just over 60% of freelance designers work in communications design and just under half work in digital and multimedia design. The number of freelance designers working in product and industrial design has decreased by 13% since 2005. Freelance Freelance All UK design designers ‘05 designers ‘09 businesses ‘09
Communications 58% 61% 62%
Digital & multimedia 43% 49% 48%
Interior and exhibition 23% 15% 16%
Product and industrial 22% 9% 11%
Fashion and textiles 10% 2% 2%
Service design 3% 1% 1%
Other 2% 2% 3%
How long have UK freelance designers been operating for? A significant proportion of freelances have not been in business long.More than 40% of them have been operating for three years or less and approximately one in ten freelance designers have been operating for less than 12 months. Freelance All UK design designers ‘09 businesses ‘09
Less than 12 months 11% 9%
1–3 years 31% 28%
4–6 years 25% 23%
7–10 years 14% 14%
11-15 years 6% 7%
15 years plus 14% 19%
Number of freelance designers in the UK
Profile of freelance designers in the UK
1 Source: Labour Force Survey 2008
Where are UK freelance designers based? London and the South East are home to the largest proportion of freelance designers. Freelance All UK design designers ‘09 businesses ‘09
London 24% 23%
South East 16% 17%
East 10% 10%
West Midlands 9% 8%
Yorkshire and the Humber 7% 7%
North West 7% 7%
Scotland 7% 7%
South West 7% 7%
East Midlands 5% 6%
Northern Ireland 4% 3%
Wales 3% 3%
North East 1% 2%
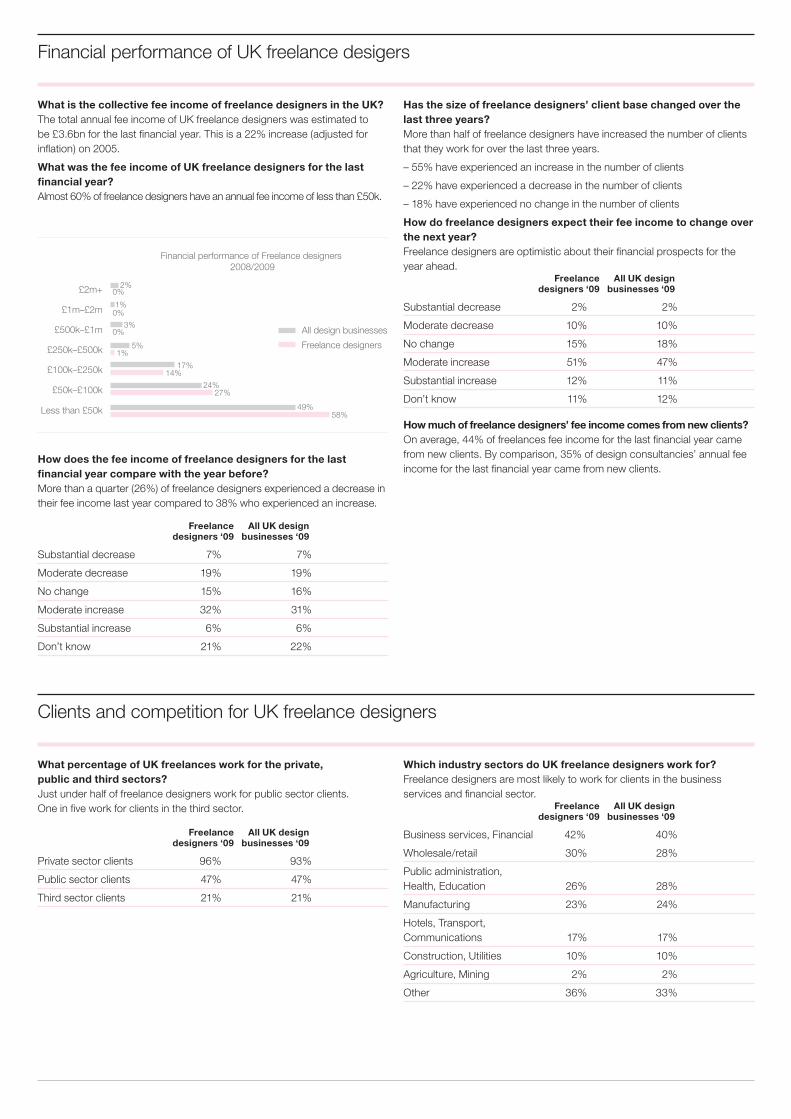
What is the collective fee income of freelance designers in the UK? The total annual fee income of UK freelance designers was estimated to be £3.6bn for the last financial year. This is a 22% increase (adjusted for inflation) on 2005.
What was the fee income of UK freelance designers for the last financial year? Almost 60% of freelance designers have an annual fee income of less than £50k.
Financial performance of UK freelance desigers
How does the fee income of freelance designers for the last financial year compare with the year before? More than a quarter (26%) of freelance designers experienced a decrease in their fee income last year compared to 38% who experienced an increase.
Freelance All UK design designers ‘09 businesses ‘09
Substantial decrease 7% 7%
Moderate decrease 19% 19%
No change 15% 16%
Moderate increase 32% 31%
Substantial increase 6% 6%
Don’t know 21% 22%
Has the size of freelance designers’ client base changed over the last three years? More than half of freelance designers have increased the number of clients that they work for over the last three years.
– 55% have experienced an increase in the number of clients
– 22% have experienced a decrease in the number of clients
– 18% have experienced no change in the number of clients
How do freelance designers expect their fee income to change over the next year? Freelance designers are optimistic about their financial prospects for the year ahead. Freelance All UK design designers ‘09 businesses ‘09
Substantial decrease 2% 2%
Moderate decrease 10% 10%
No change 15% 18%
Moderate increase 51% 47%
Substantial increase 12% 11%
Don’t know 11% 12%
How much of freelance designers’ fee income comes from new clients?On average, 44% of freelances fee income for the last financial year came from new clients. By comparison, 35% of design consultancies’ annual fee income for the last financial year came from new clients.
Clients and competition for UK freelance designers
What percentage of UK freelances work for the private, public and third sectors?Just under half of freelance designers work for public sector clients. One in five work for clients in the third sector.
Freelance All UK design designers ‘09 businesses ‘09
Private sector clients 96% 93%
Public sector clients 47% 47%
Third sector clients 21% 21%
Which industry sectors do UK freelance designers work for? Freelance designers are most likely to work for clients in the business services and financial sector. Freelance All UK design designers ‘09 businesses ‘09
Business services, Financial 42% 40%
Wholesale/retail 30% 28%
Public administration, Health, Education 26% 28%
Manufacturing 23% 24%
Hotels, Transport, Communications 17% 17%
Construction, Utilities 10% 10%
Agriculture, Mining 2% 2%
Other 36% 33%
Financial performance of Freelance designers 2008/2009
£2m+
£1m–£2m
£500k–£1m
£250k–£500k
£100k–£250k
£50k–£100k
58%49%
24%27%
17%
5%
3%
2%
1%
14%
1%
0%
0%
0%
All design businesses
Freelance designers
Less than £50k
Where are freelance designers’ main clients located? Freelance designers are less likely than design consultancies or in-house design teams to do work abroad. Almost all freelance designers work predominantly for clients based in the UK.
– 95% of UK freelance designers’ main clients are based in the UK
– 4% of UK freelance designers’ main clients are based in the EU
– 1% of UK freelance designers’ clients are based outside the EU
Where does freelance designers’ competition come from?Less than 10% of freelance designers’ competition comes from overseas.
– 89% of UK freelance designers say their main competition comes from within the UK
– 4% of UK freelance designers say their main competition comes from within the EU
– 7% of UK freelance designers say their main competition comes from outside of the EU
How has competition for freelance designers changed over the last three years? The majority of freelance designers say that competition for work has increased over the last three years.
– 21% of UK freelance designers say there has been no change in their competition
– 70% of UK freelance designers think competition has increased – 10% of UK freelance designers think competition had decreased.
Data sources– All data is drawn from the Design Council’s Design Industry Survey conducted from September to November 2009, unless otherwise specified. More detailed information on the methodology for this survey can be found in the document ‘Design Industry Research Survey Glossary and Methodology’ on the Design Council’s website.
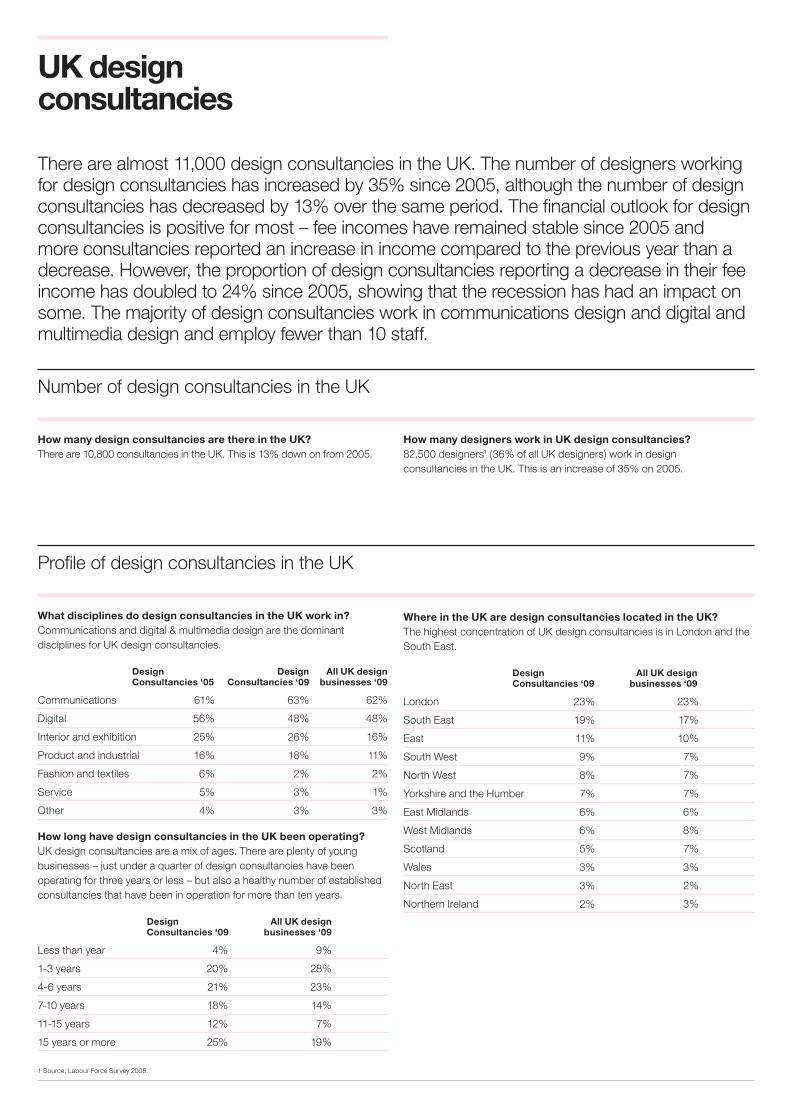
UK design consultancies
There are almost 11,000 design consultancies in the UK. The number of designers working for design consultancies has increased by 35% since 2005, although the number of design consultancies has decreased by 13% over the same period. The financial outlook for design consultancies is positive for most – fee incomes have remained stable since 2005 and more consultancies reported an increase in income compared to the previous year than a decrease. However, the proportion of design consultancies reporting a decrease in their fee income has doubled to 24% since 2005, showing that the recession has had an impact on some. The majority of design consultancies work in communications design and digital and multimedia design and employ fewer than 10 staff.
How many design consultancies are there in the UK? There are 10,800 consultancies in the UK. This is 13% down on from 2005.
Number of design consultancies in the UK
Profile of design consultancies in the UK
1 Source: Labour Force Survey 2008.
What disciplines do design consultancies in the UK work in?Communications and digital & multimedia design are the dominant disciplines for UK design consultancies.
Design Design All UK design Consultancies ‘05 Consultancies ‘09 businesses ‘09
Communications 61% 63% 62%
Digital 56% 48% 48%
Interior and exhibition 25% 26% 16%
Product and industrial 16% 18% 11%
Fashion and textiles 6% 2% 2%
Service 5% 3% 1%
Other 4% 3% 3%
How long have design consultancies in the UK been operating? UK design consultancies are a mix of ages. There are plenty of young businesses – just under a quarter of design consultancies have been operating for three years or less – but also a healthy number of established consultancies that have been in operation for more than ten years.
Design All UK design Consultancies ‘09 businesses ‘09
Less than year 4% 9%
1-3 years 20% 28%
4-6 years 21% 23%
7-10 years 18% 14%
11-15 years 12% 7%
15 years or more 25% 19%
Where in the UK are design consultancies located in the UK?The highest concentration of UK design consultancies is in London and the South East.
Design All UK design Consultancies ‘09 businesses ‘09
London 23% 23%
South East 19% 17%
East 11% 10%
South West 9% 7%
North West 8% 7%
Yorkshire and the Humber 7% 7%
East Midlands 6% 6%
West Midlands 6% 8%
Scotland 5% 7%
Wales 3% 3%
North East 3% 2%
Northern Ireland 2% 3%
How many designers work in UK design consultancies? 82,500 designers1 (36% of all UK designers) work in design consultancies in the UK. This is an increase of 35% on 2005.
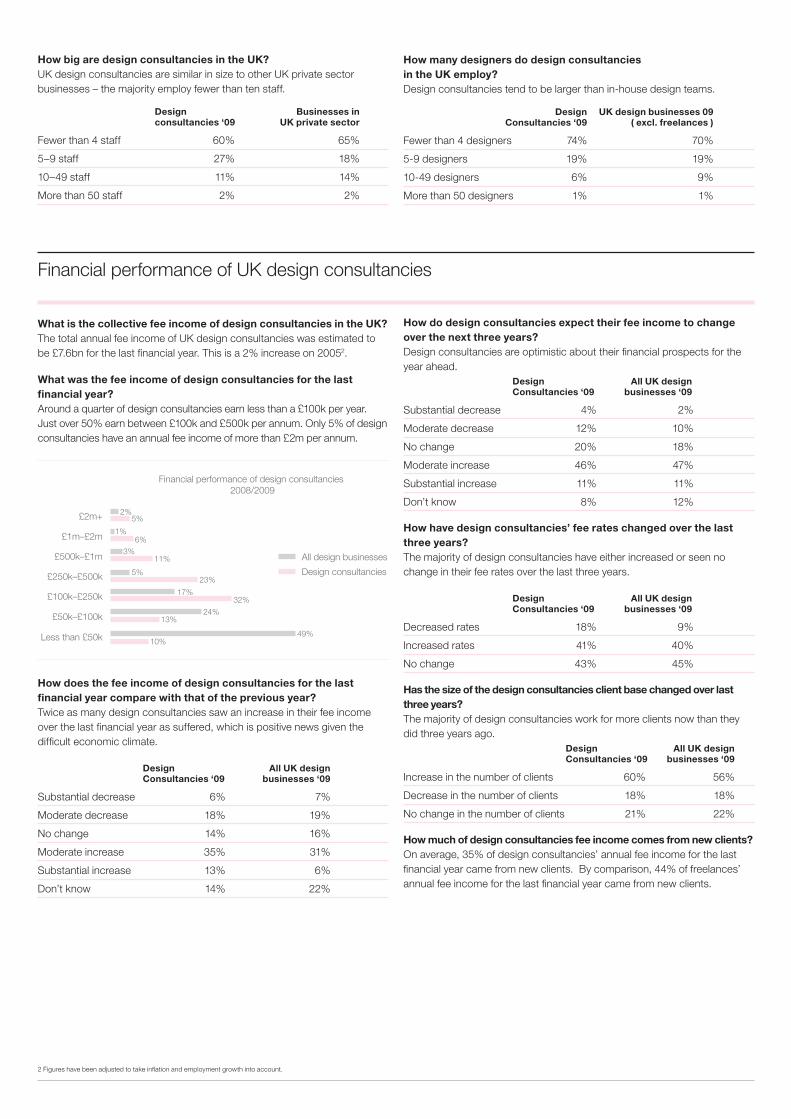
How big are design consultancies in the UK? UK design consultancies are similar in size to other UK private sector businesses – the majority employ fewer than ten staff.
Design Businesses in consultancies ‘09 UK private sector
Fewer than 4 staff 60% 65%
5–9 staff 27% 18%
10–49 staff 11% 14%
More than 50 staff 2% 2%
Financial performance of UK design consultancies
How many designers do design consultancies in the UK employ? Design consultancies tend to be larger than in-house design teams.
Design UK design businesses 09 Consultancies ‘09 ( excl. freelances )
Fewer than 4 designers 74% 70%
5-9 designers 19% 19%
10-49 designers 6% 9%
More than 50 designers 1% 1%
What is the collective fee income of design consultancies in the UK? The total annual fee income of UK design consultancies was estimated to be £7.6bn for the last financial year. This is a 2% increase on 20052.
What was the fee income of design consultancies for the last financial year? Around a quarter of design consultancies earn less than a £100k per year. Just over 50% earn between £100k and £500k per annum. Only 5% of design consultancies have an annual fee income of more than £2m per annum.
How does the fee income of design consultancies for the last financial year compare with that of the previous year? Twice as many design consultancies saw an increase in their fee income over the last financial year as suffered, which is positive news given the difficult economic climate.
Design All UK design Consultancies ‘09 businesses ‘09
Substantial decrease 6% 7%
Moderate decrease 18% 19%
No change 14% 16%
Moderate increase 35% 31%
Substantial increase 13% 6%
Don’t know 14% 22%
How do design consultancies expect their fee income to change over the next three years? Design consultancies are optimistic about their financial prospects for the year ahead.
Design All UK design Consultancies ‘09 businesses ‘09
Substantial decrease 4% 2%
Moderate decrease 12% 10%
No change 20% 18%
Moderate increase 46% 47%
Substantial increase 11% 11%
Don’t know 8% 12%
How have design consultancies’ fee rates changed over the last three years? The majority of design consultancies have either increased or seen no change in their fee rates over the last three years.
Design All UK design Consultancies ‘09 businesses ‘09
Decreased rates 18% 9%
Increased rates 41% 40%
No change 43% 45%
Has the size of the design consultancies client base changed over last three years? The majority of design consultancies work for more clients now than they did three years ago.
Design All UK design Consultancies ‘09 businesses ‘09
Increase in the number of clients 60% 56%
Decrease in the number of clients 18% 18%
No change in the number of clients 21% 22%
How much of design consultancies fee income comes from new clients?On average, 35% of design consultancies’ annual fee income for the last financial year came from new clients. By comparison, 44% of freelances’ annual fee income for the last financial year came from new clients.
Financial performance of design consultancies 2008/2009
£2m+
£1m–£2m
£500k–£1m
£250k–£500k
£100k–£250k
£50k–£100k
10%49%
24%13%
17%
5%
3%
2%
1%
32%
23%
11%
5%
6%
All design businesses
Design consultancies
Less than £50k
2 Figures have been adjusted to take inflation and employment growth into account.
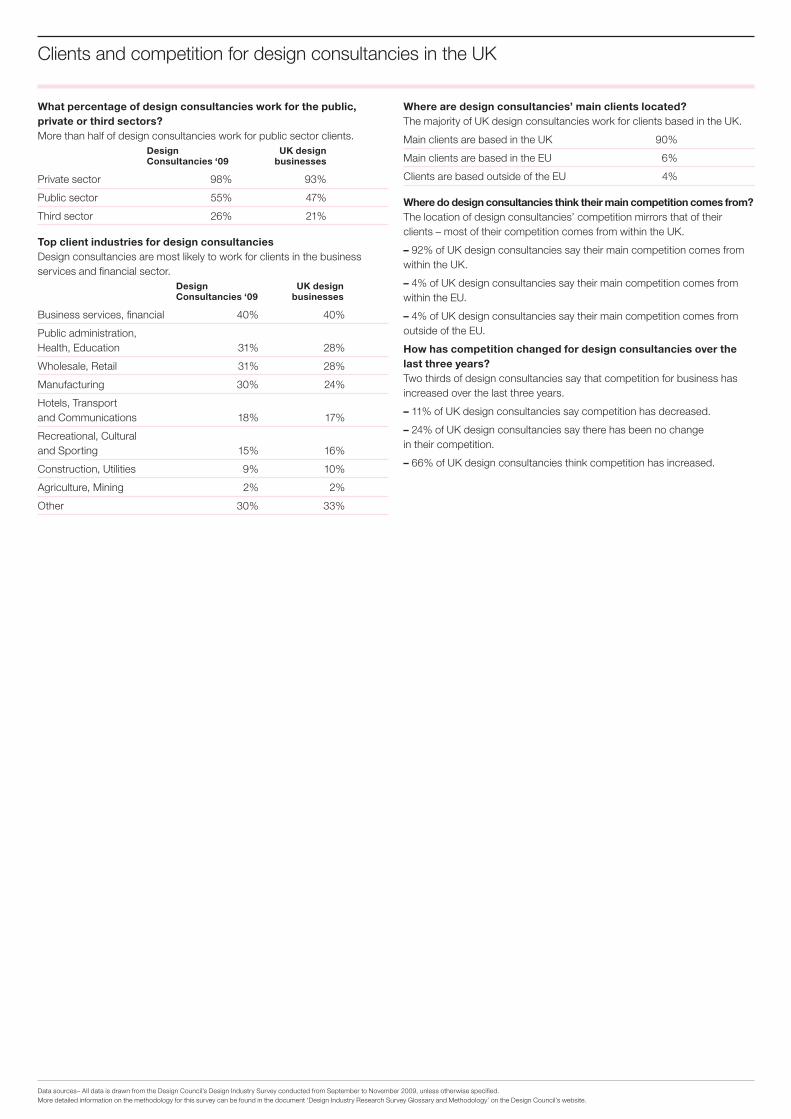
What percentage of design consultancies work for the public, private or third sectors? More than half of design consultancies work for public sector clients.
Design UK design Consultancies ‘09 businesses
Private sector 98% 93%
Public sector 55% 47%
Third sector 26% 21%
Top client industries for design consultanciesDesign consultancies are most likely to work for clients in the business services and financial sector.
Design UK design Consultancies ‘09 businesses
Business services, financial 40% 40%
Public administration, Health, Education 31% 28%
Wholesale, Retail 31% 28%
Manufacturing 30% 24%
Hotels, Transport and Communications 18% 17%
Recreational, Cultural and Sporting 15% 16%
Construction, Utilities 9% 10%
Agriculture, Mining 2% 2%
Other 30% 33%
Clients and competition for design consultancies in the UK
Where are design consultancies’ main clients located? The majority of UK design consultancies work for clients based in the UK.
Main clients are based in the UK 90%
Main clients are based in the EU 6%
Clients are based outside of the EU 4%
Where do design consultancies think their main competition comes from? The location of design consultancies’ competition mirrors that of their clients – most of their competition comes from within the UK.
– 92% of UK design consultancies say their main competition comes from within the UK.
– 4% of UK design consultancies say their main competition comes from within the EU.
– 4% of UK design consultancies say their main competition comes from outside of the EU.
How has competition changed for design consultancies over the last three years? Two thirds of design consultancies say that competition for business has increased over the last three years.
– 11% of UK design consultancies say competition has decreased.
– 24% of UK design consultancies say there has been no change in their competition.
– 66% of UK design consultancies think competition has increased.
Data sources– All data is drawn from the Design Council’s Design Industry Survey conducted from September to November 2009, unless otherwise specified. More detailed information on the methodology for this survey can be found in the document ‘Design Industry Research Survey Glossary and Methodology’ on the Design Council’s website.
In-house design teams in the UK
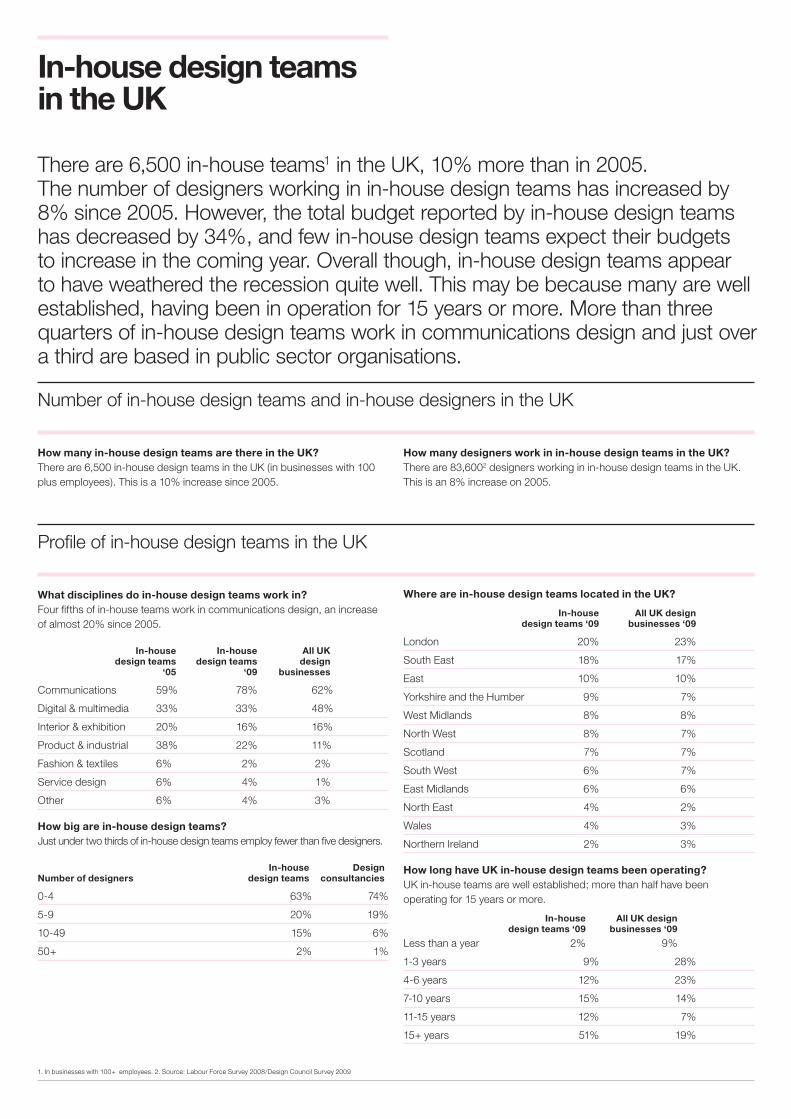
There are 6,500 in-house teams1 in the UK, 10% more than in 2005. The number of designers working in in-house design teams has increased by 8% since 2005. However, the total budget reported by in-house design teams has decreased by 34%, and few in-house design teams expect their budgets to increase in the coming year. Overall though, in-house design teams appear to have weathered the recession quite well. This may be because many are well established, having been in operation for 15 years or more. More than three quarters of in-house design teams work in communications design and just over a third are based in public sector organisations.
How many in-house design teams are there in the UK? There are 6,500 in-house design teams in the UK (in businesses with 100 plus employees). This is a 10% increase since 2005.
What disciplines do in-house design teams work in? Four fifths of in-house teams work in communications design, an increase of almost 20% since 2005.
In-house In-house All UK design teams design teams design ‘05 ‘09 businesses
Communications 59% 78% 62%
Digital & multimedia 33% 33% 48%
Interior & exhibition 20% 16% 16%
Product & industrial 38% 22% 11%
Fashion & textiles 6% 2% 2%
Service design 6% 4% 1%
Other 6% 4% 3%
How big are in-house design teams? Just under two thirds of in-house design teams employ fewer than five designers.
In-house Design Number of designers design teams consultancies
0-4 63% 74%
5-9 20% 19%
10-49 15% 6%
50+ 2% 1%
Number of in-house design teams and in-house designers in the UK
Profile of in-house design teams in the UK
1. In businesses with 100+ employees. 2. Source: Labour Force Survey 2008/Design Council Survey 2009
Where are in-house design teams located in the UK? In-house All UK design design teams ‘09 businesses ‘09
London 20% 23%
South East 18% 17%
East 10% 10%
Yorkshire and the Humber 9% 7%
West Midlands 8% 8%
North West 8% 7%
Scotland 7% 7%
South West 6% 7%
East Midlands 6% 6%
North East 4% 2%
Wales 4% 3%
Northern Ireland 2% 3%
How long have UK in-house design teams been operating? UK in-house teams are well established; more than half have been operating for 15 years or more. In-house All UK design design teams ‘09 businesses ‘09
Less than a year 2% 9%
1-3 years 9% 28%
4-6 years 12% 23%
7-10 years 15% 14%
11-15 years 12% 7%
15+ years 51% 19%
How many designers work in in-house design teams in the UK? There are 83,6002 designers working in in-house design teams in the UK. This is an 8% increase on 2005.
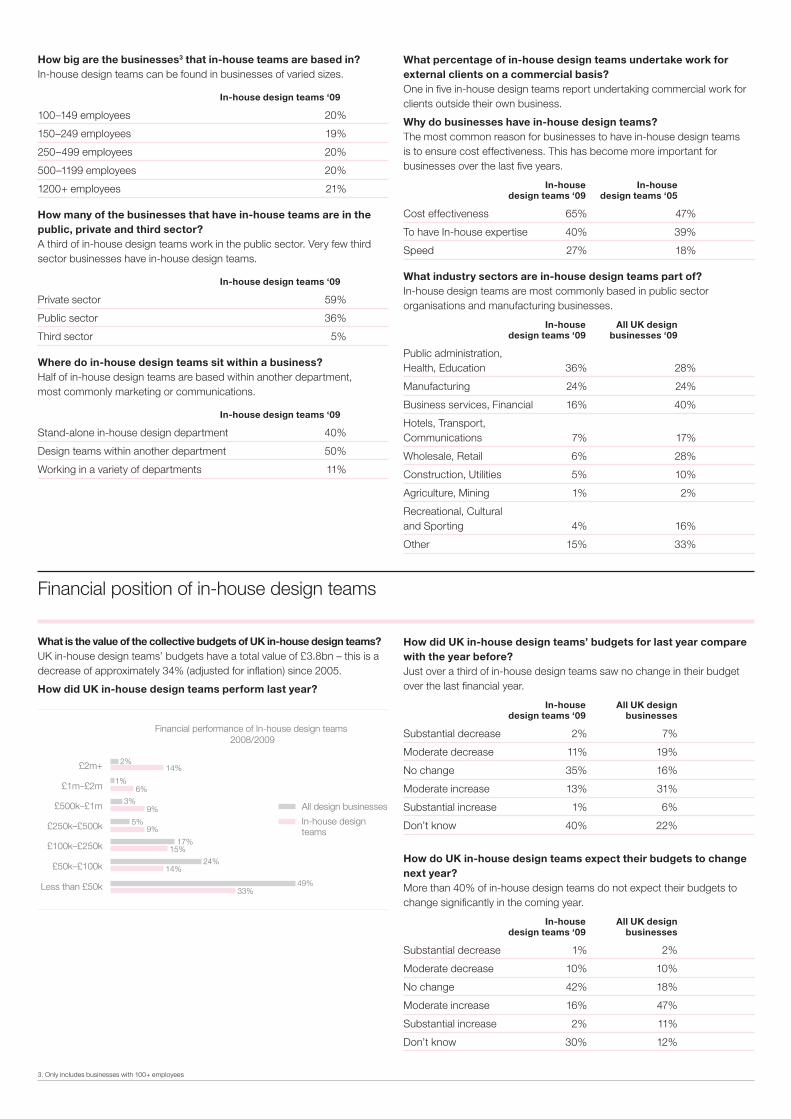
How big are the businesses3 that in-house teams are based in? In-house design teams can be found in businesses of varied sizes. In-house design teams ‘09
100–149 employees 20%
150–249 employees 19%
250–499 employees 20%
500–1199 employees 20%
1200+ employees 21%
How many of the businesses that have in-house teams are in the public, private and third sector? A third of in-house design teams work in the public sector. Very few third sector businesses have in-house design teams. In-house design teams ‘09
Private sector 59%
Public sector 36%
Third sector 5%
Where do in-house design teams sit within a business? Half of in-house design teams are based within another department, most commonly marketing or communications. In-house design teams ‘09
Stand-alone in-house design department 40%
Design teams within another department 50%
Working in a variety of departments 11%
Financial position of in-house design teams
3. Only includes businesses with 100+ employees
What percentage of in-house design teams undertake work for external clients on a commercial basis? One in five in-house design teams report undertaking commercial work for clients outside their own business.
Why do businesses have in-house design teams?The most common reason for businesses to have in-house design teams is to ensure cost effectiveness. This has become more important for businesses over the last five years. In-house In-house design teams ‘09 design teams ‘05
Cost effectiveness 65% 47%
To have In-house expertise 40% 39%
Speed 27% 18%
What industry sectors are in-house design teams part of? In-house design teams are most commonly based in public sector organisations and manufacturing businesses. In-house All UK design design teams ‘09 businesses ‘09
Public administration, Health, Education 36% 28%
Manufacturing 24% 24%
Business services, Financial 16% 40%
Hotels, Transport, Communications 7% 17%
Wholesale, Retail 6% 28%
Construction, Utilities 5% 10%
Agriculture, Mining 1% 2%
Recreational, Cultural and Sporting 4% 16%
Other 15% 33%
What is the value of the collective budgets of UK in-house design teams? UK in-house design teams’ budgets have a total value of £3.8bn – this is a decrease of approximately 34% (adjusted for inflation) since 2005.
How did UK in-house design teams perform last year?
How did UK in-house design teams’ budgets for last year compare with the year before? Just over a third of in-house design teams saw no change in their budget over the last financial year. In-house All UK design design teams ‘09 businesses
Substantial decrease 2% 7%
Moderate decrease 11% 19%
No change 35% 16%
Moderate increase 13% 31%
Substantial increase 1% 6%
Don’t know 40% 22%
How do UK in-house design teams expect their budgets to change next year? More than 40% of in-house design teams do not expect their budgets to change significantly in the coming year. In-house All UK design design teams ‘09 businesses
Substantial decrease 1% 2%
Moderate decrease 10% 10%
No change 42% 18%
Moderate increase 16% 47%
Substantial increase 2% 11%
Don’t know 30% 12%
Financial performance of In-house design teams 2008/2009
£2m+
£1m–£2m
£500k–£1m
£250k–£500k
£100k–£250k
£50k–£100k
33%49%
24%14%
17%
5%
3%
2%
1%
15%
9%
9%
14%
6%
All design businesses
In-house design teams
Less than £50k
Job market for in-house design teams
What percentage of in-house design teams recruited staff last year? 31% of in-house design teams recruited at least one designer last year. This is in line with recruitment levels for design consultancies (also 31%) but 20% down on 2005 figures when 51% of in-house design teams had recruited over the previous year.
What percentage of in-house design teams made redundancies last year? 9% of UK in-house design teams made redundancies last year compared to 7% of all design businesses.
Data sources– All data is drawn from the Design Council’s Design Industry Survey conducted from September to November 2009, unless otherwise specified. More detailed information on the methodology for this survey can be found in the document ‘Design Industry Research Survey Glossary and Methodology’ on the Design Council’s website.
Design business practices
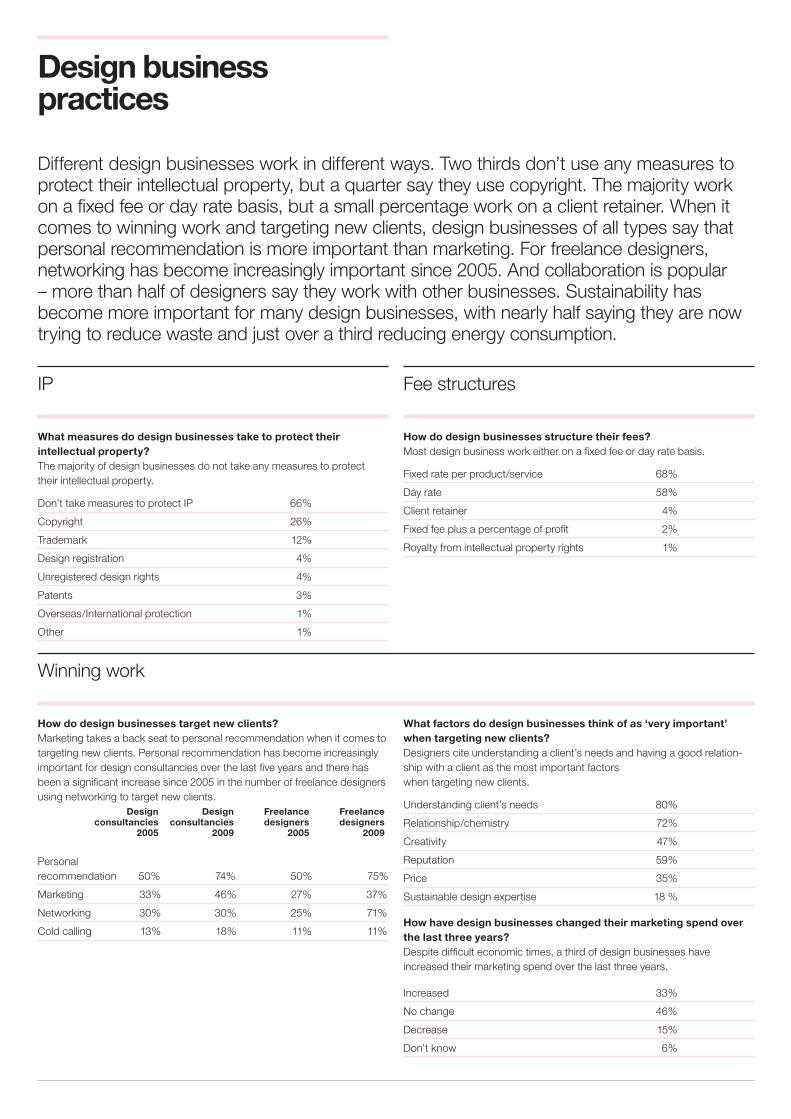
Different design businesses work in different ways. Two thirds don’t use any measures to protect their intellectual property, but a quarter say they use copyright. The majority work on a fixed fee or day rate basis, but a small percentage work on a client retainer. When it comes to winning work and targeting new clients, design businesses of all types say that personal recommendation is more important than marketing. For freelance designers, networking has become increasingly important since 2005. And collaboration is popular – more than half of designers say they work with other businesses. Sustainability has become more important for many design businesses, with nearly half saying they are now trying to reduce waste and just over a third reducing energy consumption.
What measures do design businesses take to protect their intellectual property?The majority of design businesses do not take any measures to protect their intellectual property. Don’t take measures to protect IP 66%
Copyright 26%
Trademark 12%
Design registration 4%
Unregistered design rights 4%
Patents 3%
Overseas/International protection 1%
Other 1%
How do design businesses target new clients?Marketing takes a back seat to personal recommendation when it comes to targeting new clients. Personal recommendation has become increasingly important for design consultancies over the last five years and there has been a significant increase since 2005 in the number of freelance designers using networking to target new clients. Design Design Freelance Freelance consultancies consultancies designers designers 2005 2009 2005 2009
Personal recommendation 50% 74% 50% 75%
Marketing 33% 46% 27% 37%
Networking 30% 30% 25% 71%
Cold calling 13% 18% 11% 11%
What factors do design businesses think of as ‘very important’ when targeting new clients? Designers cite understanding a client’s needs and having a good relation-ship with a client as the most important factors when targeting new clients. Understanding client’s needs 80%
Relationship/chemistry 72%
Creativity 47%
Reputation 59%
Price 35%
Sustainable design expertise 18 %
How have design businesses changed their marketing spend over the last three years?Despite difficult economic times, a third of design businesses have increased their marketing spend over the last three years.
Increased 33%
No change 46%
Decrease 15%
Don’t know 6%
How do design businesses structure their fees? Most design business work either on a fixed fee or day rate basis. Fixed rate per product/service 68%
Day rate 58%
Client retainer 4%
Fixed fee plus a percentage of profit 2%
Royalty from intellectual property rights 1%
IP
Winning work
Fee structures
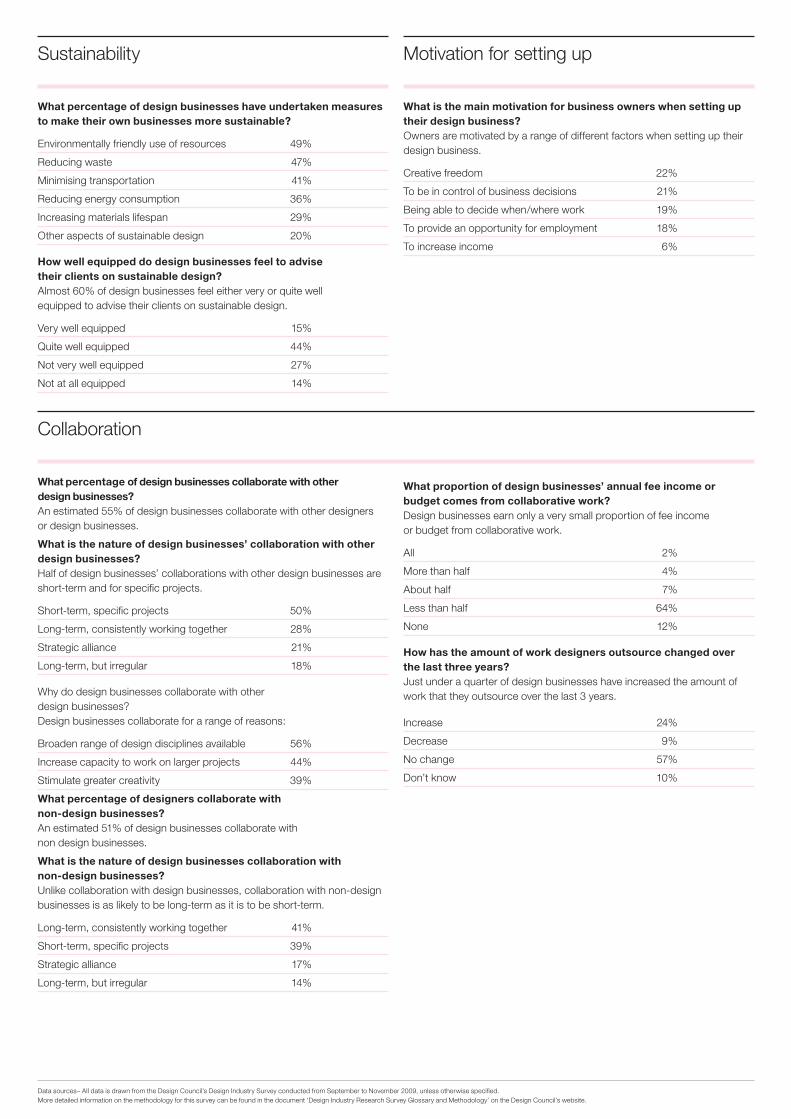
What percentage of design businesses have undertaken measures to make their own businesses more sustainable?
Environmentally friendly use of resources 49%
Reducing waste 47%
Minimising transportation 41%
Reducing energy consumption 36%
Increasing materials lifespan 29%
Other aspects of sustainable design 20%
How well equipped do design businesses feel to advise their clients on sustainable design? Almost 60% of design businesses feel either very or quite well equipped to advise their clients on sustainable design. Very well equipped 15%
Quite well equipped 44%
Not very well equipped 27%
Not at all equipped 14%
What is the main motivation for business owners when setting up their design business? Owners are motivated by a range of different factors when setting up their design business. Creative freedom 22%
To be in control of business decisions 21%
Being able to decide when/where work 19%
To provide an opportunity for employment 18%
To increase income 6%
What percentage of design businesses collaborate with other design businesses?An estimated 55% of design businesses collaborate with other designers or design businesses.
What is the nature of design businesses’ collaboration with other design businesses? Half of design businesses’ collaborations with other design businesses are short-term and for specific projects. Short-term, specific projects 50%
Long-term, consistently working together 28%
Strategic alliance 21%
Long-term, but irregular 18%
Why do design businesses collaborate with other design businesses? Design businesses collaborate for a range of reasons: Broaden range of design disciplines available 56%
Increase capacity to work on larger projects 44%
Stimulate greater creativity 39%
What percentage of designers collaborate with non-design businesses? An estimated 51% of design businesses collaborate with non design businesses.
What is the nature of design businesses collaboration with non-design businesses? Unlike collaboration with design businesses, collaboration with non-design businesses is as likely to be long-term as it is to be short-term. Long-term, consistently working together 41%
Short-term, specific projects 39%
Strategic alliance 17%
Long-term, but irregular 14%
Sustainability Motivation for setting up
Collaboration
Data sources– All data is drawn from the Design Council’s Design Industry Survey conducted from September to November 2009, unless otherwise specified. More detailed information on the methodology for this survey can be found in the document ‘Design Industry Research Survey Glossary and Methodology’ on the Design Council’s website.
What proportion of design businesses’ annual fee income or budget comes from collaborative work? Design businesses earn only a very small proportion of fee income or budget from collaborative work. All 2%
More than half 4%
About half 7%
Less than half 64%
None 12%
How has the amount of work designers outsource changed over the last three years? Just under a quarter of design businesses have increased the amount of work that they outsource over the last 3 years. Increase 24%
Decrease 9%
No change 57%
Don’t know 10%
Education, Training and Skills
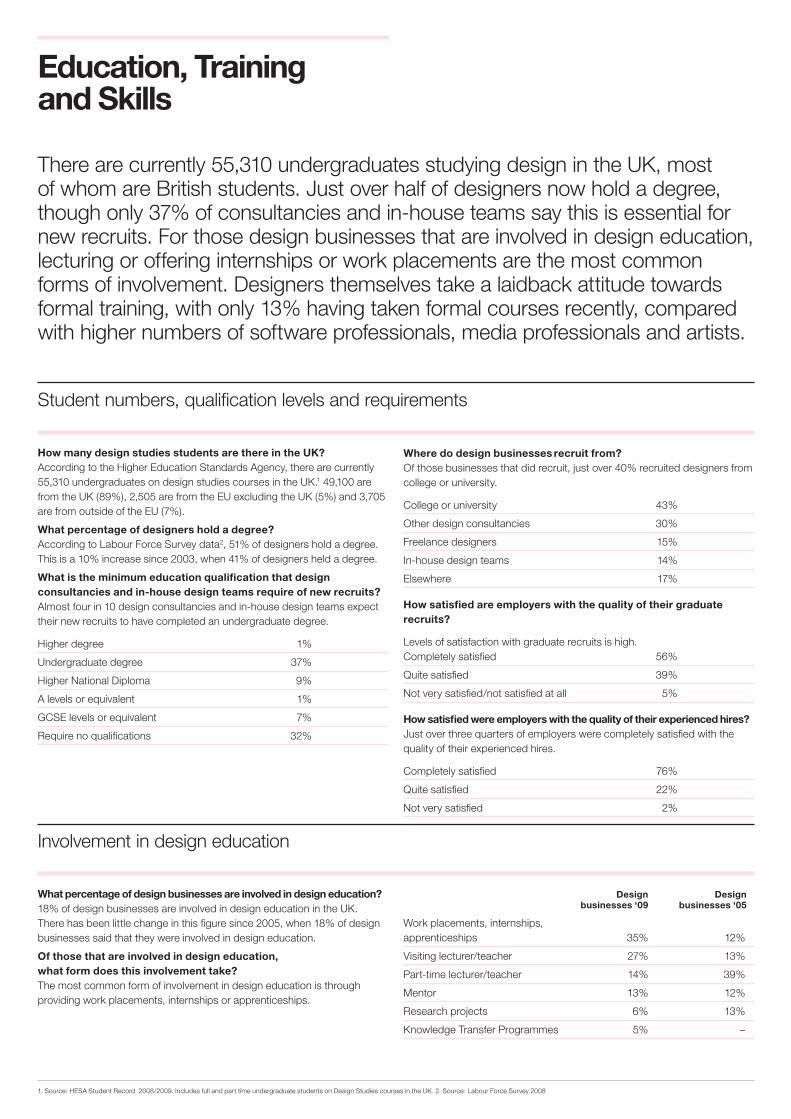
There are currently 55,310 undergraduates studying design in the UK, most of whom are British students. Just over half of designers now hold a degree, though only 37% of consultancies and in-house teams say this is essential for new recruits. For those design businesses that are involved in design education, lecturing or offering internships or work placements are the most common forms of involvement. Designers themselves take a laidback attitude towards formal training, with only 13% having taken formal courses recently, compared with higher numbers of software professionals, media professionals and artists.
How many design studies students are there in the UK? According to the Higher Education Standards Agency, there are currently 55,310 undergraduates on design studies courses in the UK.1 49,100 are from the UK (89%), 2,505 are from the EU excluding the UK (5%) and 3,705 are from outside of the EU (7%).
What percentage of designers hold a degree? According to Labour Force Survey data2, 51% of designers hold a degree. This is a 10% increase since 2003, when 41% of designers held a degree.
What is the minimum education qualification that design consultancies and in-house design teams require of new recruits? Almost four in 10 design consultancies and in-house design teams expect their new recruits to have completed an undergraduate degree. Higher degree 1%
Undergraduate degree 37%
Higher National Diploma 9%
A levels or equivalent 1%
GCSE levels or equivalent 7%
Require no qualifications 32%
What percentage of design businesses are involved in design education? 18% of design businesses are involved in design education in the UK. There has been little change in this figure since 2005, when 18% of design businesses said that they were involved in design education.
Of those that are involved in design education, what form does this involvement take? The most common form of involvement in design education is through providing work placements, internships or apprenticeships.
Student numbers, qualification levels and requirements
Involvement in design education
1. Source: HESA Student Record 2008/2009. Includes full and part time undergraduate students on Design Studies courses in the UK. 2. Source: Labour Force Survey 2008
Where do design businesses recruit from? Of those businesses that did recruit, just over 40% recruited designers from college or university. College or university 43%
Other design consultancies 30%
Freelance designers 15%
In-house design teams 14%
Elsewhere 17%
How satisfied are employers with the quality of their graduate recruits? Levels of satisfaction with graduate recruits is high. Completely satisfied 56%
Quite satisfied 39%
Not very satisfied/not satisfied at all 5%
How satisfied were employers with the quality of their experienced hires? Just over three quarters of employers were completely satisfied with the quality of their experienced hires. Completely satisfied 76%
Quite satisfied 22%
Not very satisfied 2%
Design Design businesses ‘09 businesses ‘05
Work placements, internships, apprenticeships 35% 12%
Visiting lecturer/teacher 27% 13%
Part-time lecturer/teacher 14% 39%
Mentor 13% 12%
Research projects 6% 13%
Knowledge Transfer Programmes 5% –
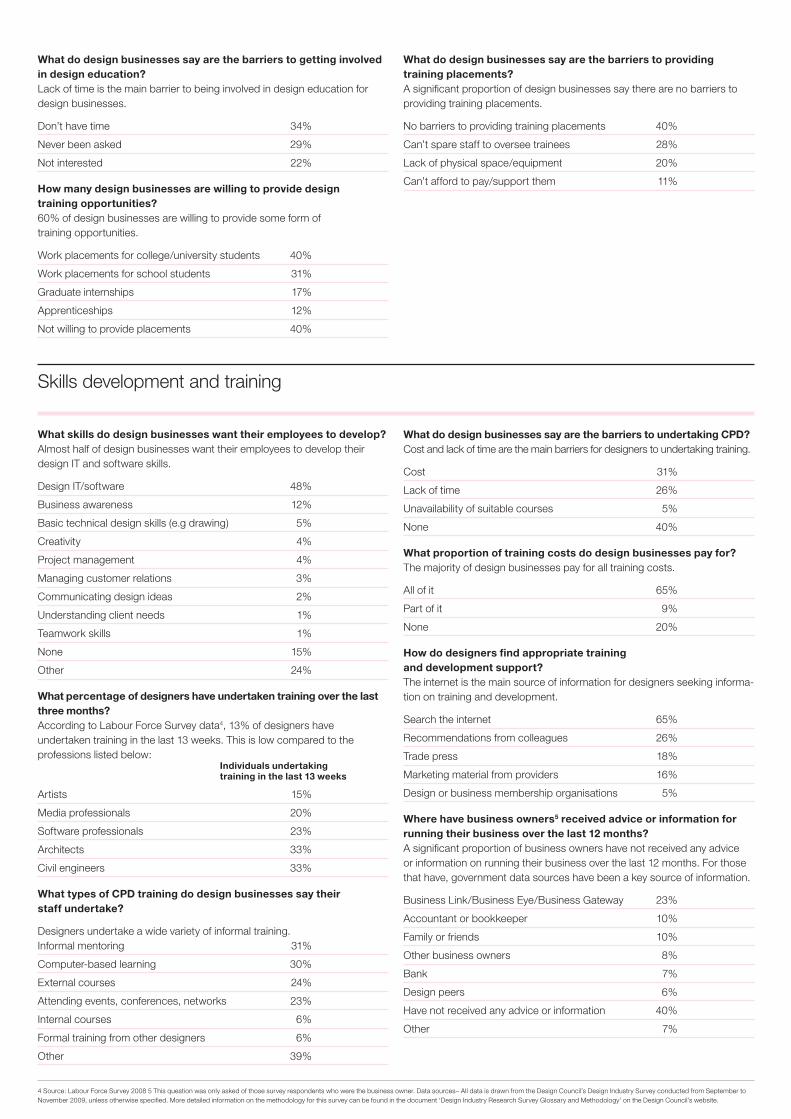
What skills do design businesses want their employees to develop? Almost half of design businesses want their employees to develop their design IT and software skills. Design IT/software 48%
Business awareness 12%
Basic technical design skills (e.g drawing) 5%
Creativity 4%
Project management 4%
Managing customer relations 3%
Communicating design ideas 2%
Understanding client needs 1%
Teamwork skills 1%
None 15%
Other 24%
What percentage of designers have undertaken training over the last three months? According to Labour Force Survey data4, 13% of designers have undertaken training in the last 13 weeks. This is low compared to the professions listed below: Individuals undertaking training in the last 13 weeks
Artists 15%
Media professionals 20%
Software professionals 23%
Architects 33%
Civil engineers 33%
What types of CPD training do design businesses say their staff undertake? Designers undertake a wide variety of informal training. Informal mentoring 31%
Computer-based learning 30%
External courses 24%
Attending events, conferences, networks 23%
Internal courses 6%
Formal training from other designers 6%
Other 39%
Skills development and training
4 Source: Labour Force Survey 2008 5 This question was only asked of those survey respondents who were the business owner. Data sources– All data is drawn from the Design Council’s Design Industry Survey conducted from September to November 2009, unless otherwise specified. More detailed information on the methodology for this survey can be found in the document ‘Design Industry Research Survey Glossary and Methodology’ on the Design Council’s website.
What do design businesses say are the barriers to undertaking CPD? Cost and lack of time are the main barriers for designers to undertaking training. Cost 31%
Lack of time 26%
Unavailability of suitable courses 5%
None 40%
What proportion of training costs do design businesses pay for? The majority of design businesses pay for all training costs. All of it 65%
Part of it 9%
None 20%
How do designers find appropriate training and development support? The internet is the main source of information for designers seeking informa-tion on training and development. Search the internet 65%
Recommendations from colleagues 26%
Trade press 18%
Marketing material from providers 16%
Design or business membership organisations 5%
Where have business owners5 received advice or information for running their business over the last 12 months? A significant proportion of business owners have not received any advice or information on running their business over the last 12 months. For those that have, government data sources have been a key source of information. Business Link/Business Eye/Business Gateway 23%
Accountant or bookkeeper 10%
Family or friends 10%
Other business owners 8%
Bank 7%
Design peers 6%
Have not received any advice or information 40%
Other 7%
What do design businesses say are the barriers to getting involved in design education? Lack of time is the main barrier to being involved in design education for design businesses. Don’t have time 34%
Never been asked 29%
Not interested 22%
How many design businesses are willing to provide design training opportunities?60% of design businesses are willing to provide some form of training opportunities. Work placements for college/university students 40%
Work placements for school students 31%
Graduate internships 17%
Apprenticeships 12%
Not willing to provide placements 40%
What do design businesses say are the barriers to providing training placements? A significant proportion of design businesses say there are no barriers to providing training placements. No barriers to providing training placements 40%
Can’t spare staff to oversee trainees 28%
Lack of physical space/equipment 20%
Can’t afford to pay/support them 11%
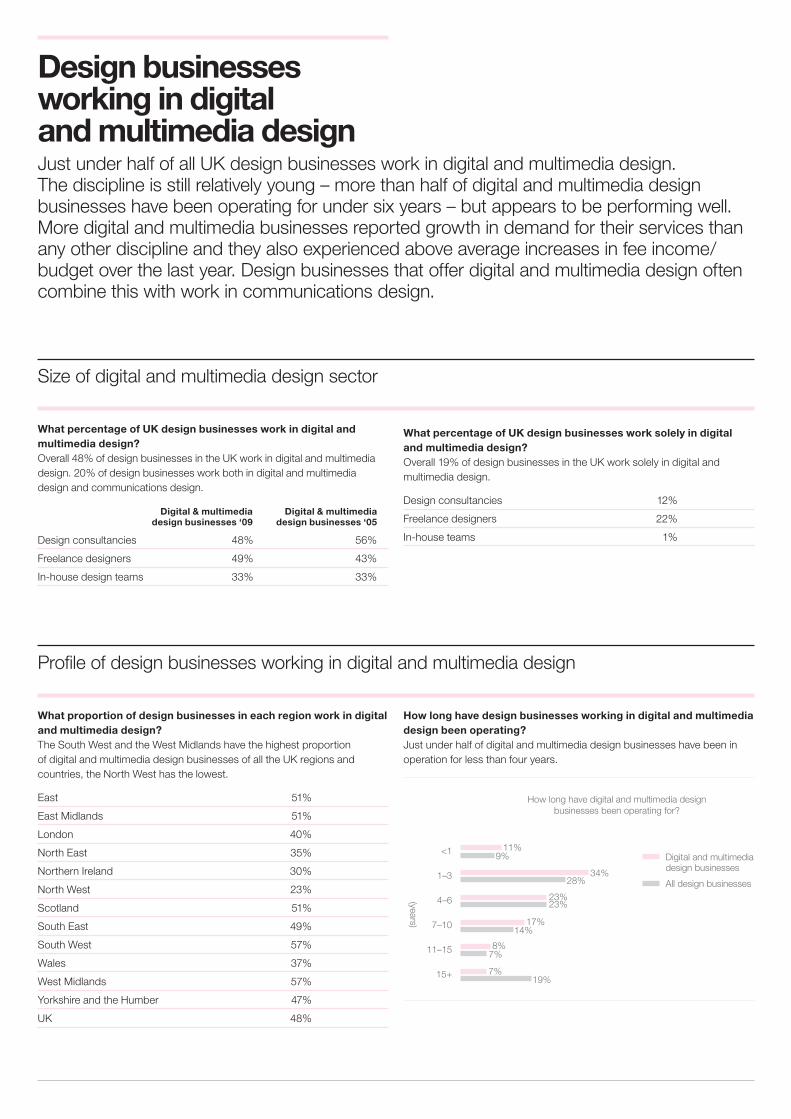
Design businesses working in digital and multimedia design Just under half of all UK design businesses work in digital and multimedia design. The discipline is still relatively young – more than half of digital and multimedia design businesses have been operating for under six years – but appears to be performing well. More digital and multimedia businesses reported growth in demand for their services than any other discipline and they also experienced above average increases in fee income/budget over the last year. Design businesses that offer digital and multimedia design often combine this with work in communications design.
What percentage of UK design businesses work in digital and multimedia design? Overall 48% of design businesses in the UK work in digital and multimedia design. 20% of design businesses work both in digital and multimedia design and communications design.
Digital & multimedia Digital & multimedia design businesses ‘09 design businesses ‘05
Design consultancies 48% 56%
Freelance designers 49% 43%
In-house design teams 33% 33%
Size of digital and multimedia design sector
Profile of design businesses working in digital and multimedia design
What percentage of UK design businesses work solely in digital and multimedia design? Overall 19% of design businesses in the UK work solely in digital and multimedia design.
Design consultancies 12%
Freelance designers 22%
In-house teams 1%
What proportion of design businesses in each region work in digital and multimedia design? The South West and the West Midlands have the highest proportion of digital and multimedia design businesses of all the UK regions and countries, the North West has the lowest.
East 51%
East Midlands 51%
London 40%
North East 35%
Northern Ireland 30%
North West 23%
Scotland 51%
South East 49%
South West 57%
Wales 37%
West Midlands 57%
Yorkshire and the Humber 47%
UK 48%
How long have design businesses working in digital and multimedia design been operating? Just under half of digital and multimedia design businesses have been in operation for less than four years.
How long have digital and multimedia design businesses been operating for?
<1
1–3
4–6
7–10
11–15
15+
All design businesses
11%
34%
9%
28%
23%
14%
7%
19%
23%
17%
8%
7%
(years)
Digital and multimedia design businesses
Financial performance of design businesses working in digital and multimedia design
1. Financial performance refers to annual fee income for design consultancies and freelancers, and budget for in house design teams.
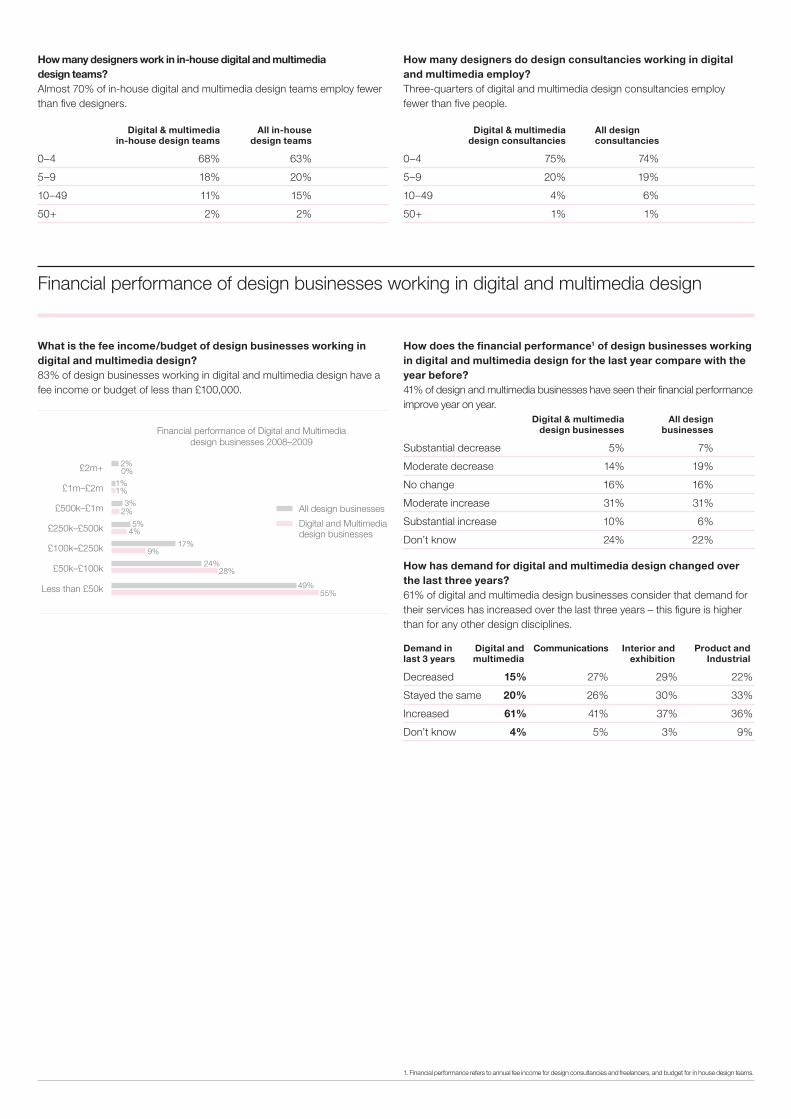
How many designers work in in-house digital and multimedia design teams? Almost 70% of in-house digital and multimedia design teams employ fewer than five designers.
Digital & multimedia All in-house in-house design teams design teams
0–4 68% 63%
5–9 18% 20%
10–49 11% 15%
50+ 2% 2%
What is the fee income/budget of design businesses working in digital and multimedia design? 83% of design businesses working in digital and multimedia design have a fee income or budget of less than £100,000.
How does the financial performance1 of design businesses working in digital and multimedia design for the last year compare with the year before?41% of design and multimedia businesses have seen their financial performance improve year on year. Digital & multimedia All design design businesses businesses
Substantial decrease 5% 7%
Moderate decrease 14% 19%
No change 16% 16%
Moderate increase 31% 31%
Substantial increase 10% 6%
Don’t know 24% 22%
How has demand for digital and multimedia design changed over the last three years? 61% of digital and multimedia design businesses consider that demand for their services has increased over the last three years – this figure is higher than for any other design disciplines.
Demand in Digital and Communications Interior and Product and last 3 years multimedia exhibition Industrial
Decreased 15% 27% 29% 22%
Stayed the same 20% 26% 30% 33%
Increased 61% 41% 37% 36%
Don’t know 4% 5% 3% 9%
How many designers do design consultancies working in digital and multimedia employ? Three-quarters of digital and multimedia design consultancies employ fewer than five people.
Digital & multimedia All design design consultancies consultancies
0–4 75% 74%
5–9 20% 19%
10–49 4% 6%
50+ 1% 1%
Financial performance of Digital and Multimedia design businesses 2008–2009
£2m+
£1m–£2m
£500k–£1m
£250k–£500k
£100k–£250k
£50k–£100k
55%49%
24%28%
17%
5%
3%
2%
1%
9%
4%
2%
1%
0%
All design businesses
Digital and Multimedia design businesses
Less than £50k
Job market for design businesses working in digital and multimedia design
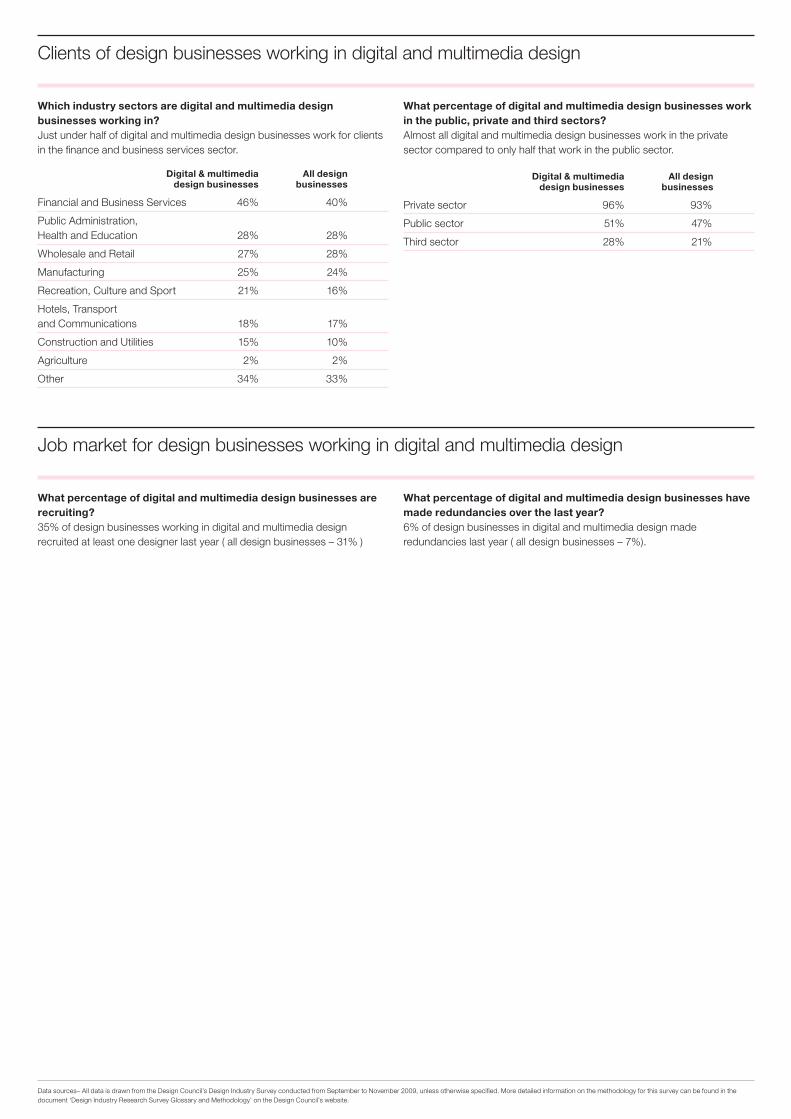
What percentage of digital and multimedia design businesses are recruiting? 35% of design businesses working in digital and multimedia design recruited at least one designer last year ( all design businesses – 31% )
What percentage of digital and multimedia design businesses have made redundancies over the last year? 6% of design businesses in digital and multimedia design made redundancies last year ( all design businesses – 7%).
Clients of design businesses working in digital and multimedia design
Which industry sectors are digital and multimedia design businesses working in? Just under half of digital and multimedia design businesses work for clients in the finance and business services sector.
Digital & multimedia All design design businesses businesses
Financial and Business Services 46% 40%
Public Administration, Health and Education 28% 28%
Wholesale and Retail 27% 28%
Manufacturing 25% 24%
Recreation, Culture and Sport 21% 16%
Hotels, Transport and Communications 18% 17%
Construction and Utilities 15% 10%
Agriculture 2% 2%
Other 34% 33%
What percentage of digital and multimedia design businesses work in the public, private and third sectors?Almost all digital and multimedia design businesses work in the private sector compared to only half that work in the public sector.
Digital & multimedia All design design businesses businesses
Private sector 96% 93%
Public sector 51% 47%
Third sector 28% 21%
Data sources– All data is drawn from the Design Council’s Design Industry Survey conducted from September to November 2009, unless otherwise specified. More detailed information on the methodology for this survey can be found in the document ‘Design Industry Research Survey Glossary and Methodology’ on the Design Council’s website.
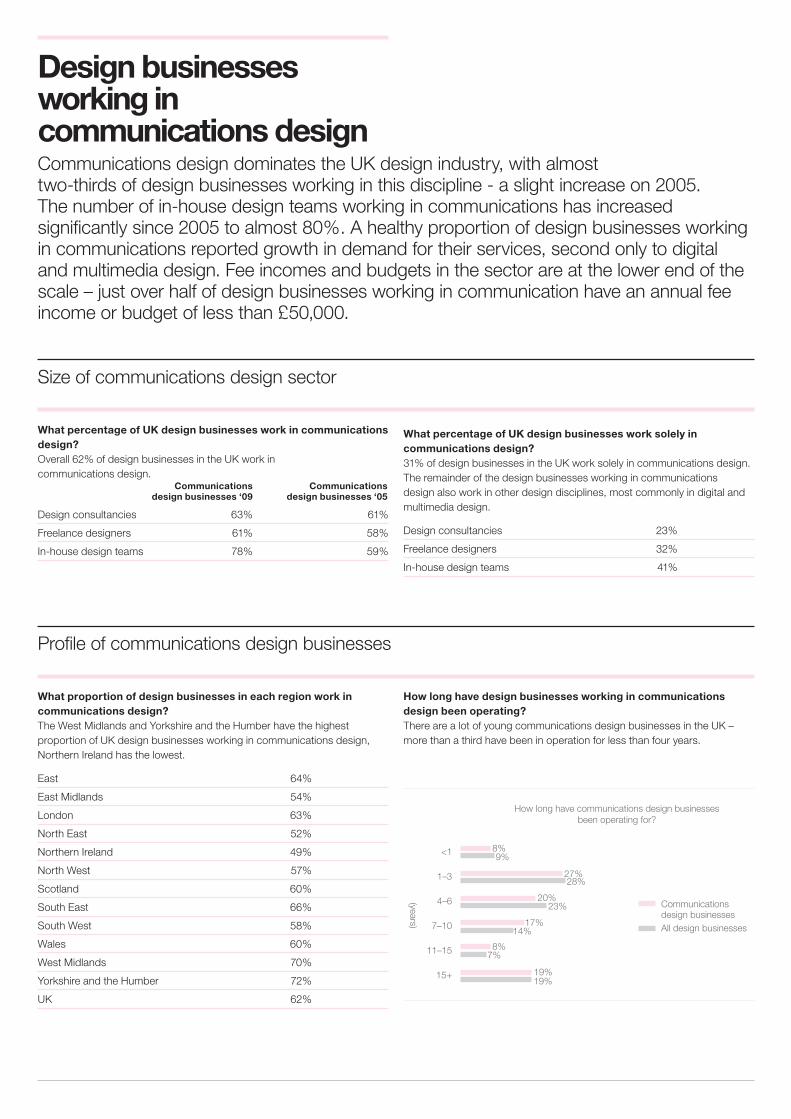
Design businesses working in communications designCommunications design dominates the UK design industry, with almost two-thirds of design businesses working in this discipline - a slight increase on 2005. The number of in-house design teams working in communications has increased significantly since 2005 to almost 80%. A healthy proportion of design businesses working in communications reported growth in demand for their services, second only to digital and multimedia design. Fee incomes and budgets in the sector are at the lower end of the scale – just over half of design businesses working in communication have an annual fee income or budget of less than £50,000.
What percentage of UK design businesses work in communications design? Overall 62% of design businesses in the UK work in communications design. Communications Communications design businesses ‘09 design businesses ‘05
Design consultancies 63% 61%
Freelance designers 61% 58%
In-house design teams 78% 59%
Size of communications design sector
Profile of communications design businesses
What percentage of UK design businesses work solely in communications design? 31% of design businesses in the UK work solely in communications design. The remainder of the design businesses working in communications design also work in other design disciplines, most commonly in digital and multimedia design.
Design consultancies 23%
Freelance designers 32%
In-house design teams 41%
What proportion of design businesses in each region work in communications design?The West Midlands and Yorkshire and the Humber have the highest proportion of UK design businesses working in communications design, Northern Ireland has the lowest.
East 64%
East Midlands 54%
London 63%
North East 52%
Northern Ireland 49%
North West 57%
Scotland 60%
South East 66%
South West 58%
Wales 60%
West Midlands 70%
Yorkshire and the Humber 72%
UK 62%
How long have design businesses working in communications design been operating? There are a lot of young communications design businesses in the UK – more than a third have been in operation for less than four years.
How long have communications design businesses been operating for?
<1
1–3
4–6
7–10
11–15
15+
All design businesses
8%
27%
9%
28%
23%
14%
7%
19%
20%
17%
8%
19%
(years)
Communications design businesses
Financial performance of design businesses working in communications design
How many designers work in in-house communications design teams? Just under three quarters of in-house design teams working in communications design employ fewer than four designers.
Communications All in-house in-house design teams design teams
0–4 71% 63%
5–9 18% 20%
10–49 10% 15%
50+ 1% 2%
How many designers do design consultancies working in communications design employ? Three quarters of design consultancies working in communications design employ fewer than five designers, almost all employ fewer than 10.
Communications All design design consultancies consultancies
0–4 74% 74%
5–9 22% 19%
10–49 4% 6%
50+ 0% 1%
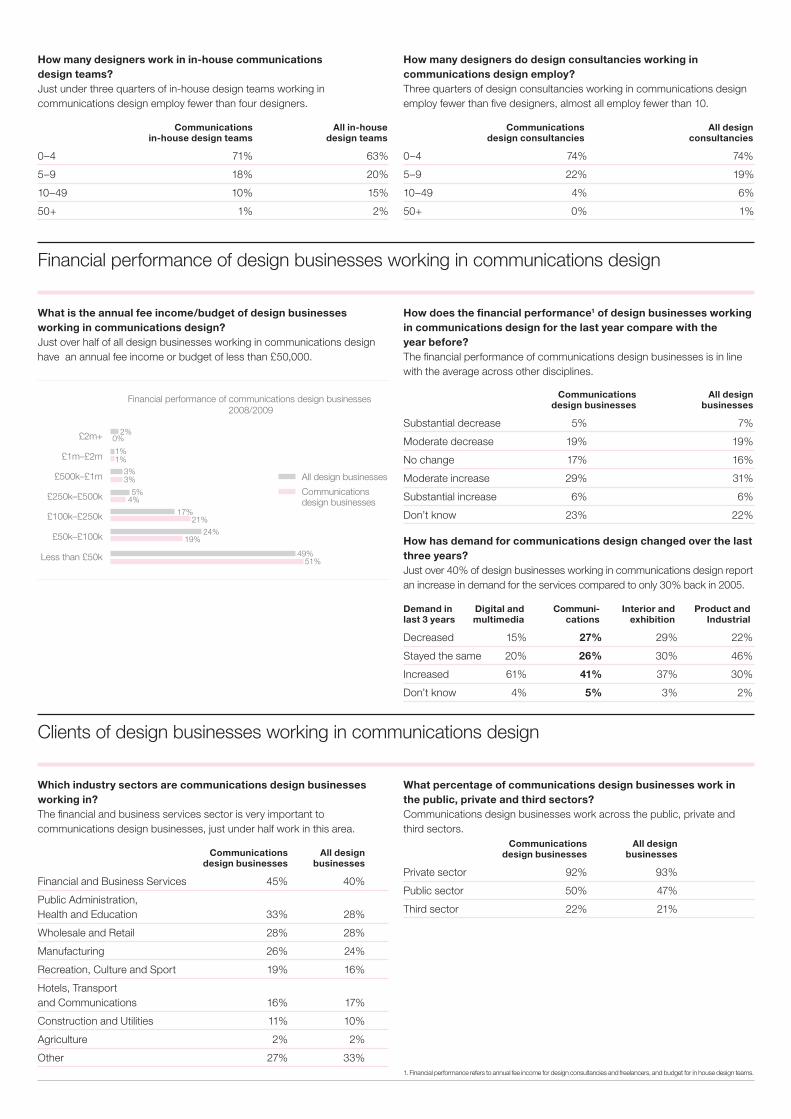
What is the annual fee income/budget of design businesses working in communications design? Just over half of all design businesses working in communications design have an annual fee income or budget of less than £50,000.
How does the financial performance1 of design businesses working in communications design for the last year compare with the year before?The financial performance of communications design businesses is in line with the average across other disciplines. Communications All design design businesses businesses
Substantial decrease 5% 7%
Moderate decrease 19% 19%
No change 17% 16%
Moderate increase 29% 31%
Substantial increase 6% 6%
Don’t know 23% 22%
How has demand for communications design changed over the last three years? Just over 40% of design businesses working in communications design report an increase in demand for the services compared to only 30% back in 2005.
Demand in Digital and Communi- Interior and Product and last 3 years multimedia cations exhibition Industrial
Decreased 15% 27% 29% 22%
Stayed the same 20% 26% 30% 46%
Increased 61% 41% 37% 30%
Don’t know 4% 5% 3% 2%
Clients of design businesses working in communications design
Which industry sectors are communications design businesses working in? The financial and business services sector is very important to communications design businesses, just under half work in this area.
Communications All design design businesses businesses
Financial and Business Services 45% 40%
Public Administration, Health and Education 33% 28%
Wholesale and Retail 28% 28%
Manufacturing 26% 24%
Recreation, Culture and Sport 19% 16%
Hotels, Transport and Communications 16% 17%
Construction and Utilities 11% 10%
Agriculture 2% 2%
Other 27% 33%
What percentage of communications design businesses work in the public, private and third sectors?Communications design businesses work across the public, private and third sectors. Communications All design design businesses businesses
Private sector 92% 93%
Public sector 50% 47%
Third sector 22% 21%
1. Financial performance refers to annual fee income for design consultancies and freelancers, and budget for in house design teams.
Financial performance of communications design businesses 2008/2009
£2m+
£1m–£2m
£500k–£1m
£250k–£500k
£100k–£250k
£50k–£100k
51%49%
24%19%
17%
5%
3%
2%
1%
21%
4%
3%
0%
1%
All design businesses
Communications design businesses
Less than £50k
Job market for design businesses working in communications design
What percentage of communications design businesses are recruiting? 29% of design businesses working in communications design recruited at least one designer last year (all disciplines –31%).
What percentage of communications design businesses have made redundancies over the last year? 7% of design businesses in communications design made redundancies last year (all disciplines –7%).
Data sources– All data is drawn from the Design Council’s Design Industry Survey conducted from September to November 2009, unless otherwise specified. More detailed information on the methodology for this survey can be found in the document ‘Design Industry Research Survey Glossary and Methodology’ on the Design Council’s website.
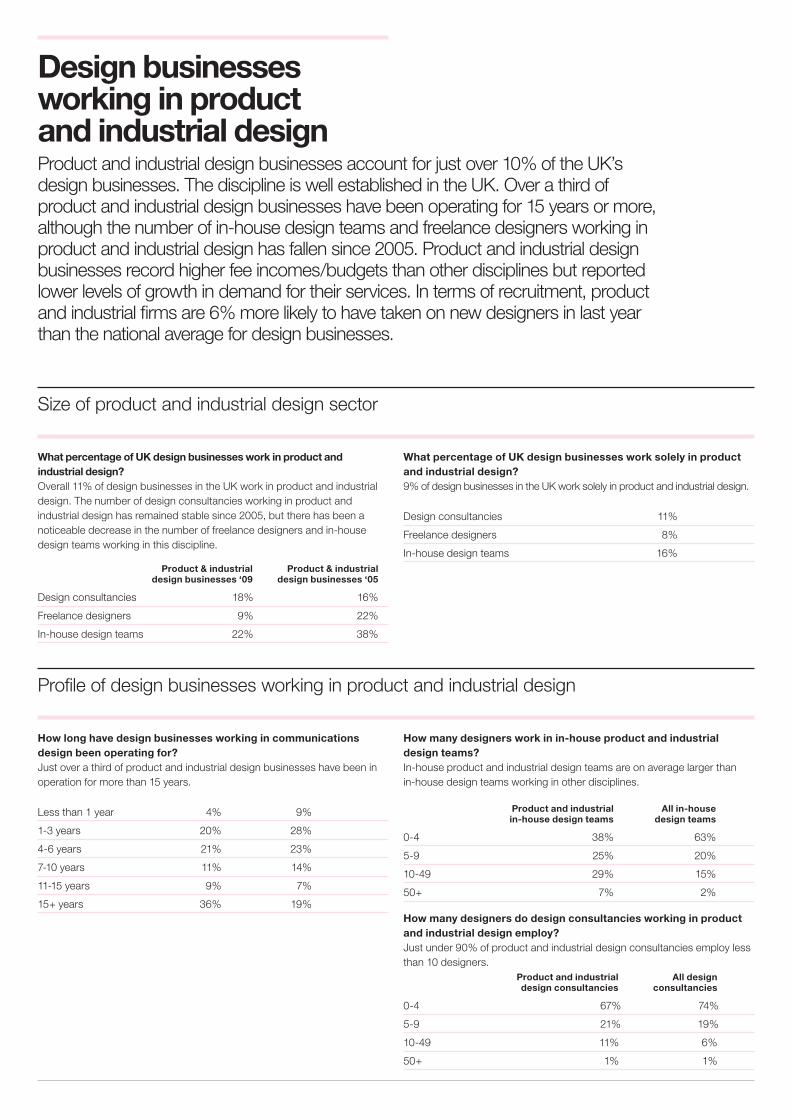
Design businesses working in product and industrial designProduct and industrial design businesses account for just over 10% of the UK’s design businesses. The discipline is well established in the UK. Over a third of product and industrial design businesses have been operating for 15 years or more, although the number of in-house design teams and freelance designers working in product and industrial design has fallen since 2005. Product and industrial design businesses record higher fee incomes/budgets than other disciplines but reported lower levels of growth in demand for their services. In terms of recruitment, product and industrial firms are 6% more likely to have taken on new designers in last year than the national average for design businesses.
What percentage of UK design businesses work in product and industrial design? Overall 11% of design businesses in the UK work in product and industrial design. The number of design consultancies working in product and industrial design has remained stable since 2005, but there has been a noticeable decrease in the number of freelance designers and in-house design teams working in this discipline.
Product & industrial Product & industrial design businesses ‘09 design businesses ‘05
Design consultancies 18% 16%
Freelance designers 9% 22%
In-house design teams 22% 38%
How long have design businesses working in communications design been operating for? Just over a third of product and industrial design businesses have been in operation for more than 15 years.
Less than 1 year 4% 9%
1-3 years 20% 28%
4-6 years 21% 23%
7-10 years 11% 14%
11-15 years 9% 7%
15+ years 36% 19%
Size of product and industrial design sector
Profile of design businesses working in product and industrial design
What percentage of UK design businesses work solely in product and industrial design? 9% of design businesses in the UK work solely in product and industrial design.
Design consultancies 11%
Freelance designers 8%
In-house design teams 16%
How many designers work in in-house product and industrial design teams? In-house product and industrial design teams are on average larger than in-house design teams working in other disciplines.
Product and industrial All in-house in-house design teams design teams
0-4 38% 63%
5-9 25% 20%
10-49 29% 15%
50+ 7% 2%
How many designers do design consultancies working in product and industrial design employ? Just under 90% of product and industrial design consultancies employ less than 10 designers. Product and industrial All design design consultancies consultancies
0-4 67% 74%
5-9 21% 19%
10-49 11% 6%
50+ 1% 1%
Financial performance of businesses working in product and industrial design
Clients of design businesses working in product and industrial design
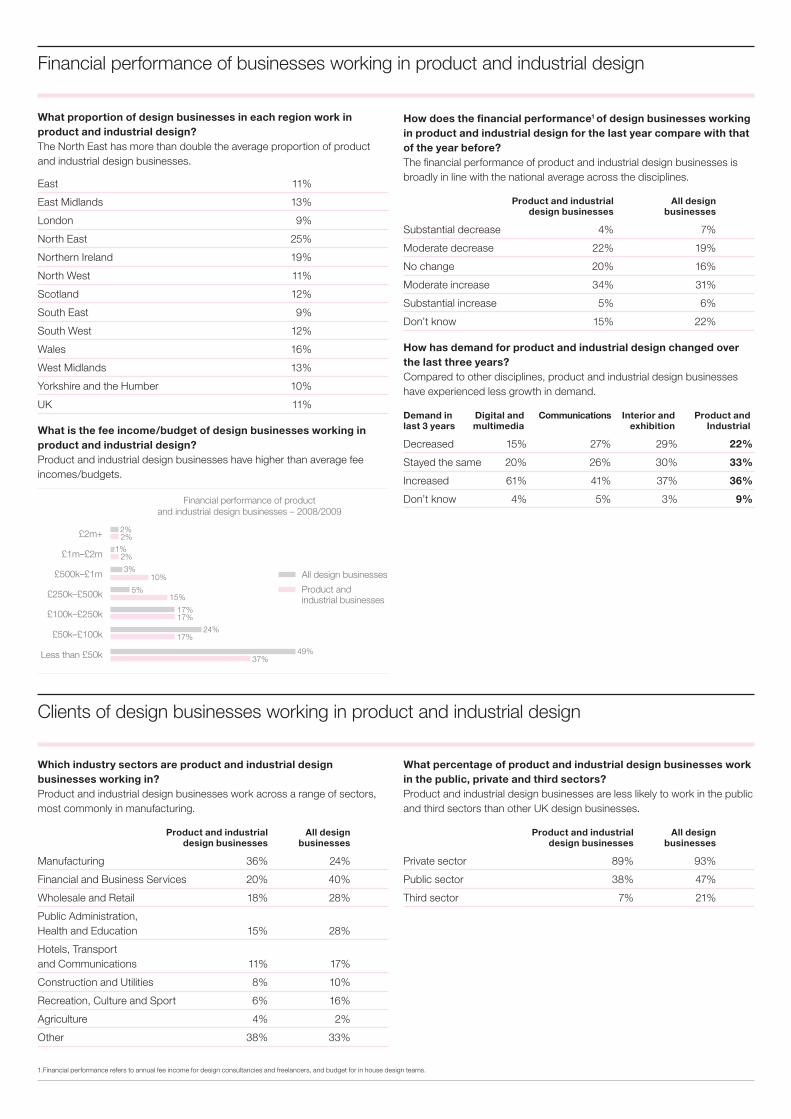
What proportion of design businesses in each region work in product and industrial design? The North East has more than double the average proportion of product and industrial design businesses. East 11%
East Midlands 13%
London 9%
North East 25%
Northern Ireland 19%
North West 11%
Scotland 12%
South East 9%
South West 12%
Wales 16%
West Midlands 13%
Yorkshire and the Humber 10%
UK 11%
What is the fee income/budget of design businesses working in product and industrial design?Product and industrial design businesses have higher than average fee incomes/budgets.
How does the financial performance1 of design businesses working in product and industrial design for the last year compare with that of the year before? The financial performance of product and industrial design businesses is broadly in line with the national average across the disciplines.
Product and industrial All design design businesses businesses
Substantial decrease 4% 7%
Moderate decrease 22% 19%
No change 20% 16%
Moderate increase 34% 31%
Substantial increase 5% 6%
Don’t know 15% 22%
How has demand for product and industrial design changed over the last three years? Compared to other disciplines, product and industrial design businesses have experienced less growth in demand.
Demand in Digital and Communications Interior and Product and last 3 years multimedia exhibition Industrial
Decreased 15% 27% 29% 22%
Stayed the same 20% 26% 30% 33%
Increased 61% 41% 37% 36%
Don’t know 4% 5% 3% 9%
1.Financial performance refers to annual fee income for design consultancies and freelancers, and budget for in house design teams.
Which industry sectors are product and industrial design businesses working in? Product and industrial design businesses work across a range of sectors, most commonly in manufacturing.
Product and industrial All design design businesses businesses
Manufacturing 36% 24%
Financial and Business Services 20% 40%
Wholesale and Retail 18% 28%
Public Administration, Health and Education 15% 28%
Hotels, Transport and Communications 11% 17%
Construction and Utilities 8% 10%
Recreation, Culture and Sport 6% 16%
Agriculture 4% 2%
Other 38% 33%
What percentage of product and industrial design businesses work in the public, private and third sectors? Product and industrial design businesses are less likely to work in the public and third sectors than other UK design businesses.
Product and industrial All design design businesses businesses
Private sector 89% 93%
Public sector 38% 47%
Third sector 7% 21%
Financial performance of product and industrial design businesses – 2008/2009
£2m+
£1m–£2m
£500k–£1m
£250k–£500k
£100k–£250k
£50k–£100k
37%49%
24%17%
17%
5%
3%
2%
1%
17%
15%
10%
2%
2%
All design businesses
Product and industrial businesses
Less than £50k
Job market for design businesses working in product and industrial design
What percentage of product and industrial design businesses are recruiting? 37% of design businesses working in product and industrial design recruited at least one designer last year ( all design businesses – 31% )
What percentage of product and industrial design businesses have made redundancies over the last year? 10% of design businesses in product and industrial design made redundancies last year ( all design businesses – 7% )
Data sources– All data is drawn from the Design Council’s Design Industry Survey conducted from September to November 2009, unless otherwise specified. More detailed information on the methodology for this survey can be found in the document ‘Design Industry Research Survey Glossary and Methodology’ on the Design Council’s website.
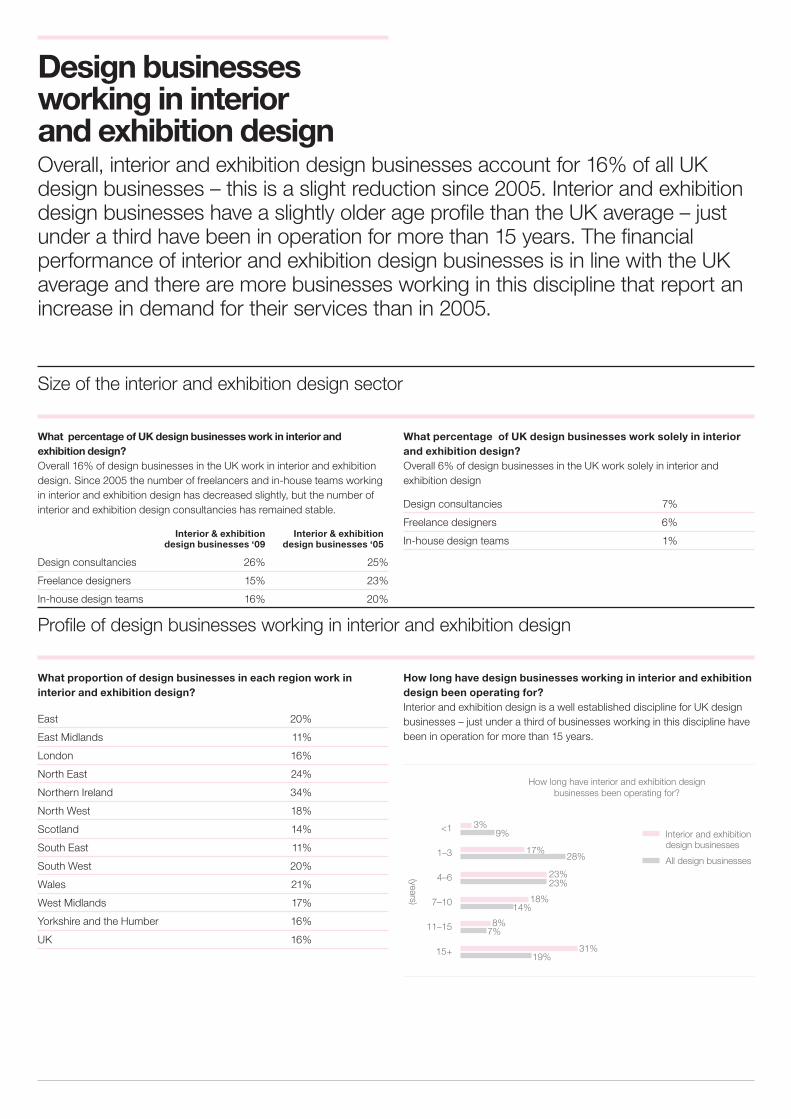
Design businesses working in interior and exhibition designOverall, interior and exhibition design businesses account for 16% of all UK design businesses – this is a slight reduction since 2005. Interior and exhibition design businesses have a slightly older age profile than the UK average – just under a third have been in operation for more than 15 years. The financial performance of interior and exhibition design businesses is in line with the UK average and there are more businesses working in this discipline that report an increase in demand for their services than in 2005.
What percentage of UK design businesses work in interior and exhibition design? Overall 16% of design businesses in the UK work in interior and exhibition design. Since 2005 the number of freelancers and in-house teams working in interior and exhibition design has decreased slightly, but the number of interior and exhibition design consultancies has remained stable.
Interior & exhibition Interior & exhibition design businesses ‘09 design businesses ‘05
Design consultancies 26% 25%
Freelance designers 15% 23%
In-house design teams 16% 20%
Size of the interior and exhibition design sector
Profile of design businesses working in interior and exhibition design
What percentage of UK design businesses work solely in interior and exhibition design?Overall 6% of design businesses in the UK work solely in interior and exhibition design
Design consultancies 7%
Freelance designers 6%
In-house design teams 1%
What proportion of design businesses in each region work in interior and exhibition design?
East 20%
East Midlands 11%
London 16%
North East 24%
Northern Ireland 34%
North West 18%
Scotland 14%
South East 11%
South West 20%
Wales 21%
West Midlands 17%
Yorkshire and the Humber 16%
UK 16%
How long have design businesses working in interior and exhibition design been operating for? Interior and exhibition design is a well established discipline for UK design businesses – just under a third of businesses working in this discipline have been in operation for more than 15 years.
How long have interior and exhibition design businesses been operating for?
<1
1–3
4–6
7–10
11–15
15+
All design businesses
3%
17%
9%
28%
23%
14%
7%
19%
23%
18%
8%
31%
(years)
Interior and exhibition design businesses
Financial performance of design businesses working in interior and exhibition design
Clients of design businesses working in interior and exhibition design
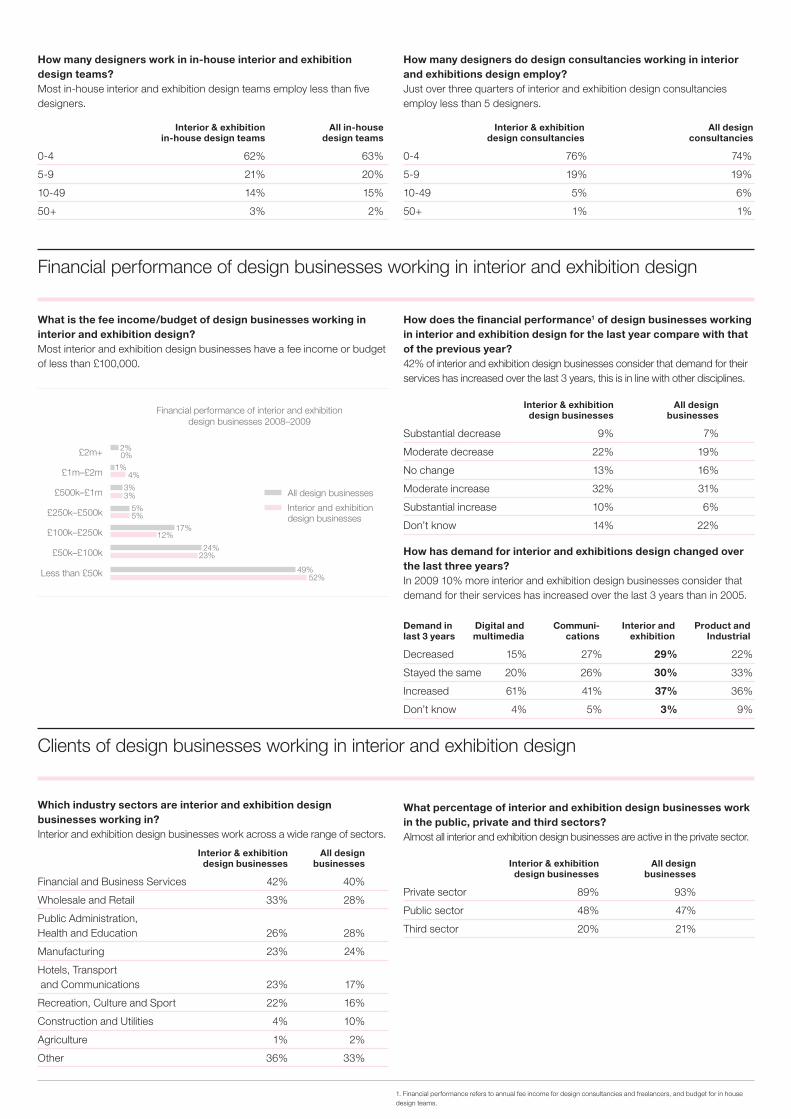
How many designers work in in-house interior and exhibition design teams? Most in-house interior and exhibition design teams employ less than five designers.
Interior & exhibition All in-house in-house design teams design teams
0-4 62% 63%
5-9 21% 20%
10-49 14% 15%
50+ 3% 2%
How many designers do design consultancies working in interior and exhibitions design employ? Just over three quarters of interior and exhibition design consultancies employ less than 5 designers.
Interior & exhibition All design design consultancies consultancies
0-4 76% 74%
5-9 19% 19%
10-49 5% 6%
50+ 1% 1%
What is the fee income/budget of design businesses working in interior and exhibition design? Most interior and exhibition design businesses have a fee income or budget of less than £100,000.
How does the financial performance1 of design businesses working in interior and exhibition design for the last year compare with that of the previous year? 42% of interior and exhibition design businesses consider that demand for their services has increased over the last 3 years, this is in line with other disciplines.
Interior & exhibition All design design businesses businesses
Substantial decrease 9% 7%
Moderate decrease 22% 19%
No change 13% 16%
Moderate increase 32% 31%
Substantial increase 10% 6%
Don’t know 14% 22%
How has demand for interior and exhibitions design changed over the last three years? In 2009 10% more interior and exhibition design businesses consider that demand for their services has increased over the last 3 years than in 2005.
Demand in Digital and Communi- Interior and Product and last 3 years multimedia cations exhibition Industrial
Decreased 15% 27% 29% 22%
Stayed the same 20% 26% 30% 33%
Increased 61% 41% 37% 36%
Don’t know 4% 5% 3% 9%
Which industry sectors are interior and exhibition design businesses working in? Interior and exhibition design businesses work across a wide range of sectors.
Interior & exhibition All design design businesses businesses
Financial and Business Services 42% 40%
Wholesale and Retail 33% 28%
Public Administration, Health and Education 26% 28%
Manufacturing 23% 24%
Hotels, Transport and Communications 23% 17%
Recreation, Culture and Sport 22% 16%
Construction and Utilities 4% 10%
Agriculture 1% 2%
Other 36% 33%
What percentage of interior and exhibition design businesses work in the public, private and third sectors? Almost all interior and exhibition design businesses are active in the private sector.
Interior & exhibition All design design businesses businesses
Private sector 89% 93%
Public sector 48% 47%
Third sector 20% 21%
Financial performance of interior and exhibition design businesses 2008–2009
£2m+
£1m–£2m
£500k–£1m
£250k–£500k
£100k–£250k
£50k–£100k
52%49%
24%23%
17%
5%
3%
2%
1%
12%
5%
3%
4%
0%
All design businesses
Interior and exhibition design businesses
Less than £50k
1. Financial performance refers to annual fee income for design consultancies and freelancers, and budget for in house design teams.
Job market for design businesses working in interior and exhibitions design
What percentage of interior and exhibition design businesses are recruiting? 30% of design businesses working in interior and exhibition design recruited at least one designer last year ( all design businesses – 31% )
What percentage of interior and exhibition design businesses have made redundancies over the last year? 7% of design businesses in interior and exhibition design made redundancies last year ( all design businesses – 7% )
Data sources– All data is drawn from the Design Council’s Design Industry Survey conducted from September to November 2009, unless otherwise specified. More detailed information on the methodology for this survey can be found in the document ‘Design Industry Research Survey Glossary and Methodology’ on the Design Council’s website.
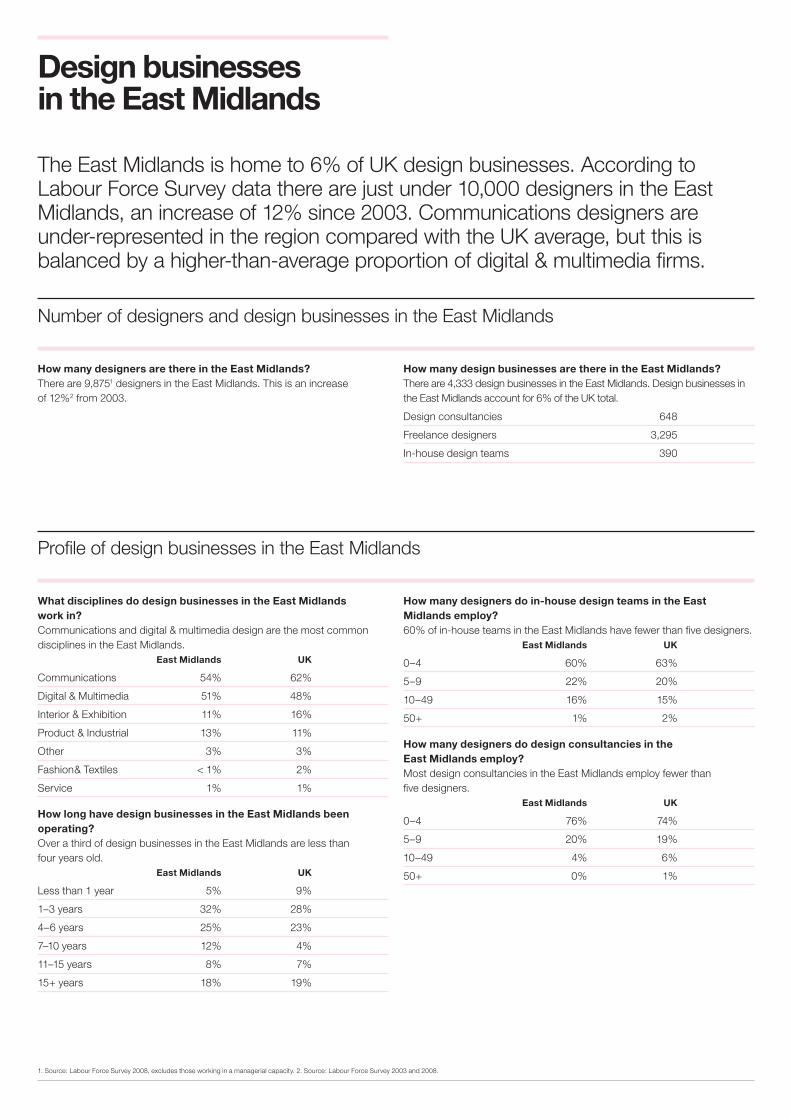
Design businesses in the East Midlands
The East Midlands is home to 6% of UK design businesses. According to Labour Force Survey data there are just under 10,000 designers in the East Midlands, an increase of 12% since 2003. Communications designers are under-represented in the region compared with the UK average, but this is balanced by a higher-than-average proportion of digital & multimedia firms.
How many designers are there in the East Midlands?There are 9,8751 designers in the East Midlands. This is an increase of 12%2 from 2003.
What disciplines do design businesses in the East Midlands work in?Communications and digital & multimedia design are the most common disciplines in the East Midlands. East Midlands UK
Communications 54% 62%
Digital & Multimedia 51% 48%
Interior & Exhibition 11% 16%
Product & Industrial 13% 11%
Other 3% 3%
Fashion& Textiles < 1% 2%
Service 1% 1%
How long have design businesses in the East Midlands been operating? Over a third of design businesses in the East Midlands are less than four years old. East Midlands UK
Less than 1 year 5% 9%
1–3 years 32% 28%
4–6 years 25% 23%
7–10 years 12% 4%
11–15 years 8% 7%
15+ years 18% 19%
How many designers do in-house design teams in the East Midlands employ?60% of in-house teams in the East Midlands have fewer than five designers. East Midlands UK
0–4 60% 63%
5–9 22% 20%
10–49 16% 15%
50+ 1% 2%
How many designers do design consultancies in the East Midlands employ?Most design consultancies in the East Midlands employ fewer than five designers. East Midlands UK
0–4 76% 74%
5–9 20% 19%
10–49 4% 6%
50+ 0% 1%
Number of designers and design businesses in the East Midlands
How many design businesses are there in the East Midlands? There are 4,333 design businesses in the East Midlands. Design businesses in the East Midlands account for 6% of the UK total.
Design consultancies 648
Freelance designers 3,295
In-house design teams 390
Profile of design businesses in the East Midlands
1. Source: Labour Force Survey 2008, excludes those working in a managerial capacity. 2. Source: Labour Force Survey 2003 and 2008.
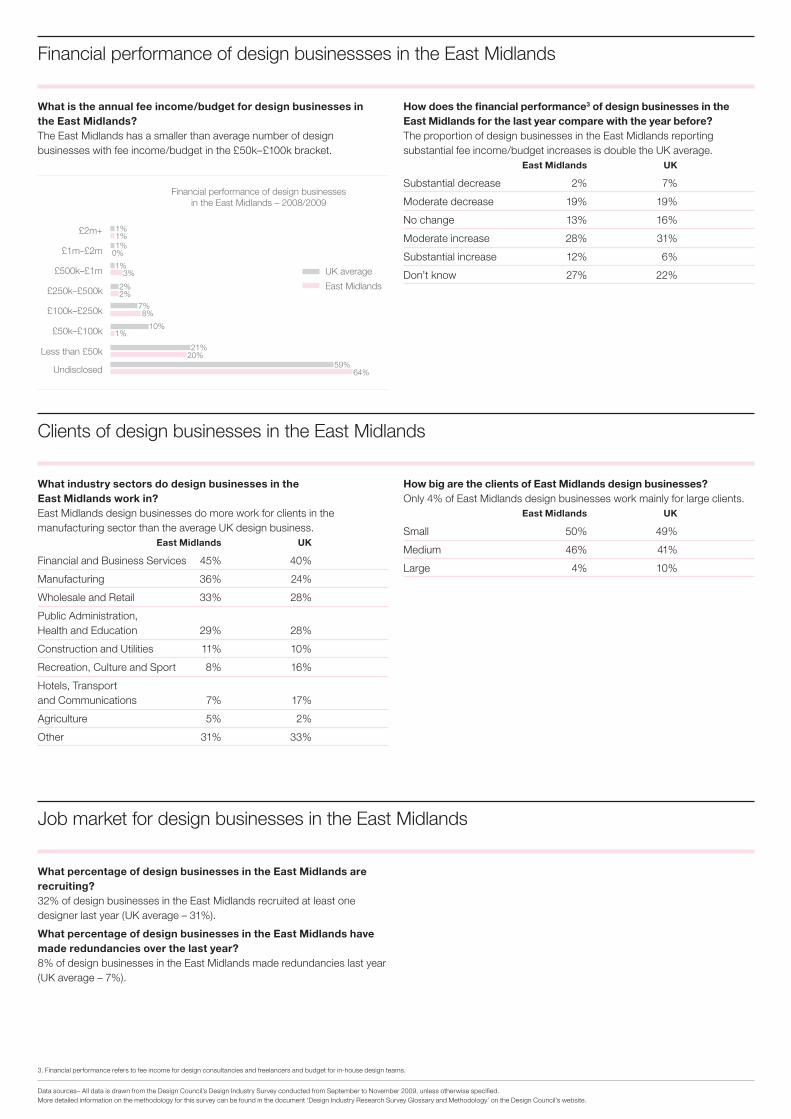
What is the annual fee income/budget for design businesses in the East Midlands?The East Midlands has a smaller than average number of design businesses with fee income/budget in the £50k–£100k bracket.
How does the financial performance3 of design businesses in the East Midlands for the last year compare with the year before? The proportion of design businesses in the East Midlands reporting substantial fee income/budget increases is double the UK average. East Midlands UK
Substantial decrease 2% 7%
Moderate decrease 19% 19%
No change 13% 16%
Moderate increase 28% 31%
Substantial increase 12% 6%
Don’t know 27% 22%
What industry sectors do design businesses in the East Midlands work in?East Midlands design businesses do more work for clients in the manufacturing sector than the average UK design business. East Midlands UK
Financial and Business Services 45% 40%
Manufacturing 36% 24%
Wholesale and Retail 33% 28%
Public Administration, Health and Education 29% 28%
Construction and Utilities 11% 10%
Recreation, Culture and Sport 8% 16%
Hotels, Transport and Communications 7% 17%
Agriculture 5% 2%
Other 31% 33%
How big are the clients of East Midlands design businesses? Only 4% of East Midlands design businesses work mainly for large clients. East Midlands UK
Small 50% 49%
Medium 46% 41%
Large 4% 10%
Financial performance of design businessses in the East Midlands
Clients of design businesses in the East Midlands
What percentage of design businesses in the East Midlands are recruiting? 32% of design businesses in the East Midlands recruited at least one designer last year (UK average – 31%).
What percentage of design businesses in the East Midlands have made redundancies over the last year? 8% of design businesses in the East Midlands made redundancies last year (UK average – 7%).
Job market for design businesses in the East Midlands
3. Financial performance refers to fee income for design consultancies and freelancers and budget for in-house design teams.
Data sources– All data is drawn from the Design Council’s Design Industry Survey conducted from September to November 2009, unless otherwise specified. More detailed information on the methodology for this survey can be found in the document ‘Design Industry Research Survey Glossary and Methodology’ on the Design Council’s website.
Financial performance of design businesses in the East Midlands – 2008/2009
£2m+
£1m–£2m
£500k–£1m
£250k–£500k
£100k–£250k
£50k–£100k
20%
64%
21%
59%
10%
7%
2%
1%
1%
1%
8%
2%
3%
1%
0%
1%
UK average
East Midlands
Less than £50k
Undisclosed
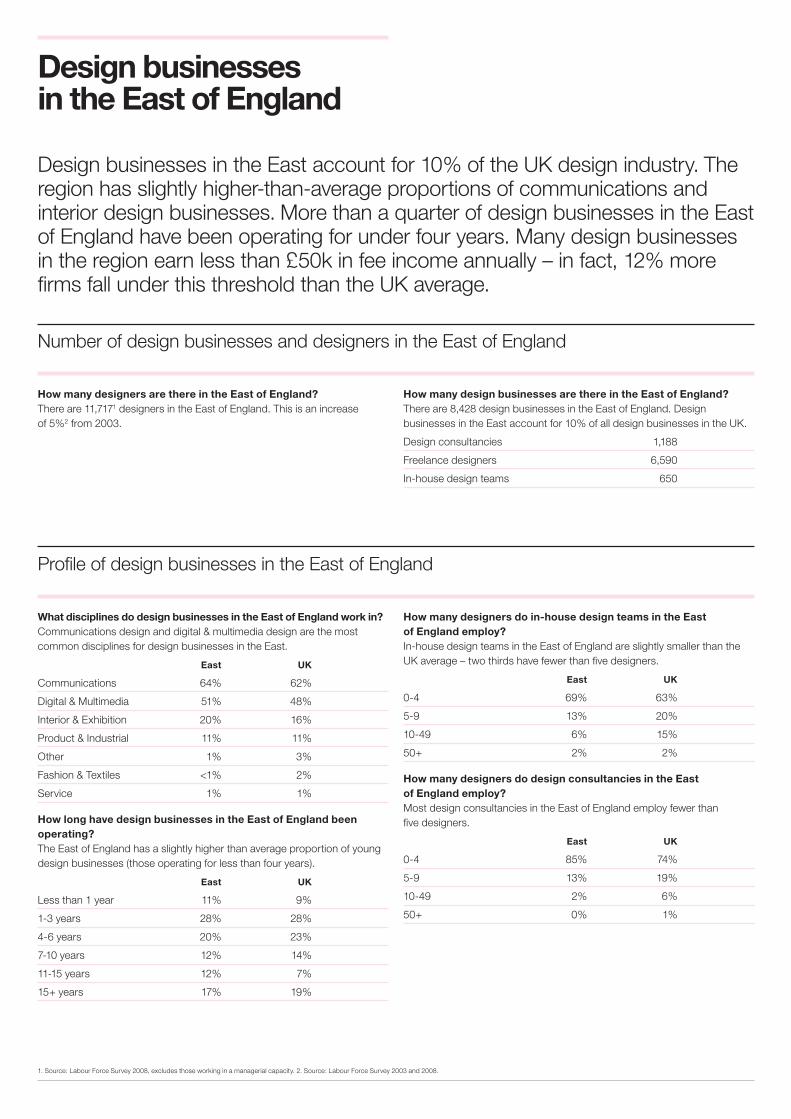
Design businesses in the East of England
Design businesses in the East account for 10% of the UK design industry. The region has slightly higher-than-average proportions of communications and interior design businesses. More than a quarter of design businesses in the East of England have been operating for under four years. Many design businesses in the region earn less than £50k in fee income annually – in fact, 12% more firms fall under this threshold than the UK average.
How many designers are there in the East of England? There are 11,7171 designers in the East of England. This is an increase of 5%2 from 2003.
What disciplines do design businesses in the East of England work in? Communications design and digital & multimedia design are the most common disciplines for design businesses in the East.
East UK
Communications 64% 62%
Digital & Multimedia 51% 48%
Interior & Exhibition 20% 16%
Product & Industrial 11% 11%
Other 1% 3%
Fashion & Textiles <1% 2%
Service 1% 1%
How long have design businesses in the East of England been operating?The East of England has a slightly higher than average proportion of young design businesses (those operating for less than four years).
East UK
Less than 1 year 11% 9%
1-3 years 28% 28%
4-6 years 20% 23%
7-10 years 12% 14%
11-15 years 12% 7%
15+ years 17% 19%
How many designers do in-house design teams in the East of England employ?In-house design teams in the East of England are slightly smaller than the UK average – two thirds have fewer than five designers.
East UK
0-4 69% 63%
5-9 13% 20%
10-49 6% 15%
50+ 2% 2%
How many designers do design consultancies in the East of England employ?Most design consultancies in the East of England employ fewer than five designers.
East UK
0-4 85% 74%
5-9 13% 19%
10-49 2% 6%
50+ 0% 1%
Number of design businesses and designers in the East of England
How many design businesses are there in the East of England?There are 8,428 design businesses in the East of England. Design businesses in the East account for 10% of all design businesses in the UK.
Design consultancies 1,188
Freelance designers 6,590
In-house design teams 650
Profile of design businesses in the East of England
1. Source: Labour Force Survey 2008, excludes those working in a managerial capacity. 2. Source: Labour Force Survey 2003 and 2008.
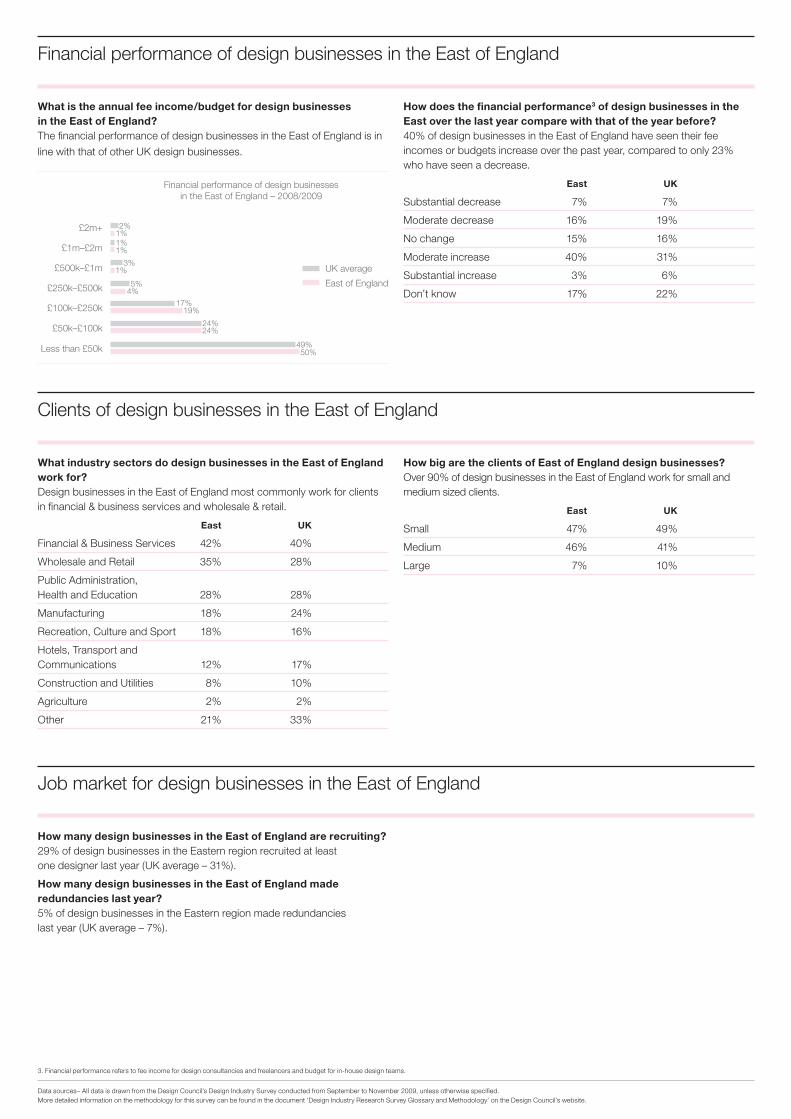
What is the annual fee income/budget for design businesses in the East of England?The financial performance of design businesses in the East of England is in
line with that of other UK design businesses.
How does the financial performance3 of design businesses in the East over the last year compare with that of the year before? 40% of design businesses in the East of England have seen their fee incomes or budgets increase over the past year, compared to only 23% who have seen a decrease.
East UK
Substantial decrease 7% 7%
Moderate decrease 16% 19%
No change 15% 16%
Moderate increase 40% 31%
Substantial increase 3% 6%
Don’t know 17% 22%
What industry sectors do design businesses in the East of England work for?Design businesses in the East of England most commonly work for clients in financial & business services and wholesale & retail.
East UK
Financial & Business Services 42% 40%
Wholesale and Retail 35% 28%
Public Administration, Health and Education 28% 28%
Manufacturing 18% 24%
Recreation, Culture and Sport 18% 16%
Hotels, Transport and Communications 12% 17%
Construction and Utilities 8% 10%
Agriculture 2% 2%
Other 21% 33%
How big are the clients of East of England design businesses?Over 90% of design businesses in the East of England work for small and medium sized clients.
East UK
Small 47% 49%
Medium 46% 41%
Large 7% 10%
Financial performance of design businesses in the East of England
Clients of design businesses in the East of England
How many design businesses in the East of England are recruiting?29% of design businesses in the Eastern region recruited at least one designer last year (UK average – 31%).
How many design businesses in the East of England made redundancies last year?5% of design businesses in the Eastern region made redundancies last year (UK average – 7%).
Job market for design businesses in the East of England
3. Financial performance refers to fee income for design consultancies and freelancers and budget for in-house design teams.
Data sources– All data is drawn from the Design Council’s Design Industry Survey conducted from September to November 2009, unless otherwise specified. More detailed information on the methodology for this survey can be found in the document ‘Design Industry Research Survey Glossary and Methodology’ on the Design Council’s website.
Financial performance of design businesses in the East of England – 2008/2009
£2m+
£1m–£2m
£500k–£1m
£250k–£500k
£100k–£250k
£50k–£100k
50%49%
24%
17%
5%
3%
2%
1%
19%
4%
1%
1%
1%
24%
UK average
East of England
Less than £50k
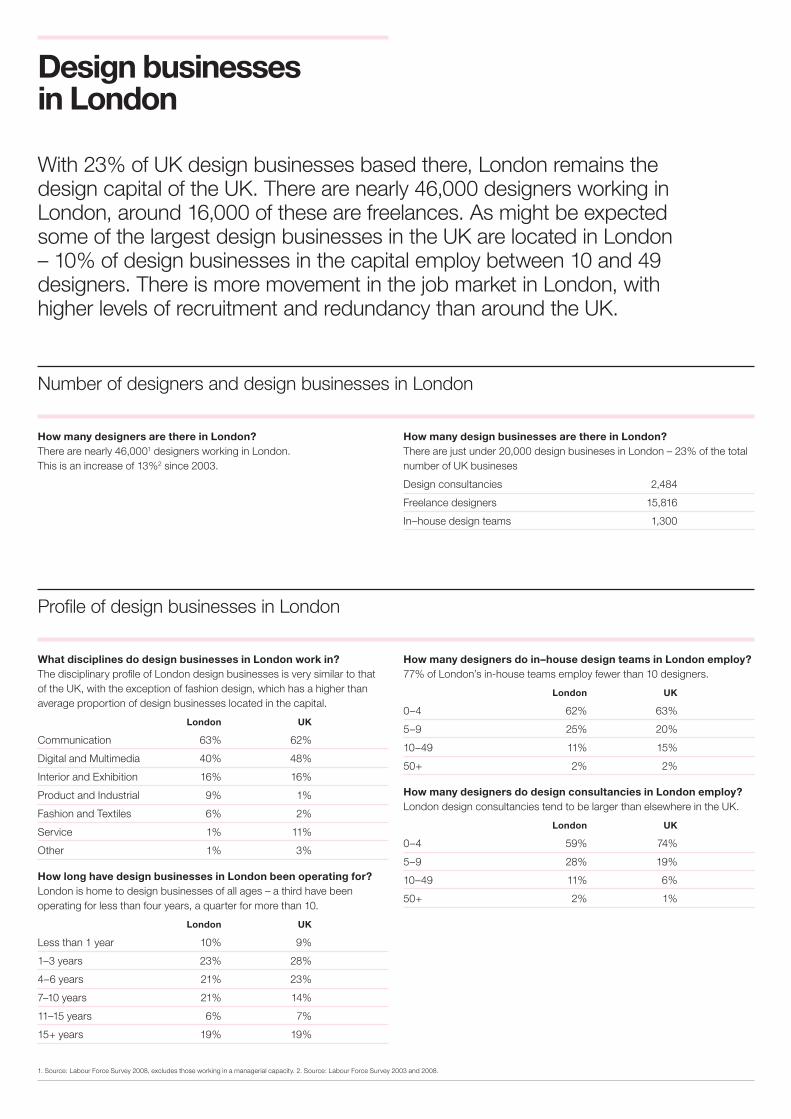
Design businesses in London
With 23% of UK design businesses based there, London remains the design capital of the UK. There are nearly 46,000 designers working in London, around 16,000 of these are freelances. As might be expected some of the largest design businesses in the UK are located in London – 10% of design businesses in the capital employ between 10 and 49 designers. There is more movement in the job market in London, with higher levels of recruitment and redundancy than around the UK.
How many designers are there in London?There are nearly 46,0001 designers working in London. This is an increase of 13%2 since 2003.
What disciplines do design businesses in London work in?The disciplinary profile of London design businesses is very similar to that of the UK, with the exception of fashion design, which has a higher than average proportion of design businesses located in the capital.
London UK
Communication 63% 62%
Digital and Multimedia 40% 48%
Interior and Exhibition 16% 16%
Product and Industrial 9% 1%
Fashion and Textiles 6% 2%
Service 1% 11%
Other 1% 3%
How long have design businesses in London been operating for?London is home to design businesses of all ages – a third have been operating for less than four years, a quarter for more than 10.
London UK
Less than 1 year 10% 9%
1–3 years 23% 28%
4–6 years 21% 23%
7–10 years 21% 14%
11–15 years 6% 7%
15+ years 19% 19%
How many designers do in–house design teams in London employ?77% of London’s in-house teams employ fewer than 10 designers.
London UK
0–4 62% 63%
5–9 25% 20%
10–49 11% 15%
50+ 2% 2%
How many designers do design consultancies in London employ?London design consultancies tend to be larger than elsewhere in the UK.
London UK
0–4 59% 74%
5–9 28% 19%
10–49 11% 6%
50+ 2% 1%
Number of designers and design businesses in London
How many design businesses are there in London?There are just under 20,000 design busineses in London – 23% of the total number of UK busineses
Design consultancies 2,484
Freelance designers 15,816
In–house design teams 1,300
Profile of design businesses in London
1. Source: Labour Force Survey 2008, excludes those working in a managerial capacity. 2. Source: Labour Force Survey 2003 and 2008.
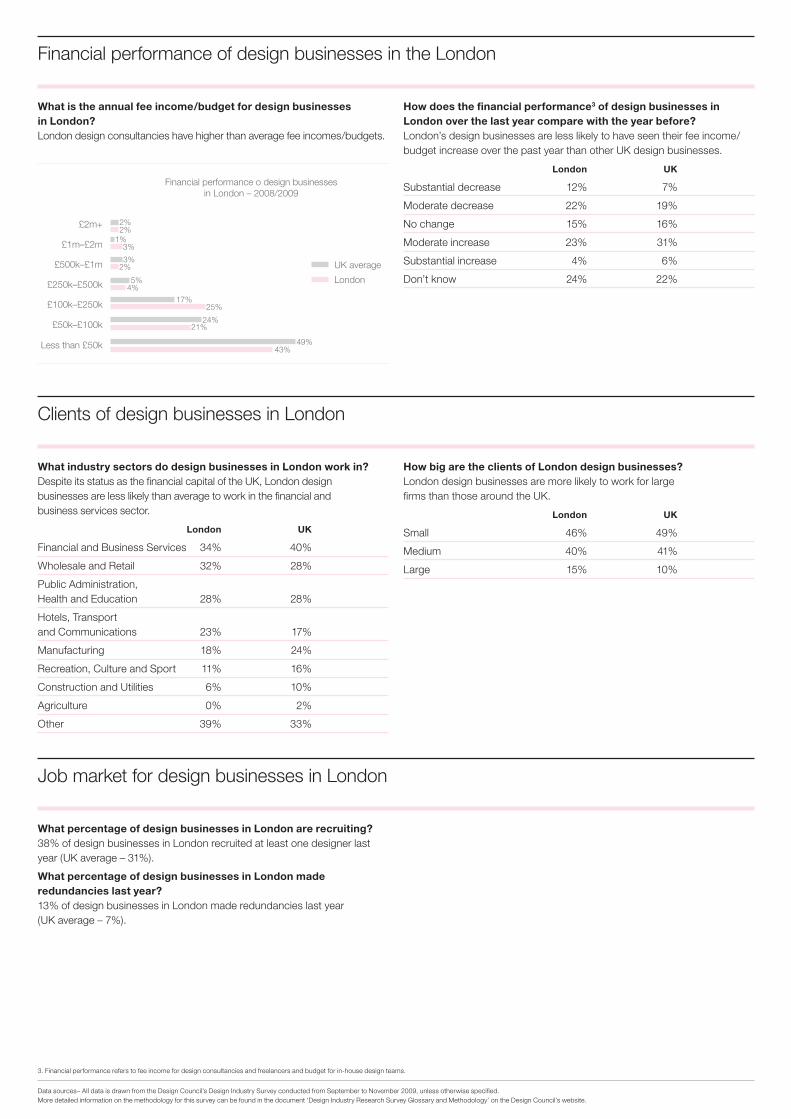
What is the annual fee income/budget for design businesses in London?London design consultancies have higher than average fee incomes/budgets.
How does the financial performance3 of design businesses in London over the last year compare with the year before?London’s design businesses are less likely to have seen their fee income/budget increase over the past year than other UK design businesses.
London UK
Substantial decrease 12% 7%
Moderate decrease 22% 19%
No change 15% 16%
Moderate increase 23% 31%
Substantial increase 4% 6%
Don’t know 24% 22%
What industry sectors do design businesses in London work in? Despite its status as the financial capital of the UK, London design businesses are less likely than average to work in the financial and business services sector.
London UK
Financial and Business Services 34% 40%
Wholesale and Retail 32% 28%
Public Administration, Health and Education 28% 28%
Hotels, Transport and Communications 23% 17%
Manufacturing 18% 24%
Recreation, Culture and Sport 11% 16%
Construction and Utilities 6% 10%
Agriculture 0% 2%
Other 39% 33%
How big are the clients of London design businesses?London design businesses are more likely to work for large firms than those around the UK.
London UK
Small 46% 49%
Medium 40% 41%
Large 15% 10%
Financial performance of design businesses in the London
Clients of design businesses in London
What percentage of design businesses in London are recruiting?38% of design businesses in London recruited at least one designer last year (UK average – 31%).
What percentage of design businesses in London made redundancies last year?13% of design businesses in London made redundancies last year (UK average – 7%).
Job market for design businesses in London
3. Financial performance refers to fee income for design consultancies and freelancers and budget for in-house design teams.
Data sources– All data is drawn from the Design Council’s Design Industry Survey conducted from September to November 2009, unless otherwise specified. More detailed information on the methodology for this survey can be found in the document ‘Design Industry Research Survey Glossary and Methodology’ on the Design Council’s website.
Financial performance o design businesses in London – 2008/2009
£2m+
£1m–£2m
£500k–£1m
£250k–£500k
£100k–£250k
£50k–£100k
43%49%
24%
17%
5%
2%
3%
1%
25%
4%
2%
2%
3%
21%
UK average
London
Less than £50k
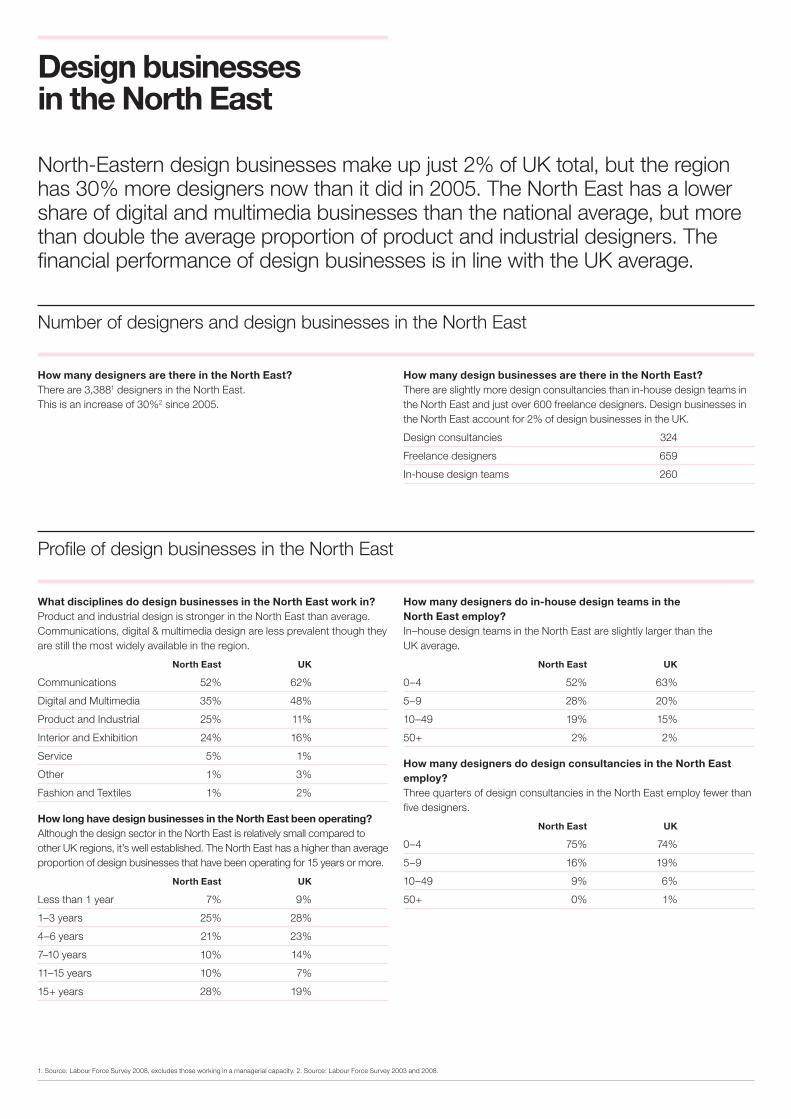
Design businesses in the North East
North-Eastern design businesses make up just 2% of UK total, but the region has 30% more designers now than it did in 2005. The North East has a lower share of digital and multimedia businesses than the national average, but more than double the average proportion of product and industrial designers. The financial performance of design businesses is in line with the UK average.
How many designers are there in the North East?There are 3,3881 designers in the North East. This is an increase of 30%2 since 2005.
What disciplines do design businesses in the North East work in?Product and industrial design is stronger in the North East than average. Communications, digital & multimedia design are less prevalent though they are still the most widely available in the region.
North East UK
Communications 52% 62%
Digital and Multimedia 35% 48%
Product and Industrial 25% 11%
Interior and Exhibition 24% 16%
Service 5% 1%
Other 1% 3%
Fashion and Textiles 1% 2%
How long have design businesses in the North East been operating?Although the design sector in the North East is relatively small compared to other UK regions, it’s well established. The North East has a higher than average proportion of design businesses that have been operating for 15 years or more.
North East UK
Less than 1 year 7% 9%
1–3 years 25% 28%
4–6 years 21% 23%
7–10 years 10% 14%
11–15 years 10% 7%
15+ years 28% 19%
Number of designers and design businesses in the North East
How many design businesses are there in the North East?There are slightly more design consultancies than in-house design teams in the North East and just over 600 freelance designers. Design businesses in the North East account for 2% of design businesses in the UK.
Design consultancies 324
Freelance designers 659
In-house design teams 260
Profile of design businesses in the North East
How many designers do in-house design teams in the North East employ?In–house design teams in the North East are slightly larger than the UK average.
North East UK
0–4 52% 63%
5–9 28% 20%
10–49 19% 15%
50+ 2% 2%
How many designers do design consultancies in the North East employ?Three quarters of design consultancies in the North East employ fewer than five designers.
North East UK
0–4 75% 74%
5–9 16% 19%
10–49 9% 6%
50+ 0% 1%
1. Source: Labour Force Survey 2008, excludes those working in a managerial capacity. 2. Source: Labour Force Survey 2003 and 2008.
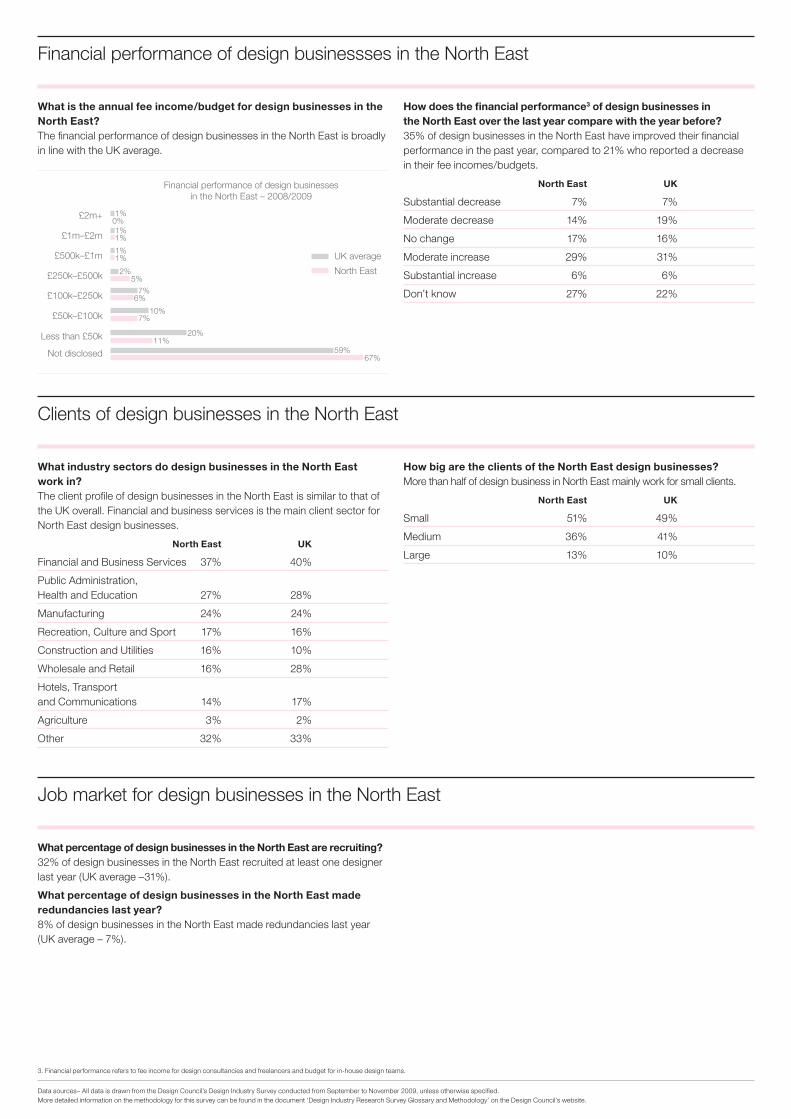
What is the annual fee income/budget for design businesses in the North East?The financial performance of design businesses in the North East is broadly in line with the UK average.
How does the financial performance3 of design businesses in the North East over the last year compare with the year before?35% of design businesses in the North East have improved their financial performance in the past year, compared to 21% who reported a decrease in their fee incomes/budgets.
North East UK
Substantial decrease 7% 7%
Moderate decrease 14% 19%
No change 17% 16%
Moderate increase 29% 31%
Substantial increase 6% 6%
Don’t know 27% 22%
What industry sectors do design businesses in the North East work in?The client profile of design businesses in the North East is similar to that of the UK overall. Financial and business services is the main client sector for North East design businesses.
North East UK
Financial and Business Services 37% 40%
Public Administration, Health and Education 27% 28%
Manufacturing 24% 24%
Recreation, Culture and Sport 17% 16%
Construction and Utilities 16% 10%
Wholesale and Retail 16% 28%
Hotels, Transport and Communications 14% 17%
Agriculture 3% 2%
Other 32% 33%
How big are the clients of the North East design businesses?More than half of design business in North East mainly work for small clients.
North East UK
Small 51% 49%
Medium 36% 41%
Large 13% 10%
Financial performance of design businessses in the North East
Clients of design businesses in the North East
What percentage of design businesses in the North East are recruiting?32% of design businesses in the North East recruited at least one designer last year (UK average –31%).
What percentage of design businesses in the North East made redundancies last year?8% of design businesses in the North East made redundancies last year (UK average – 7%).
Job market for design businesses in the North East
3. Financial performance refers to fee income for design consultancies and freelancers and budget for in-house design teams.
Data sources– All data is drawn from the Design Council’s Design Industry Survey conducted from September to November 2009, unless otherwise specified. More detailed information on the methodology for this survey can be found in the document ‘Design Industry Research Survey Glossary and Methodology’ on the Design Council’s website.
Financial performance of design businesses in the North East – 2008/2009
£2m+
£1m–£2m
£500k–£1m
£250k–£500k
£100k–£250k
£50k–£100k
11%
67%
20%
59%
10%
7%
2%
1%
1%
1%
6%
5%
0%
1%
1%
7%
UK average
North East
Less than £50k
Not disclosed
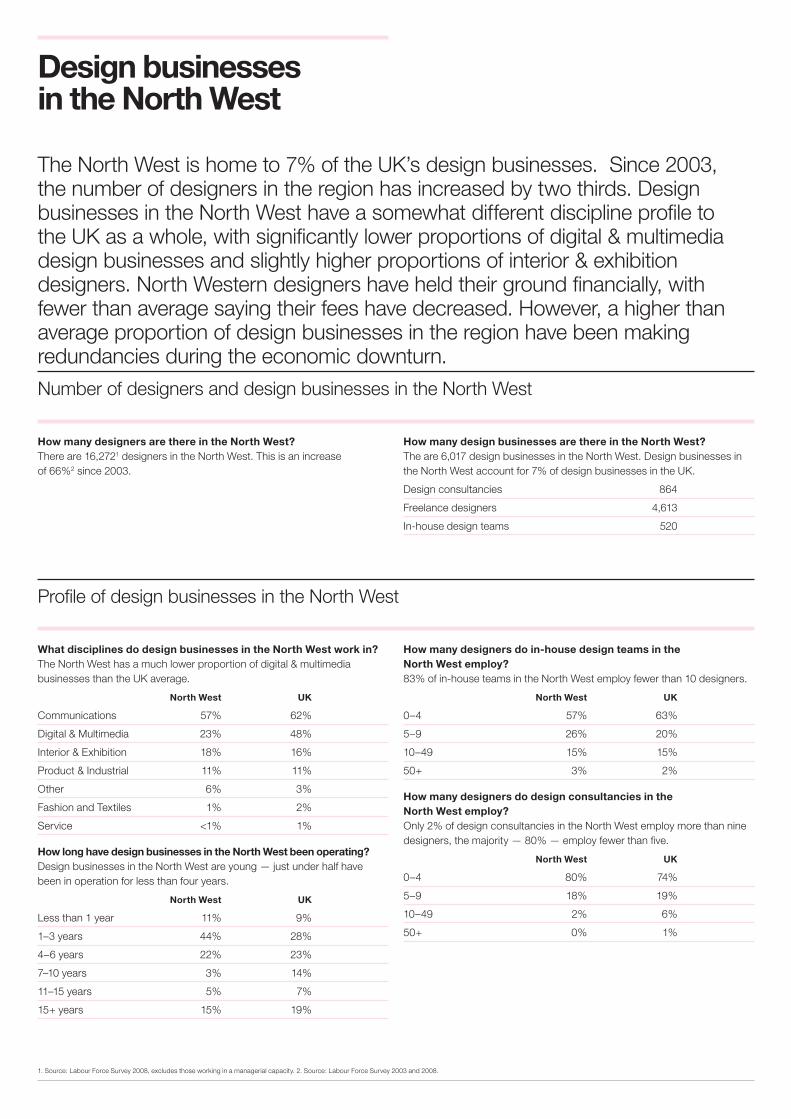
Design businesses in the North West
The North West is home to 7% of the UK’s design businesses. Since 2003, the number of designers in the region has increased by two thirds. Design businesses in the North West have a somewhat different discipline profile to the UK as a whole, with significantly lower proportions of digital & multimedia design businesses and slightly higher proportions of interior & exhibition designers. North Western designers have held their ground financially, with fewer than average saying their fees have decreased. However, a higher than average proportion of design businesses in the region have been making redundancies during the economic downturn.
How many designers are there in the North West? There are 16,2721 designers in the North West. This is an increase of 66%2 since 2003.
What disciplines do design businesses in the North West work in?The North West has a much lower proportion of digital & multimedia businesses than the UK average.
North West UK
Communications 57% 62%
Digital & Multimedia 23% 48%
Interior & Exhibition 18% 16%
Product & Industrial 11% 11%
Other 6% 3%
Fashion and Textiles 1% 2%
Service <1% 1%
How long have design businesses in the North West been operating? Design businesses in the North West are young — just under half have been in operation for less than four years.
North West UK
Less than 1 year 11% 9%
1–3 years 44% 28%
4–6 years 22% 23%
7–10 years 3% 14%
11–15 years 5% 7%
15+ years 15% 19%
How many designers do in-house design teams in the North West employ?83% of in-house teams in the North West employ fewer than 10 designers.
North West UK
0–4 57% 63%
5–9 26% 20%
10–49 15% 15%
50+ 3% 2%
How many designers do design consultancies in the North West employ?Only 2% of design consultancies in the North West employ more than nine designers, the majority — 80% — employ fewer than five.
North West UK
0–4 80% 74%
5–9 18% 19%
10–49 2% 6%
50+ 0% 1%
Number of designers and design businesses in the North West
How many design businesses are there in the North West? The are 6,017 design businesses in the North West. Design businesses in the North West account for 7% of design businesses in the UK.
Design consultancies 864
Freelance designers 4,613
In-house design teams 520
Profile of design businesses in the North West
1. Source: Labour Force Survey 2008, excludes those working in a managerial capacity. 2. Source: Labour Force Survey 2003 and 2008.
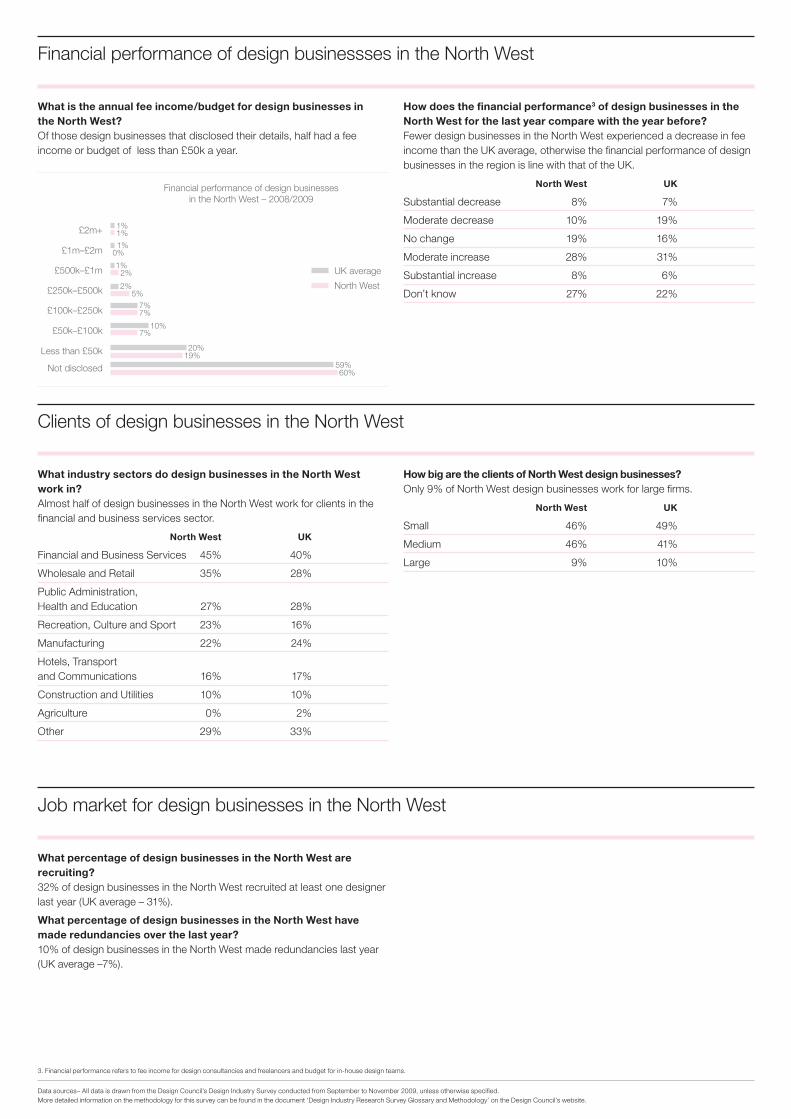
What is the annual fee income/budget for design businesses in the North West?Of those design businesses that disclosed their details, half had a fee income or budget of less than £50k a year.
How does the financial performance3 of design businesses in the North West for the last year compare with the year before? Fewer design businesses in the North West experienced a decrease in fee income than the UK average, otherwise the financial performance of design businesses in the region is line with that of the UK.
North West UK
Substantial decrease 8% 7%
Moderate decrease 10% 19%
No change 19% 16%
Moderate increase 28% 31%
Substantial increase 8% 6%
Don’t know 27% 22%
What industry sectors do design businesses in the North West work in?Almost half of design businesses in the North West work for clients in the financial and business services sector.
North West UK
Financial and Business Services 45% 40%
Wholesale and Retail 35% 28%
Public Administration, Health and Education 27% 28%
Recreation, Culture and Sport 23% 16%
Manufacturing 22% 24%
Hotels, Transport and Communications 16% 17%
Construction and Utilities 10% 10%
Agriculture 0% 2%
Other 29% 33%
How big are the clients of North West design businesses? Only 9% of North West design businesses work for large firms.
North West UK
Small 46% 49%
Medium 46% 41%
Large 9% 10%
Financial performance of design businessses in the North West
Clients of design businesses in the North West
What percentage of design businesses in the North West are recruiting? 32% of design businesses in the North West recruited at least one designer last year (UK average – 31%).
What percentage of design businesses in the North West have made redundancies over the last year?10% of design businesses in the North West made redundancies last year (UK average –7%).
Job market for design businesses in the North West
3. Financial performance refers to fee income for design consultancies and freelancers and budget for in-house design teams.
Data sources– All data is drawn from the Design Council’s Design Industry Survey conducted from September to November 2009, unless otherwise specified. More detailed information on the methodology for this survey can be found in the document ‘Design Industry Research Survey Glossary and Methodology’ on the Design Council’s website.
Financial performance of design businesses in the North West – 2008/2009
£2m+
£1m–£2m
£500k–£1m
£250k–£500k
£100k–£250k
£50k–£100k
19%
60%
20%
59%
10%
7%
2%
1%
1%
1%
7%
5%
2%
1%
0%
7%
UK average
North West
Less than £50k
Not disclosed

Design businesses in Northern Ireland
Although design businesses in Northern Ireland account for 3% of the UK total, the number of designers in the country has been growing – there are now just over 3,800 designers in Northern Ireland, a 41% increase on 2003. Design businesses in Northern Ireland are more likely to work in interior and exhibition design and less likely to work in communication design and digital and multimedia design than other UK design businesses. Design businesses in the country are relatively young, only 22% have been operating for more than 10 years compared to a national average of 26%.
How many designers are there in Northern Ireland? There are 3,833 1designers in Northern Ireland. This is an increase of 41%2 on 2003.
What disciplines do design businesses in Northern Ireland work in?Compared to the UK average, there is a lower proportion of design businesses in Northern Ireland working in communications design and digital and multimedia design, but more than double the average proportion working in interior and exhibition design.
Northern Ireland UK
Communications 49% 62%
Digital and Multimedia 30% 48%
Interior and Exhibition 34% 16%
Product and Industrial 19% 11%
Other 7% 3%
Fashion and Textiles 3% 2%
Service <1% 1%
How long have design businesses in Northern Ireland been operating? Two thirds of design businesses in Northern Ireland have been operating for under seven years.
Northern Ireland UK
Less than 1 year 3% 9%
1–3 years 30% 28%
4–6 years 30% 23%
7–10 years 15% 14%
11–15 years 5% 7%
15+ years 17% 19%
How many designers do in-house design teams in Northern Ireland employ?More than two-thirds of in-house design teams in Northern Ireland employ fewer than five designers.
Northern Ireland UK
0–4 67% 63%
5–9 19% 20%
10–49 12% 15%
50+ 2% 2%
How many designers do design consultancies in Northern Ireland employ?98% of design consultancies in Northern Ireland employ fewer than ten designers.
Northern Ireland UK
0–4 81% 74%
5–9 17% 19%
10–49 2% 6%
50+ 0% 1%
Number of designers and design businesses in Northern Ireland
How many design businesses are there in Northern Ireland? There are 2,982 design businesses in Northern Ireland. Design businesses in Northern Ireland account for 3% of design businesses in the UK.
Design consultancies 216
Freelance designers 2,636
In-house design teams 130
Profile of design businesses in Northern Ireland
1. Source: Labour Force Survey 2008, excludes those working in a managerial capacity. 2. Source: Labour Force Survey 2003 and 2008.
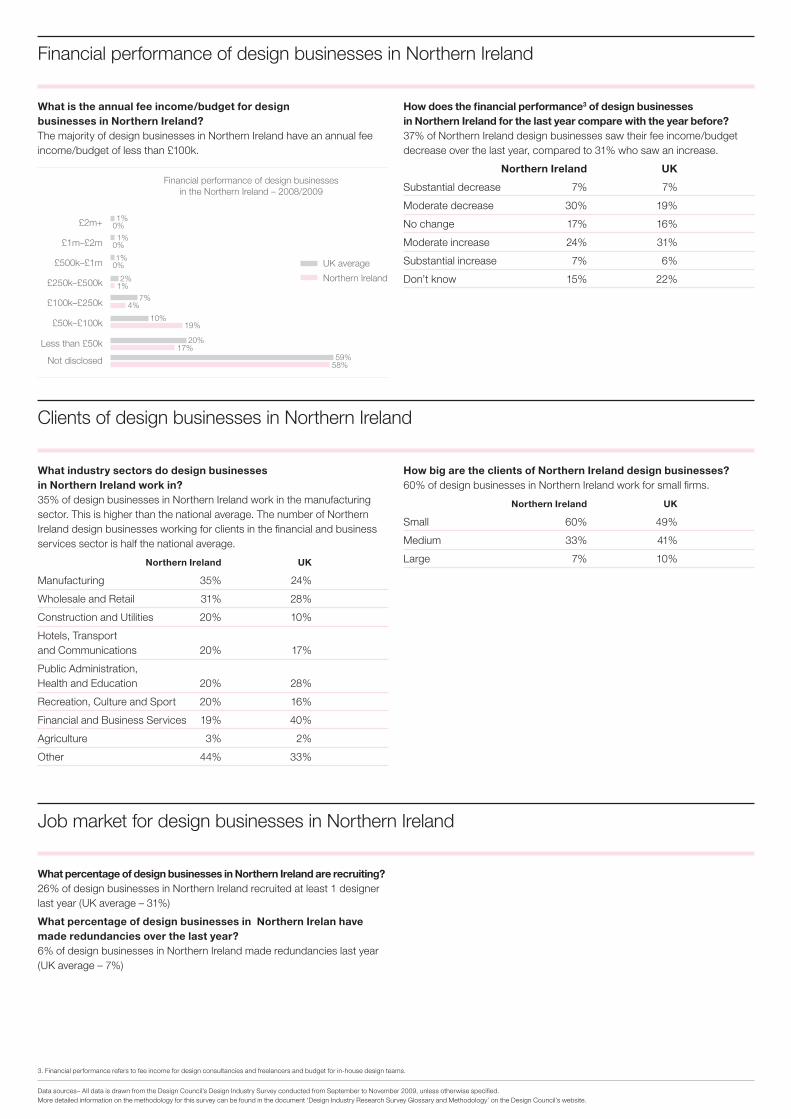
What is the annual fee income/budget for design businesses in Northern Ireland?The majority of design businesses in Northern Ireland have an annual fee income/budget of less than £100k.
How does the financial performance3 of design businesses in Northern Ireland for the last year compare with the year before? 37% of Northern Ireland design businesses saw their fee income/budget decrease over the last year, compared to 31% who saw an increase.
Northern Ireland UK
Substantial decrease 7% 7%
Moderate decrease 30% 19%
No change 17% 16%
Moderate increase 24% 31%
Substantial increase 7% 6%
Don’t know 15% 22%
What industry sectors do design businesses in Northern Ireland work in?35% of design businesses in Northern Ireland work in the manufacturing sector. This is higher than the national average. The number of Northern Ireland design businesses working for clients in the financial and business services sector is half the national average.
Northern Ireland UK
Manufacturing 35% 24%
Wholesale and Retail 31% 28%
Construction and Utilities 20% 10%
Hotels, Transport and Communications 20% 17%
Public Administration, Health and Education 20% 28%
Recreation, Culture and Sport 20% 16%
Financial and Business Services 19% 40%
Agriculture 3% 2%
Other 44% 33%
How big are the clients of Northern Ireland design businesses? 60% of design businesses in Northern Ireland work for small firms.
Northern Ireland UK
Small 60% 49%
Medium 33% 41%
Large 7% 10%
Financial performance of design businesses in Northern Ireland
Clients of design businesses in Northern Ireland
What percentage of design businesses in Northern Ireland are recruiting? 26% of design businesses in Northern Ireland recruited at least 1 designer last year (UK average – 31%)
What percentage of design businesses in Northern Irelan have made redundancies over the last year?6% of design businesses in Northern Ireland made redundancies last year (UK average – 7%)
Job market for design businesses in Northern Ireland
3. Financial performance refers to fee income for design consultancies and freelancers and budget for in-house design teams.
Data sources– All data is drawn from the Design Council’s Design Industry Survey conducted from September to November 2009, unless otherwise specified. More detailed information on the methodology for this survey can be found in the document ‘Design Industry Research Survey Glossary and Methodology’ on the Design Council’s website.
Financial performance of design businesses in the Northern Ireland – 2008/2009
£2m+
£1m–£2m
£500k–£1m
£250k–£500k
£100k–£250k
£50k–£100k
17%
58%
20%
59%
10%
7%
2%
1%
1%
1%
4%
1%
0%
0%
0%
19%
UK average
Northern Ireland
Less than £50k
Not disclosed
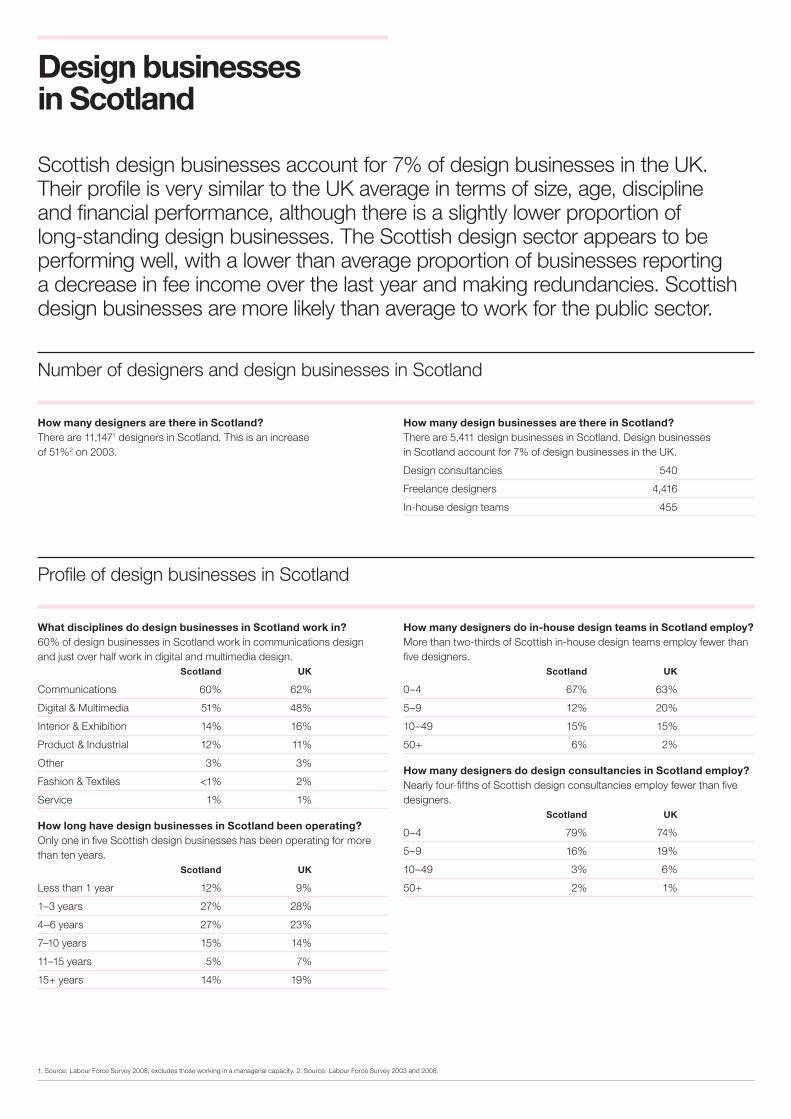
Design businesses in Scotland
Scottish design businesses account for 7% of design businesses in the UK. Their profile is very similar to the UK average in terms of size, age, discipline and financial performance, although there is a slightly lower proportion of long-standing design businesses. The Scottish design sector appears to be performing well, with a lower than average proportion of businesses reporting a decrease in fee income over the last year and making redundancies. Scottish design businesses are more likely than average to work for the public sector.
How many designers are there in Scotland? There are 11,1471 designers in Scotland. This is an increase of 51%2 on 2003.
What disciplines do design businesses in Scotland work in?60% of design businesses in Scotland work in communications design and just over half work in digital and multimedia design. Scotland UK
Communications 60% 62%
Digital & Multimedia 51% 48%
Interior & Exhibition 14% 16%
Product & Industrial 12% 11%
Other 3% 3%
Fashion & Textiles <1% 2%
Service 1% 1%
How long have design businesses in Scotland been operating? Only one in five Scottish design businesses has been operating for more than ten years. Scotland UK
Less than 1 year 12% 9%
1–3 years 27% 28%
4–6 years 27% 23%
7–10 years 15% 14%
11–15 years 5% 7%
15+ years 14% 19%
How many designers do in-house design teams in Scotland employ? More than two-thirds of Scottish in-house design teams employ fewer than five designers. Scotland UK
0–4 67% 63%
5–9 12% 20%
10–49 15% 15%
50+ 6% 2%
How many designers do design consultancies in Scotland employ?Nearly four-fifths of Scottish design consultancies employ fewer than five designers. Scotland UK
0–4 79% 74%
5–9 16% 19%
10–49 3% 6%
50+ 2% 1%
Number of designers and design businesses in Scotland
How many design businesses are there in Scotland? There are 5,411 design businesses in Scotland. Design businesses in Scotland account for 7% of design businesses in the UK.
Design consultancies 540
Freelance designers 4,416
In-house design teams 455
Profile of design businesses in Scotland
1. Source: Labour Force Survey 2008, excludes those working in a managerial capacity. 2. Source: Labour Force Survey 2003 and 2008.
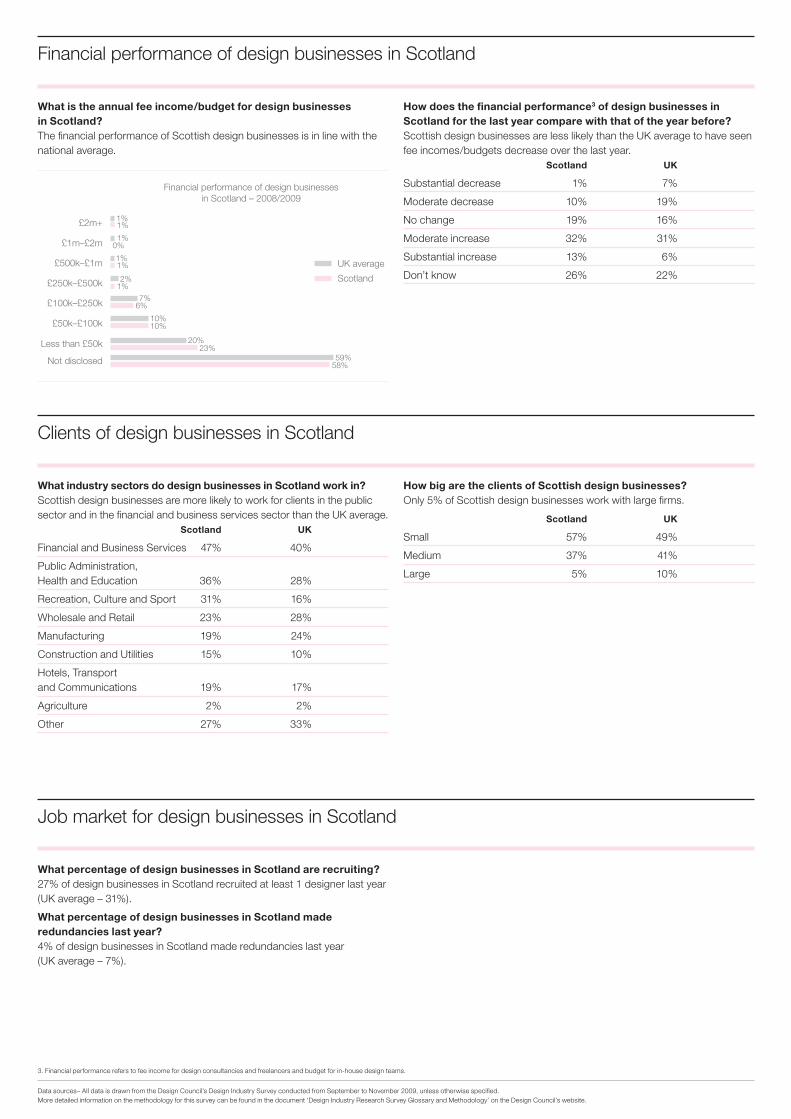
What is the annual fee income/budget for design businesses in Scotland?The financial performance of Scottish design businesses is in line with the national average.
How does the financial performance3 of design businesses in Scotland for the last year compare with that of the year before? Scottish design businesses are less likely than the UK average to have seen fee incomes/budgets decrease over the last year. Scotland UK
Substantial decrease 1% 7%
Moderate decrease 10% 19%
No change 19% 16%
Moderate increase 32% 31%
Substantial increase 13% 6%
Don’t know 26% 22%
What industry sectors do design businesses in Scotland work in?Scottish design businesses are more likely to work for clients in the public sector and in the financial and business services sector than the UK average. Scotland UK
Financial and Business Services 47% 40%
Public Administration, Health and Education 36% 28%
Recreation, Culture and Sport 31% 16%
Wholesale and Retail 23% 28%
Manufacturing 19% 24%
Construction and Utilities 15% 10%
Hotels, Transport and Communications 19% 17%
Agriculture 2% 2%
Other 27% 33%
How big are the clients of Scottish design businesses? Only 5% of Scottish design businesses work with large firms.
Scotland UK
Small 57% 49%
Medium 37% 41%
Large 5% 10%
Financial performance of design businesses in Scotland
Clients of design businesses in Scotland
What percentage of design businesses in Scotland are recruiting?27% of design businesses in Scotland recruited at least 1 designer last year (UK average – 31%).
What percentage of design businesses in Scotland made redundancies last year?4% of design businesses in Scotland made redundancies last year (UK average – 7%).
Job market for design businesses in Scotland
3. Financial performance refers to fee income for design consultancies and freelancers and budget for in-house design teams.
Data sources– All data is drawn from the Design Council’s Design Industry Survey conducted from September to November 2009, unless otherwise specified. More detailed information on the methodology for this survey can be found in the document ‘Design Industry Research Survey Glossary and Methodology’ on the Design Council’s website.
Financial performance of design businesses in Scotland – 2008/2009
£2m+
£1m–£2m
£500k–£1m
£250k–£500k
£100k–£250k
£50k–£100k
23%
58%
20%
59%
10%10%
7%
2%
1%
1%
1%
6%
1%
1%
1%
0%
UK average
Scotland
Less than £50k
Not disclosed
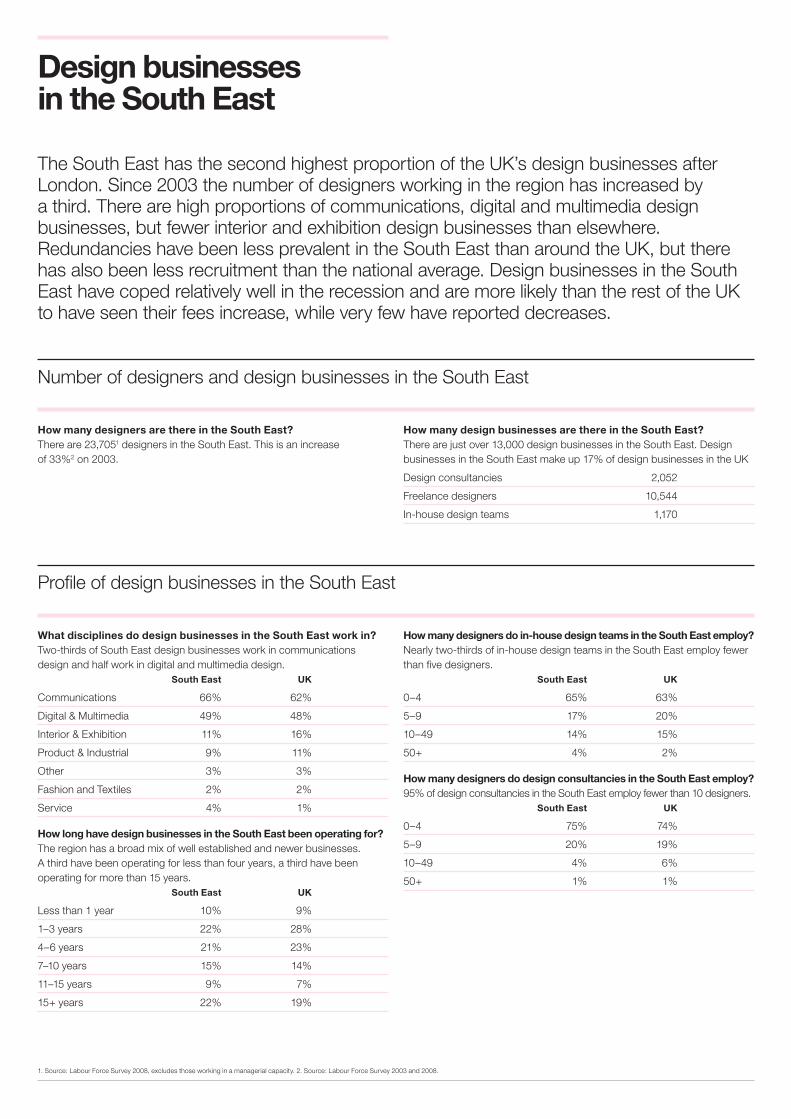
Design businesses in the South East
The South East has the second highest proportion of the UK’s design businesses after London. Since 2003 the number of designers working in the region has increased by a third. There are high proportions of communications, digital and multimedia design businesses, but fewer interior and exhibition design businesses than elsewhere. Redundancies have been less prevalent in the South East than around the UK, but there has also been less recruitment than the national average. Design businesses in the South East have coped relatively well in the recession and are more likely than the rest of the UK to have seen their fees increase, while very few have reported decreases.
How many designers are there in the South East? There are 23,7051 designers in the South East. This is an increase of 33%2 on 2003.
What disciplines do design businesses in the South East work in?Two-thirds of South East design businesses work in communications design and half work in digital and multimedia design. South East UK
Communications 66% 62%
Digital & Multimedia 49% 48%
Interior & Exhibition 11% 16%
Product & Industrial 9% 11%
Other 3% 3%
Fashion and Textiles 2% 2%
Service 4% 1%
How long have design businesses in the South East been operating for? The region has a broad mix of well established and newer businesses. A third have been operating for less than four years, a third have been operating for more than 15 years. South East UK
Less than 1 year 10% 9%
1–3 years 22% 28%
4–6 years 21% 23%
7–10 years 15% 14%
11–15 years 9% 7%
15+ years 22% 19%
How many designers do in-house design teams in the South East employ?Nearly two-thirds of in-house design teams in the South East employ fewer than five designers. South East UK
0–4 65% 63%
5–9 17% 20%
10–49 14% 15%
50+ 4% 2%
How many designers do design consultancies in the South East employ? 95% of design consultancies in the South East employ fewer than 10 designers. South East UK
0–4 75% 74%
5–9 20% 19%
10–49 4% 6%
50+ 1% 1%
Number of designers and design businesses in the South East
How many design businesses are there in the South East? There are just over 13,000 design businesses in the South East. Design businesses in the South East make up 17% of design businesses in the UK
Design consultancies 2,052
Freelance designers 10,544
In-house design teams 1,170
Profile of design businesses in the South East
1. Source: Labour Force Survey 2008, excludes those working in a managerial capacity. 2. Source: Labour Force Survey 2003 and 2008.
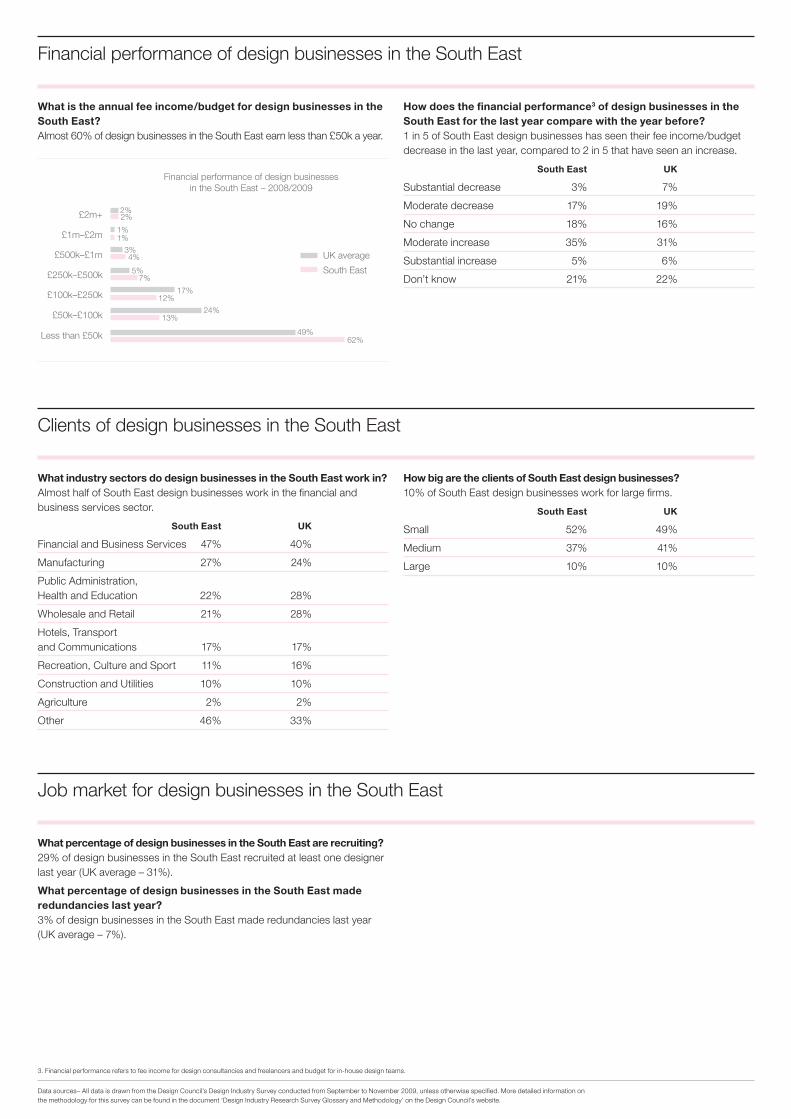
What is the annual fee income/budget for design businesses in the South East? Almost 60% of design businesses in the South East earn less than £50k a year.
How does the financial performance3 of design businesses in the South East for the last year compare with the year before? 1 in 5 of South East design businesses has seen their fee income/budget decrease in the last year, compared to 2 in 5 that have seen an increase.
South East UK
Substantial decrease 3% 7%
Moderate decrease 17% 19%
No change 18% 16%
Moderate increase 35% 31%
Substantial increase 5% 6%
Don’t know 21% 22%
What industry sectors do design businesses in the South East work in?Almost half of South East design businesses work in the financial and business services sector.
South East UK
Financial and Business Services 47% 40%
Manufacturing 27% 24%
Public Administration, Health and Education 22% 28%
Wholesale and Retail 21% 28%
Hotels, Transport and Communications 17% 17%
Recreation, Culture and Sport 11% 16%
Construction and Utilities 10% 10%
Agriculture 2% 2%
Other 46% 33%
How big are the clients of South East design businesses?10% of South East design businesses work for large firms.
South East UK
Small 52% 49%
Medium 37% 41%
Large 10% 10%
Financial performance of design businesses in the South East
Clients of design businesses in the South East
What percentage of design businesses in the South East are recruiting? 29% of design businesses in the South East recruited at least one designer last year (UK average – 31%).
What percentage of design businesses in the South East made redundancies last year?3% of design businesses in the South East made redundancies last year (UK average – 7%).
Job market for design businesses in the South East
3. Financial performance refers to fee income for design consultancies and freelancers and budget for in-house design teams.
Data sources– All data is drawn from the Design Council’s Design Industry Survey conducted from September to November 2009, unless otherwise specified. More detailed information on the methodology for this survey can be found in the document ‘Design Industry Research Survey Glossary and Methodology’ on the Design Council’s website.
Financial performance of design businesses in the South East – 2008/2009
£2m+
£1m–£2m
£500k–£1m
£250k–£500k
£100k–£250k
£50k–£100k
62%49%
24%13%
17%
5%
3%
2%
1%
12%
7%
4%
2%
1%
UK average
South East
Less than £50k
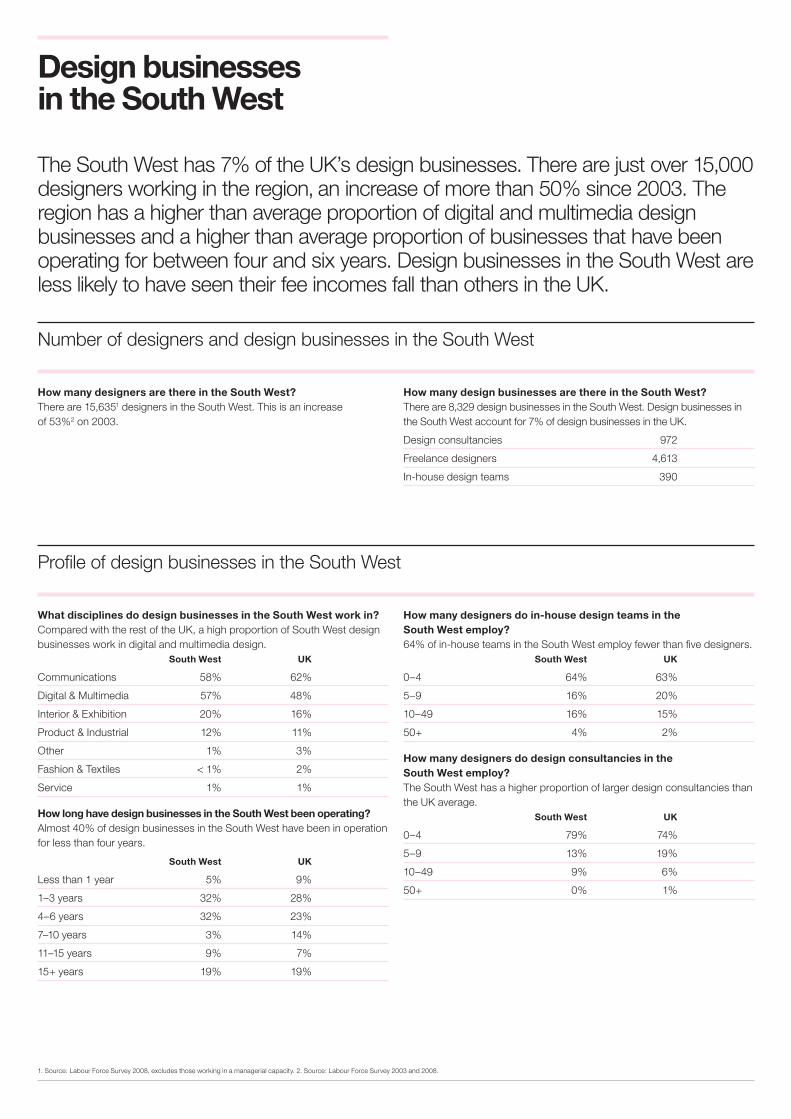
Design businesses in the South West
The South West has 7% of the UK’s design businesses. There are just over 15,000 designers working in the region, an increase of more than 50% since 2003. The region has a higher than average proportion of digital and multimedia design businesses and a higher than average proportion of businesses that have been operating for between four and six years. Design businesses in the South West are less likely to have seen their fee incomes fall than others in the UK.
How many designers are there in the South West? There are 15,6351 designers in the South West. This is an increase of 53%2 on 2003.
What disciplines do design businesses in the South West work in?Compared with the rest of the UK, a high proportion of South West design businesses work in digital and multimedia design. South West UK
Communications 58% 62%
Digital & Multimedia 57% 48%
Interior & Exhibition 20% 16%
Product & Industrial 12% 11%
Other 1% 3%
Fashion & Textiles < 1% 2%
Service 1% 1%
How long have design businesses in the South West been operating?Almost 40% of design businesses in the South West have been in operation for less than four years.
South West UK
Less than 1 year 5% 9%
1–3 years 32% 28%
4–6 years 32% 23%
7–10 years 3% 14%
11–15 years 9% 7%
15+ years 19% 19%
How many designers do in-house design teams in the South West employ?64% of in-house teams in the South West employ fewer than five designers. South West UK
0–4 64% 63%
5–9 16% 20%
10–49 16% 15%
50+ 4% 2%
How many designers do design consultancies in the South West employ? The South West has a higher proportion of larger design consultancies than the UK average. South West UK
0–4 79% 74%
5–9 13% 19%
10–49 9% 6%
50+ 0% 1%
Number of designers and design businesses in the South West
How many design businesses are there in the South West? There are 8,329 design businesses in the South West. Design businesses in the South West account for 7% of design businesses in the UK.
Design consultancies 972
Freelance designers 4,613
In-house design teams 390
Profile of design businesses in the South West
1. Source: Labour Force Survey 2008, excludes those working in a managerial capacity. 2. Source: Labour Force Survey 2003 and 2008.
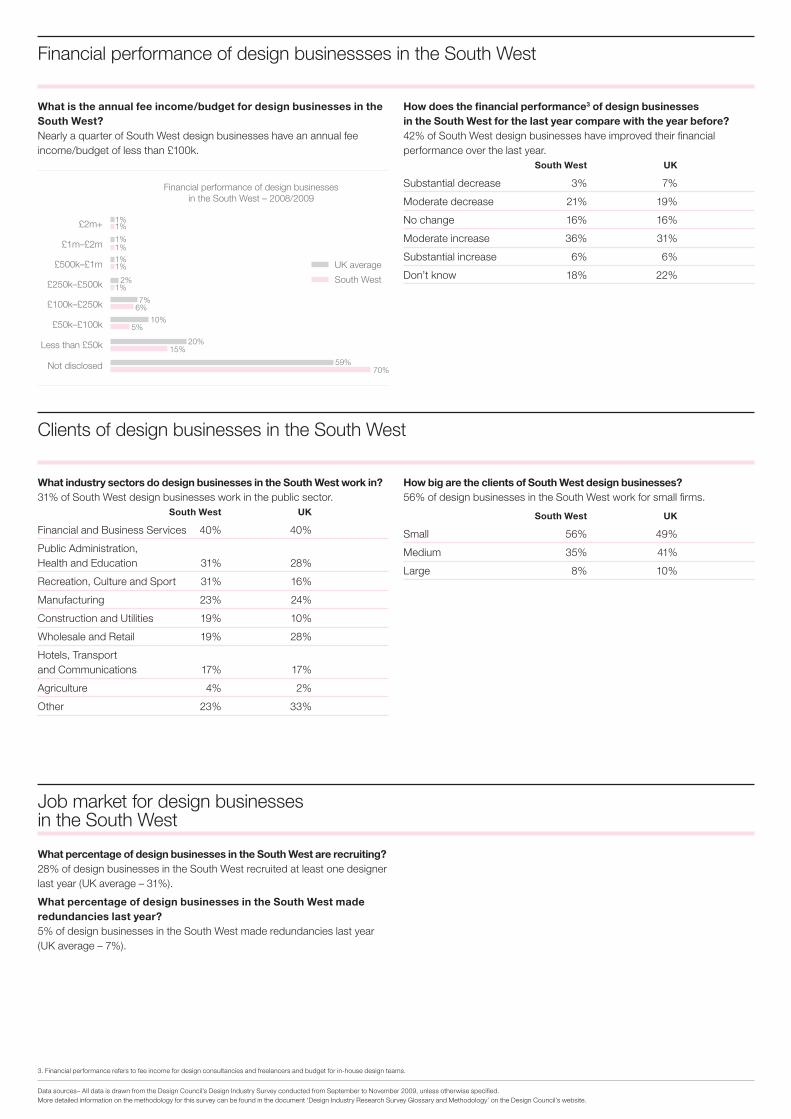
What is the annual fee income/budget for design businesses in the South West? Nearly a quarter of South West design businesses have an annual fee income/budget of less than £100k.
How does the financial performance3 of design businesses in the South West for the last year compare with the year before? 42% of South West design businesses have improved their financial performance over the last year. South West UK
Substantial decrease 3% 7%
Moderate decrease 21% 19%
No change 16% 16%
Moderate increase 36% 31%
Substantial increase 6% 6%
Don’t know 18% 22%
What industry sectors do design businesses in the South West work in?31% of South West design businesses work in the public sector. South West UK
Financial and Business Services 40% 40%
Public Administration, Health and Education 31% 28%
Recreation, Culture and Sport 31% 16%
Manufacturing 23% 24%
Construction and Utilities 19% 10%
Wholesale and Retail 19% 28%
Hotels, Transport and Communications 17% 17%
Agriculture 4% 2%
Other 23% 33%
How big are the clients of South West design businesses? 56% of design businesses in the South West work for small firms.
South West UK
Small 56% 49%
Medium 35% 41%
Large 8% 10%
Financial performance of design businessses in the South West
Clients of design businesses in the South West
What percentage of design businesses in the South West are recruiting?28% of design businesses in the South West recruited at least one designer last year (UK average – 31%).
What percentage of design businesses in the South West made redundancies last year?5% of design businesses in the South West made redundancies last year (UK average – 7%).
Job market for design businesses in the South West
3. Financial performance refers to fee income for design consultancies and freelancers and budget for in-house design teams.
Data sources– All data is drawn from the Design Council’s Design Industry Survey conducted from September to November 2009, unless otherwise specified. More detailed information on the methodology for this survey can be found in the document ‘Design Industry Research Survey Glossary and Methodology’ on the Design Council’s website.
Financial performance of design businesses in the South West – 2008/2009
£2m+
£1m–£2m
£500k–£1m
£250k–£500k
£100k–£250k
£50k–£100k
15%
70%
20%
59%
10%5%
7%
2%
1%
1%
1%
6%
1%
1%
1%
1%
UK average
South West
Less than £50k
Not disclosed
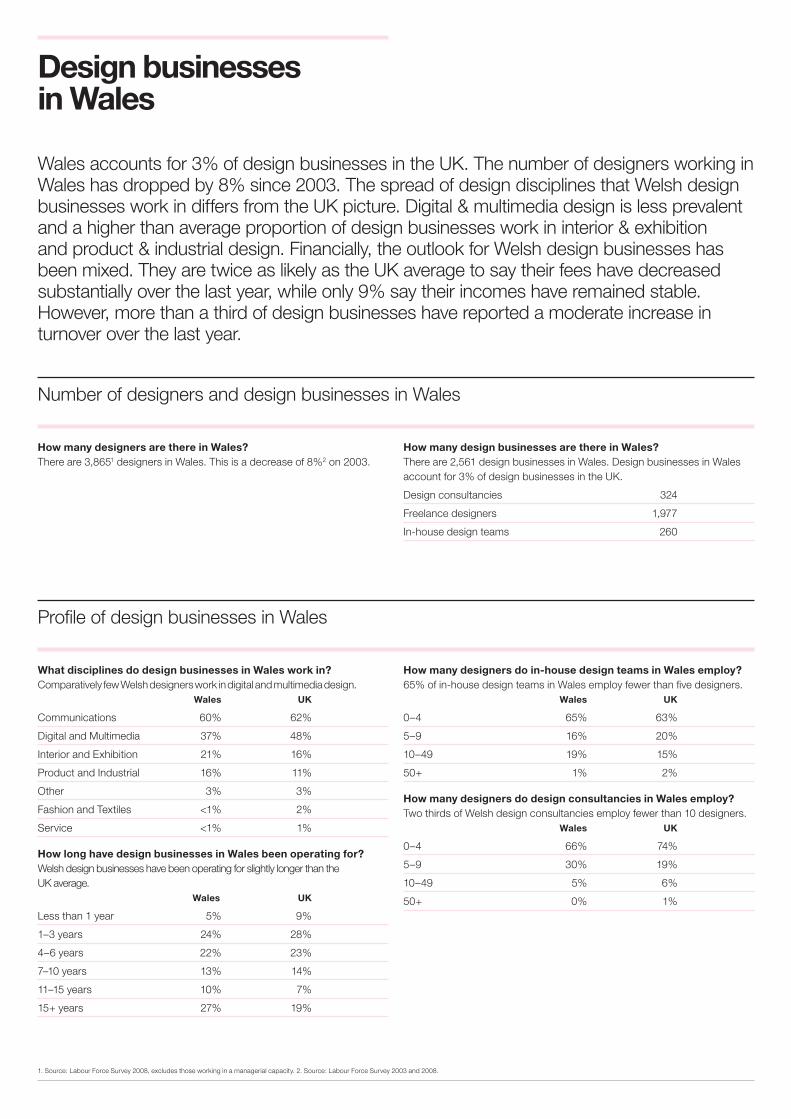
Design businesses in Wales
Wales accounts for 3% of design businesses in the UK. The number of designers working in Wales has dropped by 8% since 2003. The spread of design disciplines that Welsh design businesses work in differs from the UK picture. Digital & multimedia design is less prevalent and a higher than average proportion of design businesses work in interior & exhibition and product & industrial design. Financially, the outlook for Welsh design businesses has been mixed. They are twice as likely as the UK average to say their fees have decreased substantially over the last year, while only 9% say their incomes have remained stable. However, more than a third of design businesses have reported a moderate increase in turnover over the last year.
How many designers are there in Wales? There are 3,8651 designers in Wales. This is a decrease of 8%2 on 2003.
What disciplines do design businesses in Wales work in?Comparatively few Welsh designers work in digital and multimedia design. Wales UK
Communications 60% 62%
Digital and Multimedia 37% 48%
Interior and Exhibition 21% 16%
Product and Industrial 16% 11%
Other 3% 3%
Fashion and Textiles <1% 2%
Service <1% 1%
How long have design businesses in Wales been operating for? Welsh design businesses have been operating for slightly longer than the UK average. Wales UK
Less than 1 year 5% 9%
1–3 years 24% 28%
4–6 years 22% 23%
7–10 years 13% 14%
11–15 years 10% 7%
15+ years 27% 19%
How many designers do in-house design teams in Wales employ?65% of in-house design teams in Wales employ fewer than five designers. Wales UK
0–4 65% 63%
5–9 16% 20%
10–49 19% 15%
50+ 1% 2%
How many designers do design consultancies in Wales employ?Two thirds of Welsh design consultancies employ fewer than 10 designers. Wales UK
0–4 66% 74%
5–9 30% 19%
10–49 5% 6%
50+ 0% 1%
Number of designers and design businesses in Wales
How many design businesses are there in Wales? There are 2,561 design businesses in Wales. Design businesses in Wales account for 3% of design businesses in the UK.
Design consultancies 324
Freelance designers 1,977
In-house design teams 260
Profile of design businesses in Wales
1. Source: Labour Force Survey 2008, excludes those working in a managerial capacity. 2. Source: Labour Force Survey 2003 and 2008.
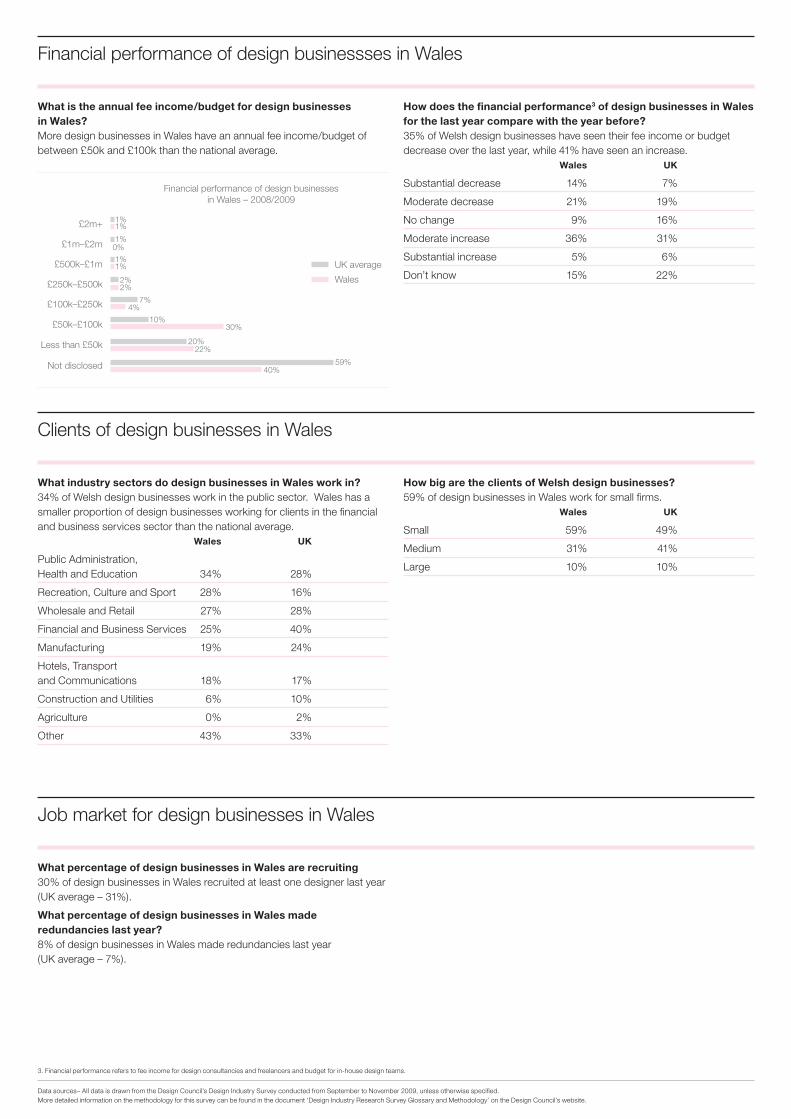
What is the annual fee income/budget for design businesses in Wales?More design businesses in Wales have an annual fee income/budget of between £50k and £100k than the national average.
How does the financial performance3 of design businesses in Wales for the last year compare with the year before? 35% of Welsh design businesses have seen their fee income or budget decrease over the last year, while 41% have seen an increase. Wales UK
Substantial decrease 14% 7%
Moderate decrease 21% 19%
No change 9% 16%
Moderate increase 36% 31%
Substantial increase 5% 6%
Don’t know 15% 22%
What industry sectors do design businesses in Wales work in?34% of Welsh design businesses work in the public sector. Wales has a smaller proportion of design businesses working for clients in the financial and business services sector than the national average. Wales UK
Public Administration, Health and Education 34% 28%
Recreation, Culture and Sport 28% 16%
Wholesale and Retail 27% 28%
Financial and Business Services 25% 40%
Manufacturing 19% 24%
Hotels, Transport and Communications 18% 17%
Construction and Utilities 6% 10%
Agriculture 0% 2%
Other 43% 33%
How big are the clients of Welsh design businesses? 59% of design businesses in Wales work for small firms. Wales UK
Small 59% 49%
Medium 31% 41%
Large 10% 10%
Financial performance of design businessses in Wales
Clients of design businesses in Wales
What percentage of design businesses in Wales are recruiting 30% of design businesses in Wales recruited at least one designer last year (UK average – 31%).
What percentage of design businesses in Wales made redundancies last year?8% of design businesses in Wales made redundancies last year (UK average – 7%).
Job market for design businesses in Wales
3. Financial performance refers to fee income for design consultancies and freelancers and budget for in-house design teams.
Data sources– All data is drawn from the Design Council’s Design Industry Survey conducted from September to November 2009, unless otherwise specified. More detailed information on the methodology for this survey can be found in the document ‘Design Industry Research Survey Glossary and Methodology’ on the Design Council’s website.
Financial performance of design businesses in Wales – 2008/2009
£2m+
£1m–£2m
£500k–£1m
£250k–£500k
£100k–£250k
£50k–£100k
22%
40%
20%
59%
10%30%
7%
2%
1%
1%
1%
4%
2%
1%
1%
0%
UK average
Wales
Less than £50k
Not disclosed
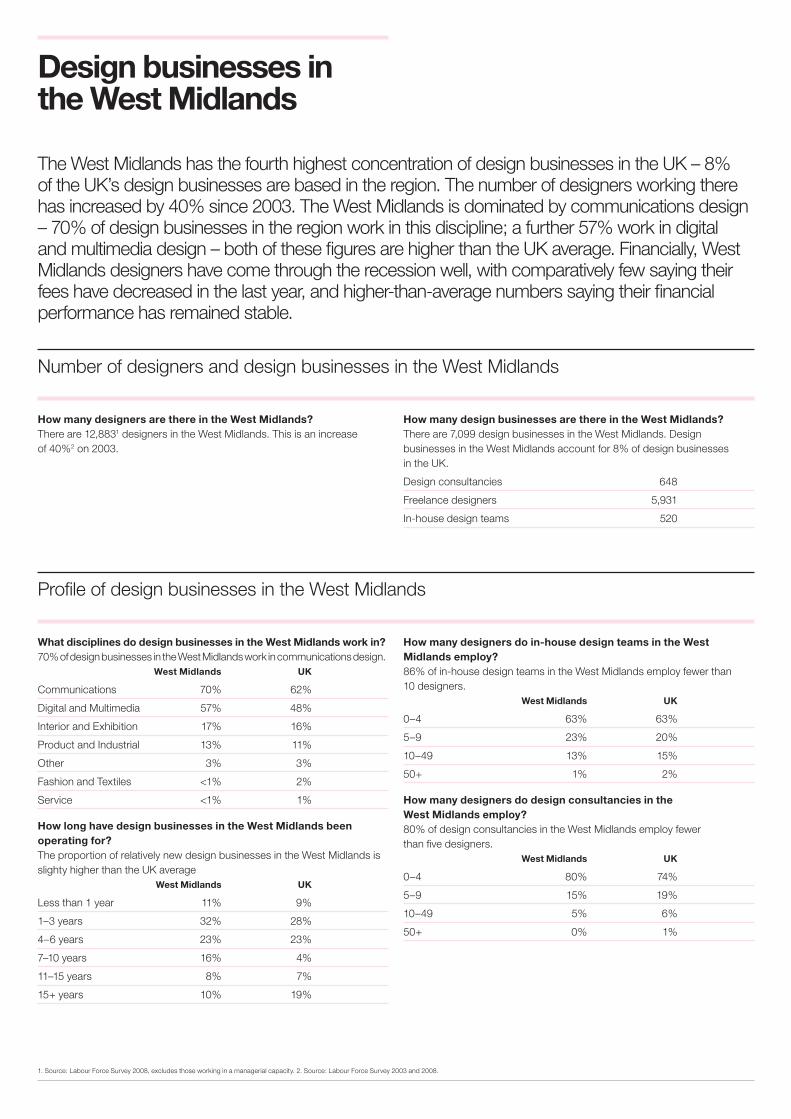
Design businesses in the West Midlands
The West Midlands has the fourth highest concentration of design businesses in the UK – 8% of the UK’s design businesses are based in the region. The number of designers working there has increased by 40% since 2003. The West Midlands is dominated by communications design – 70% of design businesses in the region work in this discipline; a further 57% work in digital and multimedia design – both of these figures are higher than the UK average. Financially, West Midlands designers have come through the recession well, with comparatively few saying their fees have decreased in the last year, and higher-than-average numbers saying their financial performance has remained stable.
How many designers are there in the West Midlands?There are 12,8831 designers in the West Midlands. This is an increase of 40%2 on 2003.
What disciplines do design businesses in the West Midlands work in?70% of design businesses in the West Midlands work in communications design. West Midlands UK
Communications 70% 62%
Digital and Multimedia 57% 48%
Interior and Exhibition 17% 16%
Product and Industrial 13% 11%
Other 3% 3%
Fashion and Textiles <1% 2%
Service <1% 1%
How long have design businesses in the West Midlands been operating for? The proportion of relatively new design businesses in the West Midlands is slighty higher than the UK average West Midlands UK
Less than 1 year 11% 9%
1–3 years 32% 28%
4–6 years 23% 23%
7–10 years 16% 4%
11–15 years 8% 7%
15+ years 10% 19%
How many designers do in-house design teams in the West Midlands employ?86% of in-house design teams in the West Midlands employ fewer than 10 designers. West Midlands UK
0–4 63% 63%
5–9 23% 20%
10–49 13% 15%
50+ 1% 2%
How many designers do design consultancies in the West Midlands employ?80% of design consultancies in the West Midlands employ fewer than five designers. West Midlands UK
0–4 80% 74%
5–9 15% 19%
10–49 5% 6%
50+ 0% 1%
Number of designers and design businesses in the West Midlands
How many design businesses are there in the West Midlands? There are 7,099 design businesses in the West Midlands. Design businesses in the West Midlands account for 8% of design businesses in the UK.
Design consultancies 648
Freelance designers 5,931
In-house design teams 520
Profile of design businesses in the West Midlands
1. Source: Labour Force Survey 2008, excludes those working in a managerial capacity. 2. Source: Labour Force Survey 2003 and 2008.
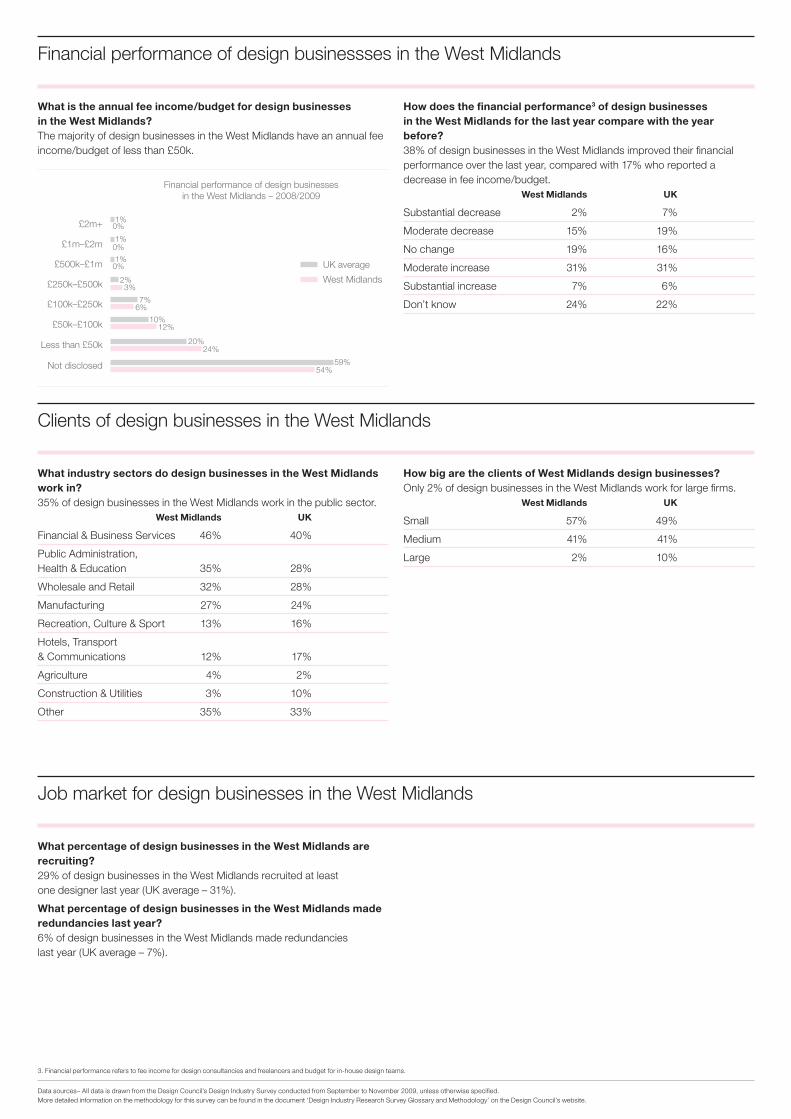
What is the annual fee income/budget for design businesses in the West Midlands?The majority of design businesses in the West Midlands have an annual fee income/budget of less than £50k.
How does the financial performance3 of design businesses in the West Midlands for the last year compare with the year before? 38% of design businesses in the West Midlands improved their financial performance over the last year, compared with 17% who reported a decrease in fee income/budget. West Midlands UK
Substantial decrease 2% 7%
Moderate decrease 15% 19%
No change 19% 16%
Moderate increase 31% 31%
Substantial increase 7% 6%
Don’t know 24% 22%
What industry sectors do design businesses in the West Midlands work in?35% of design businesses in the West Midlands work in the public sector. West Midlands UK
Financial & Business Services 46% 40%
Public Administration, Health & Education 35% 28%
Wholesale and Retail 32% 28%
Manufacturing 27% 24%
Recreation, Culture & Sport 13% 16%
Hotels, Transport & Communications 12% 17%
Agriculture 4% 2%
Construction & Utilities 3% 10%
Other 35% 33%
How big are the clients of West Midlands design businesses?Only 2% of design businesses in the West Midlands work for large firms. West Midlands UK
Small 57% 49%
Medium 41% 41%
Large 2% 10%
Financial performance of design businessses in the West Midlands
Clients of design businesses in the West Midlands
What percentage of design businesses in the West Midlands are recruiting? 29% of design businesses in the West Midlands recruited at least one designer last year (UK average – 31%).
What percentage of design businesses in the West Midlands made redundancies last year? 6% of design businesses in the West Midlands made redundancies last year (UK average – 7%).
Job market for design businesses in the West Midlands
3. Financial performance refers to fee income for design consultancies and freelancers and budget for in-house design teams.
Data sources– All data is drawn from the Design Council’s Design Industry Survey conducted from September to November 2009, unless otherwise specified. More detailed information on the methodology for this survey can be found in the document ‘Design Industry Research Survey Glossary and Methodology’ on the Design Council’s website.
Financial performance of design businesses in the West Midlands – 2008/2009
£2m+
£1m–£2m
£500k–£1m
£250k–£500k
£100k–£250k
£50k–£100k
24%
54%
20%
59%
10%12%
7%
2%
1%
1%
1%
6%
3%
0%
0%
0%
UK average
West Midlands
Less than £50k
Not disclosed
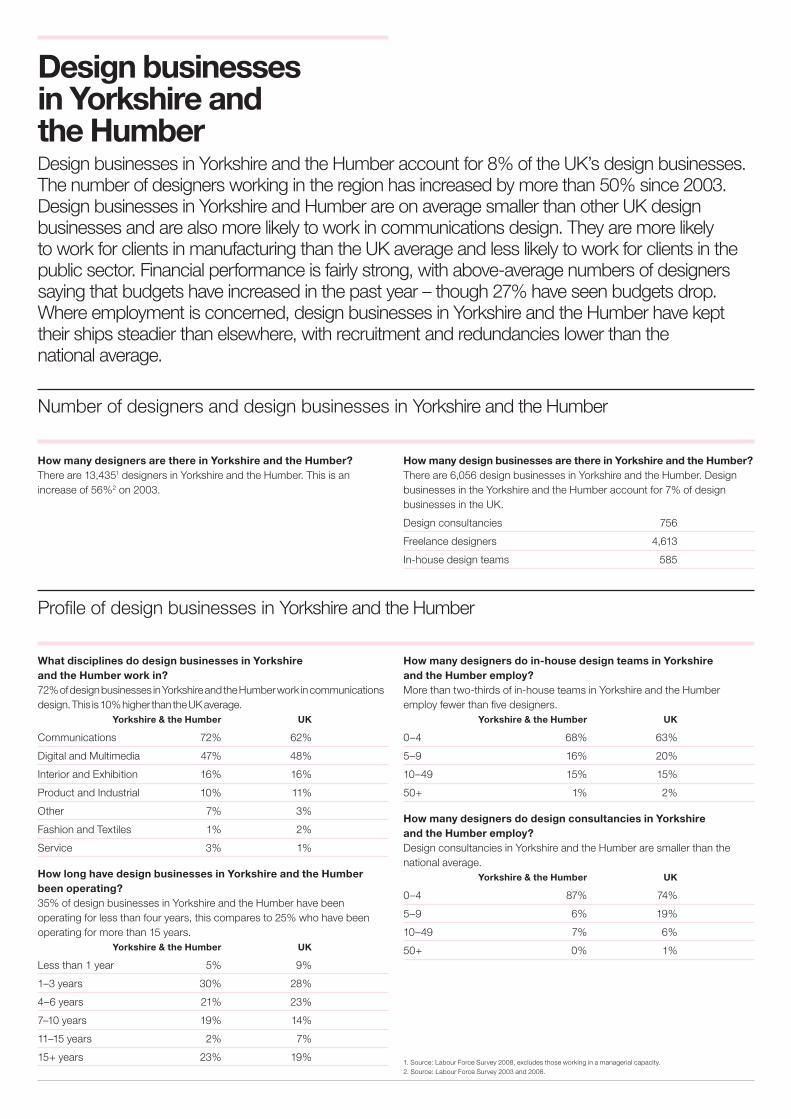
Design businesses in Yorkshire and the Humber Design businesses in Yorkshire and the Humber account for 8% of the UK’s design businesses. The number of designers working in the region has increased by more than 50% since 2003. Design businesses in Yorkshire and Humber are on average smaller than other UK design businesses and are also more likely to work in communications design. They are more likely to work for clients in manufacturing than the UK average and less likely to work for clients in the public sector. Financial performance is fairly strong, with above-average numbers of designers saying that budgets have increased in the past year – though 27% have seen budgets drop. Where employment is concerned, design businesses in Yorkshire and the Humber have kept their ships steadier than elsewhere, with recruitment and redundancies lower than the national average.
How many designers are there in Yorkshire and the Humber? There are 13,4351 designers in Yorkshire and the Humber. This is an increase of 56%2 on 2003.
What disciplines do design businesses in Yorkshire and the Humber work in?72% of design businesses in Yorkshire and the Humber work in communications design. This is 10% higher than the UK average. Yorkshire & the Humber UK
Communications 72% 62%
Digital and Multimedia 47% 48%
Interior and Exhibition 16% 16%
Product and Industrial 10% 11%
Other 7% 3%
Fashion and Textiles 1% 2%
Service 3% 1%
How long have design businesses in Yorkshire and the Humber been operating? 35% of design businesses in Yorkshire and the Humber have been operating for less than four years, this compares to 25% who have been operating for more than 15 years. Yorkshire & the Humber UK
Less than 1 year 5% 9%
1–3 years 30% 28%
4–6 years 21% 23%
7–10 years 19% 14%
11–15 years 2% 7%
15+ years 23% 19%
How many designers do in-house design teams in Yorkshire and the Humber employ? More than two-thirds of in-house teams in Yorkshire and the Humber employ fewer than five designers. Yorkshire & the Humber UK
0–4 68% 63%
5–9 16% 20%
10–49 15% 15%
50+ 1% 2%
How many designers do design consultancies in Yorkshire and the Humber employ?Design consultancies in Yorkshire and the Humber are smaller than the national average. Yorkshire & the Humber UK
0–4 87% 74%
5–9 6% 19%
10–49 7% 6%
50+ 0% 1%
Number of designers and design businesses in Yorkshire and the Humber
How many design businesses are there in Yorkshire and the Humber?There are 6,056 design businesses in Yorkshire and the Humber. Design businesses in the Yorkshire and the Humber account for 7% of design businesses in the UK.
Design consultancies 756
Freelance designers 4,613
In-house design teams 585
Profile of design businesses in Yorkshire and the Humber
1. Source: Labour Force Survey 2008, excludes those working in a managerial capacity. 2. Source: Labour Force Survey 2003 and 2008.
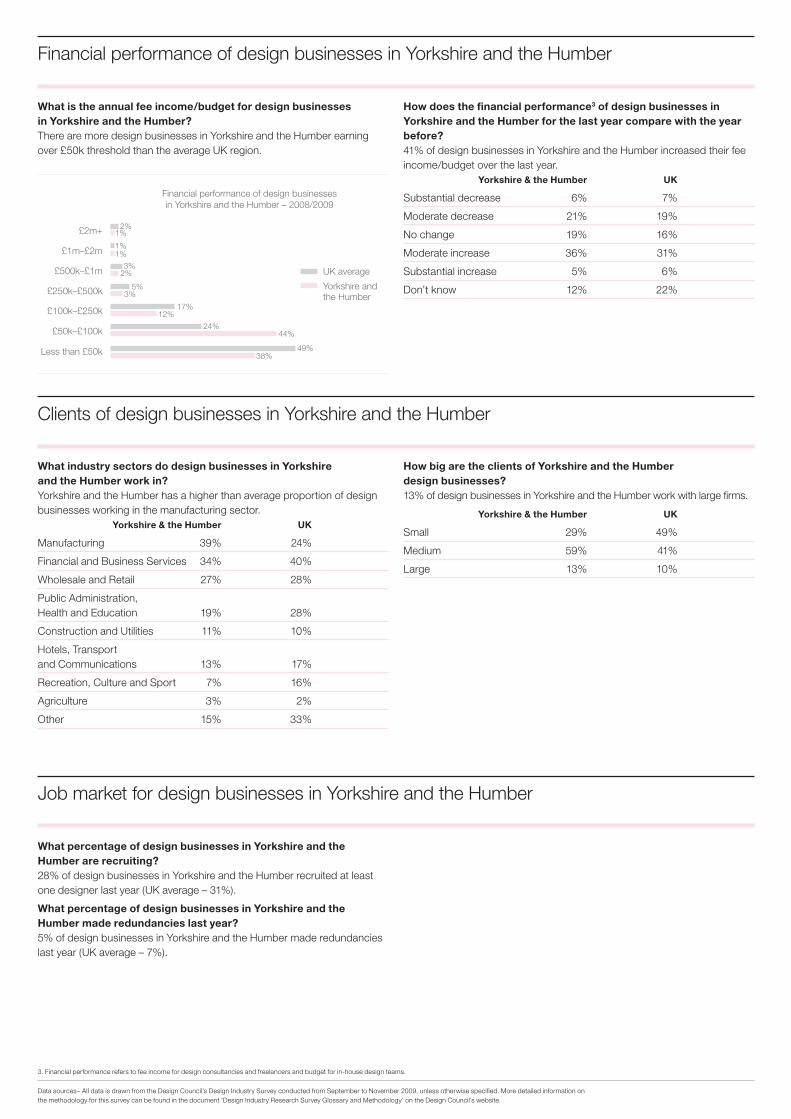
What is the annual fee income/budget for design businesses in Yorkshire and the Humber?There are more design businesses in Yorkshire and the Humber earning over £50k threshold than the average UK region.
How does the financial performance3 of design businesses in Yorkshire and the Humber for the last year compare with the year before? 41% of design businesses in Yorkshire and the Humber increased their fee income/budget over the last year. Yorkshire & the Humber UK
Substantial decrease 6% 7%
Moderate decrease 21% 19%
No change 19% 16%
Moderate increase 36% 31%
Substantial increase 5% 6%
Don’t know 12% 22%
What industry sectors do design businesses in Yorkshire and the Humber work in? Yorkshire and the Humber has a higher than average proportion of design businesses working in the manufacturing sector. Yorkshire & the Humber UK
Manufacturing 39% 24%
Financial and Business Services 34% 40%
Wholesale and Retail 27% 28%
Public Administration, Health and Education 19% 28%
Construction and Utilities 11% 10%
Hotels, Transport and Communications 13% 17%
Recreation, Culture and Sport 7% 16%
Agriculture 3% 2%
Other 15% 33%
How big are the clients of Yorkshire and the Humber design businesses? 13% of design businesses in Yorkshire and the Humber work with large firms.
Yorkshire & the Humber UK
Small 29% 49%
Medium 59% 41%
Large 13% 10%
Financial performance of design businesses in Yorkshire and the Humber
Clients of design businesses in Yorkshire and the Humber
What percentage of design businesses in Yorkshire and the Humber are recruiting?28% of design businesses in Yorkshire and the Humber recruited at least one designer last year (UK average – 31%).
What percentage of design businesses in Yorkshire and the Humber made redundancies last year?5% of design businesses in Yorkshire and the Humber made redundancies last year (UK average – 7%).
Job market for design businesses in Yorkshire and the Humber
3. Financial performance refers to fee income for design consultancies and freelancers and budget for in-house design teams.1. Source: Labour Force Survey 2008, excludes those working in a managerial capacity. 2. Source: Labour Force Survey 2003 and 2008.
Data sources– All data is drawn from the Design Council’s Design Industry Survey conducted from September to November 2009, unless otherwise specified. More detailed information on the methodology for this survey can be found in the document ‘Design Industry Research Survey Glossary and Methodology’ on the Design Council’s website.
Financial performance of design businesses in Yorkshire and the Humber – 2008/2009
£2m+
£1m–£2m
£500k–£1m
£250k–£500k
£100k–£250k
£50k–£100k
38%49%
24%44%
17%
5%
3%
2%
1%
12%
3%
2%
1%
1%
UK average
Yorkshire and the Humber
Less than £50k