Embed Size (px)
Citation preview

Outgoing Chair’s Messageby Don Emerling
My year as Chairhas passed. I sur-vived the endlessadministrative dutiesassociated with thejob, no worse for thewear. To be honest,the minor administra-
tive headaches are buried in a moun-tain of memories of wonderful experi-ences and relationships. Old friend-ships have grown and I have had toopportunity to begin new friendshipsthis year. I leave with memories thatwill stay with me a lifetime.
Working in this Division has beenthe most enjoyable professional expe-rience of my life. I pass on my chair-manship to a leadership team that willdo great things in the coming yearsfor the members of our Division. DonWilliams, the current Chair, will be astrong leader. I am honored to callhim my friend. Good luck Don andkeep “hittin’ them straight!” BobMitchell, Janice Shade, and JacobVan Bowen will continue to dedicatetheir time and talents to the leader-ship of the Division. I value the timewe have spent together, I have neverlaughed as much as when we worktogether. Thanks for everything, myfriends. I have enjoyed every minuteI’ve spent with you.
There are many other leaders whohave helped me during my experi-ence with the Statistics Division. Aspecial thanks to Beth Propst for all
Volume 17, No. 3 Fall, 1998
©
Inside This Issue
Outgoing Chair’s Message .......................................................................................p. 1Incoming Chair’s Message .......................................................................................p. 1Mission, Vision, etc ..................................................................................................p. 2Editor’s Message.......................................................................................................p. 3Letters to the Editor..................................................................................................p. 5List of Officers and Chairs .......................................................................................p. 8Philadelphia AQC Report.......................................................................................p. 10Statistics Division History Board ...........................................................................p. 12Philadelphia AQC Collage .....................................................................................p. 14New Statistics Division Officers.............................................................................p. 15Deming Conference On Applied Statistics ...........................................................p. 16Call for Papers, 1999 FT.........................................................................................p. 16Minipaper (Left Brained and…) ............................................................................p. 17Fall Technical Conference, 1998 ...........................................................................p. 19FTC Program, 1998.................................................................................................p. 21Statistical Clearinghouse ........................................................................................p. 23
of her guidance and leadership as my“mentor” in her year as Division Chair.Beth was a participant (and ofteninstigator) of the many long, yetslightly crazy, meetings I have enjoyedover the past years. A special thanksto Nancy Belunis for her friendshipand guidance on the “ins” and “outs”of ASQ and the Statistics Division.Nancy knows more about the work-ings of ASQ than anyone outside ofMilwaukee. She always had theanswer when I was looking to getsomething done. A special thanks toLynne Hare for his seemingly endlesscommitment to the Statistics Division,his counsel, his leadership of the
Incoming Chair’s
Messageby Don Williams
Continued on page 4Continued on page 4
During the morethan ten years that Ihave been associatedwith the StatisticsDivision, I have hadthe opportunity to beassociated with manyhard-working, dedi-
cated members. Their commitmentand Herculean efforts have led to thecurrent status of the Division. Duringthis time, I have seen the Division gothrough long-range planning, strategicplanning, and tactical planning.Sometimes I, and I feel sure many

2 ASQ STATISTICS DIVISION NEWSLETTER, VOL. 17, No. 3
PLEASE NOTE: These are the new Mission, Vision, Desired Division End-State, Principles andStrategy approved at the 1998 AQC. We invite your comments.
MISSIONI. Promote Statistical Thinking for quality and productivity improvement.II. Serve ASQ, business, industry, academia and government as a resource for effective use
of Statistical Thinking for quality and productivity improvement.A. Our primary customers are Statistics Division members.B. Other key customers are:
1. Management2. Users and potential users of Statistical Thinking for quality and productivity
improvement3. Educators of the above customers
III. Provide a focal point within ASQ for application-driven development and effective use ofnew statistical methods.
IV. Support the growth and development of ASQ Statistics division members.
DESIRED DIVISION END-STATEI. Our members will be proud to be part of the Division.II. Our Division’s operations will be a model for other organizations.
III. We will be a widely influential authority on scientific approaches to quality and produc-tivity improvement.
PRINCIPLESI. Our customers’ needs will be continuously anticipated and met by pro-actively develop-
ing and delivering customer-focused activities and products.II. Our market focus for products and services is weighted as follows:
A. Greatest weight on intermediate level;B. Nearly as much weight on basic level;C. Much less weight on advanced level.
III. Focus on a few key things.IV. Balance short-term and long-term efforts.V. Value diversity (including geographical and occupational) of our membership.VI. Recognize that we exist for our customers.
VII. View statistics from the broad view of quality management.VIII. Apply Statistical Thinking ourselves; that is, practice what we preach.IX. Uphold professional ethics.X. Continuously improve Division management, activities, and products.
STRATEGYI. Design & deliver selected useable products.II. Have a strong and vibrant Division infrastructure.III. Demonstrate the broad effectiveness of Statistical Thinking.IV. Integrate Statistical Thinking into the educational curricula.V. Drive the application of Statistical Thinking in all areas.VI. Develop a vibrant information communication system.
VII. Influence key decision makers.
Criteria for Basic
Tools and
Mini-Paper
Columns
Basic ToolsPurpose: To inform/teach the “qualitypractitioner” about useful techniques thatcan be easily understood, applied andexplained to others.
Criteria:1. Application oriented/not theory2. Non-technical in nature3. Techniques that can be understood and
applied by non-statisticians.4. Approximately three to five pages or
less in length (8 1/2” x 11” typewritten,single spaced.)
5. Should be presented in “how to use it”fashion.
6. Should include applicable examples.
Possible Topics:New SPC techniquesGraphical techniquesStatistical thinking principles“Rehash” established methods
Mini-PaperPurpose: To provide insight into applica-tion-oriented techniques of significantvalue to quality professionals.
Criteria:1. Application oriented.2. More technical than Basic Tools, but
contains no mathematical derivations.3. Focus is on insight into why a technique
is of value.4. Approximately six to eight pages or less
in length (8 1/2” x 11” typewritten, sin-gle spaced.)Longer articles may be submitted andpublished in two parts.
5. Not overly controversial.6. Should include applicable examples.
General InformationAuthors should have a conceptual
understanding of the topic and should bewilling to answer questions relating to thearticle through the newsletter. Authors donot have to be members of the StatisticsDivision.
Submissions may be made at any timeto the Statistics Division Newsletter Editor.All articles will be reviewed. The editorreserves discretionary right in determina-tion of which articles are published.
Acceptance of articles does not implyany agreement that a given article will bepublished. ∆
DisclaimerThe technical content of material published in the ASQ Statistics Division Newsletter may not havebeen refereed to the same extent as the rigorous refereeing that is undergone for publication inTechnometrics or J.Q.T. The objective of this newsletter is to be a forum for new ideas and to beopen to differing points of view. The editor will strive to review all articles and to ask other statisticsprofessionals to provide reviews of all content of this newsletter. We encourage readers withdiffering points of view to write to the editor and request an opportunity to present their views viaa letter to the editor. The views expressed in material published in this newsletter represents theviews of the author of the material, and may or may not represent the official views of the StatisticsDivision of ASQ.
VISIONStatistical Thinking Everywhere
Philosophy Analysis Action
System Thinking Statistical Methods
Process Variation Data Improvement

ASQ STATISTICS DIVISION NEWSLETTER, VOL. 17, No. 3 3
STATISTICAL THINKING?? In hisChair’s Message in the Spring ’98 issue ofthe Stat Division Newsletter, Don Emerlingdiscussed the interplay between StatisticalMethods and Statistical Thinking. Donposed the question: “If our vision is now‘Statistical Thinking Everywhere’ does thismean we are abandoning Statistical
Methods?” In response Don made this comment “...thevision ‘Statistical Thinking Everywhere’ incorporates theinteraction and strong interdependence between thephilosophy of Statistical Thinking and the body ofknowledge called Statistical Methods”. As Don pointed out,as the problem solving process moves from the Philosophyphase (Statistical Thinking) to the Analysis phase (theblending point where Statistical Thinking and StatisticalMethods meet, interact and synergize), and then on to theAction phase (Statistical Methods), we observe thatStatistical Methods now become more dominant. Finally,Don says “I hope this discussion has helped you under-stand the strong interdependence between StatisticalThinking and Statistical Methods.” As I understand Don’smessage, the Statistics Division’s support for improvedunderstanding and application of Statistical Thinking doesnot represent or imply that the division is abandoning itssupport of appropriate training in Statistical Theory andMethods. Don’s message tells me that good training inStatistical Methods coupled with a good understanding ofStatistical Thinking provides the best combination forproblem solving.
Some would argue that the interaction betweenStatistical Thinking and Statistical Methods is much moreiterative/interactive than that. At the beginning phases ofthe problem solving process, the point at which the prob-lem is still being defined, the definition of the problemmay depend on what data can be obtained and whetherthere is an appropriate Statistical Method which can helpprovide a resolution to the problem. Similarly, theStatistical Methods considered at that stage may depend onthe ability of the client to grasp the results of the analysis.Throughout the process, we have an interplay between thecontext in which the problem exists, the statement of the‘problem’, the design of the ‘experiment’, the data collec-tion, the analysis of the data, the interpretation of theresults, and the communication of the results. We may, infact, cycle through this many times at different stages of the‘project’, all the while refining how we resolve the‘problem’. If we choose to restrict ourselves to ‘simplified’statistical methods, then we will likely not answer thequestion correctly.
In the same message Don refers to Lynn Hare’s experi-ence that improved and increased use of StatisticalMethods followed when his colleagues developed a betterunderstanding of Statistical Thinking. I quote Lynn: “The
use of statistical tools is greater and of higher quali-ty in a Statistical Thinking environment”. To me, thissuggests that as everyone (including statisticians) improvestheir understanding of processes, of the interconnectednessof processes, of the variability inherent in all processes, ofthe need to explain, understand, reduce and control vari-ability, then the proper use of Statistical Methods willincrease. To a statistician like myself, one of the messagesthat I heard was that I have to be aware of the interfacebetween me and my customer, and of my customer’sability to apply and use the analysis which I perform. First,I should not treat the problem like a numerical exercise,but must probe the customer’s mind to understand themotivation for the study, the purpose for the analysis andthe interconnection to other activities in the customer’slab/factory/etc. And, of course, I should ideally beinvolved in the project from the inception, particularly theprocess of designing the experiment or the data collectionprocedures. Good data which answers the wrong questionisn’t of much value regardless of the statistical methodsused. Treating the situation like a numerical exercise wasand is a recipe for failure.
Let’s review the first three principles of StatisticalThinking:
1.“All work occurs in a system of interconnectedprocesses”.
2.“Variation exists in all processes”.3.“Understanding and reducing variation are keys to
success”.There are times when I understand that more than one
method of analysis may be equally appropriate andequally powerful in getting an appropriate answer for myclient. In those cases I should try to provide the simplestcorrect analysis which meets my client’s needs. It would becounterproductive to try to overwhelm my client with a‘high-powered’ analysis when a simple, straightforwardanalysis is appropriate. Similarly, there are times when onlya ‘high-powered’ analysis is appropriate, and it is thenimperative that I educate my client in the interpretation ofthat analysis, that I properly understand the implementa-tion of the results of that analysis, and that I understandthe interconnectedness of the results of my analysis withother related activities. In order for me to make thesejudgements I must have broad training in StatisticalMethods and training/understanding of Statistical Thinking.
Unfortunately some have taken the Statistical Thinkingargument to mean that one can get by with just a few sim-ple easy-to-implement, easy-to-understand statistical ‘tools’,as long as the ‘process’ view is in place and one remem-bers that variability is everywhere. The emphasis appearsto be on ‘easy-to-explain’, without full consideration forappropriateness or power. In other words, let’s get rid ofthe Statistical Methods educators, ’cause all they know isformulas. Having done that, let’s learn just a couple of ‘uni-versally applicable’ statistical tools, and let’s use them allthe time. If that’s the road we’re going down, we become
Editor’s Messageby Ralph St. John
Continued on page 9

4 ASQ STATISTICS DIVISION NEWSLETTER, VOL. 17, No. 3
Awards Committee, and most impor-tantly his friendship. A special thanksto Galen Britz. Galen is the personwho introduced me to the leadershipof the Division many years ago at theFTC in Lexington, Kentucky. We havebeen friends for a long time, and he isone of the real mentors of my life. Hehas been a leader of this Division fora lot of years and continues to beactive as the head the Hunter AwardCommittee. Thank you Galen.
Thanks to Lynne Hare, RogerHoerl, Ron Snee, Janice Shade andGalen Britz for sharing their knowl-edge and experience about StatisticalThinking. Their leadership in thisbody of knowledge has changed theway I think about statistics and itsapplication to my daily work.Everyone in the Statistics Divisionowes them a debt of gratitude.
There are many other contributorsto the success of this Division. Thanksto Dick Kleinknecht for his leader-ship of the Statistics Division sessionat the 1998 AQC. Dick put together agreat program and then “jumpedthrough hoops” to pull it off after theluncheon ran well into his sessiontime. Thanks to Sue Albin and MelAlexander for their work at the 1997FTC. Thanks to Gipsie Ranney for agreat Youden Address at the 1997FTC. Thanks to Ralph St. John for hiseditorial skills, and delivering a world-class newsletter. Ralph has had to livewith the frustration of pulling informa-tion out of me on time (or close to ontime!) to meet deadlines. Thanks foryour dedication and friendship. Aspecial thanks to Frank Alt who hasretired from his position after manyyears of service as the StatisticsDivision liaison to the DemingConference on Applied Statistics.Thanks to JL Madrigal for his innova-tive leadership as the membershipchair and his commitment to develop-ing the concept of Section Liaisons.
OUTGOING CHAIR’S MESSAGEContinued from page 1
Thanks to Tim Fuller for volun-teering his time to lead the StatisticsDivision pre-conference workshop atthe 1998 AQC. Thanks to EdSchilling for his strong leadership ofthe Standards Committee. Thanks toNick Martino for his continuing lead-ership of the Certification Committee.Thanks to Mark Kiel for his innova-tive development of the StatisticsDivision web page (http://www.asq.org/about/divisions/stats/). Thanks toRon Fricker, Ha Dao, JonathanDemarest, Colette Glaeser, Ram
Sitaraman, Marcey Abate for volun-teering to be Technical Paperreviewers for the 1998 AQC. Thanksto Ha Dao, and Colette Glaeser forvolunteering to be Session Managersat the 1998 AQC. Thanks to MarilynHwan for her leadership of theEducation Committee. Thanks to BobPerry for his many years of dedicatedservice as the Examining CommitteeChair. Thanks to Danny Duhan wholead our GTC group with knowledgeand wisdom.
INCOMING CHAIR’S MESSAGEContinued from page 1
others, have thought that we had donea lot of planning without much imple-mentation. In reality, much has beendone; yet much remains to be done.
Some of the significant accomplish-ments include the development of themeaning of “Statistical Thinking”followed by several special publica-tions about statistical thinking.Significant progress has been madetoward further demonstrating thebroad applications of statistical think-ing and integrating statistical thinkinginto educational curricula. TheDivision has established our presenceon the Internet with a webpage. Tobetter administer the progress onthese initiatives, a number of newpositions were created. This in turnhas created a need for more volun-teers to help. If you are interested ingetting involved in the Division,please review the Help Wanted sec-tion of this newsletter and contact theappropriate person for the job thatbest fits your interests and talents.Even if you don’t see a particular joblisted and you want to get involved inDivision activities, please contact one
of the officers. We have many areaswhere we have need for help.
Other key elements of theDivision’s strategic plan include thedeveloping of a customer informationsystem, designing and delivering newproducts, and developing a divisionmarketing plan. Anyone possessingskills in these areas and interested ingetting involved in the Division isparticularly encouraged to volunteer.It should present a great opportunityto make a significant contribution
I especially wish to thank DonEmerling for his leadership as Chairthis past year and for his manycontributions. We expect him toremain very involved with theDivision for many years to come, ashave most of our past officers. Thereare many others who have made verysignificant contributions. Thesignificant accomplishments for theDivision are seldom solely due to oneperson. Fortunately, the StatisticsDivision is blessed with many mem-bers who are very interested increating greater value for our member-
Continued on page 9
Continued on page 9

ASQ STATISTICS DIVISION NEWSLETTER, VOL. 17, No. 3 5
LETTERS TO
THE EDITOR:To the Editor:
The article entitled “Data “Sanity’:Statistical Thinking Applied toEveryday Data” by Davis Balestraccipublished as a Special Publication bythe ASC Statistics Division is longenough and deals with an importantenough subject to provoke some seri-ous discussion. Here are my com-ments.
First, my compliments to the authorfor an entertaining recital of the diffi-culties we all have had as a result ofinadequately informed peopleattempting to interpret tables of data.As R. A. Fisher put it in his classicbook The Design of Experiments, “ ...the subject matter of this book hasbeen regarded from the point of viewof an experimenter, who wishes tocarry out his work competently, andhaving done so wishes to safeguardhis results, so far as they are validlyestablished, from ignorant criticism bydifferent sorts of superior persons.”Mr. Balestracci is concerned withavoiding ignorant analysis by differentsorts of superior persons.
In the course of this tutorial piecethe author puts down conventionalstatistical analysis, for example,“Statistics from Hell 101”. In place ofthis he proposes to show how simpletechniques such as runs tests can beapplied to an individuals chart toexpose the information it contains. Itwould seem to me to be more usefulto motivate the reader to return to hisstatistics text now that he has a needfor the subject that is both personallyreal and practical. It is the absence ofthese two characteristics that probablymade the statistics lectures so easy toforget.
The first example (page 8) dealswith data from a hospital satisfactionsurvey. Nineteen months of data aregiven. Using a run-length test, it isconcluded that no change hasoccurred over the 19 months. Butsuppose that the data were examinedafter the first year of attempting toimprove customer satisfaction. A linear
regression analysis of the results of thefirst year shows a significant trend up(p = 0.004). The run-length test doesnot specifically address the question:Is quality of service improving? Thistest is more aptly applied to the ques-tion: Was there a jump (as opposed toa trend) in the quality of service?
Interpreting survey results is a diffi-cult and sometimes dangerous busi-ness. But consider this scenario forExample 1: service improved over thefirst year. By the second year the newlevel of service had become the aver-age in the eyes of the respondents,and they began to rate it that way.
The second example (page 9) isanother instance of a technique dri-ving the analysis rather than a ques-tion driving the analysis. A run chartof “Sweat Index” is shown for dataafter a change (improvement?) follow-ing point number 6. A number-of-runstest is applied and found not to besignificant (at α = 0.05). Case closed.However, suppose we test the hypoth-esis that no change occurred followingthe 6th point versus that an improve-ment occurred. Using the rank sumtest (no actual values are given, butranks can be applied) produces aresult significant at the 0.0009 level.Now the conclusion is that there wasdefinitely a reduction in the SweatIndex following point number 6. Thenumber-of-runs test, even with α =0.05, has failed to reveal this result.The statistical test should always bematched to the question.
Despite the fact that the authormakes light of using α = 0.05 (as wellas the 95% confidence interval), hegives Table 4.2 (page 10) which usesα = 0.05 (unlabeled) for each of theLower Limit and Upper Limit for num-ber of runs. (A table for α = 0. 005,
which is a lot closer to “three sigma”significance, is readily available.)
It is interesting to speculate on whythe author uses the 0.05 level of sig-nificance for the number-of-runs test.This test has poor efficiency, whichrelates to its capability to detect a realeffect. The frequency with which realeffects can be detected can beincreased by using a larger signifi-cance level (e.g., the 0.05 level insteadof the 3-sigma level of 0.00135). Butthe price to pay for this is an increasein the frequency with which an effectis declared real when it is not. A poortest cannot be made into a good oneby simply changing the level of signif-icance.
Plotting data is essential. The sim-ple run chart (individuals plotted intime sequence) provides a very usefulfirst look. But automatically applyingruns tests to test whatever hypothesisis of interest is not good statisticalpractice. “Statistical Thinking” givesone the correct viewpoint. But, thisthinking combined with two runs testsdoes not constitute much of a set oftools. Anyone who wishes to do gen-eral statistical analysis had better looka little more kindly on Statistics 101and refresh his memory on the won-derful array of tools that is available.
In the section entitled “How ManyStandard Deviations” (page 23), theauthor quotes “Shewhart, Ott, Deming,Joiner, Wheeler, and Hacquebord” asrecommending “three standard devia-tions”. This is an impressive list ofnames but is misleading because theauthor is referring to the Analysis ofMeans; whereas Shewhart, Ott, andDeming were referring to theShewhart control chart. The Analysisof Means is exactly analogous to the
Continued on page 6

6 ASQ STATISTICS DIVISION NEWSLETTER, VOL. 17, No. 3
one-way Analysis of Variance; it hasnothing to do with control charting.One might just as well recommendthat the critical value of 3 always beused for Student’s t test, which theAnalysis of Means becomes whenthere are only two means. The signif-icance level (and hence the criticalvalue) for a statistical test is chosenaccording to the consequences ofwrongly rejecting the null hypothesis.This is why Ott and others have pub-lished tables of critical values for avariety of significance levels for theAnalysis of Means.
The author has done a service inhis presentation and explication ofnumerous real-life examples. But Ithink he has also done a disserviceby illustrating applications of “quickand easy” statistical tests using exam-ples for which they are not appropri-ate, for misrepresenting the Analysisof Means technique, and by present-ing the idea that essentially nothing islost if one has forgotten what waspresented in statistics 101. Peoplewould be better advised to renewtheir acquaintance with basicstatistics. Statistical Thinking is onlythe prelude.
Dr. Lloyd S. NelsonLondonderry, NH
To the Editor:I just finished reading the latest
Special Publication (I’m probably abit behind everyone else being halfway around the world) and wantedto pass on my appreciation to theDivision (as well as to DavisBalestracci) for another excellentcontribution to field.
I have used and abused the“Statistical Thinking” publication aswell as all the peripheral material thathas grown from it to enhance theeducation of technology studentshere at Massey University. I believethey now walk away from 6 weeks(yes, only six weeks! EEEKs) of SPCwith a better understanding of varia-
tion and the real world of processes.I was elated to read the latest publi-cation and feel I have even morematerial to share with these studentswho are destined to become man-agers, engineers and quality profes-sionals.
Karen [email protected]
To the Editor:In the Spring 1998 issue of the Stat
Division newsletter, Robert Watkinsasked how to calculate standardnormal probabilities on a comput-er. This can be done in MicrosoftExcel, using the built-in statisticalfunctions. Choose “Insert,” “Function”from the main menu and select the“Statistical” group on the left side ofthe dialog box. The functions appearon the right. Use the “NORMSINV”function to return standard normalz-values for a given tail-area proba-bility. Use the “NORMINV” functionto return quantiles for any normaldistribution, given the probability,mean, and standard deviation. The“NORMSDIST” function returns nor-mal probability values, given a partic-ular z- value. The “NORMDIST”function returns normal probabilities,given a measured value, mean, andstandard deviation.
There are similar functions forother distributions, such as t, chi-square, and F. They can be used tofind critical values and p-values.
Brendan [email protected]
To the Editor:I read the letter from Robert
Watkins in the ASQ Stat DivisionSpring 98 Newsletter asking how tocalculate Standard Normal Tablevalues yourself. Here is how to do itusing statistical functions built intoMicrosoft Excel:
Use the “Insert” command inMicrosoft Excel to insert a statistical
function NORMSDIST. In the speci-fied cell, enter the function as fol-lows: =NORMSDIST(z) where z is thespecified z value or a reference toanother cell containing the z value.Use Microsoft Help for more help.For example, = NORMDIST(1.333333)equals 0.908789. Or if cell A1 of thespreadsheet contains the z value of1.5, the formula in the cell to outputNormal Standard Distribution is:==NORMSDIST(A1), which equals0.93319. I hope this helps.
Vinay [email protected]
To the Editor;I am a new member of the ASQ
Statistics Division. I just received theSpring 1998 issue of the StatisticsDivision Newsletter and found mostof the articles very interesting. I’d liketo get back issues of theNewsletter. Would you please tellme how I can get them? Your assis-tance is appreciated.
James [email protected]
James:Your question coincides with work
we are doing to post old issues of thenewsletter on the web. Thanks to agenerous grant from JamesVelayes of Southwestern Bell andthe diligent work of three graduatestudents (Leilei Ying, Fang Zhongand Emory Merriman), we have post-ed the first five years of newslettersat the URL http:// www.cba.bgsu.edu/asor/asqnews/ letter.htm. Wewill soon have newsletters from 1980to 1987 completed, and we will con-tinue until all past newsletters areposted. We will be adding a link tothis resource from the Stat Divisionwebpage at http://www.asq.org/about/ divisions/stats/. We hopeyou find this of interest, and weinvite your comments after you visit.I should add that my department atBGSU is providing space on its web
LETTERS, LETTERS, LETTERSContinued from page 5

ASQ STATISTICS DIVISION NEWSLETTER, VOL. 17, No. 3 7
site and graduate student support tocreate and maintain the files.
On a related note, we are con-sidering posting an abbreviatedSpanish version of the News-letter on the web. Is there interestin this? Please respond [email protected] .
Editor
To the Editor:I noted a reference to the Special
Publication “STATISTICAL THINK-ING” in the Chair’s Message in theSpring, 1998 issue of the ASQ Stat.Division Newsletter. How can I get acopy? If it is available to purchase,please tell me what the price is.Thanks.
Kirit [email protected]
Kirit:The Special Publication “STATISTI-
CAL THINKING” can be purchasedfrom ASQ for a modest fee ($8includes shipping). Call ASQ at1-800-248-1946 and ask for QIC atX8693. Ask for item #S0707. Givethem your member number and yourcredit card number and you’ll receive“STATISTICAL THINKING” within afew days. By the way, you can alsopurchase a set of Powerpoint slidesthat can be used to make a presenta-tion on Statistical Thinking. Thisis item #S0707DP ($10 includesshipping).
Editor
To the Editor:I would like to get a PowerPoint
slide of the “statistical thinking/methods” sketch shown on page 1of the spring 1998 Stat. Div. news-letter. Is this available? Thanks.
Harry [email protected]
Harry:The image is available on my web
site. The file name is vision.jpg and itis in the directory http://www. cba.bgsu.edu/asor/asqnews/index. htm.Once you get to that index click onthe file name to see the image andclick on ‘file’ and ‘save as’ to down-load the image.
Editor
To the Editor:I have a summer intern who is
interested in attending the 1998 FTC.She is working on her MS in Statisticsfrom Iowa State, and may be workingon a thesis project begun here duringher internship with 3M. How doesshe submit an application for one ofthe student grants to the FTC? Towhom? What are the criteria? Is therean official application form? Areletters of recommendation required?
I think this FTC Student GrantAward and the Gordon ResearchConference scholarship details(criteria, application forms, key dates,etc.) should be posted on our web-site along with the Ellis R. OttScholarship Award info.
Bob:As I am writing this, our webmas-
ter Mark Kiel is adding this informa-tion to the Stat Division web page.Mark has made a number of up-grades to our web page. Please visitthe site ( http://www.asq.org/ about/divisions/stats/ ) and send Mark yourcomments.
Editor
To the editor:I believe the question regarding
sample size posed by HarbandGrewal in the Spring ’98 newsletterdoes have a possible answer. Thesolution might follow Hahn andMeeker’s text titled “StatisticalIntervals” (see page 56 for using aNormal Assumption and page 84using a distribution-free approach).Using the historic values of the meanand standard deviation can then givean estimate of a sample size thatmight meet the standards required.The sample selected, however, mayhave a different mean and standarddeviation so that there would be noguarantees.
Richard [email protected]
To the EditorI saw Harband Grewal’s question
about a sample size calculation inASQ’s Statistics Division Newsletter(Spring ’98). You may have alreadygotten responses on this, but, as Iunderstand the question, he is talkingabout a “tolerance interval”.
“A tolerance interval is an intervalthat one can claim to contain at leasta specified proportion, p, of the pop-ulation with a specified degree ofconfidence, 100(1-alpha)% [see“Statistical Intervals” by G. Hahn &W. Meeker, p 34.]
Offhand I do not know how tocalculate the sample size to achieve astated tolerance interval, but if youfirst learned how to calculate theappropriate tolerance interval foryour situation, you may then be ableto work back to an appropriated “n”.Generally you would want to find apiece of software to do this type ofcalculation for you. Hope this helps.
John [email protected]
LETTERS, LETTERS, LETTERSContinued from page 6

8 ASQ STATISTICS DIVISION NEWSLETTER, VOL. 17, No. 3
OFFICERS
CHAIRDon Williams2515 Jamestown LaneDenton, TX 76201(940) [email protected]
CHAIR-ELECTRobert Mitchell22719 Ideal Avenue North Forest Lake, MN 55025(612) [email protected]
TREASURERJanice Shade7 Sylvan WayParsippany, NJ 07821(973) [email protected]
SECRETARYJacob Van Bowen223 Jepson Hall University of RichmondRichmond, VA 23173(804) [email protected]
PAST CHAIRDon [email protected]
COMMITTEE CHAIRS
BYLAWSDon Emerling
NOMINATINGDon Emerling
AUDITINGDon Williams
EXAMININGBob [email protected]
AWARDSLynne [email protected]
STRATEGIC PLANNINGRobert Mitchell
PUBLICATIONSNancy [email protected]
PROGRAM Robert Mitchell
EDUCATIONPaula [email protected]
MEMBERSHIPJ.L. [email protected]
ELECTRONIC COMMERCEopen
CERTIFICATIONNick [email protected]
STANDARDSEd [email protected]
NEWSLETTER Ralph [email protected]
OTHER ACTIVITIES
FTC ’98 PROGRAM CHAIRBob [email protected]
AQC ’99 SESSION ORG.Paula Sommer
AQC ’99 SESSION MANAGERMarilyn [email protected]
APPLIED STAT. CONF.Bert [email protected]
‘HOW TO’ EDITORWalter [email protected]
GLOSSARY EDITOROpen
AQC ’99 SHORT COURSEWilliam Wessels
FTC ’98 SHORT COURSEMary Garfield
DIVISION MARKETERCharles [email protected]
ASA Q&P LIAISONJoe [email protected]
WEB PAGE ADMIN.Mark [email protected]
HUNTER AWARD Galen [email protected]
STAT. CLEARINGHOUSEMarcey [email protected]
ASQ DIVISION LIAISONJenna Villarreal [email protected]
ASQ MILWAUKEE1-800-248-1946
ASQ STATISTICS DIVISION OFFICERS
AND COMMITTEE CHAIRS

just like the one trick pony who taps his hoof three timesto any question. At mid-afternoon, the pony astoundseveryone with his response to “What time is it?” At othertimes.....
From a statistical perspective, we can think ofStatistical Thinking and Statistical Methods as two factorsin a response surface study. As Don Emerling and LynneHare have pointed out, there’s a lot of synegism/inter-action/interdependence between the two. We have longago agreed that one-factor-at-a-time experimentation isbad practice in this type of situation, yet we find thatsome now advocate restricting Statistical Methods (hold-ing it fixed) while studying the full range of StatisticalThinking. What would R.A. Fisher say?
Remember the third principle of Statistical Thinking:“Understanding and reducing variation are keys to suc-cess”. Those who would always use the same test formany different applications, even if the test explains verylittle of the variation (has low power), are forgettingabout the need to identify and reduce variation. A ‘sim-ple’ analysis, even if ‘unbiased’, can often do an inade-quate job of explaining the variability in the data, andthus the random error term in the tests used would beneedlessly larger than it should be. For example, using asimple runs test for a time series process which has bothan autoregressive order one (with a negative parameter)component and a linear trend component will often notdetect the trend because the “noise” due to the auto-regressive component has not been identified andremoved from the ‘random’ error.
To make a sports analogy, in baseball we hear ofplayers with ‘physical skills’ and players with a ‘head forthe game’. Think of the ‘physical skills’ as Statistical Toolsand Methods, and think of the ‘head for the game’ asStatistical Thinking. In baseball, champions are playerswho have and continue to develop both the physicalskills and the head for the game.
Folks, we have a wonderful opportunity to worktogether to integrate Statistical Methods and StatisticalThinking into something we can call “Problem Solving”.First, we have to understand that the synergism betweenStatistical Thinking and Statistical Methods will make the‘bonded’ resulting product much stronger than the sepa-rate parts. But we must also understand that if we persistin tearing down one or the other of these siameseelements, we will have nothing. We cannot implementStatistical Thinking fully without a mature understandingand appreciation for Statistical Methods. We cannot fullycomprehend and use the tools of Statistical Methodsunless we have an understanding of the interconnected-ness of processes and the nature of variability whichStatistical Thinking helps develop in us. We can focus ontearing down the “other guys” or we can work togetherto build. ∆
ASQ STATISTICS DIVISION NEWSLETTER, VOL. 17, No. 3 9
EDITOR’S MESSAGEContinued from page 3
There are probably others whom I have forgotten tomention, and I apologize if your name is not listed above.Everyone I have worked with deserves my personalthanks for a job done with dedication and enthusiasm.
And finally a very special thank you to JennaVillareal from ASQ, who kept me out of trouble,answered my endless questions with a ‘smile in her voice’and helped me ‘through the maze’ of requests andrequirements of ASQ.
It’s been a great year, and really a great many years ofactive involvement in a great organization. I have neverenjoyed myself as much as when I was working with thegreat people listed above. I encourage every member ofthe Division to reach out and become involved in theactivities of the Division. You too will find it a rewardingexperience. ∆
OUTGOING CHAIR’S
MESSAGEContinued from page 4
INCOMING CHAIR’S
MESSAGEContinued from page 4
ship. If I were to name them individually, the newsletterwould need to be extended at least three or four pages.Ralph St. John, newsletter editor, would not permit me todo that. There would also be the risk that I omit somewho have made significant contributions. So I simply say“Thank you” to each of you who have in any way assistedthe furthering of the Division’s vision and mission. Pleasekeep up the good work. ∆

10 ASQ STATISTICS DIVISION NEWSLETTER, VOL. 17, No. 3
OPEN BUSINESS MEETINGSunday, May 3, 1998 8:30pm - 9:30pm
Major Agenda Items discussed were:
A. Revised Mission, Vision, Strategy, Principles werereviewed by Don Emerling.(see page 2)
B. Membership Report presented by J.L. Madrigal: Wehad 10,442 members as of 3/31/98. A March survey of 100‘Unpaid’ members revealed that the major reason formembers discontinuing was a change in job assignment.Only 4% expressed dissatisfaction with the division as areason for dropping. Section dues of $8 was given as areason by 11%.
C. Treasurer’s Report presented by Janice Shade: CurrentAssets include $78,291 in cash and $4,295 in accountsreceivable. Current Liabilities are $11,335. So our balancewas $71,247. The Ott Scholarship account has a balance of$294,351 (Note: these funds are administered by the StatDivision on behalf of the Ott Foundation, but are notavailable for other expenses.) We awarded four OttScholarships ($5,000 each) last year.
D. Information Sharing:1. ’98 FTC Short Courses. The Stat Division had hoped
to offer 4 Short Courses at the FTC, but space and plan-ning limitations only allow 2 courses.
2. Standards Committee. Ed Schilling reported that theStat Division has gained another ASQC/ANSI Standard toshepherd: Q3 “Sampling for Isolated Lots by Attributes.”The division now owns B1, B2, and B3 standards andshepherds S1, S2, Z1.4, Z1.9, and Q3.
3. Newsletter.If there is interest in a Spanish languageversion of the newsletter, Ralph St. John may work withJ.L. Madrigal’s wife (ESL instructor at BYU) to post a shorttranslation on the Web Page.
4. Section Liaisons. (J.L. Madrigal) Two RegionalCouncilor positions were recently filled (Ha Dao in Region9 and John Jennings in Region 14). Two RC positionsremain open: Regions 1 and 5. Twenty-six Section Liaisonpositions are filled (out of 259 sections).
5. Web Page. Mark Kiel gave a demo of the StatDivision web page at a technical session during the AQC.Response has been very favorable.
6. Booth Activities centered around two things:* A Jeopardy game based on Statistical Tools and
Thinking, developed by J.L. Madrigal.* A “History Board’ (developed by Bob Mitchell)
celebrated our 20th birthday. It featured previouschairs and their accomplishments.
7. The ’98 FTC will be held in Corning, NY.8. Open Positions – Open positions within the Division
will be posted in the booth.
E. 1998-1999 Officers were introduced (see article on page15): Chair - Don Williams; Chair-Elect - Bob Mitchell;Treasurer - Janice Shade; Secretary - Van Bowen; PastChair - Don Emerling.
F. Don Emerling’s last official act was to pass the gavel toDon Williams.
COUNCIL MEETINGMonday, May 4, 1998 7:00 pm - 9:00 pm
A. Revised Mission, Vision, Principles and Strategy wereapproved (see page 2).
B. Membership Report: See Business Meeting.
C. Treasurer’s Report: See Business Meeting.
D. 1998-1999 Budget:1. Forecasted income: $134,0002. Proposed expenses: $120,0003. Motion to add $10,000 for Marketing approved.4. Net Income/Loss: + $ 4,0001998-1998 Budget was approved.
E. Recognitions1. For the Fourth Straight Year the Stat Division
Achieved Level III (the top level) of the McDermondAward for section management. Past Chair Beth Propstaccepted the award on behalf of all who contributed.
2. Don Emerling recognized these contributions:Jenna Villarreal - ASQ Electronics Division AwardFrank Alt - Liaison to Deming ConferenceMel Alexander - ’97 FTC Short Course ChairSue Albin - 2 yr. FTC Program RepLarry Haugh - ’97 AQC Session ManagerBeth Propst - Past Chair
F. Information Sharing1. ASQ has developed a self-directed learning kit for
CQM and CQA certifications, and has proposed a self-directed primer for the CQE. ASQ divisions contributing tothe CQE body of knowledge are asked to support this.Nick Martino, Certification Chair, will be notified.
2. The Stat Division hoped to have 4 Short Courses forthe FTC; but, the agreement only allows 2, and facilitiesare limited. Two courses will be presented.
STATISTICS DIVISION MEETINGS AT
THE ANNUAL QUALITY CONGRESS
Philadelphia Marriott Philadelphia, PA May 2-6, 1998
Continued on page 11

ASQ STATISTICS DIVISION NEWSLETTER, VOL. 17, No. 3 11
3. Ed Schilling reported on standards the division isresponsible for (see Business Meeting). Motion made,seconded and approved: “The Statistics Division Councilaffirms the results of the working groups that theANSI/ASQC Z1.9, Z1.4, and Q3 standards be revised sub-ject to appropriate editorial revision.”
4. Information (see Business Meeting) was shared,regarding the Newsletter, Section Liaison positions, activityat our booth, and the web page.
5. Twenty-nine people attended the AQC short courseon Saturday. From all reports Tim Fuller did a fine jobteaching the “Theory of Constraints.”
STRATEGIC PLANNING MEETINGSaturday and Sunday, May 2-3, 1998
Purpose: To focus / align the efforts of our “product gen-erating” committees to deliver the maximum vision-focused value to our customers in the next year.
Current Situation: Products and services are not coordi-nated around a common theme. We find it difficult toidentify and utilize volunteers. Committees are not askedto deliver yearly products/service plans. Tactical planningteams often don’t make significant progress. We’re in theinfancy of electronic communications. We don’t hold non-performers accountable. Printing and mailing theNewsletter accounts for 65-70% of our budget. None ofour products, except the Newsletter, reach a large % ofcustomers. Low incentive to create new products. QIC-stocked products generate income. Opportunities toget members involved and be empowered. Net loss(turnover) of 500 members per year. Poor information onwhat we sell, how much, and to whom. Lack of measure-ment systems. Starting to address marketing issues. Wehave clear direction (surveys) from new members on whatthey expect: more local short courses, mini papers, casestudies.
Desired Future State: Statistical Thinking Everywhere.New products/services that are natural progression of aclear master plan. Growing customer base gives highestmarks for our products. Our product/service delivery sys-tem is a model for others. Our products/services generateworking capital. Members use more than one of our prod-ucts/services. We sponsor R&D and fund new applica-tions. Extensive portfolio of products and services. Have agood information database/system that is actively used.Identified partners. Clearly stated goals, objectives, time-lines for each tactical plan. Networked subject matterexperts to implement plans.
Presentation from Renee Janscha from ASQ’s QICGroup: QIC wants “Information Packets” on given sub-jects, similar to current Six Sigma and ISO-9000 . The StatDivision could package materials on Statistical Thinkinginto such a package. QIC wants suggestions from ourDivision for referral of Statistics-related questions: guid-ance on subject matter experts; Stat Division targetedresponse times; media preference (phone calls, email); etc.
Review Previous Long Range Tactical Plans:1. Design & Deliver Selected Useable Products.
* Put old Newsletter articles on the web.* Develop a Clearinghouse of statistical stuff.* Identify and start no more than 3 new publications.
2. Demonstrate the Broad Effectiveness of StatisticalThinking.* Beef up Short Courses (more variety, venues).* Collect more Statistical Thinking case studies.
3. Integrate Statistical Thinking into Education.* Pilot the Dallas, TX, area “Pegasus” project.
4. Develop a Vibrant Information & CommunicationSystem.
5. Develop a Division marketing process.6. Develop a member nurturing process (retention).
1998 Objective: To focus and align our product-generat-ing committees to deliver the maximum vision-focusedvalue to our customers in the next year; to design anddeliver one new product this year.
Key Elements for our 1998 Objective:Develop/implement specific web-delivered products.Develop a metric system to evaluate effectiveness.Develop a network of experts to deliver our products.Develop a customer information system/database.Develop a strategic partnership with QIC.Develop a marketing plan for our products.Collect additional Statistical Thinking case studies.Implement Section Liaison strategy to deliver products.Design and Deliver selected new products.
Specify success criteria for each key element.Identify barriers to implementation of each.
Summary: We will design and develop selected/focusednew products which are consistent with our Mission andVision. We will define success criteria for these initiativesand we will develop a measurement system to deter-mine if these criteria are being met. Unsuccessfulinitiatives will be discontinued. ∆
ANNUAL QUALITY CONGRESS
Continued from page 10

12 ASQ STATISTICS DIVISION NEWSLETTER, VOL. 17, No. 3
1978 T
Douglas C.Montgomery1981 - 1982
• Membership reached2,000.
• Sponsored three ses-sions at the 1982 AnnualQuality Congress.
• Three “How To” book-lets were published.
• Division involved in theAnnual Conference onApplied Statistics andthe Fall TechnicalConference.
John S. Ramberg1983 - 1984
• Membership grew to4,668.
• Division co-sponsored aconference on theStatistical Education ofEngineers.
• Participated in educationprograms with theMinnesota and Akron-Canton sections.
• Continued to participatein the Fall TechnicalConference.
William B. Mead1984 - 1985
• Membership increased to5,700.
• First Speakers Listdeveloped.
• Volumes 8 and 9 of the“How To” series werepublished.
• Adopted the CentralComposite Design as thedivision logo.
Ron Askin1987 - 198
• Became the largesion in ASQ with10,000 members.
• First year that thehad the lead roleFall TechnicalConference.
• Assisted with theConference on StEngineering Educ
I believimportaDivisiofirst visanonymciently taking verses:’Twas a
greatFlorid
Sure, wand mhad o
We’d aswith sensib
To give dreamyoun
Thoughsubmchaired,
And wefun obest t
In wordintentomer
We drathoughomedeeds
Edward F. Mykytka1986 - 1987
• First major strategicplanning exercise, whichclearly defined theDivision’s mission, short-and long-range objec-tives, products, and cus-tomers.
• The 1987 Fall TechnicalConference was dedicat-ed to his memory andthe William G. HunterAward was establishedshortly thereafter.
• The Statistician’s Role inQuality Management.
• Statistical ConsultingWorkshop.
• Using Values to Improvethe Effectiveness ofStatisticians.
• Case Studies in Qualityand Productivity.
• Division membershipexperienced rapidgrowth, surpassing10,000 by June 1987.
Otto Dykstra1980 - 1981
• Bill Hunter wasChair and I wasChair-elect in thefirst year of theStatistics Division.Bill took a one yearsabbatical from theUniversity ofWisconsin to get theStatistics Divisionrolling. As Chair myjob was to keep themomentum going,maintaining andnurturing the orga-nizational frame-work set up by Bill.The StatisticsDivision survived!
Peter J. Jacobs1985 - 1986
• Initiated the StatisticsDivision strategic planningprocess.
• Established the StatisticsDivision as a co-sponsor ofthe Fall TechnicalConference.
• Strengthened the Division’sinfrastructure (e.g., commit-tee assignments, liaisonswith other organizations,quality of newsletter…) toensure the needs of itsgrowing membership.
• Membership few at over30% from 5,700 to 7,500.
Frank B. Alt1982 - 1983
• Membership survey conduct-ed. Mini papers and uniqueimplementation of statisticalQC techniques identified asthe most desired part of theNewsletter.
• Four more “How To” book-lets were published.
• Sponsored a session at theFall Technical Conference.
William G. Hunter1979 - 1980
• Statistics Division orga-nizational meeting onNovember 1, 1979.
• Division membersbegan working on sta-tistical standards.
• Publication of a“Reference Series” ofbooklets discussed.
• First Council meetingon May 19, 1980 inAtlanta at the 34thTechnical Conference& QA Show.
• Sponsored one daycourse on “How toPerform ContinuousSampling.”

ASQ STATISTICS DIVISION NEWSLETTER, VOL. 17, No. 3 13
ME 1998
Steven P. Bailey1989 - 1990
• Signed a new five yearagreement to co-sponsorthe Fall TechnicalConference.
• Conducted a long rangeplanning meeting priorto AQC.
• Participated in aCongressional qualitystudy.
• Initiated development ofthe Statistics DivisionOperation Manual.
Roger W. Hoerl1990 - 1991
• Extended StrategicPlanning to develop divi-sion strategy, values,ground rules, and man-aging processes.
• Worked to ASQHeadquarters andAmerican SupplierInstitute (ASI) to publishclarification of ASI’sviews on statisticians.
• Continued to develop theDivision OperatingManual.
• Initiated Annual TacticalPlanning Process.
Galen Britz1993 - 1994
• Developed a 5 year planat the Long RangePlanning meeting.– Decided we want to
influence the worldrather than being influ-enced by it.
– Decided we wanted tospread the applicationof Statistical Thinkingand Techniques to allareas.
• Published a SpecialEdition Newslettersdescribing the House ofQuality Education.
• Constructed a giganticaffinity diagram in thebooth at the AQC by ask-ing our members thequestion: The StatisticsDivision wants to be themost responsive organiza-tion in the universe. Whatwould it take to make thisstatement real for you?
• The Division achievedMcDermond Level 3recognition for the firsttime.
Richard A. Lewis1994 - 1995
• Signed a new 5-year FallTechnical Conferenceagreement.
• Began implementing thelong-range plan.
• Achieved McDermondLevel 3 recognition for thesecond time.
• Revised, updated theDivision}s logo and colorscheme.
• Decided not to develop aCertified QualityStatistician exam.
Don Emerling1997 - 1998
• Long Range Planningin Baltimore.
• First 4 OttScholarships awarded,$5,000.00 each.
• Developed anOperational PlanningCalendar.
Beth Propst1996 - 1997
• Continued to imple-ment our plan tospread StatisticalThinking by publishing“How to Teach Othersto Apply StatisticalThinking” in QualityProgress.
• Established a StatisticsDivision web page. Itincluded the first mod-ules of the “StatisticalThinking VirtualAcademy.”
• Sponsored a session atthe Rocky MountainQuality Conference forthe first time.
• Achieved McDermondLevel 3 recognition.
Nancy E. Belunis1995 - 1996
• Established a BulletinBoard Editor.
• The 3rd Edition of theGlossary was published.
• The Statistical ThinkingSpecial Publicationwas issued.
• A PowerPoint presenta-tion on StatisticalThinking was devel-oped.
• The Division achievedMcDermond Level 3recognition.
Conrad Fung1991 - 1992
• White paper on SurvivalSkills for Statisticianscompleted.
• Statistics DivisionOperating Manual com-pleted.
• Statistics DivisionMembership Survey
• Upgrade the StatisticsQuestions in the CQEExam.
• Build a QFD “House ofQuality” for EducationalNeeds.
• More Proactive Role forStatistics Division inSelecting Papers for theAQC.
Joseph O. Voelkel1992 - 1993
• The Operating Manual wascreated. One of its goals, tobe a model for other organi-zations, seems to have beenfulfilled, as numerous groupshave requested copies of it.
• The first professional mem-bership survey was complet-ed, using the survey firm ofGordon Black, Inc. Theyreported that 500 out of 501of the members they contact-ed took part in the phonesurvey, a result that aston-ished them.
• The Division is asked toreview the statistics questionsof the CQE exam.
• An annual formal evaluationof the Division begins, there-by filling in the “check” partof the PDCA cycle.
• The building of the House ofEducation model begins.
• The newsletter gets a face-lift, with a more modernlook and the addition of theCCD logo.
• The update of the Glossaryof Statistical Terms begins.
most theng its
der-ng
h aher in
issionng
me upt of
ASQ’s
wereastnect-
(with theed.th
eeds.
our
14 ASQ STATISTICS DIVISION NEWSLETTER, VOL. 17, No. 3
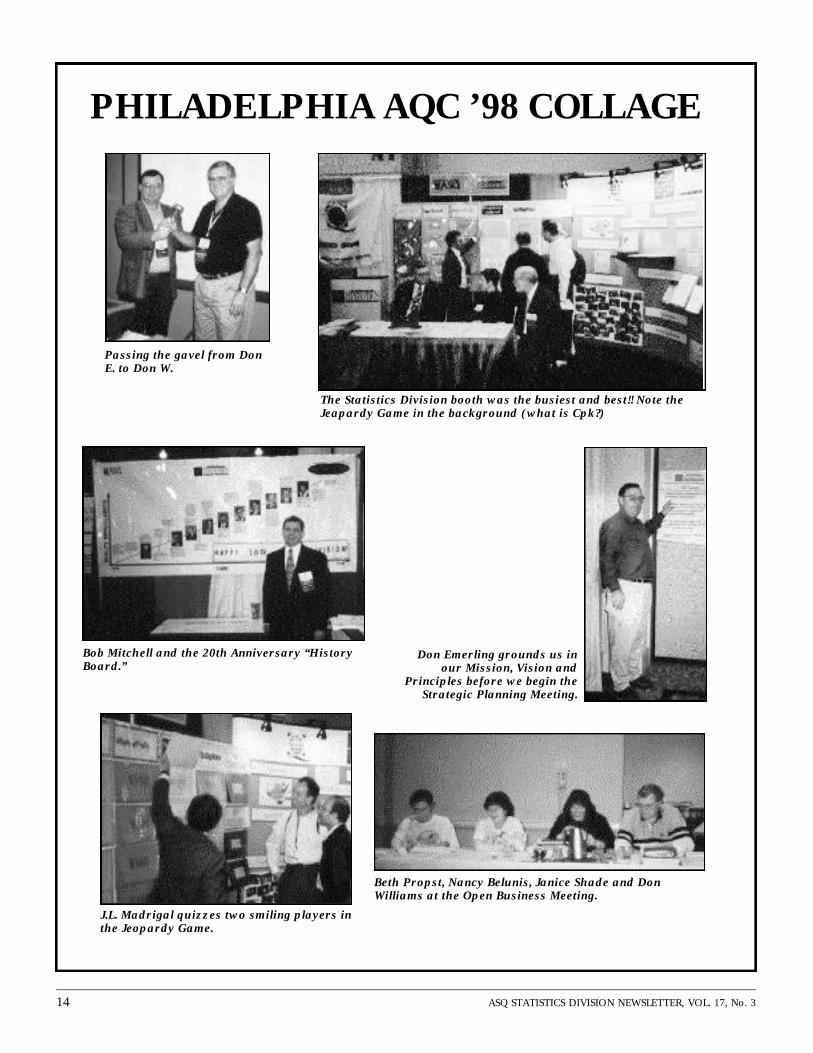
PHILADELPHIA AQC ’98 COLLAGE
Passing the gavel from DonE. to Don W.
Bob Mitchell and the 20th Anniversary “HistoryBoard.”
J.L. Madrigal quizzes two smiling players inthe Jeopardy Game.
Beth Propst, Nancy Belunis, Janice Shade and DonWilliams at the Open Business Meeting.
Don Emerling grounds us inour Mission, Vision and
Principles before we begin theStrategic Planning Meeting.
The Statistics Division booth was the busiest and best!! Note theJeapardy Game in the background (what is Cpk?)

ASQ STATISTICS DIVISION NEWSLETTER, VOL. 17, No. 3 15
NEW STAT DIVISION OFFICERSDon WilliamsChair
Don Williams isfounder, president,and senior consul-tant of Process
Improvement Consultants, a manage-ment consulting firm (located inDenton, TX) specializing in assistingclients in continuous improvement oftheir processes, products and ser-vices. He was previously a seniorconsultant with Process ManagementInternational, and prior to that a fac-ulty member at the University ofNorth Texas, where he founded andwas the director of the Center forQuality and Productivity.
Don received a Ph.D. in Mathematicsand Statistics from Oklahoma StateUniversity. He is a Senior Member ofASQ and has previously served theStatistics Division as CertificationChair and Treasurer. Don has recent-ly led the Statistics Division’sactivities aimed at working withpublic schools to introduce the prin-ciples of statistical thinking into thecurriculum.
Robert Mitchell Chair-Elect
Bob Mitchell is a 17year employee of3M Company. He iscurrently a Quality
Specialist for 3M’s Personal Care &Related Products Division, located at3M’s world headquarters in St. Paul,Minnesota. Bob has previously heldpositions in Quality Assurance, NewProduct Development, ProcessDevelopment, Supplier Management,Statistical Consulting, and TechnicalSupervision, all within 3M. Bob is
also active in his community as aquality management consultant.
Bob is a Senior Member of ASQ anda Certified Quality Engineer. Bob hasserved the Statistics Division over thelast five years, first as MembershipChair, and most recently he served atwo-year term as secretary. Duringhis term as Membership Chair heinitiated and led several tactical plansaimed at improving our service toour members, including “AssessingMembership Needs” (a detailedsurvey of members) and “ImprovingLocal Involvement” at the sectionlevel.
Bob has a B.S. in Chemistry from theUniversity of Minnesota-Morris, and isan inaugural member of 3M’sStatistical Practitioners’ Forum.
Janice Shade Treasurer
Janice Shade hasworked for Nabiscofor the past 14 years.She is currently
Manager of Continuous Improvementfor the US Foods Group inParsippany, New Jersey. Janice hasexperience in several areas ofQuality, including Vendor Quality,Specification Development,Packaging Design, Quality SystemsAnalysis and Statistical ProcessControl.
Janice has a B.S. in Biology from theCollege of New Jersey, an MBA inQuantitative Analysis from FairleighDickinson University in New Jersey,and is currently enrolled at RutgersUniversity in the M.S. in AppliedStatistics Program.
Janice is a Senior Member of ASQ.She has previously served theStatistics Division as NewsletterEditor, as one of the authors of theSpecial Publication on StatisticalThinking, and most recently she com-pleted the first year of her two-yearterm as treasurer. She is also listed inStrathmore’s “Who’s Who forBusiness Leaders”.
Jacob VanBowen, Jr. Secretary
Van is currently Chairof the Department ofMathematics and
Computer Science at the University ofRichmond, where he has been afaculty member since 1968. Inrecognition of his contributions hewas recently appointed RichardsonProfessor of Math & C.S. by theUniversity. Van has published andconsulted in the areas of appliedstatistics, quality applications, TQM,control charts, statistics and the legalprofession, and catalyzing changewith data.
Van received a B.S. in Math fromRichmond and an M.S. and Ph.D. inStatistics from V.P.I. & S.U. AtRichmond Van has taught a variety ofstatistics courses to undergraduateand graduate students, and to non-students through continuing educa-tion courses. Van’s secret passion isthat he plays tuba for a faculty jazzband that has toured the world.
Most recently Van served as programchair for the Fall TechnicalConference. He now begins a twoyear term as secretary. He is also amember of the American StatisticalAssociation.

16 ASQ STATISTICS DIVISION NEWSLETTER, VOL. 17, No. 3
DEMING CONFERENCE ON APPLIED STATISTICSDecember 7 to 11, 1998 Resorts Casino Hotel in Atlantic City, NJ
Jointly sponsored by the Biopharmaceutical Section of the American Statistical Association and the Statistics Division ofthe American Society for Quality, this conference was cofounded by Dr. W. Edwards Deming, and for the last 20 yearshas consisted of 3 days of 3-hour tutorials followed by 2 days of short courses. Separate registration is permitted for indi-vidual days or parts of the Conference.
Among the tutorial speakers this year are:Norman Draper on Regression Analysis Dennis Cook on Regression Graphics Daniel Zelterman on Coordinate Free Loglinear Models Dallas Johnson on Mixed Models Analysis of Repeated Measures Experiments Dan Carr on Graphics James Berger on Bayesian Hypothesis Testing and Model Selection.
There are also several talks by statisticians from the Pharmaceutical Industry on a variety of Biopharmaceutical issuesranging from Equivalence Trials to Pharmacoeconomic Studies.
The two short courses are: Peter Westfall and Dror Rom on Multiple Comparisons: Applications and Case Studies Richard Deveaux and Lyle Ungar on Data Mining and Knowledge Discovery: A Practical Introduction.
Both these courses have been well-received when they were presented at recent ASA Annual Meetings and bring to par-ticipants the latest developments in these exciting areas of modern, computer-intensive methods.
The variety of applied topics presented by well-known experts, moderate cost, flexibility of registration, and learning-friendly tutorial format makes this a truly outstanding conference for applied statisticians who want to stay current in theirfield. To get more info and obtain registration materials, check the conference website at: http://nimbus.temple.edu/~kghosh/deming98/ ∆
Bert GunterMerck & Company
43RD ANNUAL FALL TECHNICAL CONFERENCE
October 13-15, 1999
Applied Statistics in the 21st CenturyWyndham/Greenspoint Hotel Houston, Texas
Co-sponsored by:American Society for Quality: Chemical and Process Industry Division
Statistics DivisionAmerican Statistical Association: Section on Physical and Engineering Sciences
As the 21st century dawns what will be the role played by applied statisticians in industry and education? This year’stheme is forward looking. From today’s perspective what new and perhaps different types of problems will we be work-ing on in the future? What new methodologies will we be expected to use? How will the profession need to change toremain a value added component to corporate and academic life?
If you are interested in presenting an applied or expository paper in any of three parallel sessions (Statistics, QualityControl or Tutorial/Case Studies) contact any of the individuals listed below, preferably by e-mail, and they will send youthe instructions for authors. Work should be strongly justified by application to a problem in engineering, process/chemi-cal industry or physical sciences and it should be relevant to the theme state above. The mathematical level of the papersmay range from none to what is used in the Journal of Quality Technology or Technometrics.
Submission deadline is January 15, 1999.
Bob Brill (Stat) Malcolm Hazel (CPID) Connie Borror (SPES)[email protected] [email protected] [email protected]: 314-674-1684 phone: 609-342-6463 phone: 602-847-0840fax: 314-674-5466 fax: 609-342-4783 fax: 602-965-8692 ∆
ASQ STATISTICS DIVISION NEWSLETTER, VOL. 17, No. 3 17
In the recent Youden Address G.B Ranney1 states
One quality characteristic of statistical services might be whether the plan for a study, or the discussion offindings, or the description of how to use a method is designed to be understood by the user.
Also from Ranney’s address:
The right to be consulted is earned and re-earned, by demonstrating the capacity to be helpful.
As technical types, do we maintain an outward, customer focus in providing services? I, like most (if not all) members ofthis division, am fascinated by the mathematics associated with statistical analysis. Equations are there to ponder, reflectupon, utilize wherever I can. In engineer/scientist heaven, the streets are paved with... equations.
Funny thing is, nobody else at my company thinks this way. The people who are actuallymaking the money, the equipment operators, have a different point of view. They aren’tinterested in equations. For the most part, they’re interested in just going home. Why?One reason is I haven’t helped make their work environment pleasant. They’re interestedin having fewer angry customers, being confident in their ability to make parts correctly,having fewer hassles. Equations don’t do that for them.
In general, have we made life easier for our moneymakers?Probably not. Why? Because most engineers/scientists areuncomfortable with the 4th element of the System of
Profound Knowledge: psychology.2 People are unpredictable, unlike our equations. Weentered the hard sciences (mathematics, statistics, physics, etc.) because of their logic, theira priori predictive capability. We undervalue the soft sciences (physiology, biology,agronomy, etc.), thinking they aren’t sciences at all because of their weak forecastingcapability and unsophisticated math. We struggle with people (including ourselves)because they’re unpredictable.
In my career, I’ve spent 8 years in the quality profession and the past year in a combined organizationaldevelopment/quality assurance (OD/QA) group. I’ve learned much about what’s necessary to bring about continuousquality improvement in the last year. The head of OD/QA (a psychologist) has clearlypointed out where the breakdowns occur in our left brain improvement efforts. Wholebrain thinking is an essential foundation to catalyzing change in any organization. And weare change agents. Every analysis, experiment, audit, control chart, etc. should drivechange. Our companies don’t need us to tell them everything is okay. They need us totell them how to make things better, then to help, really help, implement and check theimprovements.
How do we overcome our personal uneasiness to dealing with human behavior? Here aresome thoughts:
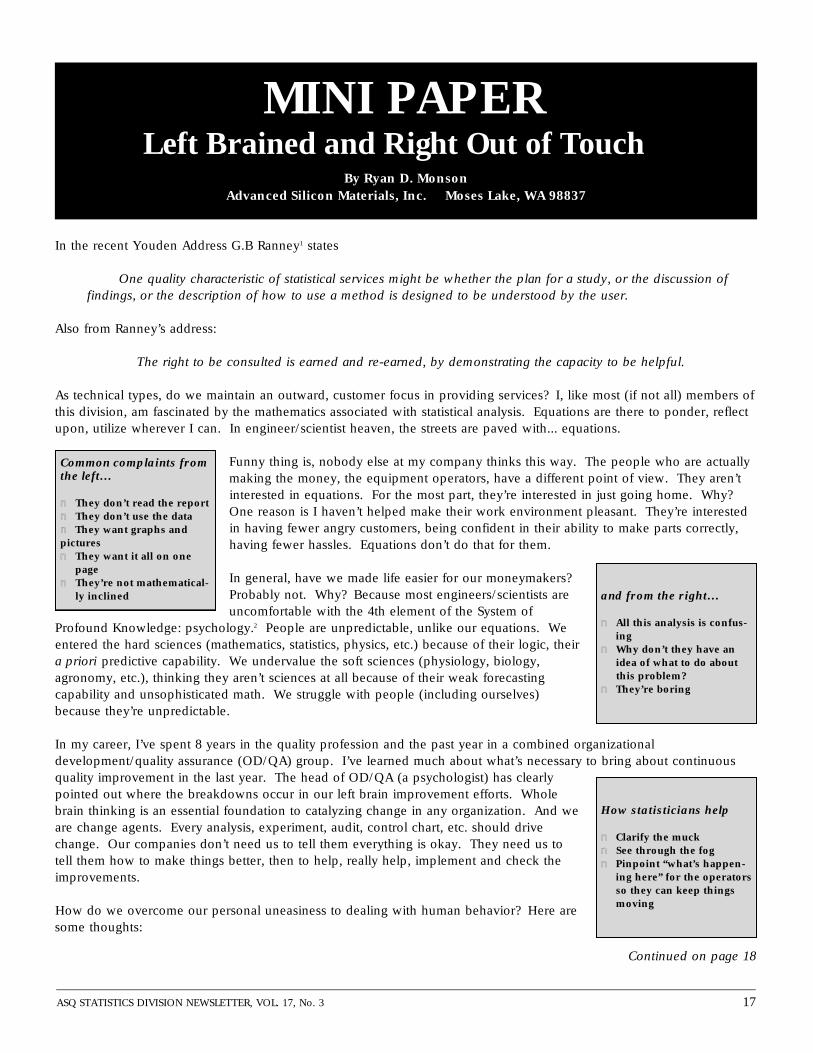
MINI PAPERLeft Brained and Right Out of Touch
By Ryan D. MonsonAdvanced Silicon Materials, Inc. Moses Lake, WA 98837
Common complaints fromthe left…
n They don’t read the reportn They don’t use the datan They want graphs andpicturesn They want it all on one
pagen They’re not mathematical-
ly inclined and from the right…
n All this analysis is confus-ing
n Why don’t they have anidea of what to do aboutthis problem?
n They’re boring
How statisticians help
n Clarify the muckn See through the fogn Pinpoint “what’s happen-
ing here” for the operatorsso they can keep thingsmoving
Continued on page 18

18 ASQ STATISTICS DIVISION NEWSLETTER, VOL. 17, No. 3
1. Read a different kind of book. Instead of investigating only technical topics, how about exploring human behavior?What about Shakespeare? The Bible? Koran? Fiction? What makes literature great is the core-to-core human conflict, thedeep exploration of the psyche. Reading generates knowledge. There’s no way to effectively address human behaviorwithout knowing something about it. And there’s no way to effectively implement our technical solutions without under-standing the causes for human behavior.
2. Observe. Have you learned to read non verbal communication? Do you look behind the verbal communication toget at the needs and concerns of others? A marriage counselor friend of mine said that within 5 minutes of conversationa therapist can know everything needed to help an individual. Are we that astute? My current boss pointed out to methe volumes of negativity I communicated nonverbally in meetings. I changed my ways, and benefited greatly from hiscandid observations. Are we doing that for our subordinates and co workers? (By the way, my negative body languagecame from knowing no one cared about the marvelous study I had completed!)
3. Listen. We have 2 ears and 1 mouth for a good reason. We need to use them in their intended proportions. Andremember, listening isn’t silence. It requires 2 way interaction, with the listener asking clarifying questions and probingfor understanding.
4. Take an anti-pride pill. In my 12 years as an engineer, a common complaint from the “laymen” is the technicaltypes won’t listen. Why don’t we listen? One root cause is probably arrogance. Arrogance is so damaging I wonder if itmerits being a scientific discipline (Arroganomics, the study of fat heads). As I reflect back on my egocentricity from thepast it makes me cringe. Do we look down on those who struggle with basic math? I sure did in my college days. Dowe dislike people, not wanting to participate in social activities with them? I sure have. Do we think fun is totally frivo-lous and has no business in the workplace? Our OD/QA department is a looney bin (shoes optional, Led Zepplin often,impromptu parties always), yet we are effective in our corporate role. To combat pride, let’s add a little humility as partof our “intrapersonal” tool box.
5. Stop believing the “facts only” lie. Our external and personal worlds have a perception that we are emotionless,exclusively objective, and only interested in the raw facts and the scientific conclusions drawn therefrom. That is nottrue. We have emotions and feelings. Let’s accept that. And let’s accept that others do also, and any decision that any-one makes has a strong emotional element. If we are going to influence decision makers, we must touch their emotions.
We technical types have a lot to offer. Engineers/scientists really benefit the world, but the world doesn’t know itbecause our PR is pretty poor. If we can develop a personal touch, coupled with our logical skills, we can be powerfulinstruments in serving others. ∆
1Ranney, G.B. “Context of Statistical Practice”, ASQ Statistics Division Newsletter, Vol. 17, No. 1.
2Britz, G., Emerling, D., Hare, L. Hoerl, R., Shade, J. “Statistical Thinking” Special Publication, ASQC Statistics Division,
Spring 1996.
MINI-PAPERContinued from page 17
ASQ STATISTICS DIVISION NEWSLETTER, VOL. 17, No. 3 19
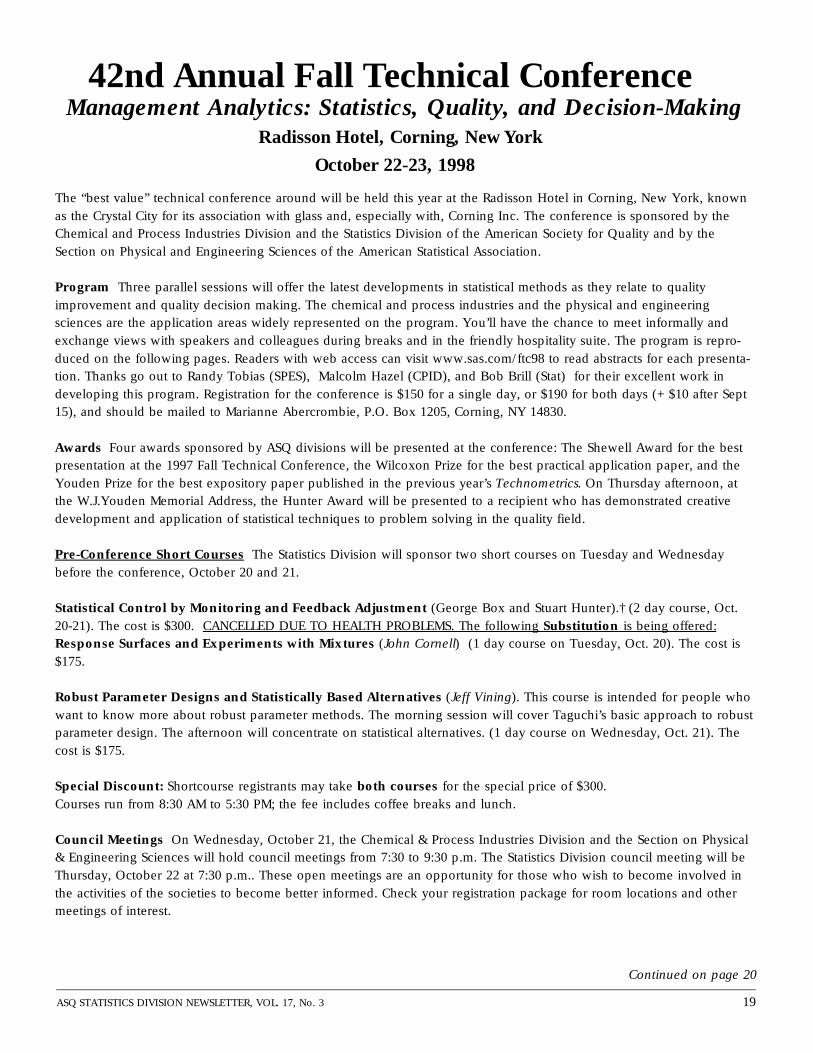
42nd Annual Fall Technical ConferenceManagement Analytics: Statistics, Quality, and Decision-Making
Radisson Hotel, Corning, New York
October 22-23, 1998
The “best value” technical conference around will be held this year at the Radisson Hotel in Corning, New York, knownas the Crystal City for its association with glass and, especially with, Corning Inc. The conference is sponsored by theChemical and Process Industries Division and the Statistics Division of the American Society for Quality and by theSection on Physical and Engineering Sciences of the American Statistical Association.
Program Three parallel sessions will offer the latest developments in statistical methods as they relate to qualityimprovement and quality decision making. The chemical and process industries and the physical and engineeringsciences are the application areas widely represented on the program. You’ll have the chance to meet informally andexchange views with speakers and colleagues during breaks and in the friendly hospitality suite. The program is repro-duced on the following pages. Readers with web access can visit www.sas.com/ftc98 to read abstracts for each presenta-tion. Thanks go out to Randy Tobias (SPES), Malcolm Hazel (CPID), and Bob Brill (Stat) for their excellent work indeveloping this program. Registration for the conference is $150 for a single day, or $190 for both days (+ $10 after Sept15), and should be mailed to Marianne Abercrombie, P.O. Box 1205, Corning, NY 14830.
Awards Four awards sponsored by ASQ divisions will be presented at the conference: The Shewell Award for the bestpresentation at the 1997 Fall Technical Conference, the Wilcoxon Prize for the best practical application paper, and theYouden Prize for the best expository paper published in the previous year’s Technometrics. On Thursday afternoon, atthe W.J.Youden Memorial Address, the Hunter Award will be presented to a recipient who has demonstrated creativedevelopment and application of statistical techniques to problem solving in the quality field.
Pre-Conference Short Courses The Statistics Division will sponsor two short courses on Tuesday and Wednesdaybefore the conference, October 20 and 21.
Statistical Control by Monitoring and Feedback Adjustment (George Box and Stuart Hunter).† (2 day course, Oct.20-21). The cost is $300. CANCELLED DUE TO HEALTH PROBLEMS. The following Substitution is being offered:Response Surfaces and Experiments with Mixtures (John Cornell) (1 day course on Tuesday, Oct. 20). The cost is$175.
Robust Parameter Designs and Statistically Based Alternatives (Jeff Vining). This course is intended for people whowant to know more about robust parameter methods. The morning session will cover Taguchi’s basic approach to robustparameter design. The afternoon will concentrate on statistical alternatives. (1 day course on Wednesday, Oct. 21). Thecost is $175.
Special Discount: Shortcourse registrants may take both courses for the special price of $300.Courses run from 8:30 AM to 5:30 PM; the fee includes coffee breaks and lunch.
Council Meetings On Wednesday, October 21, the Chemical & Process Industries Division and the Section on Physical& Engineering Sciences will hold council meetings from 7:30 to 9:30 p.m. The Statistics Division council meeting will beThursday, October 22 at 7:30 p.m.. These open meetings are an opportunity for those who wish to become involved inthe activities of the societies to become better informed. Check your registration package for room locations and othermeetings of interest.
Continued on page 20

20 ASQ STATISTICS DIVISION NEWSLETTER, VOL 14, NO. 4
42ND ANNUAL FALL TECHNICAL CONFERENCEContinued from page 19
Hospitality Suite The Fall Technical Conference and the officers of the sponsoring organizations host a hospitality suite.This plays a vital role in the strategic operation of the divisions. We welcome new faces and new perspectives on divi-sion operations as well as share technical insights with colleagues, in a friendly, informal atmosphere. Please come meetus in Corning!
Non-Technical Program Two wonderful days in and around the “Crystal City” have been planned.
Thursday: Board the bus at 8:30am. First stop is the Corning Glass Center including the Hot Glass Show. Then it’s on tothe Benjamin Patterson Inn where demonstrations of frontier life will highlight open hearth cooking. Following lunch atLimey’s, you will proceed to The Studio where you will create your own piece of glass art using a variety of glassworkingtechniques. Cost is $48.
Friday: You will enjoy a guided walking tour of historic Market Street, including shops with hot glass blowing demon-strations and a stop at the Rockwell Museum. Lunch is at London Underground, after which we will take a ride to one ofthe Finger Lakes and optionally tour a local winery. Cost is $50, plus $37 for the optional wine tour.
Accommodations A block of rooms has been saved at the Radisson Hotel in Corning. Conference rates are $95 plustax, single or double. These rates apply October 20-23. The room block will be held until September 28. Reservations canbe made by calling the hotel directly at (607) 962-5000. Mention the ASQ Fall Technical Conference to receive thespecial conference rate. Reservations must be guaranteed with a valid credit card, and are subject to a 48-hour cancella-tion policy. Check-in: 3:00 p.m.; check out: 1 p.m.
Travel Information By plane, the closest airport is the Elmira-Corning Airport, 12 miles from the Radisson. Take theshuttle bus: you probably won’t need a car in Corning. By car, Corning is located on Route 17. Take the exit for Route352 to Downtown Corning. The Radisson is at 125 Denison Parkway (Route 352).
1998 Fall Technical Conference Committee: Dorothy Sempolinski, General and Local Conference Chair; BrendaNiccum, Treasurer; Marianne Abercrombie, Registrar; Carolyn Clark, Jan Johnson and Dean Neubauer, Host Committee.All are employed by Corning, Inc.
ASQ - C&PID
Chair: Kymm Hockman, DuPont
Chair-Elect: Dorothy Sempolinski,
Corning
Secretary: William Cox, TQM
Consulting
Treasurer: Jim Stuart
ASQ – Stat
Chair: Don Williams, Process
Improvement Consultants
Chair-Elect: Robert Mitchell, 3M
Secretary: Jacob Van Bowen,
University of Richmond
Secretary: Janice Shade, Nabisco
ASA – SPES
Chair: John Cornell, University of
Florida
Chair-Elect: Janet Buckingham,
Southwest Research Institute
Secretary/Treasurer: Perry Haaland,
Becton Dickinson Research Center
Officers of Sponsoring Organizations

ASQ STATISTICS DIVISION NEWSLETTER, VOL. 17, No. 3 21
Registration Desk Opens
Thursday, October 22, 1998
BREAK
LUNCHEONTopic: Manufacturing Process Control & Discipline
Speaker: John Rathmail, Manager of Manufacturing Process Engineering, Corning Inc.Presiding: Kymm K. Hockman, DuPont Company, ASQ-C&PID Chair
W. J. YOUDEN ADDRESSTopic: “A Perspective on Models and the Quality Sciences: Some Challenges and Future Directions”
Speaker: Douglas C. Montgomery, Arizona State UniversityPresiding: Don Williams, Process Improvement Consullants, ASQ-STAT Chair
Thursday7:30-
Thursday8:00-9:00
Thursday10:00-10:30
Thursday10:30-12:00
Thursday12:15-1:45
Thursday2:00-3:30
Thursday4:00-5:00
1
2
3
Thursday9:15-10:00
WELCOME / PLENARY SESSIONTopic: Management Analytics: What Is This All About?
Speaker: Patrick P. Donnelly, Drexel UniversityWelcome: Dorothy Sempolinski, Corning Inc.
A. Wavelets and Statistical ProcessControl
Multiscale Statistical Process ControlUsing Wavelets
Bhavik Bakshi, Ohio State University
Moderator: TBA
A. Small Sample SPC
Small Sample Theory for ChangeDetection Using ‘Time Between’ Data
Richard E. KleinknechtWeyerhaeuser Company
Small Sample Properties of an AdaptiveFilter with Application to Low VolumeStatistical Process Control
Stephen CrowderSandia National Laboratories
Moderator:Dean Neubauer, Corning Glass Inc.
A. Multivariate Control Charts
Robust Multivariate Control Charts
Vivek Ajmani, University of Florida
Run-to-Run Batch Process MonitoringUsing Real-Time Data
Todd Nelson, 3M
Moderator: Robert Brill, Solutia, Inc.
B. Multiresponse Optimization
A Hierarchical Method forMultiresponse Experiments WhereSome Outcomes are Assessed bySensory Panel Data
Flavio S. FogliattoFederal Univ. of Rio Grande do Sul, Brazil
Moderator:Mary Ann KoskinenCampbell Soup Company
B. Special Invited Session onChemometrics
Making Money for The Dow ChemicalCompany Using Chemometrics
Mary Beth SeasholtzThe Dow Chemical Company
The Potential of the Wavelet Transformfor Data Processing in AnalyticalChemistry
Christian MitterMayrUniversity of Delaware
Moderator:Geoff Vining, Editor, JQTUniversity of Florida
B. JQT Session
What I Think Response SurfaceMethods Are All About
George Box, University of Wisconsin-Madison
Response Surface Methodology:Reflections of the Past and FutureDirections
Raymond MyersVirginia Polytechnic Ins. & State University
Moderator:Geoff Vining, Editor, JQTUniversity of Florida
C. Quality Management Case Study
Quality Management and QualityAssurance in the Manufacturing ofNuclear Fuel Elements: Trends andChallenges
Yves Grize, AICOS Technologies AG
Moderator: Heidi Servilla, Corning Inc.
C. Screening Designs
Use of Replication in AlmostUnreplicated Factorials
Kinley Larntz, University of Minnesota
Minimizing Prediction Error in ModelsFitted to Experiments with 16 FactorialPoints and 0 to 6 Center Point
Arthur Holms, Private Consultant
Moderator:Ralph St. John, Bowling Green State Univ.
C. Case Studies
Regression Control Charts Revisited:Methodology and Case Study
Bryan Olin, The Proctor and GambleCompany
Uncertainties in Quantitative Measuresof Statistical Reliability of a FatigueLoaded Component
Donald Neal, SRRC
Moderator:Athan Marion, Campbell Soup Co.

Registration Desk Opens
22 ASQ STATISTICS DIVISION NEWSLETTER, VOL. 17, No. 3
Friday, October 23, 1998
COFFEE BREAK
LUNCHEONTopic: Quality, Statisticians, and Universities
Speaker: David S. Moore, ASA President, Purdue UniversityPresiding: John Cornell, University of Florida, ASA-SPES Chair
A. Frontiers in Modelling
Joint Estimation of Location,Dispersion, and Random Effects inRobust Design
Russ Wolfinger, SAS Institute, Inc.
Latent Variable Multivariate RegressionModeling
Alison Burnham, McMaster University
Moderator: John Cornell, Univ. of Florida
A. Technometrics Session
Constructing Split Lot Designs
Robert Mee, University of Tennessee
Cost Driven Parameter Design
C.F.J. Wu, University of Michigan
Moderator:Max D. Morris, Editor Technometrics,Oak Ridge National Laboratory
A. Special Issues in DOE
Optimal Design Strategies forExperiments Involving Noise Variables
Connie Borror, Arizona State University
Designing Two-Level FactorialExperiments in Blocks When EffectsMay Change Over Time
Mary Leitnaker, University of Tennessee
Moderator: James Stuart, Eastman Kodak, Inc.
B. Quality Assessment
Computer Simulation: A Decision Toolfor Quality Planning
Soumaya Yacout, Universite de Moncton
Process Indices for Certain Non-StableProcesses
Joseph VoelkelRochester Institute of Technology
Moderator: Raymond Brown, Drexel University
B. Massive Data Sets
Process Partitions for MassiveDatasets
George Runger, Arizona State University
An Embarrassment of Riches: Designand Analysis of a 4000 Run Experiment
Bert Gunter, Merck and Company
Moderator: Robin Wurl, Rutgers University
B. Reliability
Analysis of Product Repair Data
Wayne Nelson, Consultant
Statistical Tolerance Analysis withTime Effects
Nicholas Zaino, Reliability Consultant
Moderator: John Heitmann, Corning Inc.
C. CUSUM Control Charts
Using CUSUM Charts to Identify theStart of a Problem
Wayne TaylorBaxter Healthcare Corporation
Unified CUSUM Charts for MonitoringProcess Mean and Variability UnderUnivariate and Multivariate Processes
Chandramouliswaran VenkataramaniBowling Green State University
Moderator:Michael Saccucci, BBN Software, Inc.
C. Extensions to Control Charts
The Box-Chart: A New Variable ControlChart for Univariate and MultivariateProcesses
Arthur YehBowling Green State University
Control Limits for CV Control ChartsVia Simulation
Joseph Conklin, General Motors
Moderator: Jonathan Burton, Drexel University
C. Special Issues in SPC
Monitoring Processes with CensoredData
Stefan Steiner, University of Waterloo
Some Guidelines for the Application ofAdaptive Control Charting Schemes
Lora Zimmer, Arizona State University
Moderator: Jay S. Kim, Loma Linda University
Friday8:00
Friday8:30-10:00
1
Friday10:00-10:30
Friday10:30-12:00
2
Friday12:15-1:45
Friday2:00-3:30
3

ASQ STATISTICS DIVISION NEWSLETTER, VOL. 17, No. 3 23
STATISTICAL CLEARINGHOUSE UPDATEMarcey Abate & Jim Lenhart
Current Features of Statistical Clearinghouse
• Publications area includes descriptions and links tohelpful statistical journals, electronic texts, books, HowTo series, book reviews.
• Events area includes links to statistical and qualityrelated conferences, seminars, and courses.
• Software area includes descriptions and links tostatistical software, recently published reviews.
• Definitions area includes links to electronic statisticalglossaries.
• Links area includes links to other helpful statisticalsites.
• Dynamic “trivia and statistical facts” (e.g. famouspeople in statistics) area to encourage repeat visits.
• Dynamic “important events and news” area to keepvisitors informed of current and special events in thestatistical community.
• “Coming soon” area to encourage repeat visits.
• “Black & White” color scheme to allow for quickloading of pages.
Tasks Completed
• Design and programming of homepage and navigationscheme.
• Identified links to include in publications, events, soft-ware, definitions, and links areas.
• Designed format for on-line book and softwarereviews.
Tasks in Progress
• Collecting book reviews.
• Programming to include links for publications, events,software, definitions, and links areas.
• Programming for on-line book reviews.
• Collecting FAQs.
Future Tasks
• Programming to allow on-line book and softwarereviews.
• Collect and include software reviews.
• Compiling and posting answers to FAQs.
Ongoing/Maintenance Tasks
• Update “trivia and statistical facts” on a quarterly basis.
• Update “important events and news” and “comingsoon” areas on an as-needed basis.
• Update various links on an as-needed basis.
• Update FAQs on an as-needed basis. ∆

24 ASQ STATISTICS DIVISION NEWSLETTER, VOL. 17, No. 3
The ASQ Statistics Division Newsletterispublished quarterly by the StatisticsDivision of the American Society forQuality.
All communications regarding this pub-lication, EXCLUDING CHANGE OFADDRESS, should be addressed to:
Ralph St. John, EditorASQ Statistics Division NewsletterDept. of Applied Statistics & O.R.Bowling Green State UniversityBowling Green, OH 43403-0267Phone: (419) 372-8098Fax: (419) 372-2875Email: [email protected]
Other communications relating to theStatistics Division of ASQ should beaddressed to:
Don Williams2515 Jamestown LaneDenton, TX 76201(940) [email protected]
Communications regarding change ofaddress should be sent to ASQ at:
American Society for QualityP.O. Box 3005Milwaukee, WI 53201-3005
This will change the address for allpublications you receive from ASQincluding the newsletter. You can alsohandle this by phone (414) 272-8575 or(800) 248-1946.
Printed on Recycled Paper
STATISTICS DIVISIONAMERICAN SOCIETY FORQUALITYc/o Ralph St. JohnDept. of A.S.O.R.B.G.S.U.Bowling Green, OH 43403-0267
Non-Profit Org.U.S. Postage
PAIDCedarburg, WIPermit No. 199
UPCOMING NEWSLETTER
DEADLINES
Issue Vol. No. Due Date
Winter ’99 18 1 Dec. 15, 1998
Spring ’99 18 2 Mar. 15, 1999
42nd Annual Fall Technical ConferenceManagement Analytics: Statistics, Quality,
and Decision MakingRadisson Hotel, Corning, New York
October 22-23, 1998

![1 OUTGOING CHAIR’S REPORT 2 CEO & CHAIR’S REPORT 3 WHAT … · I thought [my doula’s] name was Adoula! And then she came over and she sat down and we went through making a birth](https://img.dokumen.tips/doc/110x75/5f08bf3a7e708231d4238612/1-outgoing-chairas-report-2-ceo-chairas-report-3-what-i-thought-my-doulaas.jpg)